Article

Predicting Depressive Relapse in Patients with Major Depressive Disorder Using AI from Smartphone Behavioral Data


1
Universal Health, co11ab Novena, LKC School of Medicine, Clinical Sciences Building, 11 Mandalay Road, #16-01, Singapore 308232, Singapore
2
Institute for Infocomm Research (I2R), Agency for Science, Technology and Research (A*STAR), 1 Fusionopolis Way, #21-01 Connexis (South Tower), Singapore 138632, Singapore
3
Institute of Mental Health, 10 Buangkok View, Buangkok Green Medical Park, Singapore 539747, Singapore
4
College of Computing and Data Science, Nanyang Technological University, 50 Nanyang Ave, 32 Block N4 02a, Singapore 639798, Singapore
*
Author to whom correspondence should be addressed.
Appl. Sci. 2026, 16(7), 3582; https://doi.org/10.3390/app16073582
Submission received: 13 February 2026 / Revised: 30 March 2026 / Accepted: 3 April 2026 / Published: 7 April 2026

Abstract

Major depressive disorder (MDD) is a prevalent mental health condition that inflicts a high burden on individuals and healthcare systems. There is a clinical need to detect MDD relapse practically and effectively to improve treatment outcomes for patients. To address this, we developed a smart monitoring system using an Artificial Intelligence (AI) approach to estimate MDD severity and relapse risk from patients’ smartphone behavioral data (i.e., digital phenotyping). Thirty-five MDD patients were recruited from the Institute of Mental Health in Singapore, who installed the smartphone study app Sallie. Their symptoms were quantified using the Hamilton Depression Rating Scale (HAMD-17) at the start of the trial, and every 30 days after over 3 months. The app collected behavioral data such as activity, activity type, and GPS location used to train AI models such as logistic regression, decision trees, and random forest classifiers. We found that passive data collection continued for most participants (up to 79% retention rate) after 3 months. We also used five-fold cross-validation to predict HAMD-17 severity ranging from two to four classes and the relapse status, achieving 91%, 88%, and 78% accuracies for two to four classes, respectively, and a relapse prediction accuracy of 86% whereby four patients relapsed during the study. Additionally, anxiety factors within the HAMD-17 were significantly predicted (Pearson correlation coefficient = 0.78, p = 1.67 × 10⁻¹⁴). These results demonstrate the promise of using smartphone behavioral data to estimate depressive symptoms and identify early indicators of relapse.

1. Introduction

1.1. Major Depressive Disorder, Relapse, and Recurrence

Annually, 444 million people worldwide suffer from mental health disorders, costing them 155 million disability-adjusted life years (DALYs) [1]. According to a study conducted by the Institute of Mental Health (IMH) in Singapore, Major Depressive Disorder (MDD) and Generalized Anxiety Disorders (GAD) are the most common mental illnesses in Singapore with 11.2% of the adult population in Singapore suffering at some time in their lifetime [2].
In the case of major depression, individuals tend to experience regular incidences of early relapse and recurrence [3]. For MDD, relapse refers to a return to full depressive symptoms before a full recovery has been achieved. In contrast, recurrence refers to the emergence of a new depressive episode after a full recovery [4]. On average, individuals with a history of depression will have five to nine separate depressive episodes in their lifetime [5,6].
MDD relapse and recurrence cannot be reliably predicted, and extant methods of identifying them are mostly manual and retrospective [7]. Mental health professionals typically rely on clinical interviews and self-report measures to assess a patient’s mood and mental state during routine appointments. These assessments are often conducted at scheduled intervals, which may not capture subtle changes in mood or behavior that could indicate an impending relapse outside the clinic. Many relapse events are identified after they have already occurred, at a point when patients experience a significant deterioration in their mental health [8]. Contemporary methods heavily rely on the subjective judgment of healthcare providers and patients, which can introduce variability and may not always detect early warning signs accurately [9]. In addition, there are often discrepancies between subjective and objective measures of neuropsychological function [10].
MDD relapses impose high costs on patients and their healthcare systems. A study published in Journal of Medical Economics reveals that the 12-month direct mental healthcare costs for a patient with a prior relapse were almost two times higher than costs for patients without a relapse (USD 20,590 vs. USD 12,368) [11]. In addition, another study found that patients with relapse have significantly higher rates of hospitalization than patients without relapse [12].
Currently, the public mental healthcare system in Singapore does not use digital phenotyping models to predict treatment journeys, outcomes and any associated relapses for patients. This results in late or no intervention, emergency department presentations, and additional overheads for clinical and support staff. Thus, there is a pressing need for the IMH to implement predictive solutions that can prognose rather than diagnose depressive relapse.

1.2. Digital Phenotyping as a Way to Monitor Depressive Symptoms and Predict Relapse

Relapse in depression is common, with at least 50% of affected individuals having one or more additional episodes in their lifetime, and approximately 80% of those with a history of two episodes having another recurrence [8]. Unfortunately, relapses are often identified late, which can lead to further exacerbation of symptoms, leading to avoidable admissions [13].
If we can monitor patients to identify signs of relapse earlier, we can deliver earlier interventions that can mitigate suffering and prevent readmissions. This will also allow more efficient treatment of symptoms and improve delivery of services to those who require interventions.
Digital phenotyping, defined as the moment-by-moment quantification of human behavior and physiology using data from personal digital devices [14], is an emerging approach that offers a potential solution to these limitations [15]. The concept of a digital phenotype, which refers to the observable characteristics and traits of a person as they interact with digital devices, emerged in 2015 [16]. CrossCheck, developed in 2016, was the first system to use passive sensing data to predict mental health indicators [17]. Barnett et al. used an anomaly detection system to predict relapse in schizophrenia [18]. Since then, several studies have demonstrated associations between passive behavioral signals collected by smartphones (such as mobility patterns, sociability, sleep and phone use) and depressive symptoms [19,20,21]. This approach allows for continuous, low-burden monitoring and may detect changes earlier than traditional clinical assessments, highlighting its potential value for identifying early changes preceding relapse.
Singapore has very high rates of smartphone penetration and internet connectivity. In total, 97% of residents own smartphones and 99% of resident households connected to the internet [22]. Thus, Singapore is a good location to test and implement smartphone-based healthcare experiments. Indeed, several studies have used smartphone sensors to monitor behavioral data. Mobile sensors have been used to passively collect GPS and location data, sleep patterns, social activity and phone usage, all of which have demonstrated a strong association with depressive symptoms [23,24,25,26]. Before deploying this approach in a clinical setting, we needed to test our model accuracy, and its ecological validity. The main objectives of this study were as follows:
  • Investigate the feasibility of using mobile smart phone applications to actively and passively to collect behavioral data;
  • Identify associations in behavioral data with clinical symptoms and relapse in depression;
  • Develop an algorithm, based on machine learning techniques, that will allow the early prediction of relapses in depression;
  • Assess the efficacy of this algorithm.

1.3. Difficulty in Developing a Solution

Current solutions that try to predict treatment outcomes are typically hardware-based (such as wearables or electroencephalography (EEG)), or require users to actively input data onto their phones at periodic intervals [27,28,29].
It is not easy to collect data from the patients, because oftentimes, the conditions experienced by patients prevent them from complying with the regular input of data such as when they remove their wearables for a period of time. In addition, it has been shown in several studies that wearable device adherence is often lower than what researchers would prefer [30,31].

1.4. Roadmap for This Article

For this article, we will describe the materials and methods used in Section 2, elaborating on how this study was organized, the nature of the participants, and the methods used for data collection, analysis, and machine learning model training. Next, we will cover the results in Section 3, and describe the accuracy of the models we trained. After that, Section 4 will include a discussion on the implications of our findings, and the limitations of this study. Finally, Section 5 will include a summary of the conclusions.

2. Materials and Methods

2.1. Proposed Solution

Our primary goal was to create a smartphone-based application that was able to effectively predict depression symptoms using passive sensing in MDD patients at IMH, with HAMD-17 classifications taken as the ground truth. We also wanted to create a system that only required passive data collection to work, because clinicians have noted in the past that many patients do not want to spend additional time and effort to engage with clinical apps. Our secondary goals were to predict MDD relapses in these patients, and to quantify their anxiety levels.
While there are published works in the literature that have used digital phenotyping to predict depression, usually, they employ active data collection methods, for example integrating vocal recordings [32] or smartphone photographs taken by participants [28]. In contrast, here we describe a method that can monitor depression using passive data detection only.
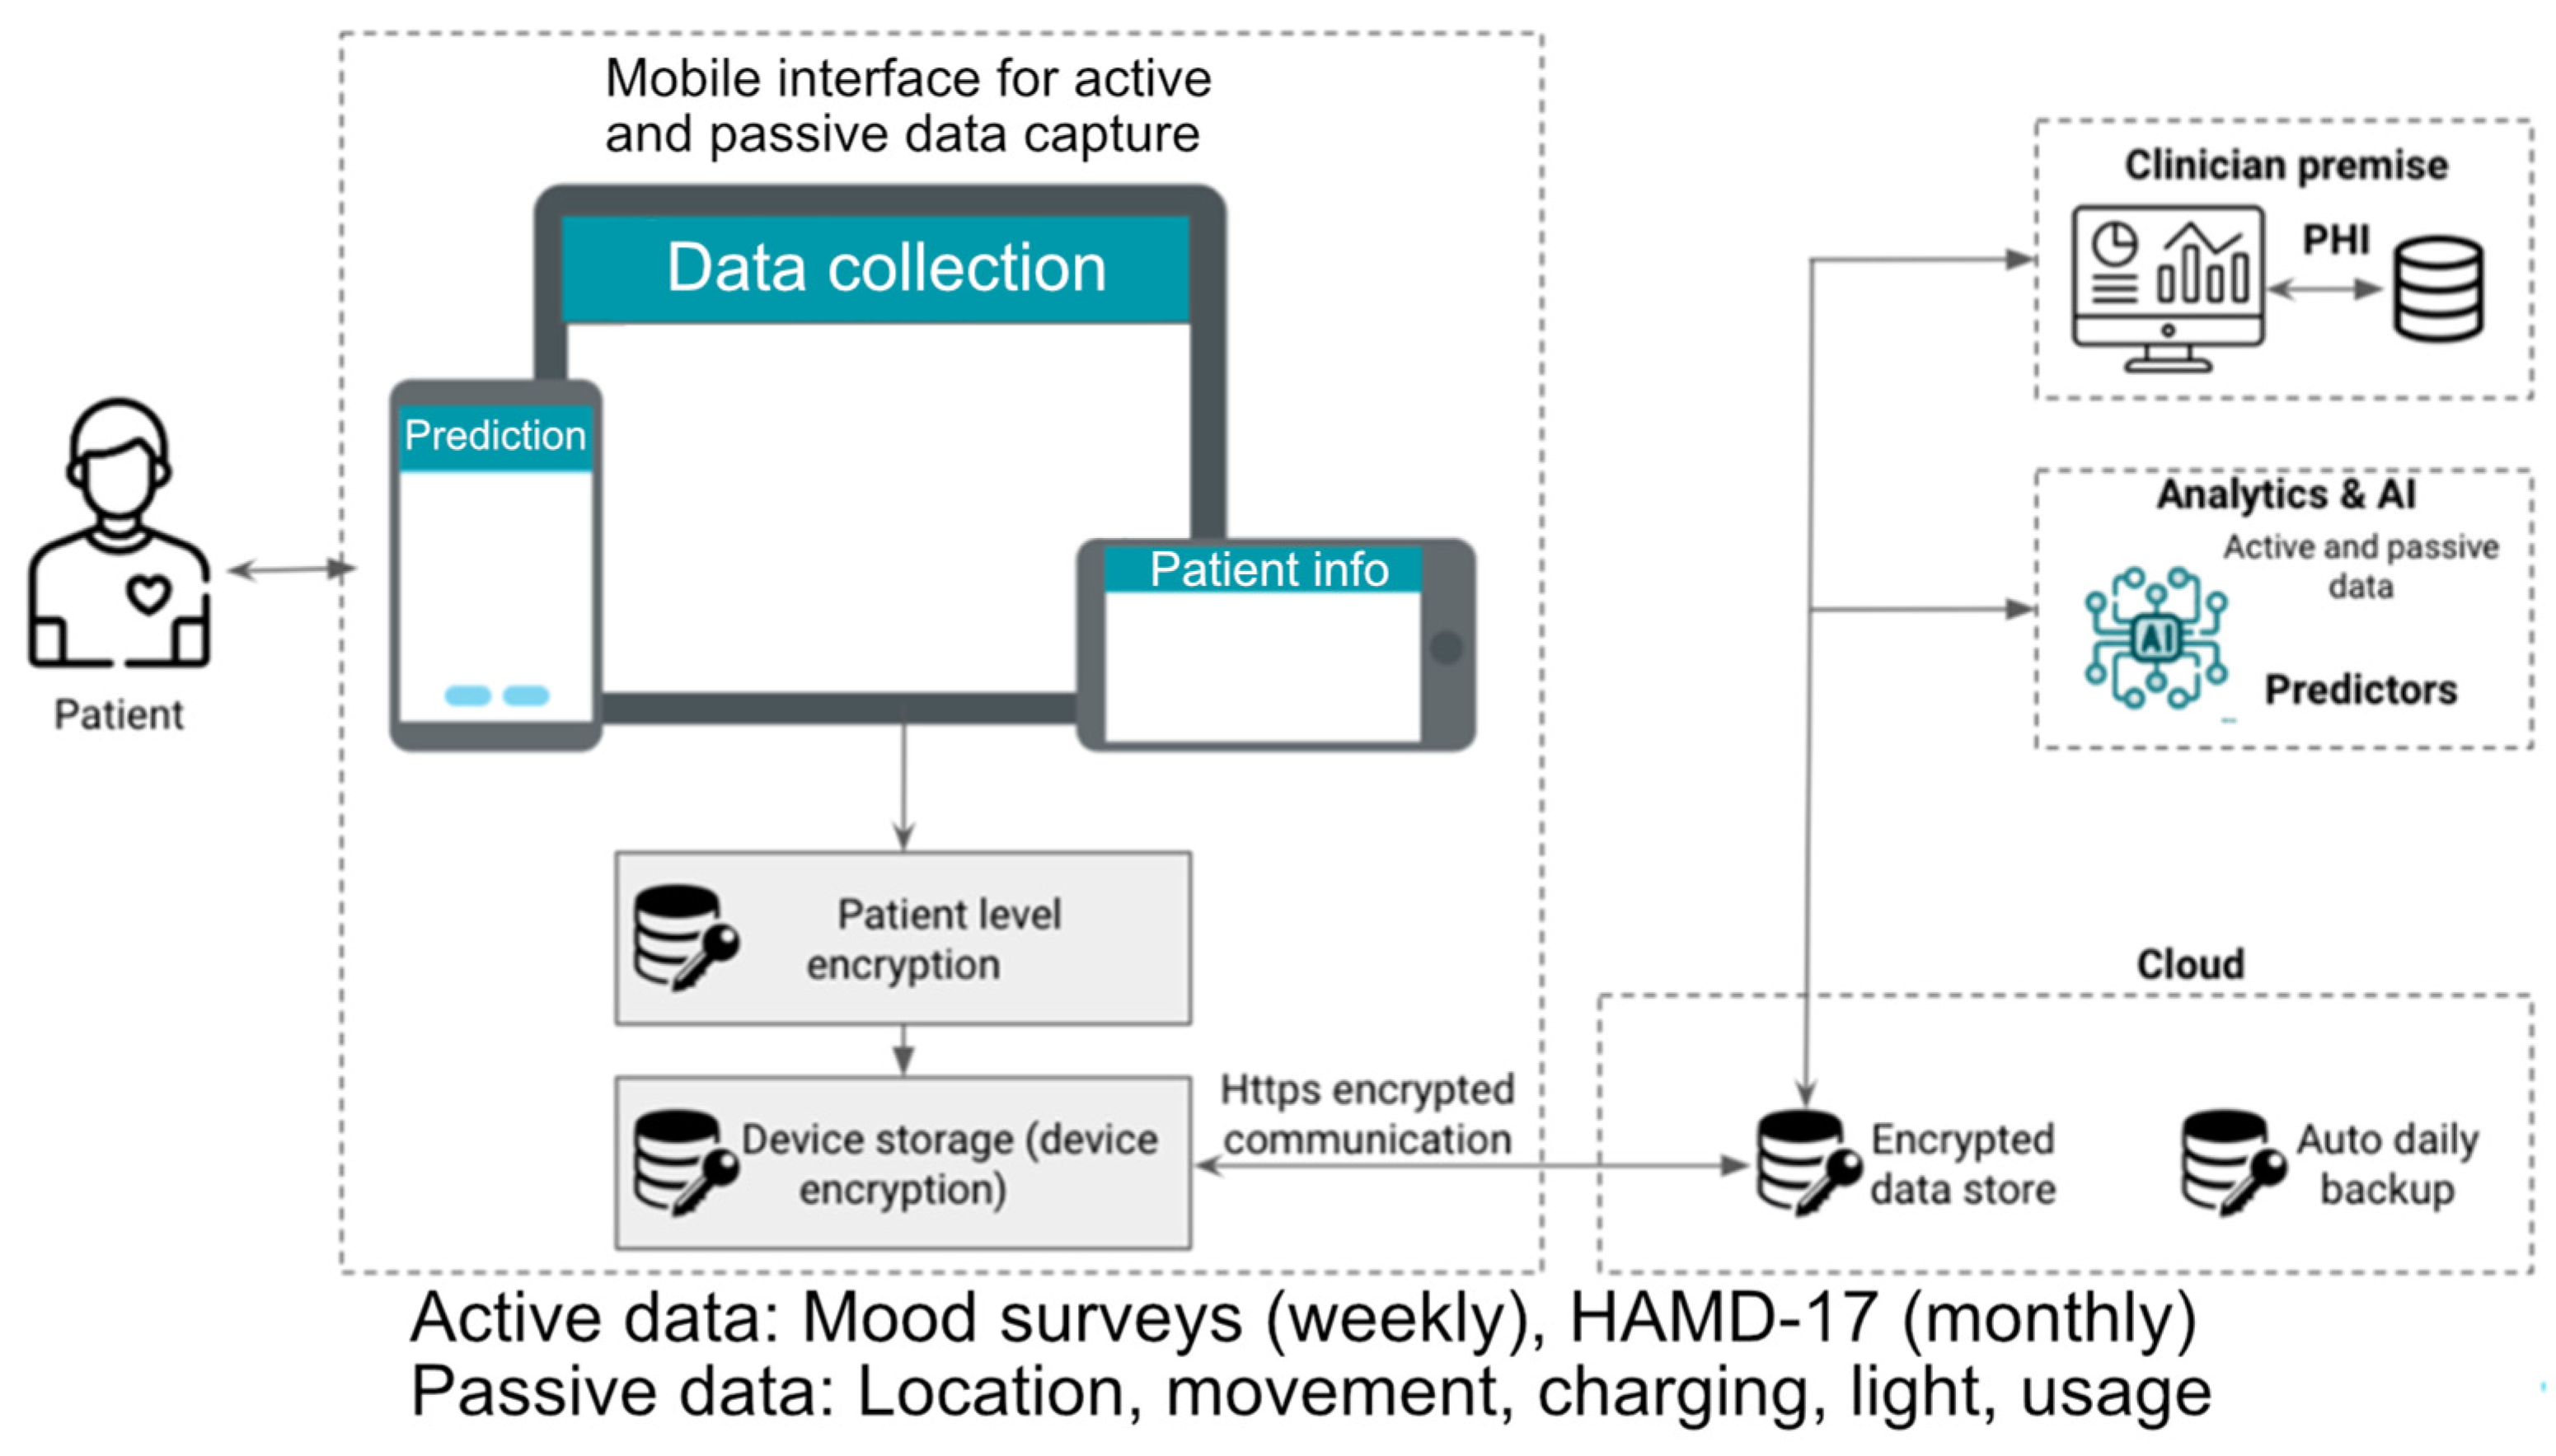
Our proposed solution, the Sallie app, works with minimal user input because it collects data passively from smartphones. Participants needed to install the app on their smartphones and keep it running for the duration of the monitoring, but other than this, no active input was required to collect data. Besides their smartphone, wearable sensors were not part of this study. Figure 1 below gives an overview of the solution for patients and clinicians.

2.2. Study Design and Plan

This 3-month observational study remotely recorded mood data from 40 adults who had been diagnosed with Major Depressive Disorder (MDD). The remote recordings were passively tracked by smartphone sensor data. Participants also had their HAMD-17 scores collected at the start of the trial, and every 30 days after that, until the 3-month period was over. The study was conducted at the mood disorder unit of Institute of Mental Health (IMH), Singapore.
Sample size calculations were determined using a power-based formula before the study commenced:
N = p 0 q 0 z 1 α / 2 + z 1 β p 1 q 1 p 0 q 0 2 ( p 1 p 0 ) 2
where:
  • p 0 = proportion (incidence) of population;
  • p 1 = proportion (incidence) of study group;
  • N = sample size for study group;
  • α = probability of type I error;
  • β = probability of type II error;
  • z = critical Z value for a given α or β .
The calculation assumed that the following:
  • p 0 = 1.2 % , the relapse rate of total Singapore population;
  • p 1 = 10 % , the relapse rate of the study population;
  • α = 0.05 ;
  • β = 0.2 .
The calculation yielded a required sample size of N = 28 . A total of 40 participants were enrolled.

2.3. Inclusion and Exclusion Criteria

Table 1 below describes the inclusion and exclusion criteria for this study. These criteria were designed to recruit suitable participants while excluding those affected by psychotic disorders. These disorders are associated with a lack of insight and low compliance rates, which may complicate interpretations of the results [33].

2.4. Withdrawal from Therapy or Assessment

Participants were informed that they were free to withdraw from the study at any time without any negative consequences to their treatment. The investigator could also withdraw participants from the study if they deemed it appropriate for safety or ethical reasons, or if they considered the study to be to be detrimental to the participant’s well-being. Participants who withdrew or were withdrawn completed a clinical review at their following visit for safety monitoring.
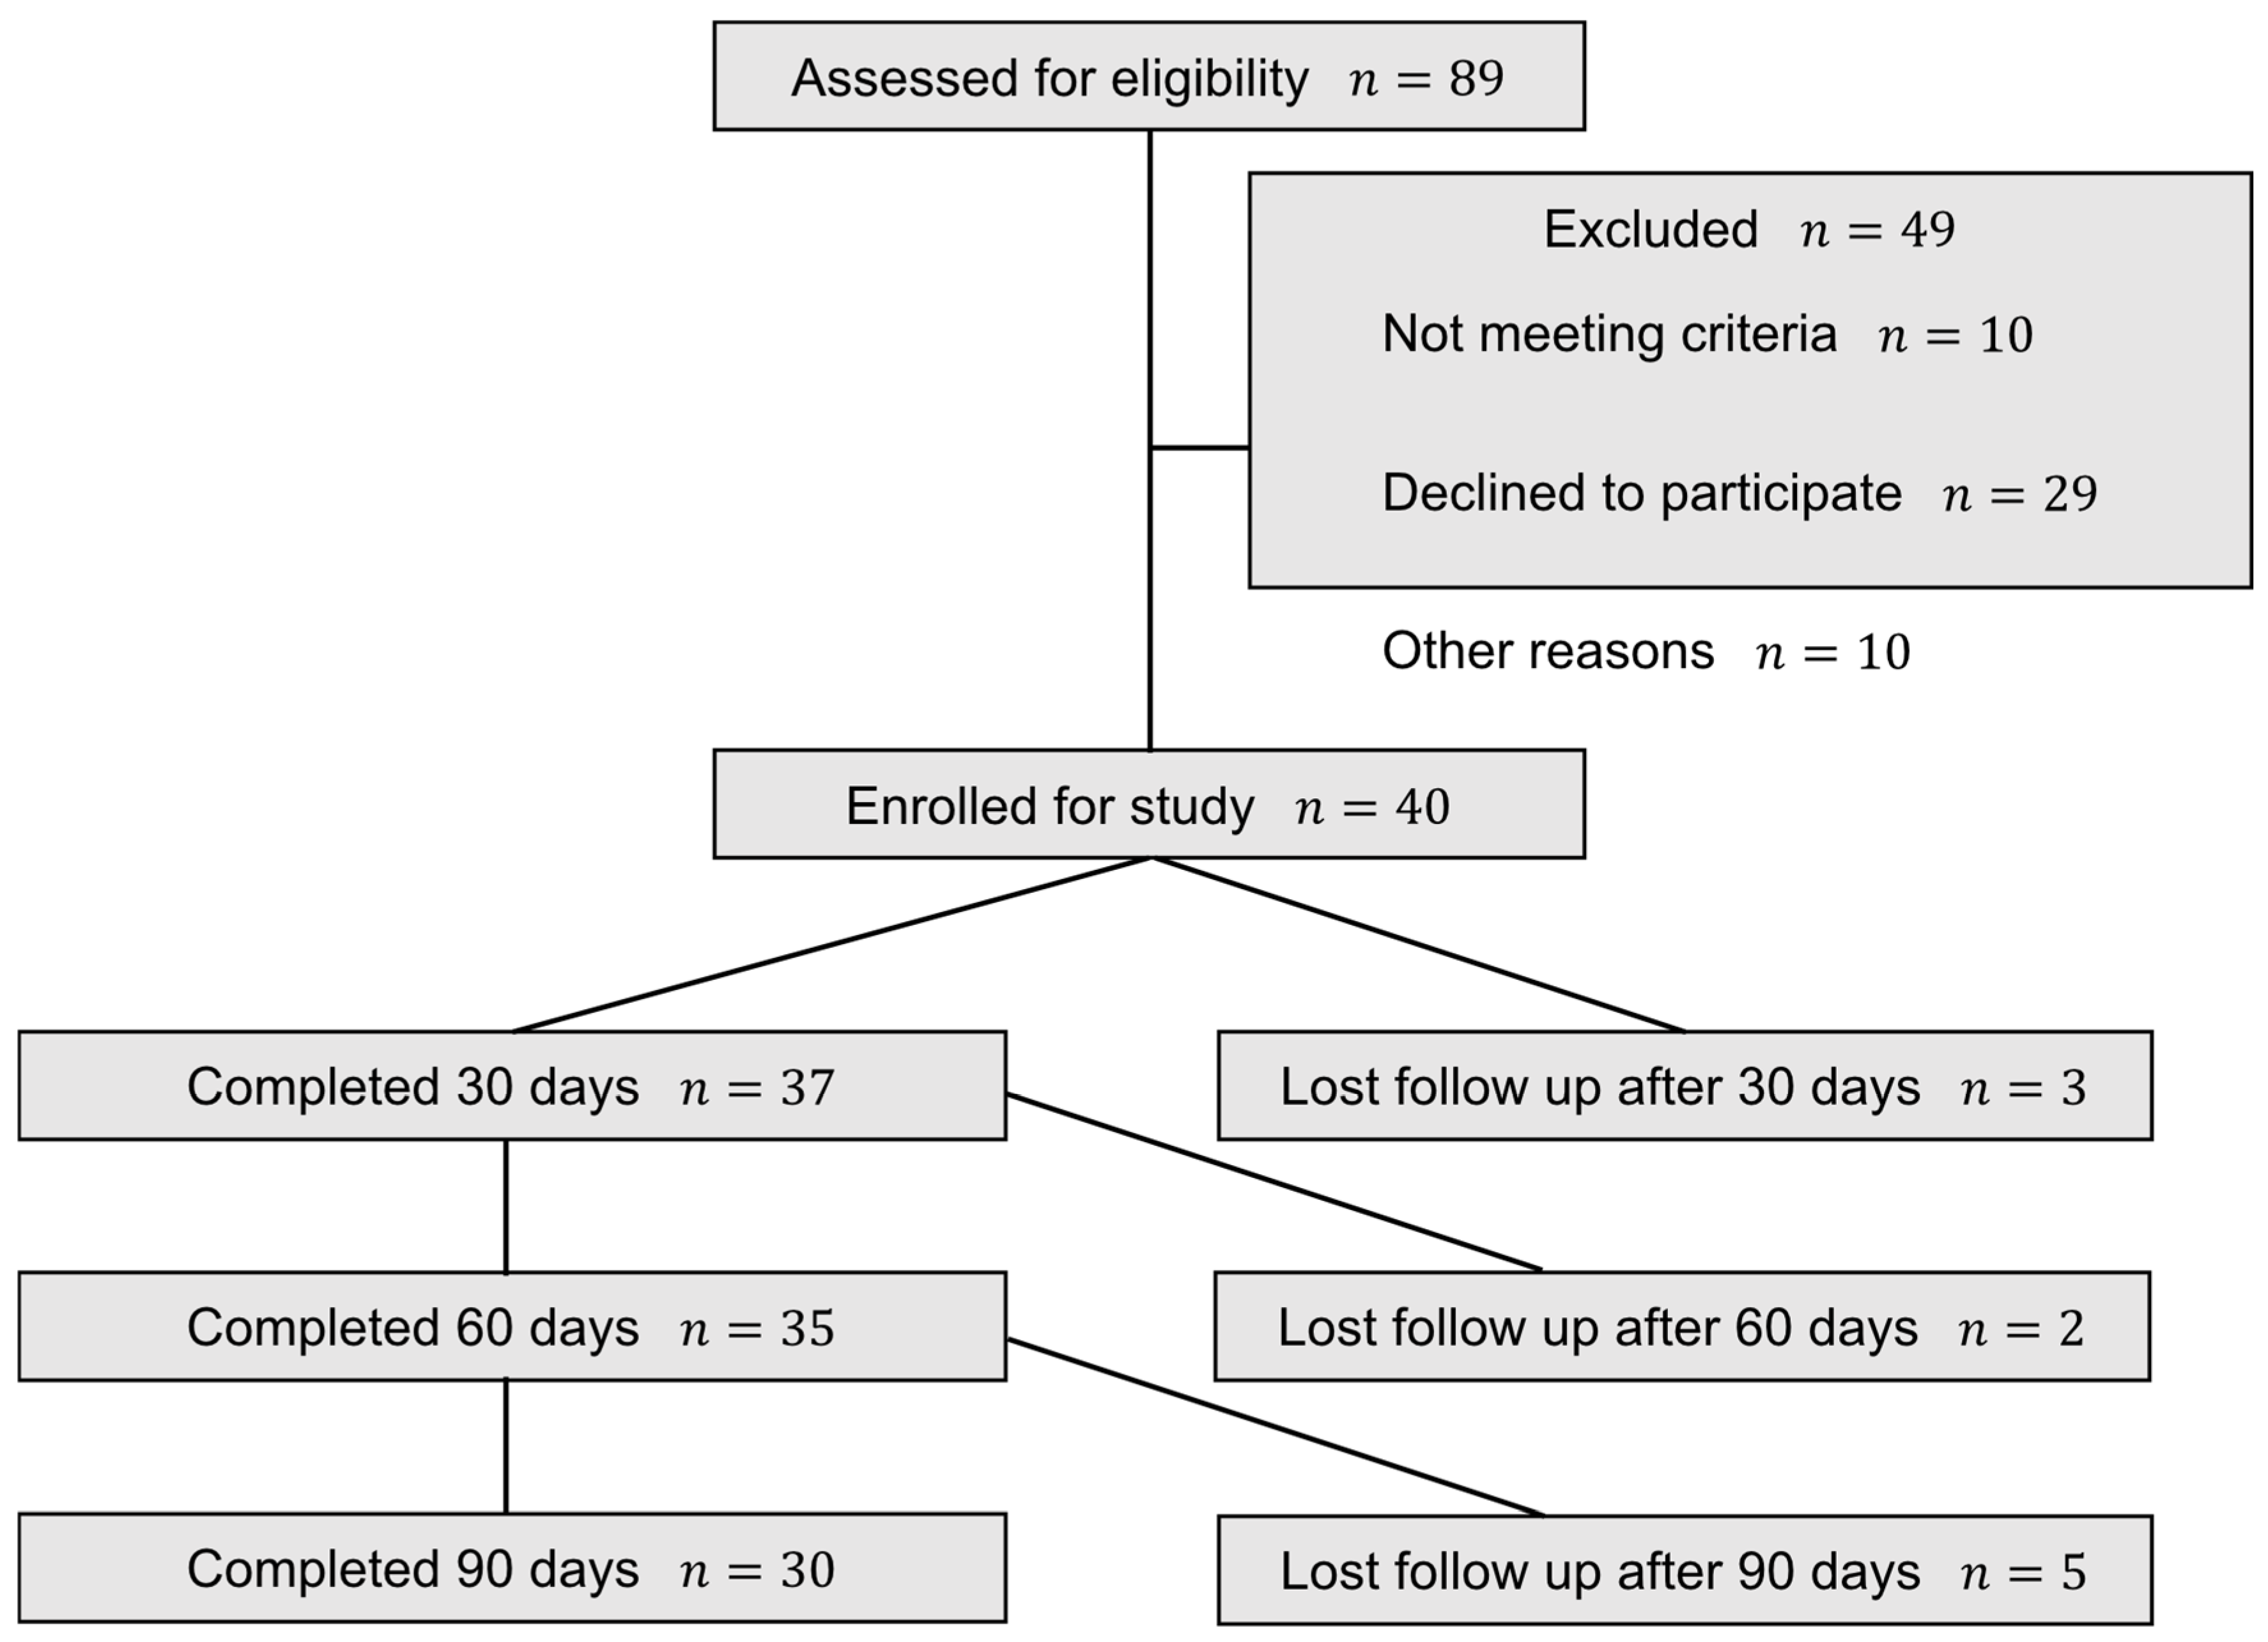
IMH fully documented any withdrawals that occurred during the study. Any withdrawal related to an adverse event (AE) or a serious adverse event (SAE) was reported to the NHG DSRB according to standard requirements. Figure 2 below shows how the disposition of the study participants, and Table 2 summarizes their demographic information.

2.5. Study Schedule

Participants received the Sallie mobile app upon prescription by their clinician. After consent-taking, participants were instructed to use Universal Health’s Sallie app and answer questions about their mood via clinical rating scales. At the end of every 30-day period, clinicians recorded the participants’ depression scores via rating scales and received feedback on the app, for a total of 3 follow-up visits over 90 days.
Research staff assisted participants with the download, installation, and configuration of the application. The Sallie mobile application was available on the Google Store and Apple App Store platforms and configured to start data collection once the application was installed. Data collection would only stop when the application was uninstalled. Participants were instructed to keep their phones with them throughout the day with sufficient battery charge over the 90 days.

2.6. Smartphone Data Collection for Digital Phenotyping

The Sallie app recorded several metrics which were later used to predict HAMD-17 scores. Participants were prompted once daily to record their mood using a single in-app question “How are you feeling today”, rated from 1 (worst possible mood) to 10 (best possible mood). This was the only active data point requiring user interaction.
For passive data collection, the Sallie app collected the following metrics on a daily basis:
  • Activity: total step count.
  • Activity type: classified as stationary, walking, running or moving in a vehicle.
  • Charging: time the phone is currently connected to a charger.
  • Device usage: amount of time the screen was locked or unlocked.
  • Ambient light: measurements from the phone’s light sensor.
  • Location: GPS-based location data.

2.7. Machine Learning Models for Predicting HAMD-17 Scores

We trained and tested machine learning (ML) models to predict HAMD-17 scores using three techniques: logistic regression, decision tree, and random forest. The models were trained on features extracted from three data modalities: activity metrics (weekly average and standard deviation of step counts), activity type features (average and standard deviation of active minutes and percentages), and location-based features (scatter patterns, cluster counts, and core location metrics). Although the app collected a brief daily mood rating, this self-reported item was not included as a predictor in the machine learning models due to low completion rates and our focus on passive sensing. All models were trained and tested on Python 3.11, using the scikit-learn library [35].
While there are other machine learning models such as deep learning (DL), we decided on these three models because our dataset was relatively small, and DL models are prone to overfitting and poor generalization in such cases [36]. Instead, we selected logistic regression since it is a simple model. The decision tree method, and its bootstrap aggregated cousin the random forest, were selected because they are robust and can work effectively when processing small datasets.

2.8. Machine Learning Hyperparameters

Logistic regression takes in linear inputs, applies a sigmoid logistic function, and outputs probability values [37]. For 2 class prediction, a threshold of 0.5 was used; if the output of the function was less than 0.5 then it is considered to be in one class, if the output greater than 0.5 then it was considered to be in the other class. When 3 or more classes are involved, a probability value was calculated for each class, and the output considered to be in the class with the highest probability value. We used the default scikit settings as hyperparameters, comprising L2 regularization, the Limited-memory Broyden–Fletcher–Goldfarb–Shanno solver, and a maximum of 100 iterations.
The decision tree algorithm starts with the entire dataset as a “root” node, and then sequentially constructs “branches” which divide the dataset based on input features, eventually leading to “leaves” which are the class label outputs [38]. For our decision tree, we used the following hyperparameters: Max_depth = 8, Min_samples_leaf = 3, Max_features = 8.
Random forest is an ensemble method that works by aggregating multiple decision trees and combining their outputs to come to a consensus [39]. We configured the Random Forest with 100 decision trees (n_estimators = 100) to balance model complexity and overfitting risk. We set the maximum tree depth to 5 (max_depth = 5) and required a minimum of 5 samples per leaf node (min_samples_leaf = 5) to limit overfitting.
For both the decision tree and random forest algorithms, we obtained the hyperparameters via grid search, since this is computationally feasible for small models such as the ones described here [40]. All models were evaluated using stratified 5-fold cross-validation to maintain class distribution across folds. Cross-validation was selected as a method of evaluating the effectiveness our models, as it is commonly used for this purpose in the field of machine learning [41,42,43].

3. Results

We analyzed the data collection completion rates, data quality, statistical correlations of passive data captured, and modeled the variables with the HAMD-17 scores and relapse scores.

3.1. Maintaining Data Collection over the Study

We recorded many types of data using the study. Table 3 below describes how much data the app was able to collect from participants over the course of the study.
In practice, complete data capture from the Sallie app was not feasible because participants did not always keep their phones on, restricted certain sensor permissions (e.g., location services) or did not complete the in-app surveys. By the third follow-up, the mood survey was only filled up for 15% of participant-days. However, the passive data metrics were still being collected at a mean rate of 68%, which is 53% higher than the active survey rate.
Engagement with the active mood survey decreased from 36% at the first follow-up to 15% at the third. Passive data collection showed a smaller reduction, decreasing from 75% to 68% in the same period. The passive light metric, collected constantly by the ambient light sensor on Android phones, was not available for Apple iPhones when the screen was locked, due to Apple policies. We therefore excluded it from subsequent analyses due to inconsistent data availability.

3.2. Predicting HAMD-17 Scores

Here, we report how we predicted HAMD-17 scores using the smartphone metrics recorded. Based on the completeness of passive data collected (see Table 3), and advice from clinicians, we focused on the “Activity”, “Activity type”, and “Location” data modalities. The active mood survey data was not included in training these models.
Three separate models were trained on individual datasets for Activity, Activity Type, Location. Another model was trained on combined data using all modalities.
For every dataset, we trained machine learning models to predict three types of output classes. The models were trained to produce either two-class, three-class, or four-class outputs. The class definitions are stated below in Table 4.
While training the models, we used five-fold cross-validation to validate the results. We decided to use accuracy as a metric to evaluate the effectiveness of our models, since this is a commonly used metric in machine learning studies [44]. The results of average classification accuracy across five folds for HAMD-17-based depression classification are summarized in Table 5 below. We have also included bootstrapped 95% confidence intervals and macro F1 scores.
We found that all the models predicted HAMD-17 classes better than chance level. Nonetheless, out of the three ML models we used, we found that the random forest algorithm consistently performed as well as, or better than, the logistic regression and decision tree approaches. Accuracy was lower as the number of classes increased; this is to be expected as changing the number of output classes trades off accuracy for granularity. Also, we found that combined models (using all of activity, activity type, and location features) performed better than models which only included one of these features, validating our approach of combining multiple modalities when training predictive models. Macro F1 scores follow the same pattern; the scores were higher when predicting a smaller number of classes, when combining all 3 input features, and when using random forest method.

3.3. Predicting Depression Relapse

During the study, four patients relapsed and were admitted to hospital. We used the passive data we collected to train models to predict these relapsed patients as well. Table 6 below shows the accuracy of these models.
Once more, we found that the random forest algorithm had greater predictive value than the logistic regression and decision tree models, and that using models that combined all the features produced more accurate results than models that used one type of feature alone.

3.4. Predicting Anxiety Scores

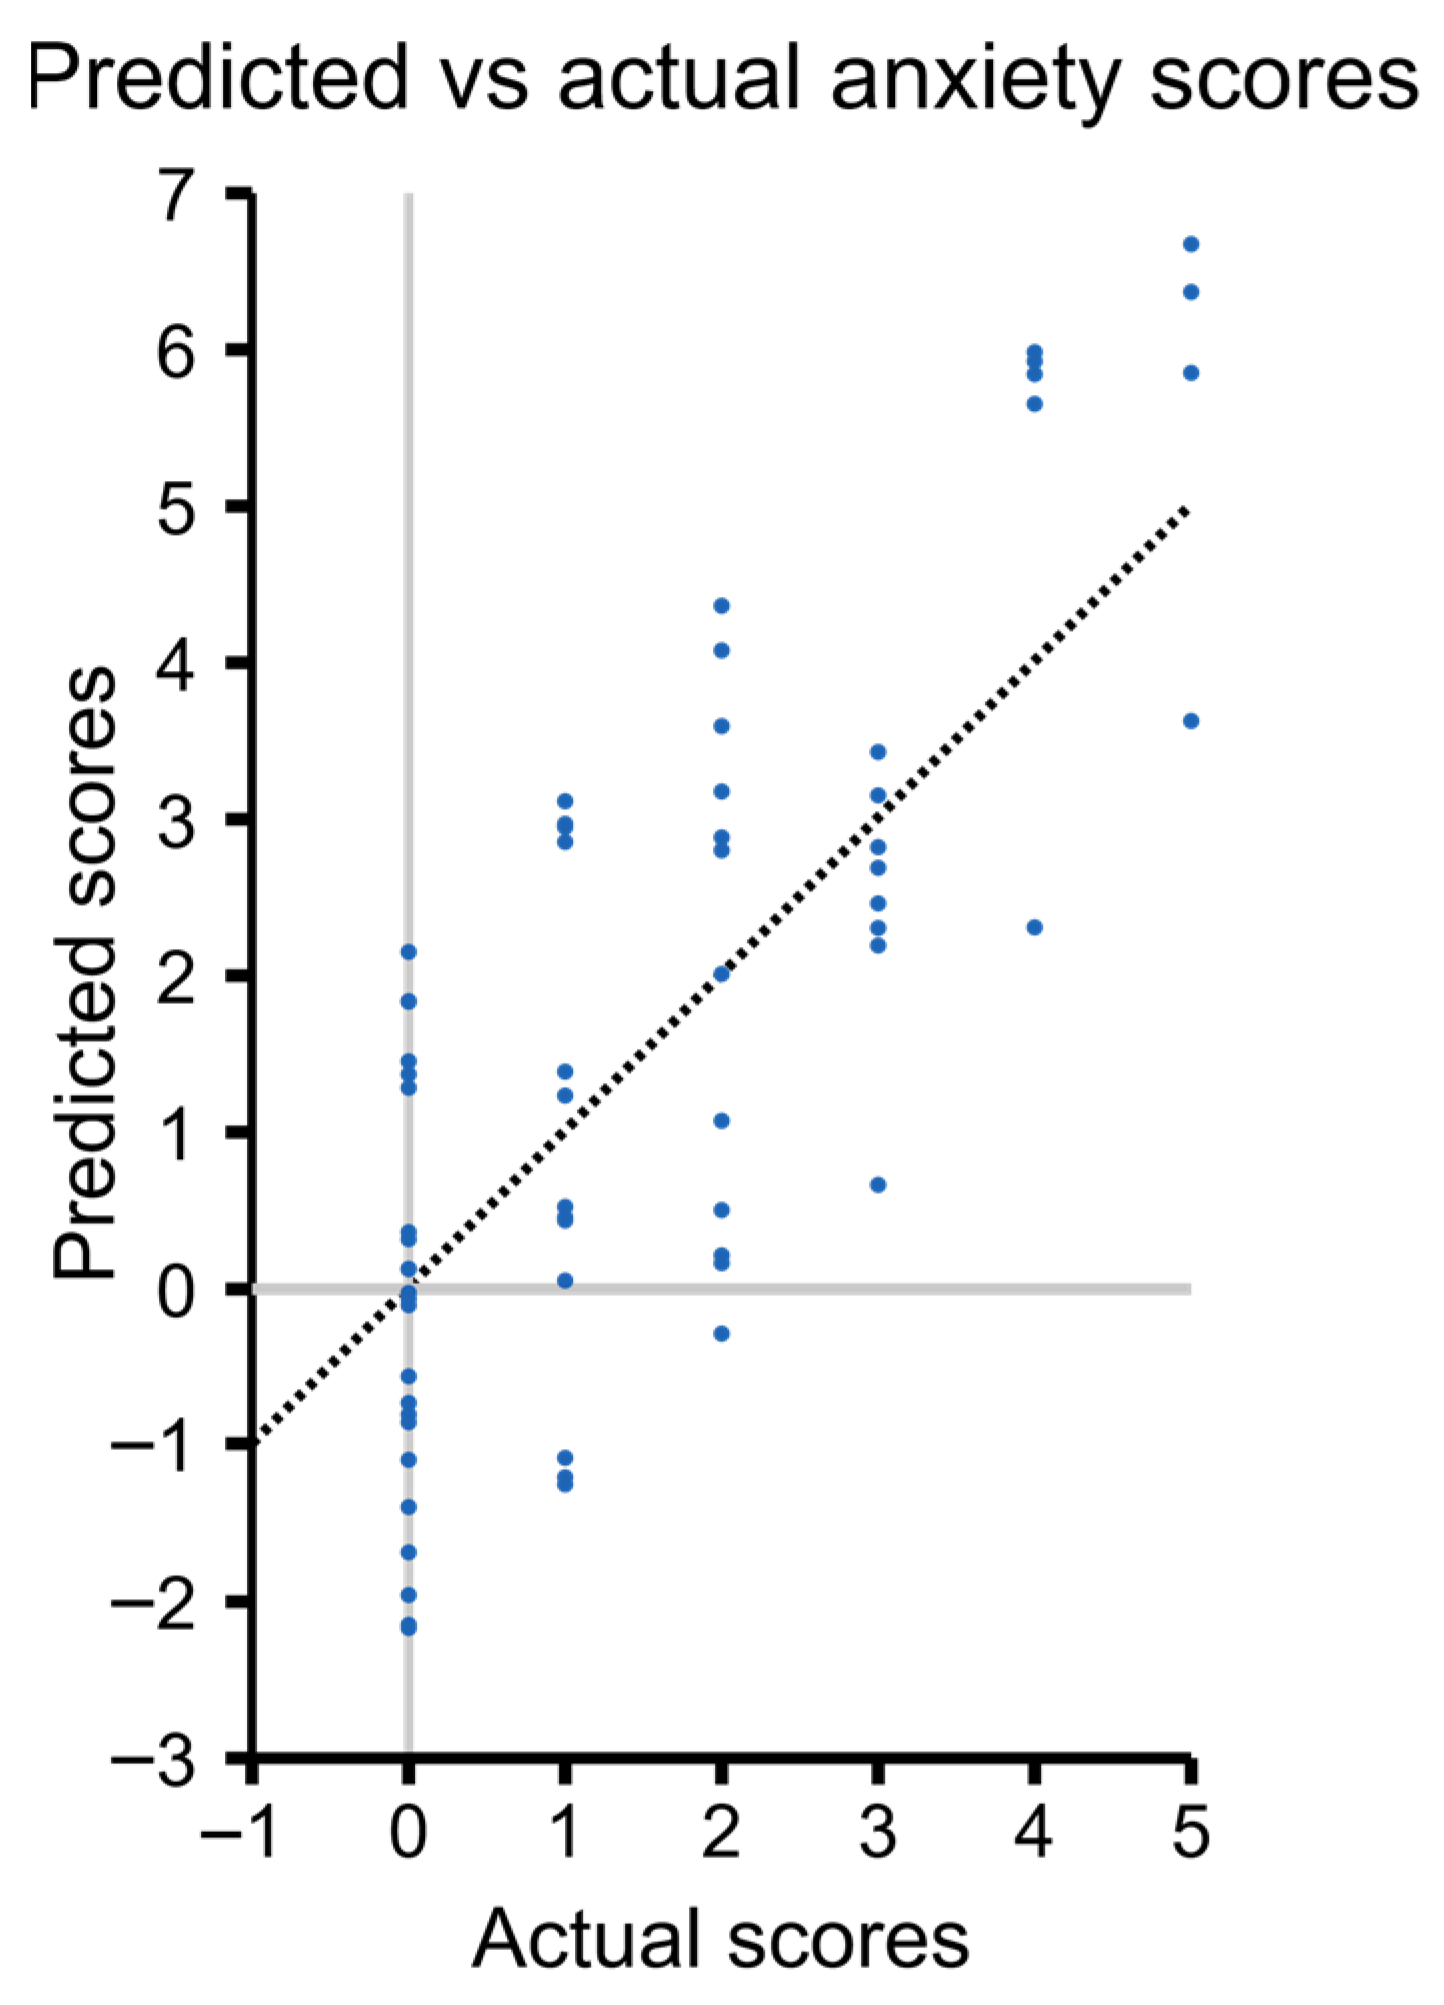
We also explored whether anxiety levels could be predicted from digital phenotyping features. Anxiety was operationalized using the sum of HAMD-17 items 10 and 11, yielding a score ranging from 0 to 8. A random forest model was trained on data from all participants, using the same input features and hyperparameters as described in Section 2.7, with the accuracy calculated using five-fold cross-validation. The results of this model are plotted below in Figure 3.
When comparing the predicted scores with the actual scores, we found that the Pearson correlation coefficient was 0.78, with a p-value of 1.67 × 10⁻¹⁴. We found that the model was able to predict anxiety scores far better than chance level, indicating that our digital phenotyping technique was able to detect measurable signals correlated to anxiety scores despite the small sample size.

4. Discussion

There is still a stigma towards mental illness, both in Singapore [45,46] and worldwide [47]. Stigma can discourage help-seeking and reduce treatment engagement. Augmenting clinical care with passively collected smartphone data may help address some of these barriers by providing patients and clinicians with continuous, objective indicators of behavioral change, complementing traditional self-report and clinical assessments.
Consistent with prior digital phenotyping research [48], we found that disengagement from active smartphone surveys was substantially higher than disengagement from passive sensor data. Singapore’s high smartphone penetration [49] likely contributed to stable passive data capture, as participants were likely to carry their phones around regardless of their activities. This is important in MDD, where low motivation and energy often lead to disengagement from psychiatric treatment as well as from app-based surveys [50,51]. Indeed, while data capture rates were relatively high even at the third follow-up (68%), active survey completion was much lower (15%). Encouraging patients with MDD to adhere to treatment and research schedules is an issue that continues to challenge patients, clinicians, and researchers. As passive monitoring does not depend on patient effort, it can continue during periods when low motivation or mood symptoms reduce engagement with active assessments, supporting detection of clinically relevant changes.
Our machine learning models exhibited a higher degree of accuracy when combining multiple smartphone data modalities. Future studies could extend these modalities to include others that are useful in predicting the mood states of patients. In addition, future studies could incorporate other methods of machine learning that we have not yet tested, such as neural networks or support vector machines, to improve predictive performance.
We were unable to use the “passive light” metric, because Apple phones do not have data from the ambient light sensor available to apps when the screen is locked. Unfortunately, we cannot do anything about this. Ultimately, it is the producers of phone operating systems who have control over what kinds of data can be passively collected by app developers, and changing privacy policies can affect this as well.
In addition, we found that our random forest model for anxiety (in Section 3.4) produced negative scores in some cases. For future studies, we can improve prediction accuracy by implementing machine learning models that do not output negative values, e.g., by changing the model output to classification labels, clipping the outputs that fall outside the input range, or by clamping the output with a function such as the logistic function.
These findings should be interpreted in light of the study’s small sample size (n = 40, with 30 individuals completing the full 90-day study), which limits generalizability and constrains model performance. This is especially the case for MDD relapse prediction, because only 4 participants experienced relapse during the study. In addition, the small dataset meant that we could not implement methods such as random under-sampling to balance the data classes, as we would also end up losing large amounts of useful information [52].
Larger and more diverse datasets will be needed to validate these associations and to develop more robust predictive models. Even though the sample size was small, the presence of a detectable behavioral signal suggests that scaling to larger datasets could meaningfully enhance predictive accuracy.

5. Conclusions

This study contributes to the validation of our digital phenotyping approach, consistent with recognized frameworks for verification, analytical validation and clinical validation [53]. We found that HAMD-17 class predictions were best when combining the activity, activity type, and location features, then using a random forest to predict 2 classes. This produced an accuracy of 91 ± 9%, with a macro F1 score of 0.86. We also found that a random forest model could predict anxiety scores better than chance level, with a Pearson correlation coefficient was 0.78 and a p-value of 1.67 × 10⁻¹⁴. Overall, our findings highlight the potential of passive smartphone sensing to support early detection of MDD relapse, as well as anxiety sub-scores of the HAMD-17 scale. This technology has the potential to help IMH clinicians identify patients who are at a greater risk of MDD relapse using digital phenotyping. Clinicians can therefore focus their efforts on these patients, improving clinical outcomes and allocating healthcare resources more effectively. We hope that our findings can eventually enable more timely and effective clinical intervention.

Author Contributions

Conceptualization, N.K., Y.M.M., J.H.L.K. and W.O.L.; methodology, N.K., Y.M.M., J.H.L.K. and W.O.L.; software, N.K., K.S., Y.M.M., J.H.L.K. and W.O.L.; validation, B.P., N.K., Y.M.M., J.H.L.K. and W.O.L.; formal analysis, N.K. and K.S.; investigation, B.P., N.K., I.Q.T. and K.S.; resources, Y.M.M., J.H.L.K. and W.O.L.; data curation, Y.M.M., J.H.L.K. and W.O.L.; writing—original draft preparation, B.P., N.K., I.Q.T., K.S. and K.K.A.; writing—review and editing, B.P., N.K., I.Q.T., K.S. and K.K.A.; visualization, B.P., N.K. and K.S.; supervision, N.K., Y.M.M., J.H.L.K. and W.O.L.; project administration, N.K., Y.M.M., J.H.L.K. and W.O.L.; funding acquisition, N.K., Y.M.M., J.H.L.K. and W.O.L. All authors have read and agreed to the published version of the manuscript.

Funding

This study was originally funded by Enterprise Singapore Enterprise Development Grant (EDG; 19074QH), and by Cogniant Pte. Ltd., which has since been dissolved. The intellectual property and study-related assets were subsequently acquired by Universal Health Pte. Ltd. in 2025. The preparation of this manuscript was funded by Universal Health Pte. Ltd.

Institutional Review Board Statement

The study was conducted in accordance with the Declaration of Helsinki, and approved by the Domain Specific Review Board of the National Healthcare Group, Singapore (NHG DSRB Ref. 2018/00843).

Informed Consent Statement

Informed consent was obtained from all subjects involved in the study.

Data Availability Statement

The datasets presented in this article are not readily available because the participants were mental health patients at the Institute of Mental Health, Singapore, and the Institute of Mental Health prioritizes the privacy of patients. Requests to access the datasets should be directed at the Institute of Mental Health.

Conflicts of Interest

The study was partially funded by Universal Health Pte. Ltd. The authors whose names are listed immediately below report the following conflicts of interest related to the work under consideration: Neeraj Kothari: Engaged by the sponsor Universal Health, who funded the study, as a consultant since July 2024. Kunal Shah: Engaged by the sponsor Universal Health, who funded the study, as a consultant from November 2024 to March 2025. Isabelle Q. Tay: Engaged by the sponsor Universal Health, who funded the study, first as a consultant from July 2025 to December 2025, and then as an employee from January 2026 to February 2026. The other authors certify that they have no conflicts of interest to declare.

Abbreviations

The following abbreviations are used in this manuscript:
MDDMajor Depressive Disorder
IMHInstitute of Mental Health, Singapore
HAMD-17Hamilton Rating Scale for Depression
MLMachine Learning

References

  1. Fan, Y.; Fan, A.; Yang, Z.; Fan, D. Global Burden of Mental Disorders in 204 Countries and Territories, 1990–2021: Results from the Global Burden of Disease Study 2021. BMC Psychiatry 2025, 25, 486. [Google Scholar] [CrossRef]
  2. Chong, S.A.; Abdin, E.; Vaingankar, J.A.; Heng, D.; Sherbourne, C.; Yap, M.; Lim, Y.W.; Wong, H.B.; Ghosh-Dastidar, B.; Kwok, K.W.; et al. A Population-Based Survey of Mental Disorders in Singapore. Ann. Acad. Med. Singap. 2012, 41, 49–66. [Google Scholar] [CrossRef]
  3. Stoudemire, A. Recurrence and Relapse in Geriatric Depression: A Review of Risk Factors and Prophylactic Treatment Strategies. J. Neuropsychiatry Clin. Neurosci. 1997, 9, 208–221. [Google Scholar] [CrossRef]
  4. Beshai, S.; Dobson, K.S.; Bockting, C.L.H.; Quigley, L. Relapse and Recurrence Prevention in Depression: Current Research and Future Prospects. Clin. Psychol. Rev. 2011, 31, 1349–1360. [Google Scholar] [CrossRef]
  5. Kessler, R.C.; Zhao, S.; Blazer, D.G.; Swartz, M. Prevalence, Correlates, and Course of Minor Depression and Major Depression in the National Comorbidity Survey. J. Affect. Disord. 1997, 45, 19–30. [Google Scholar] [CrossRef]
  6. Kessler, R.C.; Walters, E.E. Epidemiology of DSM-III-R Major Depression and Minor Depression among Adolescents and Young Adults in the National Comorbidity Survey. Depress. Anxiety 1998, 7, 3–14. [Google Scholar] [CrossRef]
  7. Moriarty, A.S.; Castleton, J.; Gilbody, S.; McMillan, D.; Ali, S.; Riley, R.D.; Chew-Graham, C.A. Predicting and Preventing Relapse of Depression in Primary Care. Br. J. Gen. Pract. 2020, 70, 54–55. [Google Scholar] [CrossRef]
  8. Burcusa, S.L.; Iacono, W.G. Risk for Recurrence in Depression. Clin. Psychol. Rev. 2007, 27, 959–985. [Google Scholar] [CrossRef]
  9. Smith, K.M.; Renshaw, P.F.; Bilello, J. The Diagnosis of Depression: Current and Emerging Methods. Compr. Psychiatry 2013, 54, 1–6. [Google Scholar] [CrossRef] [PubMed]
  10. Ingulfsvann Hagen, B.; Landrø, N.I.; Hoorelbeke, K.; Lau, B.; Stubberud, J. Characteristics Associated with the Discrepancy between Subjective and Objective Executive Functioning in Depression. Appl. Neuropsychol. Adult 2023, 30, 567–576. [Google Scholar] [CrossRef] [PubMed]
  11. Gauthier, G.; Mucha, L.; Shi, S.; Guerin, A. Economic Burden of Relapse/Recurrence in Patients with Major Depressive Disorder. J. Drug Assess. 2019, 8, 97–103. [Google Scholar] [CrossRef]
  12. Touya, M.; Lawrence, D.F.; Kangethe, A.; Chrones, L.; Evangelatos, T.; Polson, M. Incremental Burden of Relapse in Patients with Major Depressive Disorder: A Real-World, Retrospective Cohort Study Using Claims Data. BMC Psychiatry 2022, 22, 152. [Google Scholar] [CrossRef]
  13. Berges, I.M.; Amr, S.; Abraham, D.S.; Cannon, D.L.; Ostir, G.V. Associations between Depressive Symptoms and 30-Day Hospital Readmission among Older Adults. J. Depress. Anxiety 2015, 4, 185. [Google Scholar] [CrossRef]
  14. Torous, J.; Kiang, M.V.; Lorme, J.; Onnela, J.-P. New Tools for New Research in Psychiatry: A Scalable and Customizable Platform to Empower Data Driven Smartphone Research. JMIR Ment. Health 2016, 3, e16. [Google Scholar] [CrossRef]
  15. Bufano, P.; Laurino, M.; Said, S.; Tognetti, A.; Menicucci, D. Digital Phenotyping for Monitoring Mental Disorders: Systematic Review. J. Med. Internet Res. 2023, 25, e46778. [Google Scholar] [CrossRef] [PubMed]
  16. Jain, S.H.; Powers, B.W.; Hawkins, J.B.; Brownstein, J.S. The Digital Phenotype. Nat. Biotechnol. 2015, 33, 462–463. [Google Scholar] [CrossRef] [PubMed]
  17. Wang, R.; Aung, M.S.H.; Abdullah, S.; Brian, R.; Campbell, A.T.; Choudhury, T.; Hauser, M.; Kane, J.; Merrill, M.; Scherer, E.A.; et al. CrossCheck: Toward Passive Sensing and Detection of Mental Health Changes in People with Schizophrenia. In Proceedings of the 2016 ACM International Joint Conference on Pervasive and Ubiquitous Computing, Heidelberg, Germany, 12 September 2016; Association for Computing Machinery: New York, NY, USA, 2016; pp. 886–897. [Google Scholar]
  18. Barnett, I.; Torous, J.; Staples, P.; Sandoval, L.; Keshavan, M.; Onnela, J.-P. Relapse Prediction in Schizophrenia through Digital Phenotyping: A Pilot Study. Neuropsychopharmacology 2018, 43, 1660–1666. [Google Scholar] [CrossRef] [PubMed]
  19. Torous, J.; Onnela, J.-P.; Keshavan, M. New Dimensions and New Tools to Realize the Potential of RDoC: Digital Phenotyping via Smartphones and Connected Devices. Transl. Psychiatry 2017, 7, e1053. [Google Scholar] [CrossRef]
  20. Cornet, V.P.; Holden, R.J. Systematic Review of Smartphone-Based Passive Sensing for Health and Wellbeing. J. Biomed. Inform. 2018, 77, 120–132. [Google Scholar] [CrossRef]
  21. Choi, N.G.; Marti, C.N.; Choi, B.Y. Associations of Depression/Anxiety with Technology Use, Discontinued Use, and Nonuse in Older Adults. Clin. Gerontol. 2024, 49, 262–274. [Google Scholar] [CrossRef]
  22. Infocomm Media Development Authority (Singapore). Singapore Digital Society Report. Available online: https://www.imda.gov.sg/about-imda/research-and-statistics/singapore-digital-society-report (accessed on 12 October 2025).
  23. Boonstra, T.W.; Nicholas, J.; Wong, Q.J.; Shaw, F.; Townsend, S.; Christensen, H. Using Mobile Phone Sensor Technology for Mental Health Research: Integrated Analysis to Identify Hidden Challenges and Potential Solutions. J. Med. Internet Res. 2018, 20, e10131. [Google Scholar] [CrossRef]
  24. Maharjan, S.M.; Poudyal, A.; Van Heerden, A.; Byanjankar, P.; Thapa, A.; Islam, C.; Kohrt, B.A.; Hagaman, A. Passive Sensing on Mobile Devices to Improve Mental Health Services with Adolescent and Young Mothers in Low-Resource Settings: The Role of Families in Feasibility and Acceptability. BMC Med. Inform. Decis. Mak. 2021, 21, 117. [Google Scholar] [CrossRef] [PubMed]
  25. Masud, M.T.; Mamun, M.A.; Thapa, K.; Lee, D.H.; Griffiths, M.D.; Yang, S.-H. Unobtrusive Monitoring of Behavior and Movement Patterns to Detect Clinical Depression Severity Level via Smartphone. J. Biomed. Inform. 2020, 103, 103371. [Google Scholar] [CrossRef] [PubMed]
  26. Saeb, S.; Lattie, E.G.; Schueller, S.M.; Kording, K.P.; Mohr, D.C. The Relationship between Mobile Phone Location Sensor Data and Depressive Symptom Severity. PeerJ 2016, 4, e2537. [Google Scholar] [CrossRef]
  27. Ksibi, A.; Zakariah, M.; Menzli, L.J.; Saidani, O.; Almuqren, L.; Hanafieh, R.A.M. Electroencephalography-Based Depression Detection Using Multiple Machine Learning Techniques. Diagnostics 2023, 13, 1779. [Google Scholar] [CrossRef]
  28. Nepal, S.; Pillai, A.; Wang, W.; Griffin, T.; Collins, A.C.; Heinz, M.; Lekkas, D.; Mirjafari, S.; Nemesure, M.; Price, G.; et al. MoodCapture: Depression Detection Using In-the-Wild Smartphone Images. In Proceedings of the 2024 CHI Conference on Human Factors in Computing Systems, Honolulu, HI, USA, 11–16 May 2024; p. 996. [Google Scholar] [CrossRef]
  29. Walschots, Q.; Zarchev, M.; Unkel, M.; Kamperman, A. Using Wearable Technology to Detect, Monitor, and Predict Major Depressive Disorder—A Scoping Review and Introductory Text for Clinical Professionals. Algorithms 2024, 17, 408. [Google Scholar] [CrossRef]
  30. Burford, K.; Golaszewski, N.M.; Bartholomew, J. “I Shy Away from Them Because They Are Very Identifiable”: A Qualitative Study Exploring User and Non-User’s Perceptions of Wearable Activity Trackers. Digit. Health 2021, 7, 20552076211054920. [Google Scholar] [CrossRef]
  31. Ding, H.; Ho, K.; Searls, E.; Low, S.; Li, Z.; Rahman, S.; Madan, S.; Igwe, A.; Popp, Z.; Burk, A.; et al. Assessment of Wearable Device Adherence for Monitoring Physical Activity in Older Adults: Pilot Cohort Study. JMIR Aging 2024, 7, e60209. [Google Scholar] [CrossRef]
  32. Othmani, A.; Zeghina, A.O. A Multimodal Computer-Aided Diagnostic System for Depression Relapse Prediction Using Audiovisual Cues: A Proof of Concept. Healthc. Anal. 2022, 2, 100090. [Google Scholar] [CrossRef]
  33. Rao, K.; George, J.; Sudarshan, C.; Begum, S. Treatment Compliance and Noncompliance in Psychoses. Indian J. Psychiatry 2017, 59, 69. [Google Scholar] [CrossRef]
  34. Hopewell, S.; Chan, A.-W.; Collins, G.S.; Hróbjartsson, A.; Moher, D.; Schulz, K.F.; Tunn, R.; Aggarwal, R.; Berkwits, M.; Berlin, J.A.; et al. CONSORT 2025 Explanation and Elaboration: Updated Guideline for Reporting Randomised Trials. BMJ 2025, 389, e081124. [Google Scholar] [CrossRef]
  35. Pedregosa, F.; Varoquaux, G.; Gramfort, A.; Michel, V.; Thirion, B.; Grisel, O.; Blondel, M.; Prettenhofer, P.; Weiss, R.; Dubourg, V.; et al. Scikit-Learn: Machine Learning in Python. J. Mach. Learn. Res. 2011, 12, 2825–2830. [Google Scholar]
  36. Pallikkavaliyaveetil, N.; Chandrasekaran, S. Small Data, Big Challenges: Machine- and Deep-Learning Strategies for Data-Limited Drug Discovery. Adv. Drug Deliv. Rev. 2026, 229, 115762. [Google Scholar] [CrossRef]
  37. Sperandei, S. Understanding Logistic Regression Analysis. Biochem. Medica 2014, 24, 12–18. [Google Scholar] [CrossRef]
  38. Mienye, I.D.; Jere, N. A Survey of Decision Trees: Concepts, Algorithms, and Applications. IEEE Access 2024, 12, 86716–86727. [Google Scholar] [CrossRef]
  39. Breiman, L. Random Forests. Mach. Learn. 2001, 45, 5–32. [Google Scholar] [CrossRef]
  40. Ogunsanya, M.; Isichei, J.; Desai, S. Grid Search Hyperparameter Tuning in Additive Manufacturing Processes. Manuf. Lett. 2023, 35, 1031–1042. [Google Scholar] [CrossRef]
  41. Premchand, B.; Toe, K.K.; Wang, C.; Shaikh, S.; Libedinsky, C.; Ang, K.K.; So, R.Q. Decoding Movement Direction from Cortical Microelectrode Recordings Using an LSTM-Based Neural Network. In Proceedings of the 2020 42nd Annual International Conference of the IEEE Engineering in Medicine & Biology Society (EMBC), Virtual, 20–24 July 2020; IEEE: Montreal, QC, Canada, 2020; pp. 3007–3010. [Google Scholar]
  42. McMillan, K.; So, R.Q.; Libedinsky, C.; Ang, K.K.; Premchand, B. Spike-Weighted Spiking Neural Network with Spiking Long Short-Term Memory: A Biomimetic Approach to Decoding Brain Signals. Algorithms 2024, 17, 156. [Google Scholar] [CrossRef]
  43. Premchand, B.; Zhang, Z.; Ang, K.K.; Yu, J.; Tan, I.O.; Lam, J.P.W.; Choo, A.X.Y.; Sidarta, A.; Kwong, P.W.H.; Chung, L.H.C. A Personalized Multimodal BCI–Soft Robotics System for Rehabilitating Upper Limb Function in Chronic Stroke Patients. Biomimetics 2025, 10, 94. [Google Scholar] [CrossRef] [PubMed]
  44. Chen, J.; Cui, Y.; Wei, C.; Polat, K.; Alenezi, F. Driver Fatigue Detection Using EEG-Based Graph Attention Convolutional Neural Networks: An End-to-End Learning Approach with Mutual Information-Driven Connectivity. Appl. Soft Comput. 2026, 186, 114097. [Google Scholar] [CrossRef]
  45. Subramaniam, M. Stigma and Mental Health: Overcoming Barriers. Singapore Med. J. 2024, 65, 533. [Google Scholar] [CrossRef] [PubMed]
  46. Tan, G.T.H.; Shahwan, S.; Goh, C.M.J.; Ong, W.J.; Wei, K.-C.; Verma, S.K.; Chong, S.A.; Subramaniam, M. Mental Illness Stigma’s Reasons and Determinants (MISReaD) among Singapore’s Lay Public—A Qualitative Inquiry. BMC Psychiatry 2020, 20, 422. [Google Scholar] [CrossRef]
  47. Ahad, A.A.; Sanchez-Gonzalez, M.; Junquera, P. Understanding and Addressing Mental Health Stigma Across Cultures for Improving Psychiatric Care: A Narrative Review. Cureus 2023, 15, e39549. [Google Scholar] [CrossRef]
  48. Ben-Zeev, D.; Scherer, E.A.; Wang, R.; Xie, H.; Campbell, A.T. Next-Generation Psychiatric Assessment: Using Smartphone Sensors to Monitor Behavior and Mental Health. Psychiatr. Rehabil. J. 2015, 38, 218–226. [Google Scholar] [CrossRef]
  49. Singapore Department of Statistics Telecommunication Penetration Rate, Annual. Available online: https://data.gov.sg/datasets/d_07b1f52c84218d677cd518f0b81fa7f9/view (accessed on 19 November 2025).
  50. Stein-Shvachman, I. Depression Treatment Non-Adherence and Its Psychosocial Predictors: Differences between Young and Older Adults? Aging Dis. 2013, 4, 329–336. [Google Scholar] [CrossRef]
  51. Darnell, D.; Pullmann, M.D.; Hull, T.D.; Chen, S.; Areán, P. Predictors of Disengagement and Symptom Improvement Among Adults with Depression Enrolled in Talkspace, a Technology-Mediated Psychotherapy Platform: Naturalistic Observational Study. JMIR Form. Res. 2022, 6, e36521. [Google Scholar] [CrossRef]
  52. Fujiwara, K.; Huang, Y.; Hori, K.; Nishioji, K.; Kobayashi, M.; Kamaguchi, M.; Kano, M. Over- and Under-Sampling Approach for Extremely Imbalanced and Small Minority Data Problem in Health Record Analysis. Front. Public Health 2020, 8, 178. [Google Scholar] [CrossRef] [PubMed]
  53. Goldsack, J.C.; Coravos, A.; Bakker, J.P.; Bent, B.; Dowling, A.V.; Fitzer-Attas, C.; Godfrey, A.; Godino, J.G.; Gujar, N.; Izmailova, E.; et al. Verification, Analytical Validation, and Clinical Validation (V3): The Foundation of Determining Fit-for-Purpose for Biometric Monitoring Technologies (BioMeTs). npj Digit. Med. 2020, 3, 55. [Google Scholar] [CrossRef] [PubMed]
Figure 1. Overview of the app-based solution for predicting relapses in Major Depressive Disorder.
Applsci 16 03582 g001
Figure 2. Flowchart showing the disposition of participants in this study, reported using CONSORT guidelines [34].
Applsci 16 03582 g002
Figure 3. Predicted vs. actual anxiety scores. The y-axis represents predicted anxiety scores while the x-axis represents actual anxiety scores. Each blue point represents an observation of a predicted anxiety score and the actual anxiety score. The grey plot x = 0 and y = 0, while the diagonal dashed line plots y = x. In an ideal model where all predictions are completely accurate, all points should lie on this dashed line.
Applsci 16 03582 g003
Table 1. Inclusion and exclusion criteria for this study.
Inclusion CriteriaExclusion Criteria
Patients who have been diagnosed with depression using the Structured Clinical Interview for DSM-V (SCID-5)Patients diagnosed with any of the psychotic disorders using the Structured Clinical
Interview for DSM-V (SCID-5)
Currently in clinical remission of depression, as defined by HAMD-17 scores less than 7Patients not in remission at the point of recruitment
Aged over 21 years
Other psychiatric comorbidities such as substance use are allowed
Lives in Singapore
English-speaking
Participant owns and uses a smartphone that is able to launch the application
Able to provide informed consent
Table 2. Demographic information of study participants. More granular information on participant age was not made available to researchers, in order to preserve patient privacy.
Count
Age range
21–3022
31–4010
41–503
51–605
Gender
Male17
Female23
Total40
Table 3. Data capture rate from the Sallie app over the study. Percentages indicate the data collection rate: the mean number of days, among all participants, that this data type was collected by the app. Days with partially collected data were counted as having data. “Active—Mood survey” refers to participants actively inputting their mood into the app, and it was the only active form of data collection; all other data were collected passively via smartphone sensors. Passive data metrics are also listed (a more detailed description of each metric is available in Section 2.6). The next column, “Average passive engagement”, shows the mean data collection rate across all passive data metrics. Finally, the last column shows the difference between “Active—Mood survey” and “Average passive engagement”.
Follow-UpCount (n)Mean Duration of Recording (Days)Active—Mood SurveyPassive-ActivityPassive-Activity TypePassive-ChargingPassive-DevicePassive-LightPassive-LocationAverage Passive EngagementEngagement Difference
1st373636%83%82%64%71%85%69%75%40%
2nd357322%84%84%61%68%86%61%74%52%
3rd3010715%79%78%54%64%79%53%68%53%
Table 4. Output classes for machine learning classifiers. Our machine learning models were trained to output either 2, 3, or 4 classes, with the class boundaries defined by HAMD-17 scores.
Number of Output Classes2 Classes3 Classes4 Classes
Output classesHAMD-17 score ≤ 16—None to mild depressionHAMD-17 score ≤ 16—None to mild depressionHAMD-17 score ≤ 7—No depression
HAMD-17 score ≥ 17—Moderate to severe depression17 ≤ HAMD-17 score ≤ 23—Moderate depression8 ≤ HAMD-17 score ≤ 16—Mild depression
HAMD-17 score ≥ 24—Severe depression17 ≤ HAMD-17 score ≤ 23—Moderate depression
HAMD-17 score ≥ 24—Severe depression
Table 5. Mean accuracy of classifying HAMD-17 scores using various machine learning techniques, and 2 to 4 output classes. LR represents logistic regression, DT represents decision tree, and RF represents random forest. The upper table presents model accuracy with 95% confidence intervals after 10,000 repetitions of 5-fold cross-validation. The lower table presents macro F1 scores.
HAMD-17 Class Prediction Accuracy—5-Fold Cross-Validation
Accuracy ± 95% CI (%)2 Class Output3 Class Output4 Class Output
LRDTRFLRDTRFLRDTRF
Activity66 ± 1178 ± 1088 ± 966 ± 1175 ± 1178 ± 1065 ± 1166 ± 1175 ± 10
Activity type70 ± 1166 ± 1078 ± 1070 ± 1072 ± 1072 ± 1165 ± 1070 ± 1070 ± 10
Location66 ± 1172 ±1072 ± 1166 ± 1168 ± 1166 ± 1168 ± 1166 ± 1166 ± 12
All combined72 ± 1082 ± 991 ± 972 ± 1078 ± 1088 ± 968 ± 1172 ± 1078 ± 10
Macro F1 Scores2 Class Output3 Class Output4 Class Output
LRDTRFLRDTRFLRDTRF
Activity0.580.710.820.550.660.700.520.550.65
Activity type0.630.590.720.600.640.650.530.600.62
Location0.580.650.660.550.600.580.560.550.57
All combined0.650.760.860.620.700.800.570.630.69
Table 6. Mean accuracy of classifying depression relapse using various machine learning techniques. Since we were comparing “relapse” with “no relapse”, there were always two output classes. LR represents logistic regression, DT represents decision tree, and RF represents random forest.
Depression Relapse Prediction Accuracy—5-Fold Cross-Validation
Model
LRDTRF
Activity68%79%83%
Activity type62%68%76%
Location72%79%79%
All combined76%83%86%
Disclaimer/Publisher’s Note: The statements, opinions and data contained in all publications are solely those of the individual author(s) and contributor(s) and not of MDPI and/or the editor(s). MDPI and/or the editor(s) disclaim responsibility for any injury to people or property resulting from any ideas, methods, instructions or products referred to in the content.