1. Introduction
Fracture detection represents one of the highest-volume diagnostic tasks in clinical radiology, with emergency departments and outpatient clinics generating substantial numbers of musculoskeletal radiographs requiring timely interpretation [
1,
2,
3]. This diagnostic burden has motivated interest in artificial intelligence systems capable of augmenting radiologist workflow by flagging suspicious findings or providing preliminary interpretations. However, the clinical utility of such systems depends fundamentally on their ability to perform reliably across the diverse patient populations encountered in practice [
4]. A fracture-detection algorithm that achieves high accuracy on one patient demographic but fails catastrophically on another would pose risks to patient safety rather than benefits [
5,
6]. The question of whether deep learning models can learn generalizable representations of fractures, rather than population-specific patterns that do not transfer across demographic boundaries, therefore constitutes a critical prerequisite to clinical deployment.
The integration of deep learning into radiographic interpretation has demonstrated remarkable potential for augmenting clinical diagnostic workflows. Convolutional neural networks have achieved expert-level performance on fracture detection tasks across diverse anatomical regions, with reported accuracies frequently exceeding 90% on benchmark datasets [
7,
8]. Recent implementations utilizing ResNet-50 architectures have achieved near-perfect area under the curve (AUC) scores for detecting nondisplaced femoral neck fractures [
9], while advanced object-detection frameworks such as YOLOv8 have demonstrated high diagnostic accuracy across multiple hip fracture classifications [
10]. Similarly, VGG16 and DenseNet201 architectures have achieved 97% accuracy in multi-region fracture classification [
11], and custom convolutional neural networks paired with transfer learning have shown strong performance on the multi-region FracAtlas dataset [
12]. These successes have accelerated regulatory approvals and commercial deployment of AI-assisted diagnostic tools in radiology departments worldwide. However, the translation of algorithmic performance from curated research datasets to heterogeneous clinical populations remains incompletely characterized, raising fundamental questions about the generalizability of learned representations across patient demographics [
13].
A critical assumption underlying the deployment of medical AI systems is that features learned from one patient population will transfer meaningfully to others presenting with the same pathology. This assumption is particularly consequential in musculoskeletal radiology, where fracture detection represents a high-volume, time-sensitive diagnostic task amenable to AI augmentation. Yet the morphological differences between patient populations (most notably between pediatric and adult skeletal anatomy) introduce potential confounders that standard training and validation procedures may fail to detect. Pediatric bones exhibit developmental features including open growth plates (physes), variable ossification centers, and distinct cortical thickness profiles that fundamentally alter the radiographic appearance of both normal anatomy and pathological findings [
14,
15,
16,
17]. The diagnostic challenge posed by growth plates has been documented in pediatric-specific model development, where even dedicated CNN architectures achieved only 85% accuracy for distal radius fractures due to the persistent confusion between physes and true fracture lines [
18]. Whether deep learning models can abstract fracture-indicative features that transcend these population-specific characteristics remains an open empirical question with direct implications for patient safety.
The prevailing evaluation paradigm for medical image classifiers relies on held-out test sets drawn from the same distribution as training data; while this approach appropriately measures within-domain generalization, it provides no assurance regarding performance on demographically distinct populations encountered in clinical practice. A systematic review by Yu et al. revealed that 81% of deep learning models in medical imaging experienced performance degradation when tested on external data, with nearly one quarter exhibiting AUC decreases of 0.10 or greater [
19]. The RAISE systematic review of over 500 radiology AI studies found that only 6% included external validation, with those that did showing an average performance drop of 6% and a maximum drop of 44% [
20]. Similarly, a review of AI training on small medical imaging datasets found that only 5% of studies included any form of external validation [
21]. These findings suggest that the “expert-level” results frequently reported in the literature may be inflated by data homogeneity and fail to reflect real-world deployment conditions.
The magnitude of cross-population performance degradation has been empirically documented across multiple clinical contexts. A top-performing algorithm from the RSNA AI challenge experienced a significant drop in specificity from 94% to 70% when externally validated on a diverse trauma dataset, primarily due to anatomical confounders such as degenerative disease [
22]. A systematic review of AI models in diagnostic radiology published between 2022 and 2025 found that, while internal AUC metrics remained high (0.76–0.95), external validation typically caused substantial specificity reductions of up to 24 percentage points [
23]. Most concerning, Maleki et al. demonstrated that a pneumonia detection model achieving 98.7% internal accuracy correctly classified only 3.8% of external healthy samples, proving that high internal metrics can mask a complete absence of true generalizability [
24]. Such failures have been attributed to “shortcut learning,” wherein models exploit hidden data acquisition biases rather than clinically relevant features, leading to performance overestimation by up to 20% [
25].
Cross-population validation studies that report successful generalization underscore the exceptional nature of such results. A recent study validated the cross-population generalizability of an AI tool trained on Indian data by evaluating its performance on a large Dutch cohort across seventeen anatomical regions, achieving 87.1% sensitivity and 87.1% specificity at the patient level [
26]. However, such multi-institutional validation remains the exception rather than the rule, and reviews of fracture risk assessment models continue to identify generalizability and data bias as persistent hurdles necessitating transparent, multi-institutional validation standards [
27]. The current literature on fracture detection, while reporting diagnostic accuracies between 85% and 95%, consistently identifies critical barriers to clinical implementation: spectrum bias, limited model generalizability, and an urgent need for standardized multicenter validation protocols [
8].
This study addresses this gap through a controlled cross-validation experiment designed to isolate the effect of patient population on classifier generalizability. We trained two identical ResNet-50 architectures on radiographically distinct datasets: one comprising mixed-age radiographs spanning multiple anatomical regions (FracAtlas [
28]) and one comprising exclusively pediatric wrist radiographs (GRAZPEDWRI-DX [
29]). Each model was evaluated both on held-out data from its training distribution (internal validation) and on the complete opposing dataset (external cross-testing). This bidirectional cross-testing protocol enables direct quantification of the generalization barrier between adult and pediatric populations while controlling for architectural and training configuration variables.
Our experimental design intentionally omits domain adaptation techniques, data augmentation, and fine-tuning procedures that might ameliorate cross-population performance degradation. The findings reported herein quantify the magnitude of cross-population generalization failure, identify specific anatomical and textural confounders driving misclassification, and provide explainability analyses illuminating the learned representations underlying model predictions.
Study Purpose and Objectives
The primary objective of this study is to characterize the baseline transferability of fracture-detection models in the absence of explicit generalization interventions. By documenting the unmitigated failure modes that emerge when population boundaries are crossed, we establish the empirical foundation necessary for developing and evaluating targeted solutions. The experimental design employs an intentionally extreme scenario comparing demographically and anatomically dissimilar datasets to establish theoretical upper bounds on cross-population generalization failure; while commercial fracture-detection systems typically operate within defined specifications regarding patient age and anatomical region, the deliberate violation of these boundaries in a controlled research setting reveals the mechanistic basis of domain-specific learned representations that would otherwise remain latent. This theoretical approach complements studies of clinically plausible scenarios by isolating the population factor from other sources of performance variability. Fundamentally, a robust fracture-detection algorithm should be capable of identifying bone tissue on a radiograph and recognizing whether that bone exhibits structural discontinuity, irrespective of patient age or anatomical region. Bone remains bone, and fracture remains fracture, across demographic boundaries. If a classifier achieves acceptable performance only when test images closely resemble training images in population characteristics, this constitutes evidence that the model has encoded features irrelevant to the diagnostic task itself. Such reliance on non-generalizable shortcuts represents a critical failure mode that warrants explicit investigation, rather than a predictable outcome to be dismissed as specification violation.
A classification-based approach was selected rather than object detection because the primary research question concerned whether models learn transferable representations of the fracture concept itself, independent of localization capability. Classification architectures provide a direct test of whether global image features encode population-invariant diagnostic information, whereas object-detection performance could be confounded by localization accuracy. Additionally, classification permits straightforward comparison of sensitivity and specificity metrics across populations without requiring annotation-format harmonization between datasets with different bounding box conventions.
To achieve this purpose, the study pursued three specific aims: (1) To evaluate whether deep learning models achieving acceptable internal validation performance maintain discrimination capability on demographically shifted populations. (2) To characterize potential failure modes for adult-to-pediatric versus pediatric-to-adult transfer and determine whether generalization barriers are symmetric or asymmetric in nature. (3) To establish baseline performance benchmarks against which future domain adaptation and population-aware training strategies can be evaluated.
These analyses carry implications for the regulatory evaluation and clinical deployment of radiographic AI systems, with potential to inform our understanding of whether population-specific validation should be required prior to deployment across demographic boundaries.
2. Materials and Methods
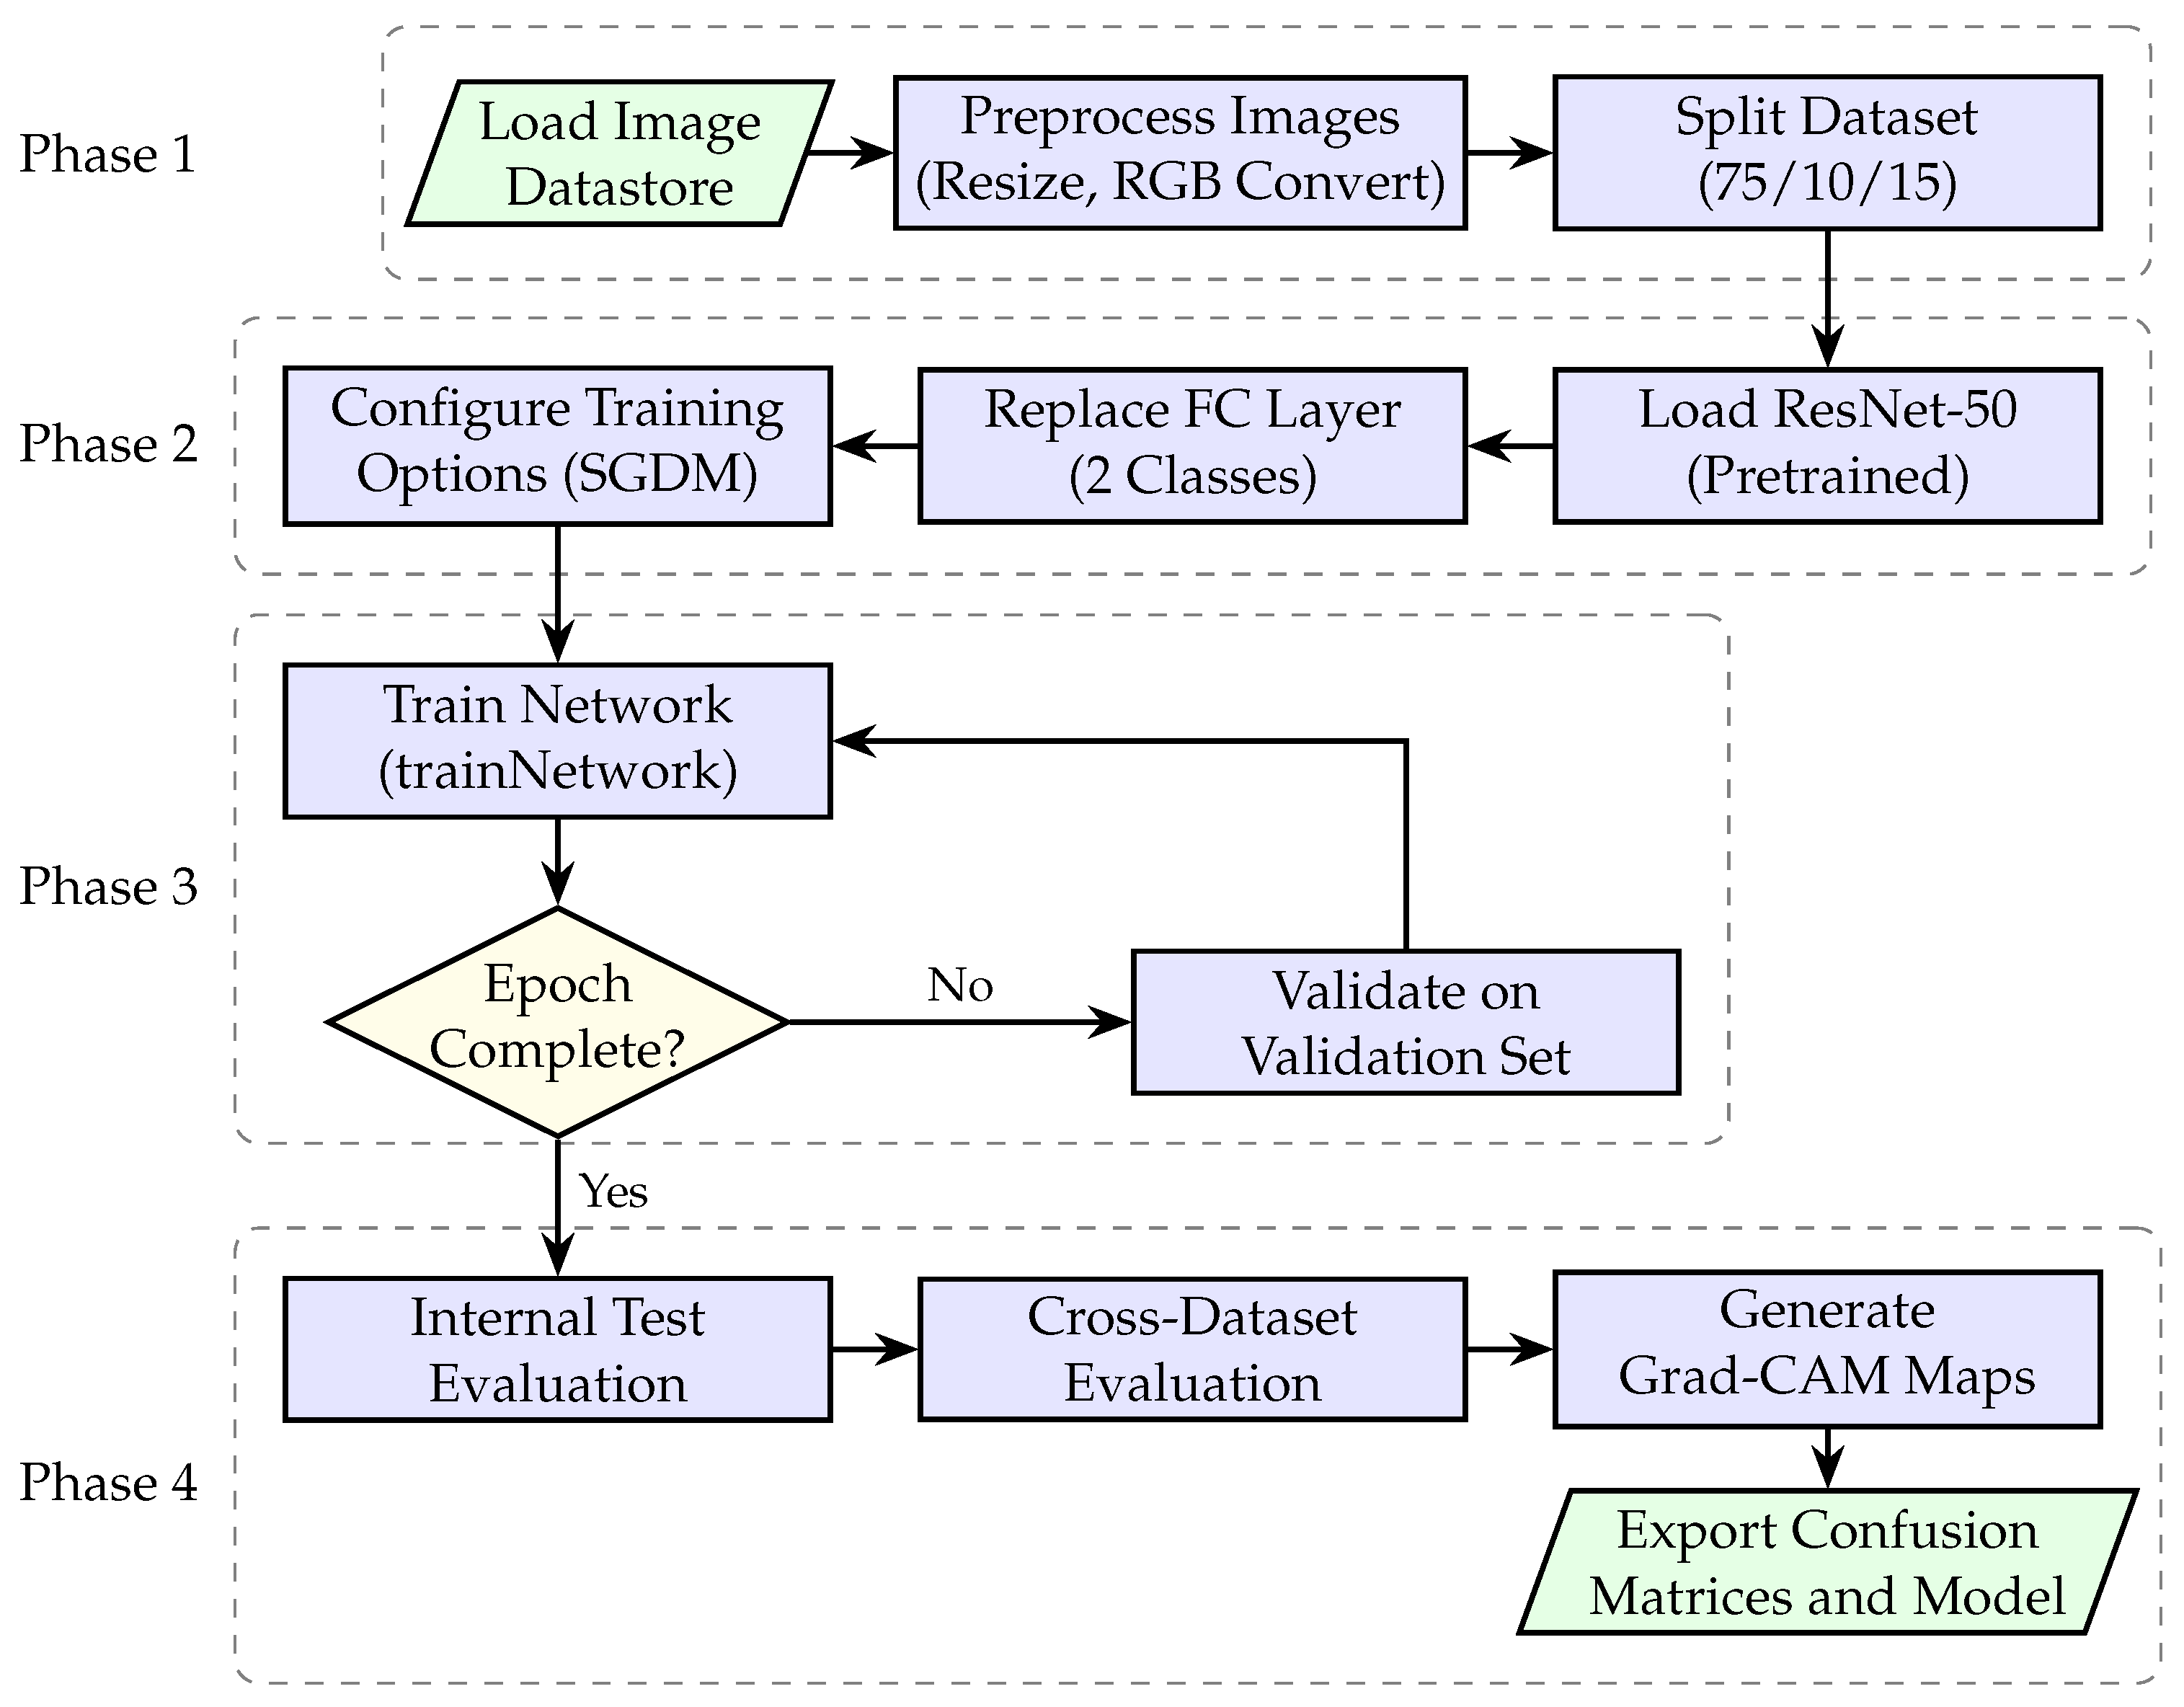
This section describes the methodological pipeline employed to evaluate the cross-population generalizability of fracture-detection models. The workflow proceeded through four phases: data preparation, model configuration, training with validation, and evaluation including cross-dataset testing and explainability analysis. The following subsections are organized to reflect this sequential structure. Study design and dataset characteristics are presented first, followed by preprocessing procedures and partitioning protocols that prepared the data for model ingestion. Network architecture and training configuration subsections detail the transfer learning approach. Label assignment and cross-testing protocols describe how binary classification labels were derived and how trained models were evaluated on opposing datasets to assess generalization across population boundaries. Explainability analysis via Gradient-weighted Class Activation Mapping is then described, followed by performance metrics used to quantify classification behavior. The section concludes with documentation of the computational environment and algorithmic contributions.
2.1. Study Design and Datasets
This study employed a cross-validation experimental design to evaluate the generalizability of deep learning models trained on radiographic data from distinct patient populations. Two publicly available datasets were utilized for model development and external validation. The first dataset, FracAtlas [
28], comprises mixed-age radiographs spanning multiple anatomical regions including the hand, leg, hip, shoulder, and images containing orthopedic hardware. This dataset represents a generalist collection of adult skeletal pathology. The second dataset, GRAZPEDWRI-DX [
29], contains exclusively pediatric wrist radiographs, representing a specialist collection focused on a single anatomical region within a developmentally distinct population. The fundamental differences in skeletal maturity between these populations, particularly the presence of open physes (growth plates) in pediatric patients, provided an ideal substrate for testing model adaptability across demographic boundaries.
The FracAtlas dataset, published in 2023, contains 4083 musculoskeletal radiographic images curated from three major hospitals in Bangladesh [
28]. Of these, 717 images contain fractures encompassing 922 individual fracture instances; each instance is annotated with bounding boxes and segmentation masks in addition to global classification labels. The dataset spans multiple anatomical regions including hand (1538 images), leg (2272 images), hip (338 images), and shoulder (349 images), with 99 images containing orthopedic hardware. Patient ages range from 8 months to 78 years, encompassing both pediatric and adult populations; the gender distribution is approximately 62% male and 38% female. Annotations were performed manually by two expert radiologists and validated by an orthopedist. The GRAZPEDWRI-DX dataset, published in 2022, contains 20,327 wrist radiograph images derived from 10,643 studies of 6091 pediatric patients treated at the Department for Pediatric Surgery of the University Hospital Graz between 2008 and 2018 [
29]. Studies typically include posteroanterior and lateral projections. The dataset is annotated with 74,459 image tags and 67,771 labeled objects, with pediatric radiologists marking pathologies including fractures and periosteal reactions using lines, bounding boxes, or polygons. Patient age and sex information accompanies each image. The substantially greater image count in GRAZPEDWRI-DX relative to FracAtlas reflects both the multi-projection acquisition protocol and the extended collection period at a single high-volume pediatric trauma center. Although FracAtlas includes patients across the full age spectrum from infancy to late adulthood, the multi-region anatomical scope and collection from general diagnostic radiography practice distinguishes it from the exclusively pediatric, single-region wrist focus of GRAZPEDWRI-DX. This comparison therefore contrasts a pediatric wrist specialist dataset against a mixed-age multi-region generalist dataset rather than a strictly adult population.
The FracAtlas dataset includes hand radiographs but does not contain isolated wrist-specific imaging; no publicly available adult wrist fracture dataset of comparable size and annotation quality was identified at the time of study design. The comparison of a pediatric wrist specialist model against a mixed-age multi-region generalist model was therefore necessitated by data availability constraints rather than methodological preference. This asymmetry in anatomical scope represents a limitation that should be considered when interpreting cross-testing results. However, two considerations mitigate the impact of this limitation and render the experimental design informative despite the asymmetry.
First, theoretical considerations regarding anatomical scope asymmetry predict directional effects that can be empirically tested. A model trained exclusively on a single anatomical region would be expected to perform poorly when evaluated on diverse anatomical regions, because region-specific features learned during training would not transfer to unfamiliar anatomy. Conversely, a model trained on multiple anatomical regions would be expected to perform comparatively better when evaluated on a single region, including regions not explicitly present in training data, because multi-region training should encourage learning of region-invariant features common to all bony structures. The FracAtlas model, having been exposed to fractures across hand, leg, hip, shoulder, and other skeletal sites, should theoretically develop more generalizable representations of what constitutes a fracture than the narrowly trained GRAZPEDWRI-DX model. The cross-testing protocol is designed to evaluate whether this theoretical expectation holds in practice.
Second, and more fundamentally, a robust fracture-detection algorithm should be capable of identifying bone tissue on a radiograph and recognizing whether that bone exhibits structural discontinuity, irrespective of patient age or the specific anatomical region depicted. The hand and wrist share skeletal structures, and the fundamental radiographic task of distinguishing intact bone from fractured bone does not change across these closely related regions, nor does it change between pediatric and adult patients. Bone remains bone, and fracture remains fracture, across these boundaries. This capacity to recognize bone and detect cortical discontinuity represents the minimal competency expected of any system claiming to detect fractures. If a classifier functions only when presented with images nearly identical in patient demographics and anatomical region to those encountered during training, this would constitute evidence that the model has acquired population-specific or acquisition-specific features rather than the universal radiographic signatures of skeletal pathology. Such reliance on non-generalizable shortcuts would represent a critical failure mode warranting explicit investigation, rather than a predictable and dismissible consequence of applying a model outside its nominal specifications. The experimental design intentionally tests this fundamental expectation by crossing population boundaries under conditions where true fracture-detection capability should, in principle, transfer.
2.2. Data Preprocessing and Augmentation
All radiographic images underwent standardized preprocessing prior to model ingestion. Images were resized to
pixels to conform to the input requirements of the selected architecture. Grayscale images, common in radiographic data, were converted to three-channel RGB format through channel replication to ensure compatibility with pretrained network weights. This conversion was implemented through a custom reading function applied uniformly across training, validation, and test partitions (see Algorithm A1 in the
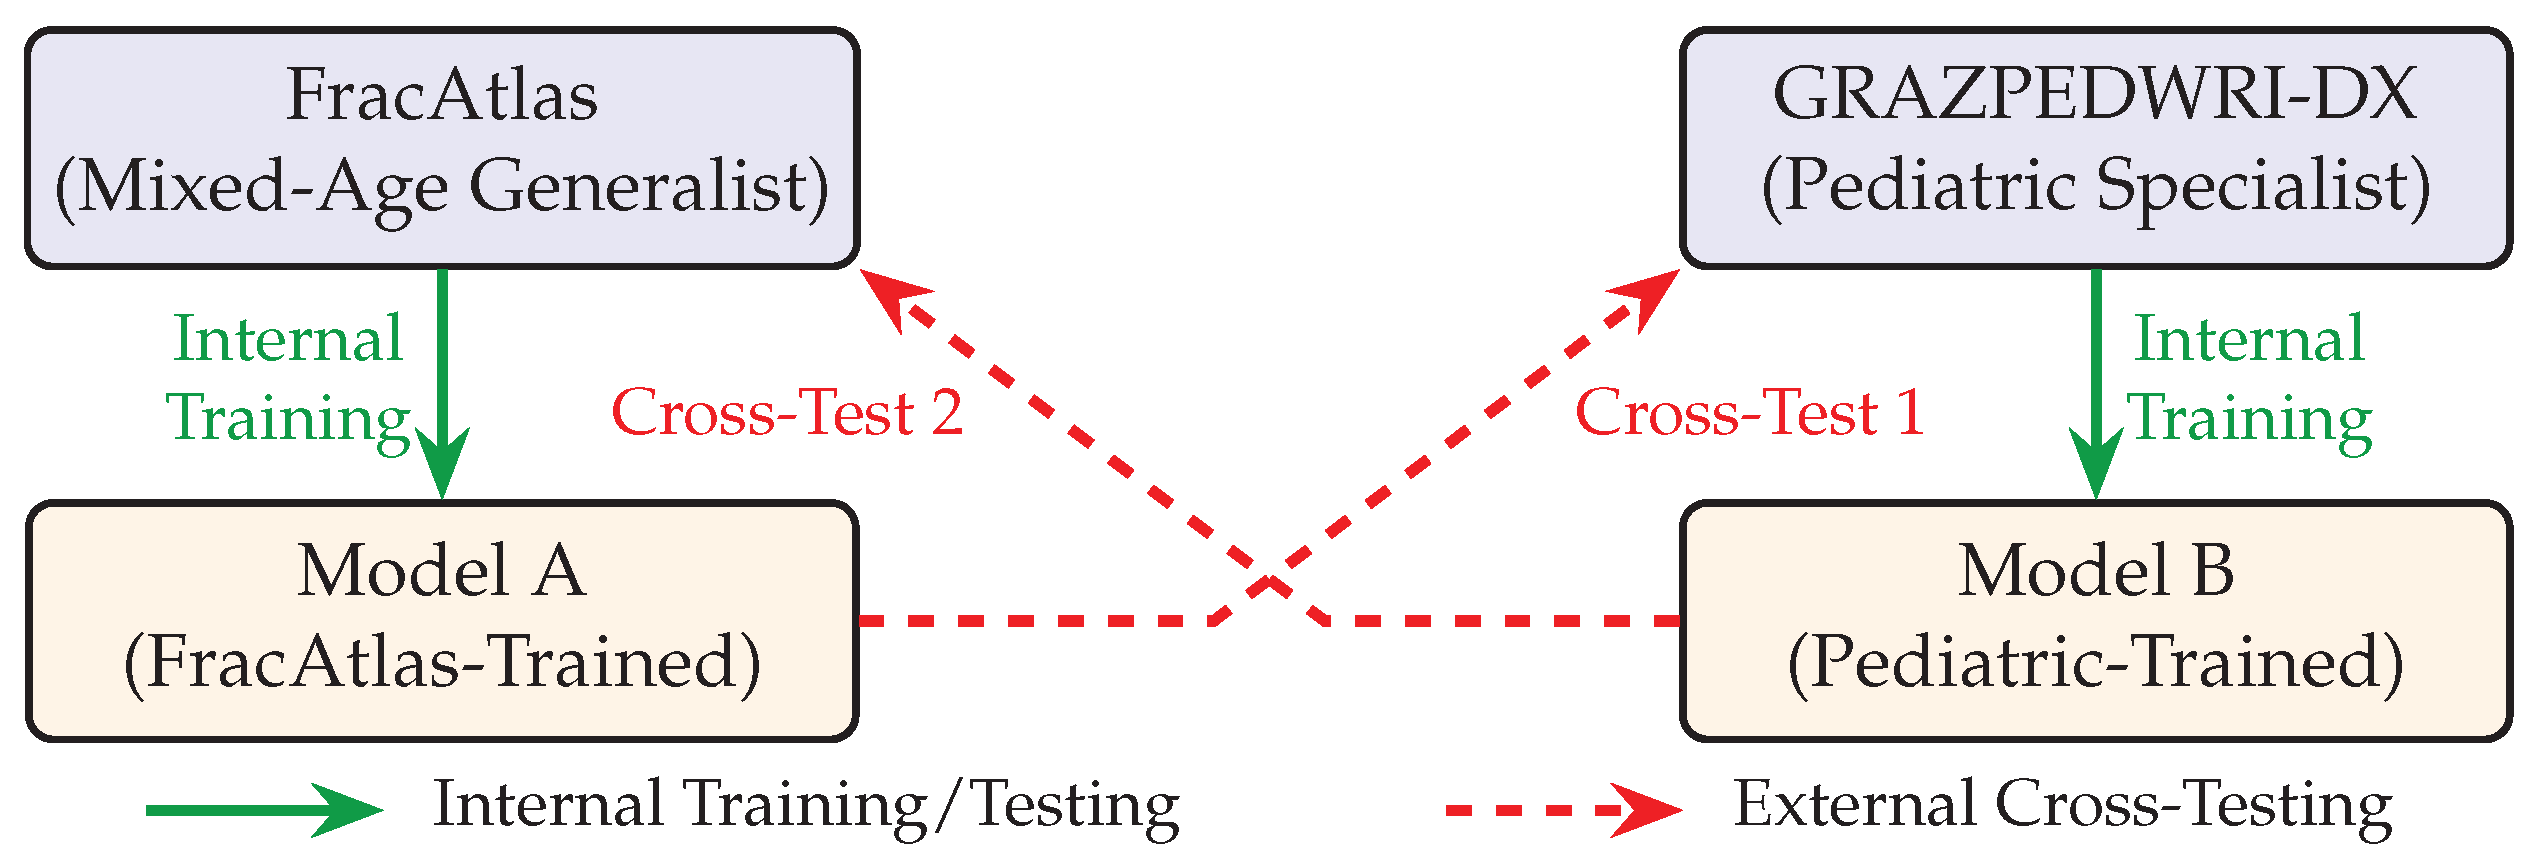
Appendix A for complete pseudocode). The preprocessing pipeline ensured dimensional consistency while preserving the diagnostic features present in the original acquisitions. No additional augmentation techniques such as rotation, flipping, or intensity modification were applied, thereby isolating the effect of population differences from augmentation-induced variability. The overall cross-testing experimental design is illustrated in
Figure 1.
2.3. Dataset Partitioning
Each dataset was partitioned into training, validation, and test subsets using a 75/10/15 split ratio. The two datasets differ substantially in total image count, with GRAZPEDWRI-DX containing approximately 20,000 radiographs and FracAtlas containing approximately 4000 radiographs, a ratio of roughly five to one. Despite this size disparity, both datasets possess image counts that exceed the thresholds typically considered sufficient for training convolutional neural network classifiers via transfer learning; several thousand labeled examples generally suffice for fine-tuning pretrained architectures on medical imaging tasks. No resampling or size-matching procedures were applied to equalize dataset magnitude, as the study aimed to evaluate models trained under conditions representative of each dataset’s native characteristics. However, the primary research question concerns cross-population generalization rather than comparative internal performance, and both datasets provided sufficient training examples for their respective models to achieve non-trivial internal discrimination. A model that has genuinely learned to detect fractures should generalize the core concept of cortical discontinuity regardless of training set size; failure to do so would indicate reliance on dataset-specific features rather than the universal radiographic signatures of bone and fracture. Stratified random sampling was employed to maintain class balance across all partitions. A fixed random seed (seed = 42) was set prior to partitioning to ensure reproducibility of the experimental conditions. The training subset was used for weight optimization, the validation subset for hyperparameter tuning and early stopping decisions, and the test subset for final internal performance assessment. Class labels were standardized across both datasets to a binary classification scheme distinguishing fractured from non-fractured cases.
2.4. Network Architecture
The ResNet-50 convolutional neural network architecture served as the backbone for both classification models. This architecture was selected for its demonstrated efficacy in medical image analysis tasks and its availability with pretrained weights from the ImageNet database. Transfer learning was employed by initializing network weights from ImageNet pretraining, thereby leveraging learned low-level and mid-level visual features. The terminal layers of the network were modified to accommodate the binary classification task. Specifically, the original 1000-class fully connected layer was replaced with a new fully connected layer containing two output neurons corresponding to the fractured and non-fractured classes. The classification output layer was similarly replaced with a new classification layer explicitly configured with the target class labels to prevent ambiguities in label ordering during inference.
2.5. Training Configuration
Network training was performed using stochastic gradient descent with momentum (SGDM) as the optimization algorithm. The initial learning rate was set to 0.0001 to facilitate fine-tuning of pretrained weights without catastrophic forgetting. Training proceeded for a maximum of four epochs with a mini-batch size of 32 samples. Data shuffling was performed at the beginning of each epoch to reduce ordering bias. Validation performance was evaluated every 20 iterations to monitor for overfitting. Training was executed in parallel across available CPU cores to reduce computation time. Identical training configurations were applied to both models to ensure comparability of results. The complete training pipeline, including architecture modification and artifact export procedures, is formalized in Algorithm A2, with the overall methodology from data loading through evaluation illustrated in
Figure 2.
2.6. Label Assignment Protocol
Binary class labels were assigned based on annotation files accompanying each dataset. For datasets utilizing YOLO-format annotations, a custom sorting algorithm parsed the label files to identify fracture-positive cases (Algorithm A3). Images were classified as fractured if their corresponding annotation file contained bounding box coordinates with the fracture class identifier. Images lacking fracture annotations or possessing empty annotation files were classified as non-fractured. This automated sorting procedure ensured consistent label assignment across all dataset partitions and eliminated manual labeling errors.
2.7. Cross-Testing Protocol
Following internal training and validation, each model was subjected to external evaluation on the opposing dataset. The adult-trained model (trained on FracAtlas) was evaluated on the complete GRAZPEDWRI-DX pediatric dataset without any fine-tuning or domain adaptation. Symmetrically, the pediatric-trained model (trained on GRAZPEDWRI-DX) was evaluated on the complete FracAtlas adult dataset. This cross-testing protocol was designed to quantify the degree to which learned representations transfer across patient populations with fundamentally different skeletal characteristics. No modifications were made to model weights or classification thresholds during cross-testing, ensuring that observed performance reflected pure generalization capacity. The complete evaluation protocol, including failure mode analysis procedures, is detailed in Algorithm A4.
2.8. Explainability Analysis
Gradient-weighted Class Activation Mapping (Grad-CAM) was employed to visualize the spatial regions influencing model predictions (Algorithm A5). For each classification, Grad-CAM generated a heatmap overlay indicating the relative contribution of image regions to the predicted class. This technique computes the gradient of the target class score with respect to feature maps in the final convolutional layer, producing a localization map highlighting discriminative regions. Heatmaps were superimposed on original images with 50% transparency to enable visual correlation between model attention and anatomical structures. This explainability analysis was particularly valuable for diagnosing failure modes during cross-testing, as it revealed whether models attended to clinically relevant features or spurious image characteristics.
Grad-CAM visualizations were generated for a representative subset of cases rather than exhaustively for all images in the cross-testing datasets. Systematic quantitative analysis of activation patterns, such as measuring the proportion of activation falling within versus outside bony structures, was not performed in the present study. The explainability analysis was intended to provide qualitative insight into model attention patterns rather than statistically validated characterization of activation distributions. A clinically meaningful fracture-detection system should, at minimum, localize its attention to skeletal structures when making predictions, regardless of patient demographics or anatomical region; the Grad-CAM methodology permits visual assessment of whether this fundamental expectation is satisfied.
2.9. Performance Metrics
Model performance was quantified using standard classification metrics derived from confusion matrices. Sensitivity (true positive rate) measured the proportion of actual fractures correctly identified. Specificity (true negative rate) measured the proportion of non-fractured cases correctly classified. Overall accuracy represented the proportion of all cases correctly classified. These metrics were computed separately for internal test sets and cross-test evaluations to distinguish within-domain performance from cross-domain generalization. Confusion matrices were generated and exported for each evaluation scenario to enable detailed analysis of classification patterns.
2.10. Computational Environment
All experiments were conducted using MATLAB (version 26.1; MathWorks, Natick, MA, USA) with the Deep Learning Toolbox (version 26.1). Parallel computing was enabled through the Parallel Computing Toolbox to distribute training across available processor cores. The hardware platform consisted of an AMD Ryzen 7 7800X3D processor (AMD, Santa Clara, CA, USA). A local parallel pool was initialized at runtime to maximize computational throughput during both training and inference phases. Model weights and training artifacts were serialized to disk following training completion to enable subsequent analysis and cross-testing without retraining.
2.11. Algorithmic Contributions
The computational methodology employed in this study was implemented through five interconnected algorithms, each serving a distinct function within the overall processing pipeline. Complete pseudocode representations are provided in the
Appendix A to enable full reproducibility. Algorithm A1 defines the standardized image preprocessing function ensuring dimensional and format consistency across all pipeline stages. Algorithm A2 orchestrates the complete transfer learning workflow including architecture modification, training configuration, and artifact export. Algorithm A3 implements automated YOLO annotation parsing and binary label assignment. Algorithm A4 implements the cross-dataset evaluation protocol central to this study’s experimental contribution, including failure mode detection. Algorithm A5 provides Gradient-weighted Class Activation Mapping for model explainability.
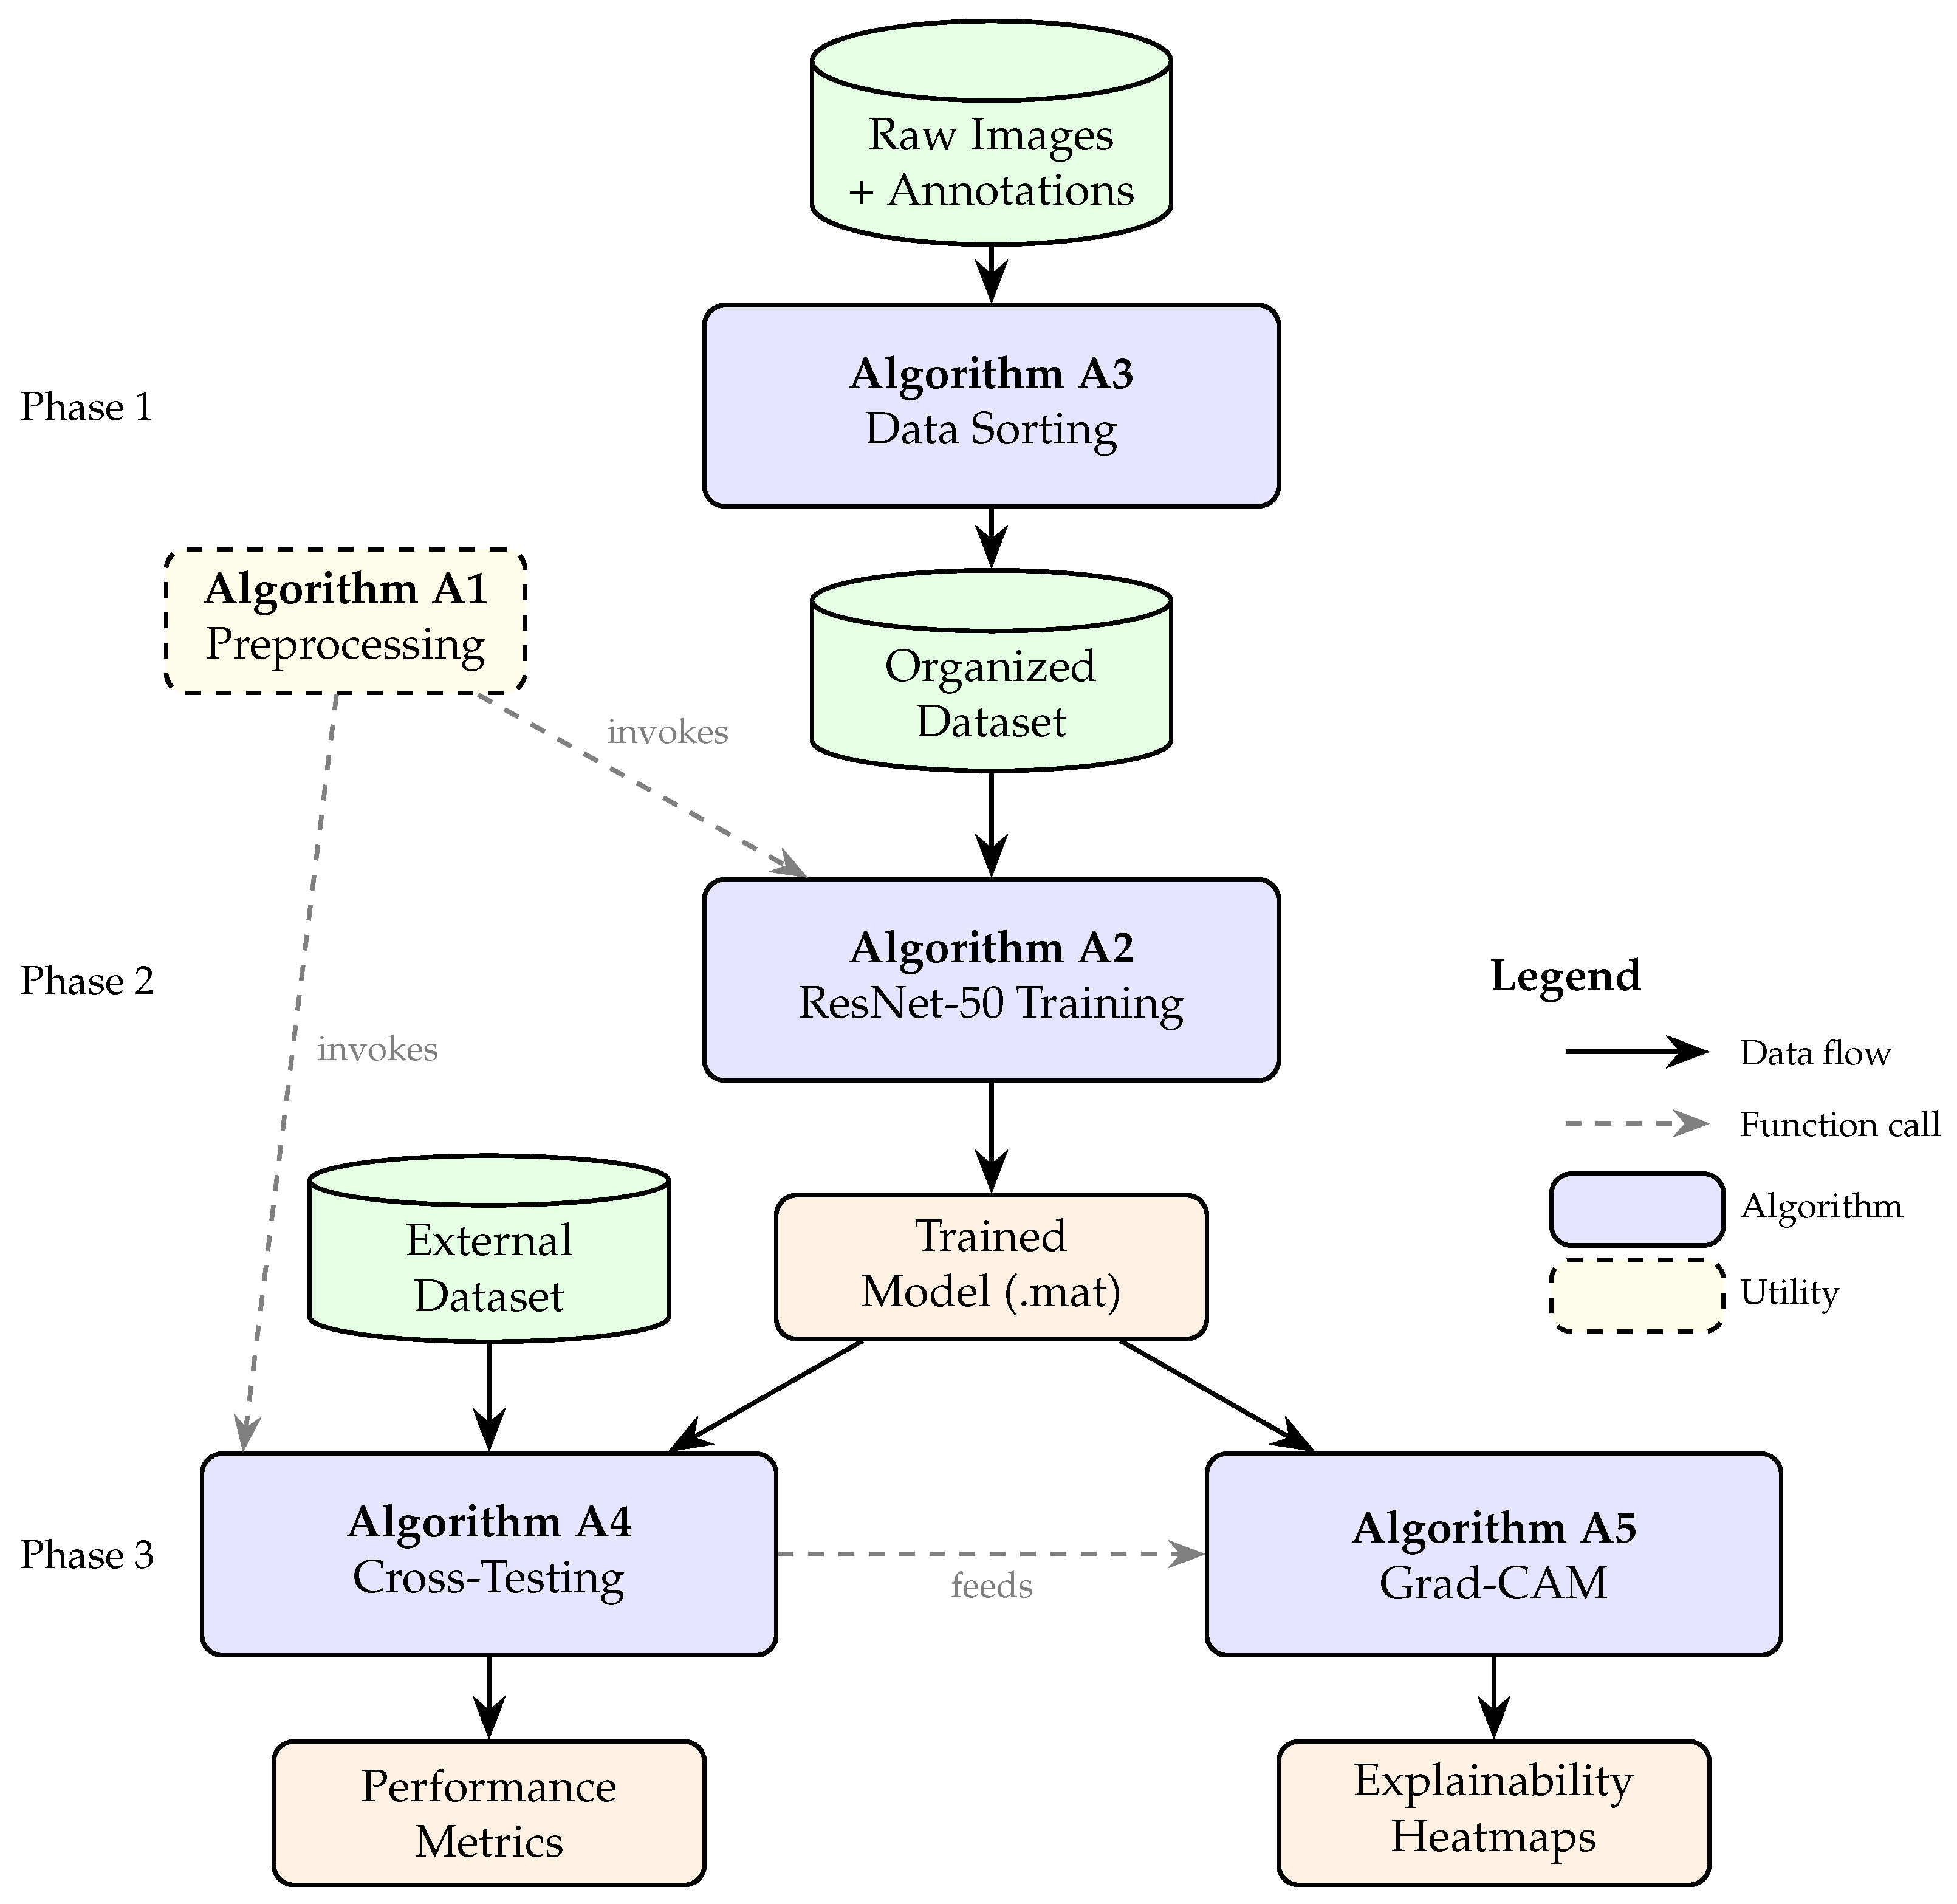
The five algorithms comprising the computational workflow exhibit a hierarchical dependency structure, illustrated in
Figure 3. The data-sorting algorithm (Algorithm A3) operates first and independently, requiring only raw data and annotation files as input. The preprocessing function (Algorithm A1) is defined independently but is invoked by subsequent algorithms during data-loading operations. The training algorithm (Algorithm A2) depends on both preceding components and produces trained model files as output. The cross-testing algorithm (Algorithm A4) requires trained models from the training phase and applies the same preprocessing function to external data. Finally, the Grad-CAM algorithm (Algorithm A5) operates on trained models and specific input images, providing interpretability for predictions generated during evaluation.
The modular architecture of this algorithmic workflow confers several methodological advantages. First, separation of data sorting from model training permits reuse of organized datasets across multiple experimental configurations without repeated preprocessing. Second, encapsulation of the preprocessing function as an independent utility ensures identical image transformation across training and evaluation phases, eliminating a potential source of domain shift. Third, isolation of the cross-testing protocol from internal evaluation enables systematic comparison of within-domain and cross-domain performance using identical computational procedures. Fourth, integration of Grad-CAM as a standalone algorithm permits explainability analysis to be applied selectively to samples of interest without modification to upstream components. The complete pseudocode for each algorithm is provided in Algorithms A2–A5, detailing input requirements, processing steps, decision logic, and output formats.
3. Results
The results are organized into thematic sections reflecting the logical progression of the experimental analysis. Internal validation performance is presented first to establish baseline model capabilities within their respective training distributions. Cross-testing results follow, documenting generalization performance when models are evaluated on populations outside their training domain. Finally, Grad-CAM explainability analysis provides mechanistic insight into the observed failure modes. This organization permits assessment of whether acceptable internal performance predicts external generalization capability.
3.1. Internal Classification Performance
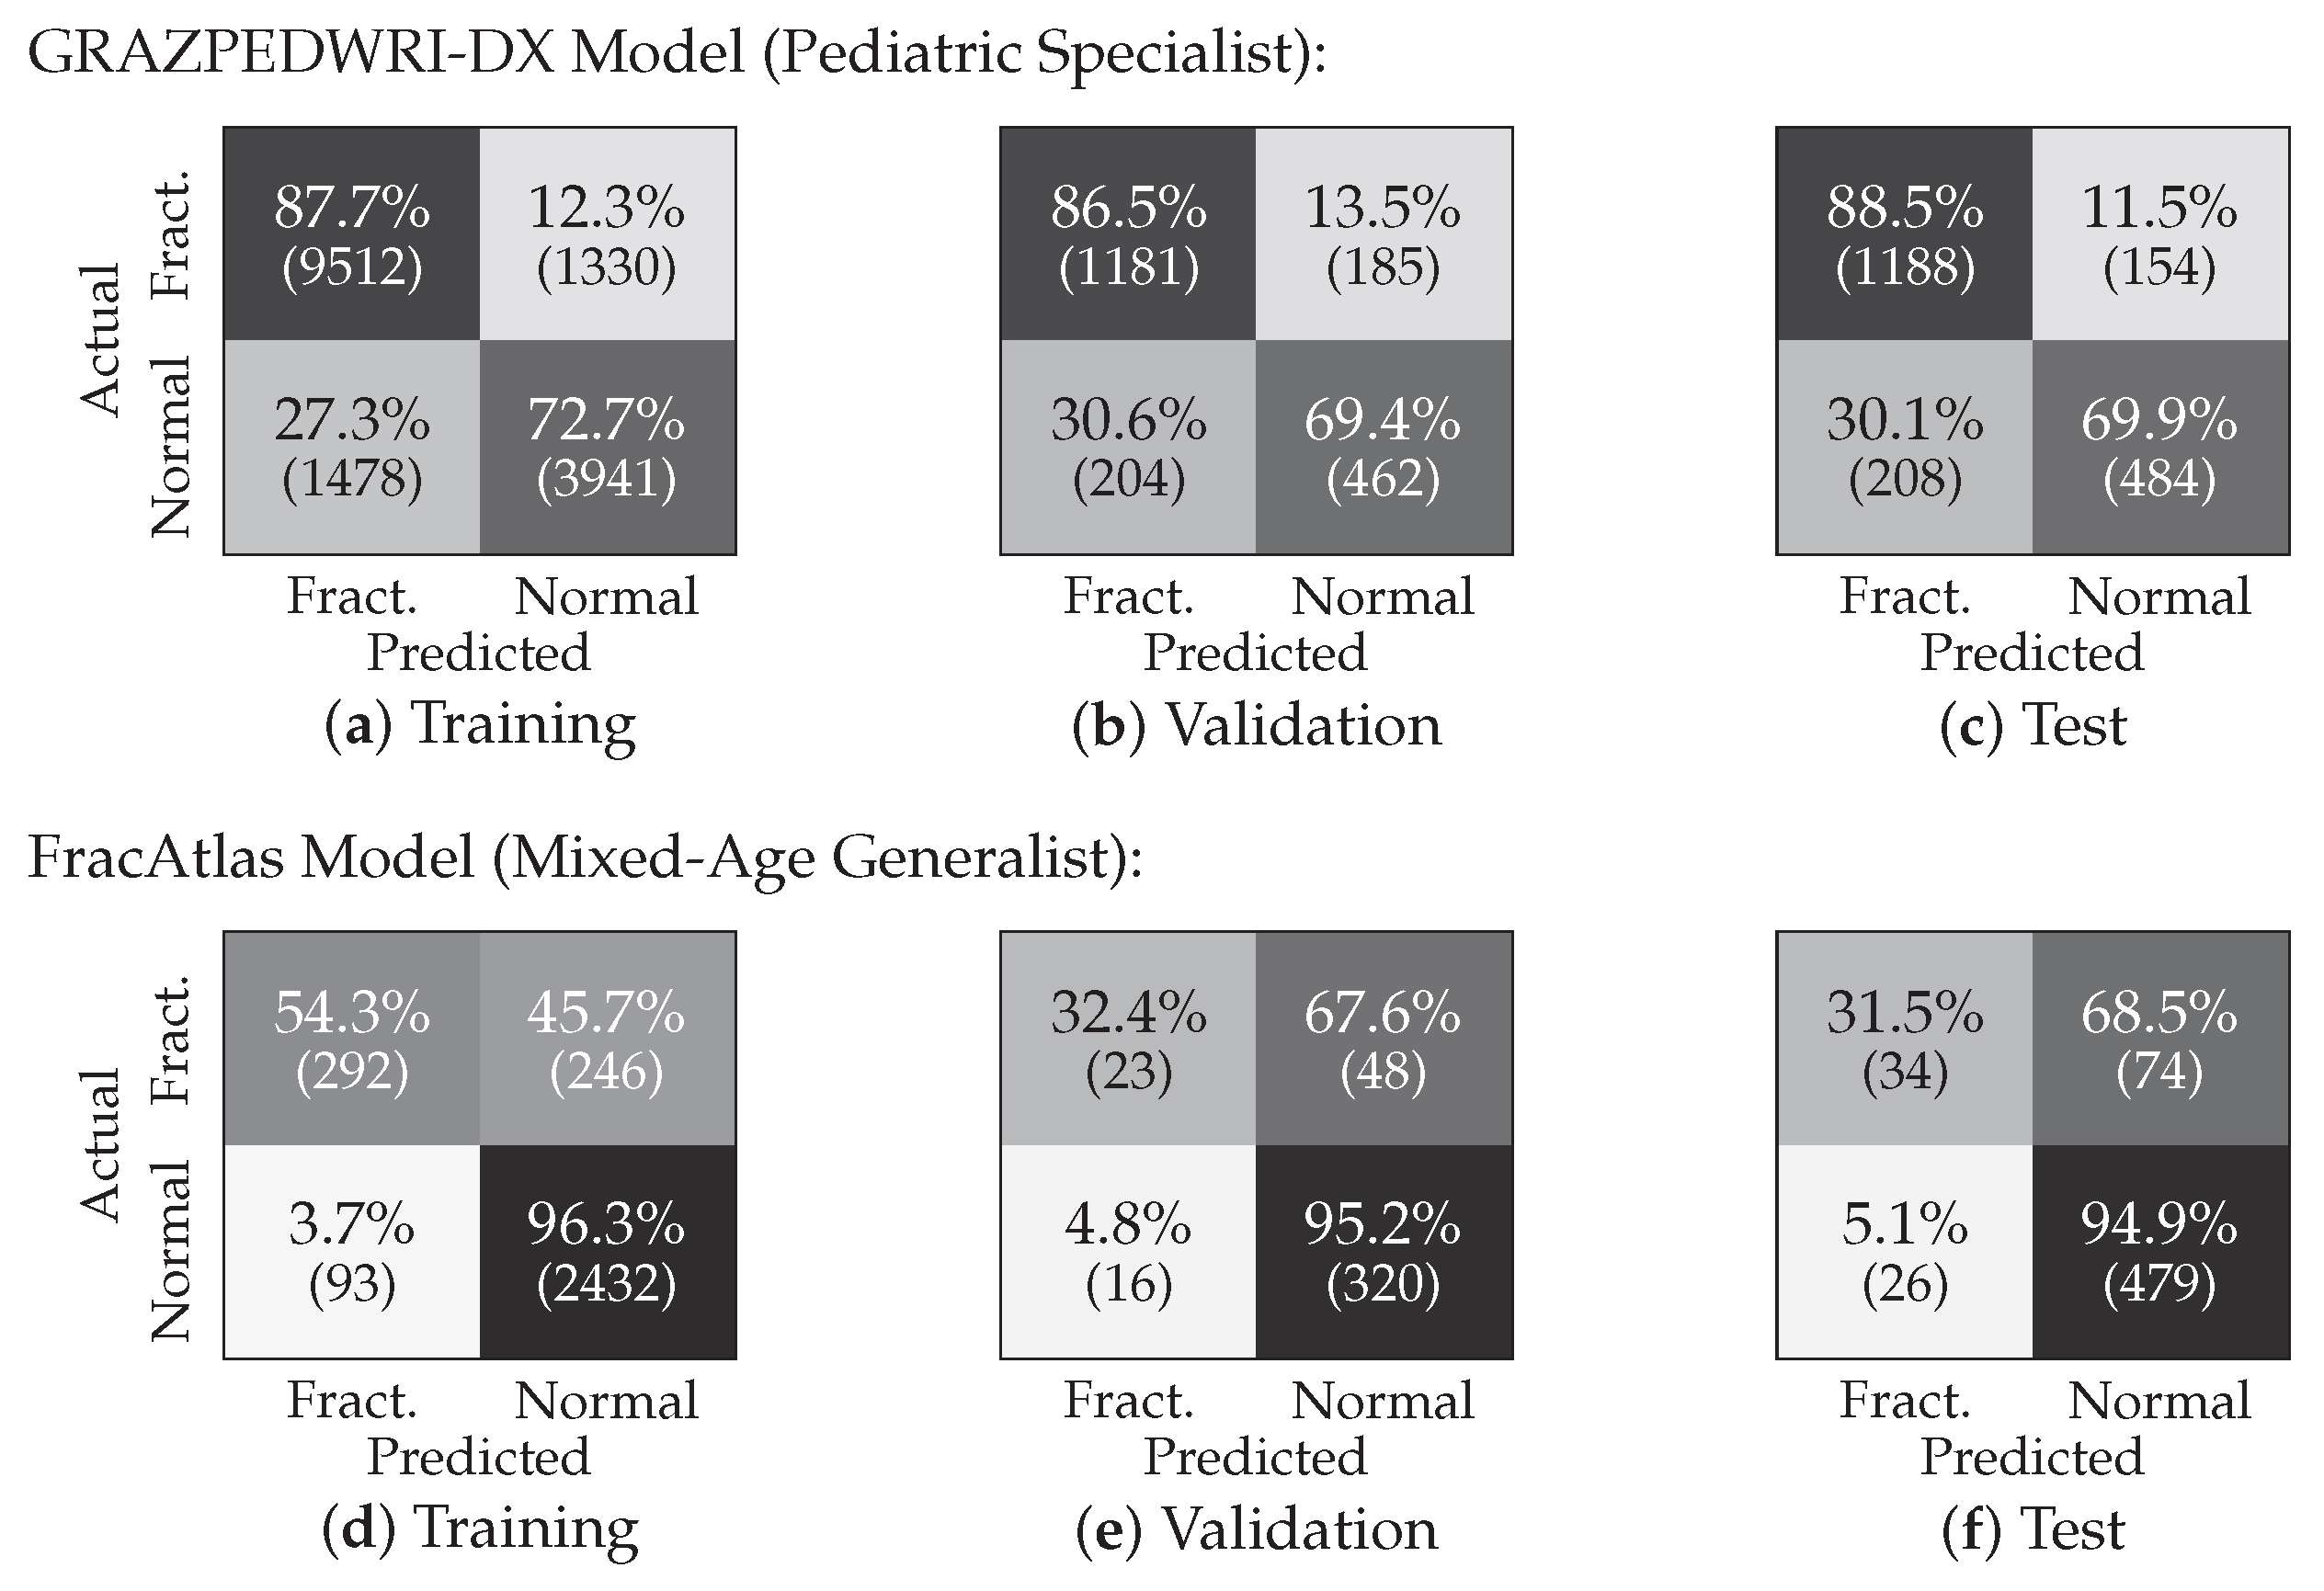
Figure 4 presents the confusion matrices for both ResNet-50 classifiers evaluated on their respective home datasets across training, validation, and test partitions. The top row displays results for the pediatric specialist model trained on GRAZPEDWRI-DX, while the bottom row shows results for the mixed-age generalist model trained on FracAtlas.
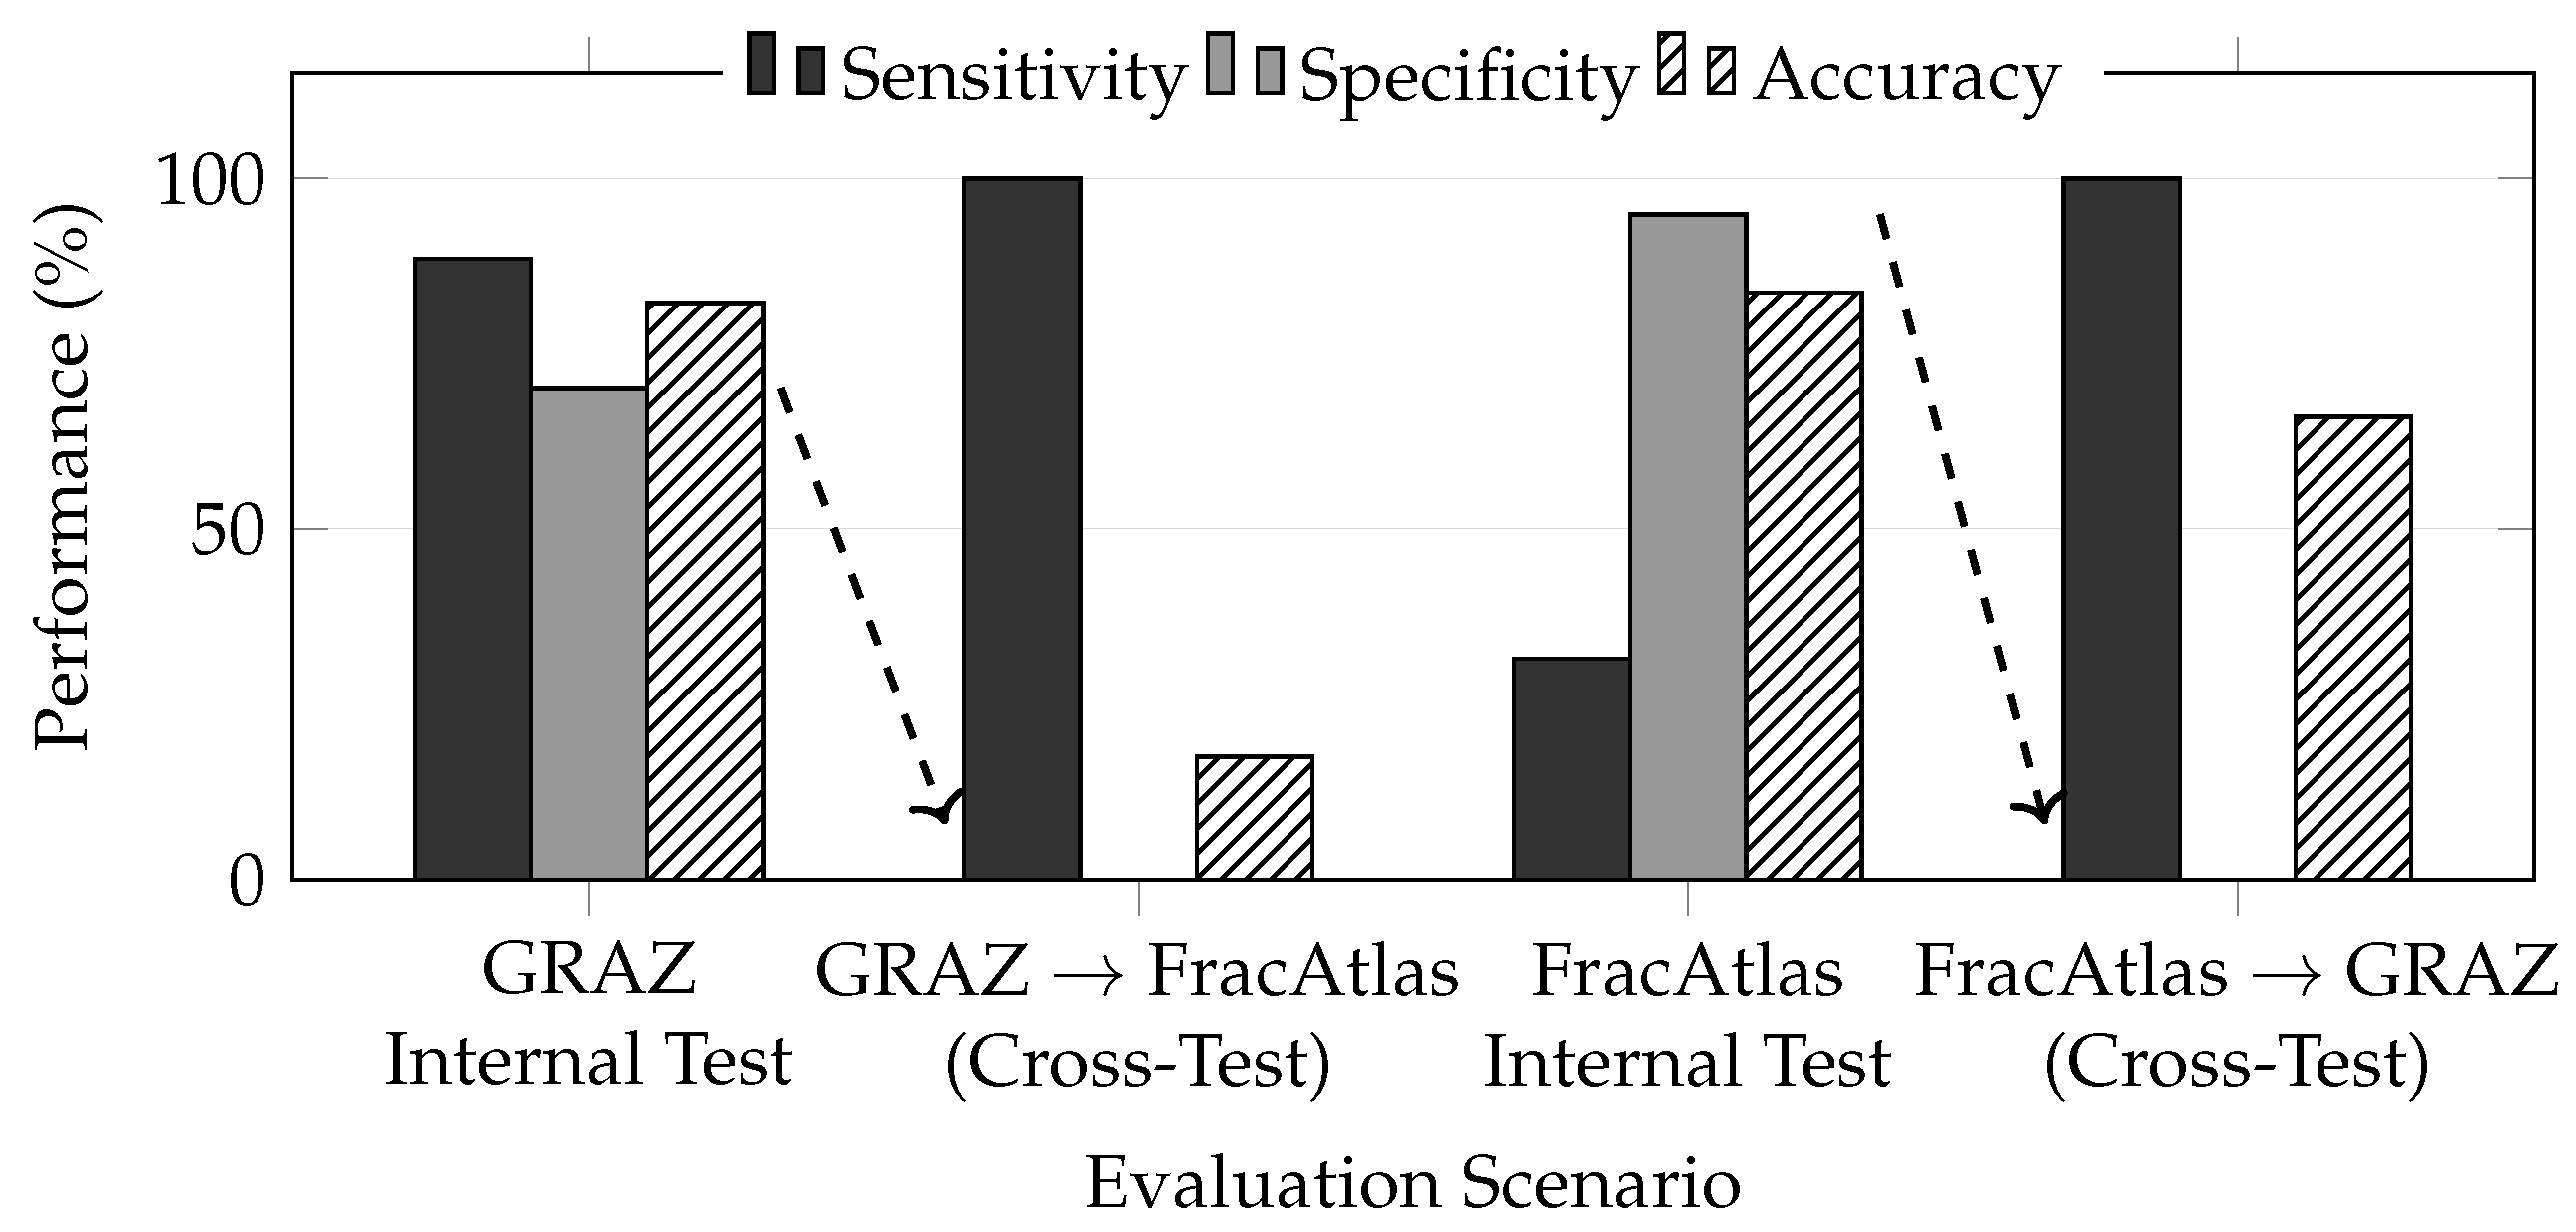
The GRAZPEDWRI-DX model demonstrated consistent performance across all internal partitions, achieving 88.5% sensitivity for fracture detection on the held-out test set with 69.9% specificity for normal case identification. The training partition exhibited slightly lower specificity (72.7%) compared to test performance, suggesting appropriate regularization without substantial overfitting. Validation metrics closely approximated test set performance, indicating reliable hyperparameter selection during model development.
The FracAtlas model exhibited a markedly different classification pattern characterized by high specificity but reduced sensitivity. On the internal test set, the model correctly identified 94.9% of non-fractured cases while detecting only 31.5% of true fractures. This asymmetric performance pattern persisted across all partitions, with training sensitivity reaching 54.3% before declining to 32.4% on validation and 31.5% on test data. The substantial gap between sensitivity and specificity reflects the class imbalance inherent in the adult radiograph dataset, where non-fractured cases substantially outnumber fracture cases.
Overall accuracy on internal test sets reached 82.2% for the GRAZPEDWRI-DX model and 83.7% for the FracAtlas model. These metrics confirm that both networks successfully learned discriminative features from their respective training distributions, establishing baseline competency prior to cross-dataset evaluation.
Table 1 presents extended performance metrics that provide threshold-independent assessment of classifier discrimination. The Matthews Correlation Coefficient (MCC) is particularly informative for binary classification evaluation because it incorporates all four confusion matrix quadrants and remains robust to class imbalance, producing a high score only when a classifier performs well on both positive and negative classes. The GRAZPEDWRI-DX model achieved an MCC of 0.56, indicating moderate but meaningful discrimination between fractured and non-fractured pediatric wrist radiographs. The FracAtlas model achieved a lower MCC of 0.34, reflecting its asymmetric performance profile with high specificity but poor sensitivity. Diagnostic likelihood ratios further characterize clinical utility: a positive likelihood ratio (LR+) greater than 1 indicates that a positive test result increases the probability of disease, while a negative likelihood ratio (LR-) less than 1 indicates that a negative result decreases disease probability. The GRAZPEDWRI-DX model exhibited LR+ of 2.94 and LR- of 0.16, suggesting moderate diagnostic value in both directions. The FracAtlas model showed higher LR+ (6.10) but substantially weaker LR- (0.72), consistent with its specificity-dominant classification pattern, where positive predictions carry greater confidence than negative predictions. Notably, the two models exhibit opposite calibration profiles: the GRAZPEDWRI-DX model is sensitivity-dominant (88.52% sensitivity vs. 69.94% specificity), while the FracAtlas model is specificity-dominant (31.48% sensitivity vs. 94.85% specificity). This distinction becomes important when interpreting cross-testing failure modes in subsequent sections.
3.2. Quantitative Performance Metrics
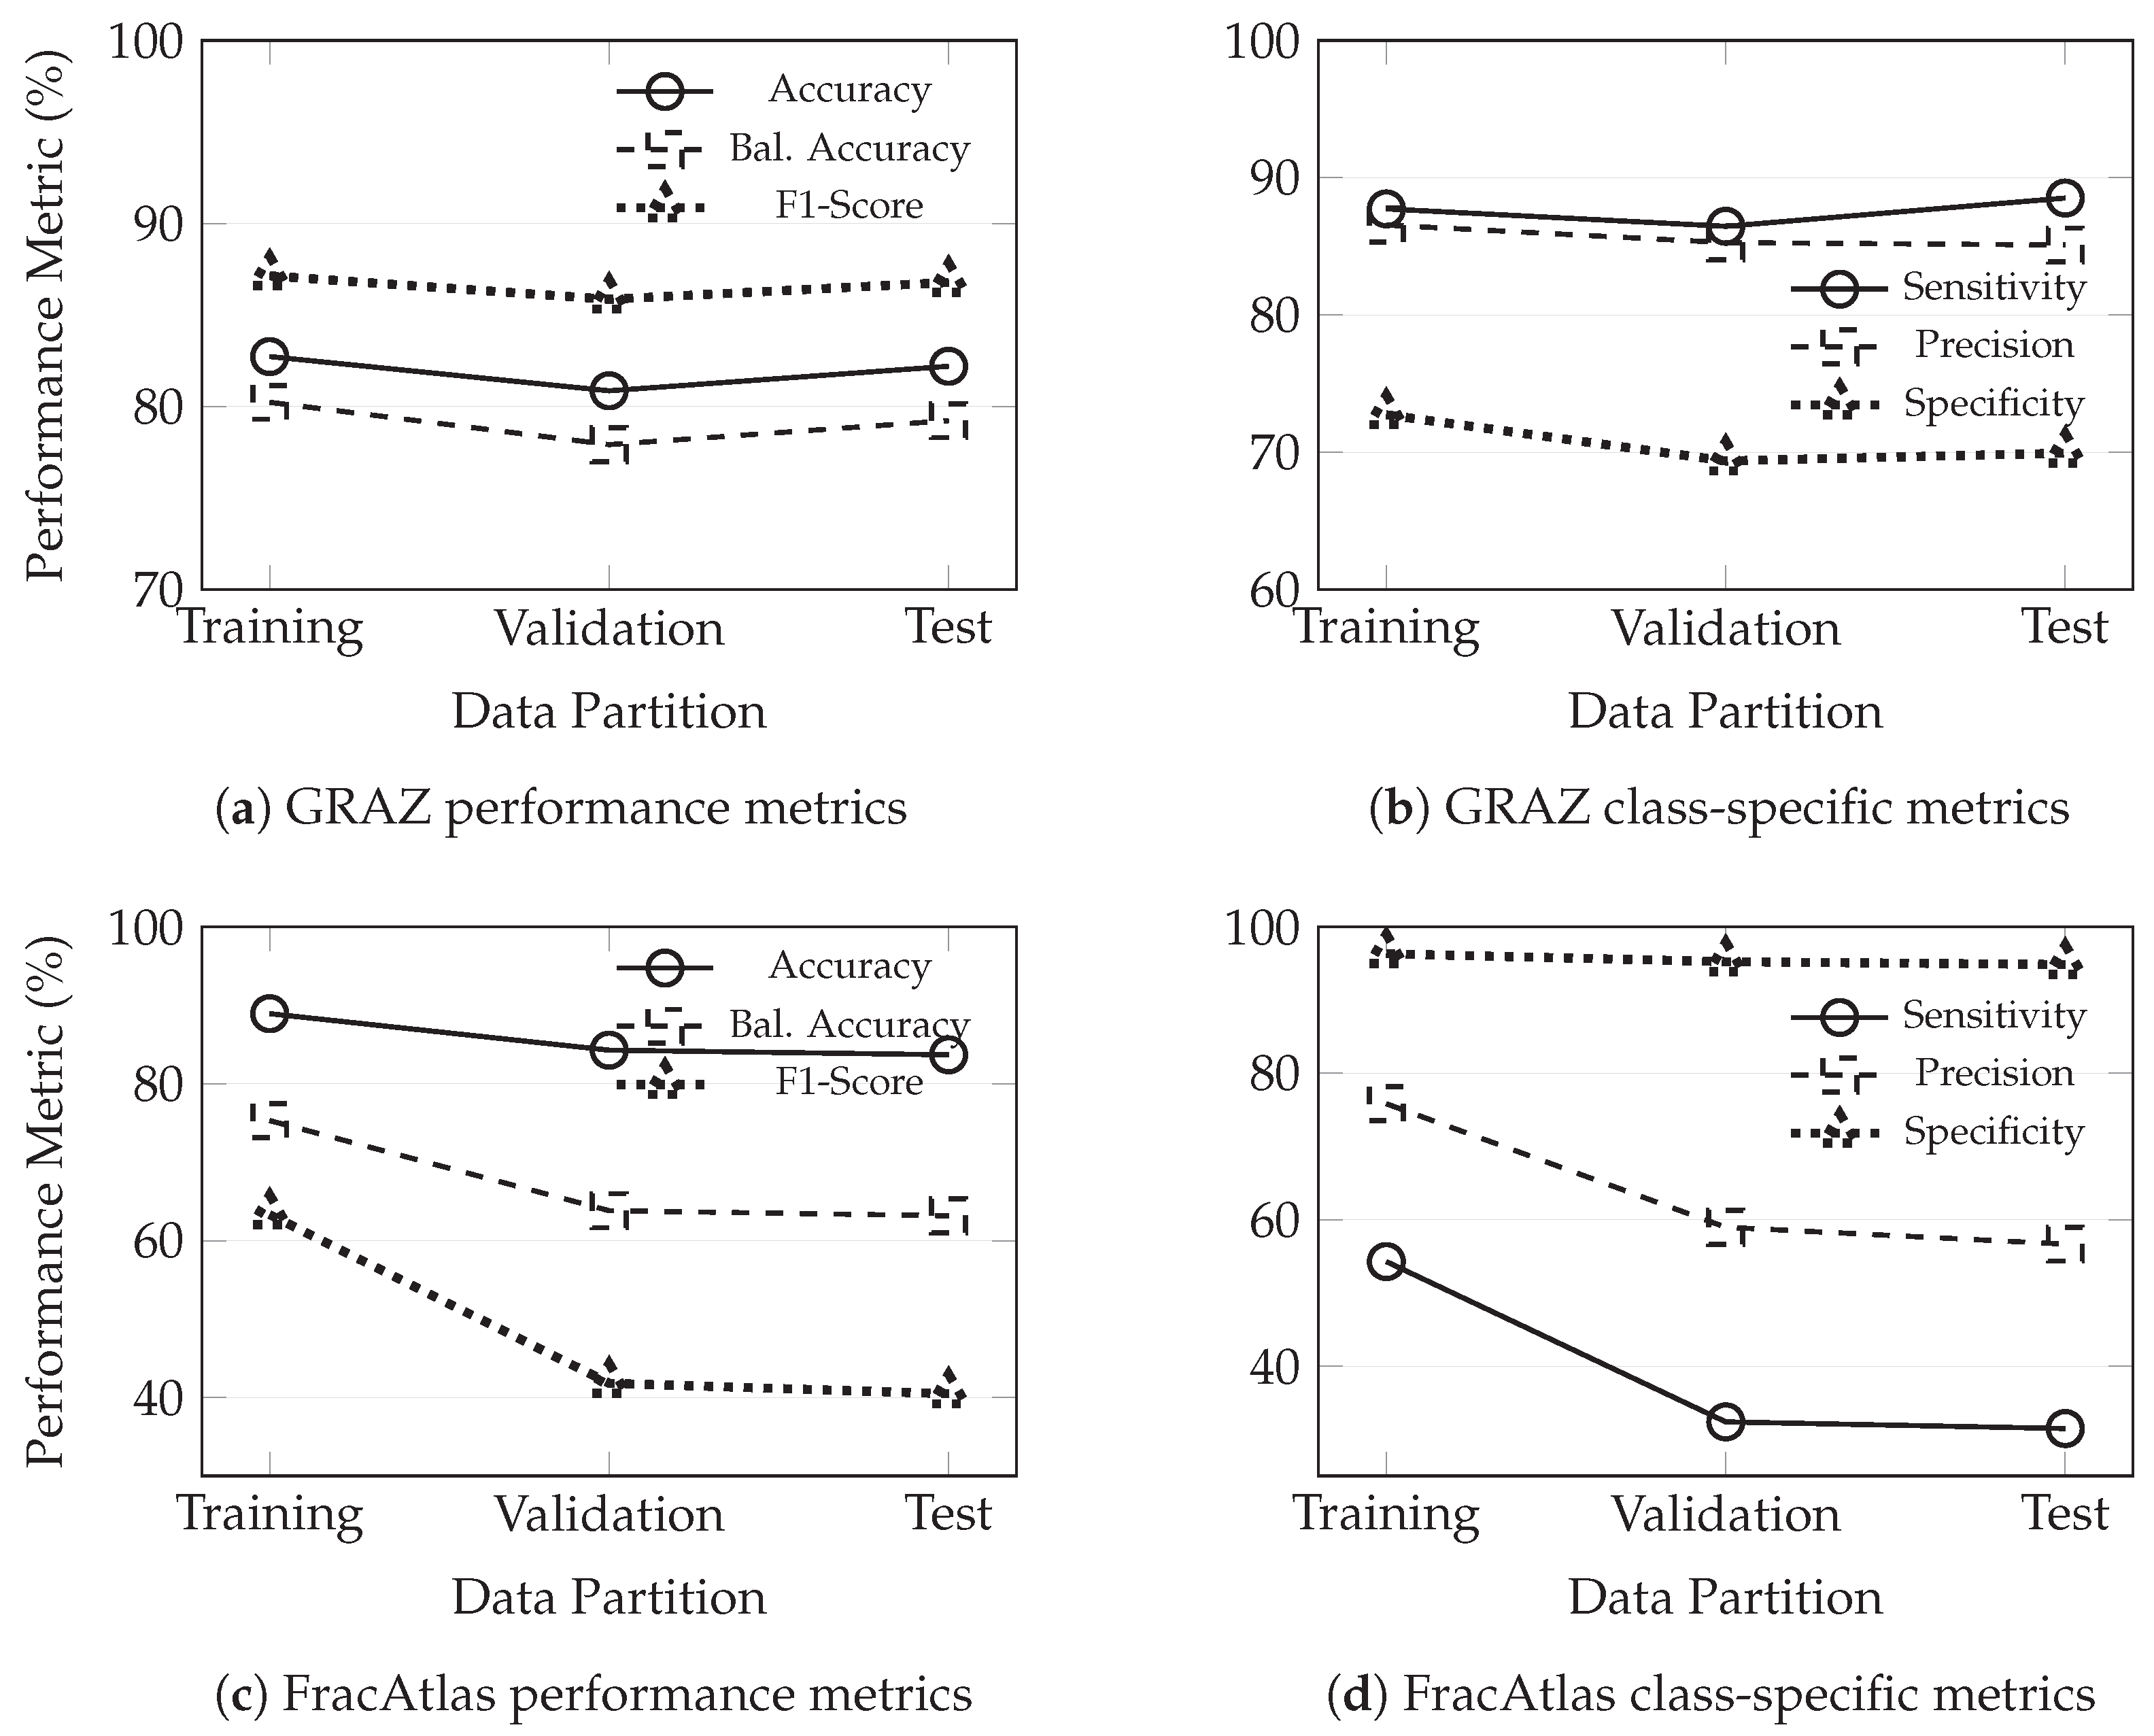
Figure 5 presents the comprehensive performance metrics calculated from the confusion matrices for both ResNet-50 classifiers across training, validation, and test partitions. These metrics provide complementary perspectives on classification performance beyond the raw confusion matrix values presented in
Figure 4.
The GRAZPEDWRI-DX model (pediatric specialist) demonstrated consistent and balanced performance across all evaluation partitions, as shown in
Figure 5a,b. Overall accuracy ranged from 80.86% on the validation set to 82.73% on the training set, with test accuracy of 82.20%. The F1-score, which harmonizes precision and recall, remained stable between 85.86% and 87.14% across partitions, indicating robust fracture-detection capability. Sensitivity exceeded 86% across all partitions, reaching 88.52% on the test set, while specificity remained moderate at approximately 70%. Precision values consistently exceeded 85%, suggesting that positive predictions carried high confidence.
The FracAtlas model (mixed-age generalist) exhibited markedly different performance characteristics, as illustrated in
Figure 5c,d; while overall accuracy appeared acceptable (83.69% on test), the balanced accuracy of 63.17% revealed substantial performance asymmetry between classes. The most striking observation was the pronounced decline in sensitivity from 54.28% during training to 31.48% on the test set, indicating that the model failed to detect approximately two-thirds of true fractures in held-out data. Conversely, specificity remained exceptionally high (94.85% on test), demonstrating reliable identification of non-fractured cases. The F1-score declined substantially from 63.31% during training to 40.48% on the test set, reflecting the progressive deterioration of fracture detection capability.
Both models demonstrated the expected generalization hierarchy, with metrics generally declining from training through validation to test partitions. The FracAtlas model exhibited steeper decline curves, particularly for sensitivity and F1-score, suggesting greater susceptibility to overfitting or insufficient representation of fracture-positive features in the training data.
3.3. Training Dynamics and Convergence Behavior
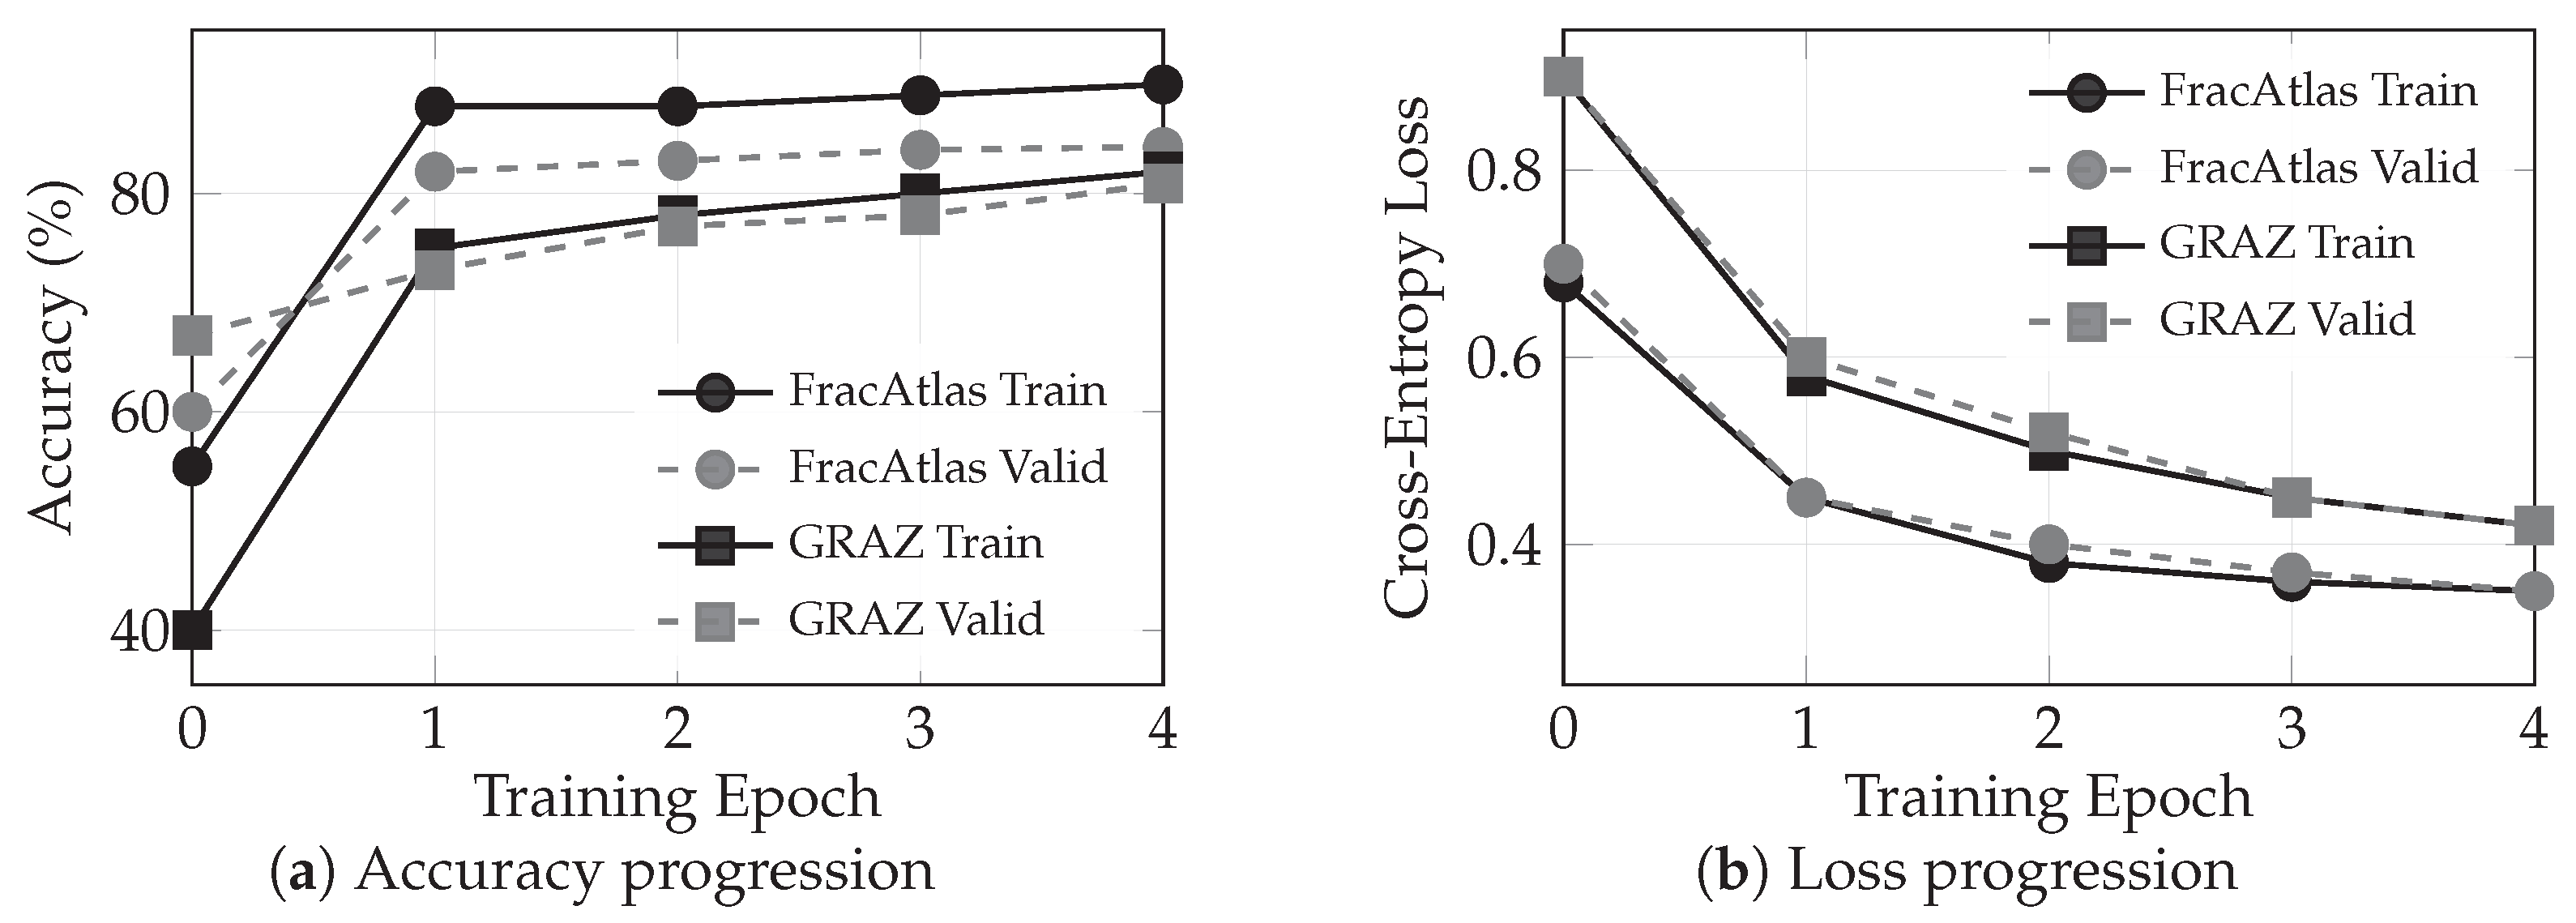
Figure 6 presents the learning curves for both ResNet-50 classifiers, illustrating the progression of accuracy and loss metrics across four training epochs. These curves provide insight into model convergence behavior and the relationship between training and validation performance throughout the optimization process.
The FracAtlas model (mixed-age generalist) demonstrated rapid initial convergence, with training accuracy rising from 55% to 88% within the first epoch before stabilizing at approximately 90% by training completion, as shown in
Figure 6a. Validation accuracy followed a similar trajectory, increasing from 60% to 82% in the first epoch and reaching a final value of 84.28%. The training–validation accuracy gap remained narrow throughout training, measuring approximately 5.7 percentage points at convergence. The loss curves in
Figure 6b corroborate this convergence pattern, with both training and validation loss decreasing monotonically from initial values near 0.70 to final values of approximately 0.35.
The GRAZPEDWRI-DX model (pediatric specialist) exhibited a more gradual learning trajectory. Training accuracy increased from 40% to 75% during the first epoch and continued rising to 82% by training completion. Validation accuracy progressed from 67% to 80.91%, with the majority of improvement occurring in the first two epochs. The training–validation accuracy gap for this model measured approximately 1.1 percentage points at convergence, indicating tighter coupling between training and held-out performance. Loss values decreased from 0.90 to 0.42 for both training and validation, with near-perfect overlap between the two curves throughout the training process.
Both models completed training within the allocated four epochs, with the FracAtlas model requiring 380 total iterations (46 min 58 s) and the GRAZPEDWRI-DX model requiring 508 iterations (249 min 43 s). The difference in training duration reflects the larger dataset size of GRAZPEDWRI-DX rather than differences in convergence efficiency. Neither model exhibited signs of overfitting, as validation metrics continued improving or remained stable throughout training without divergence from training metrics.
3.4. External Cross-Testing Results
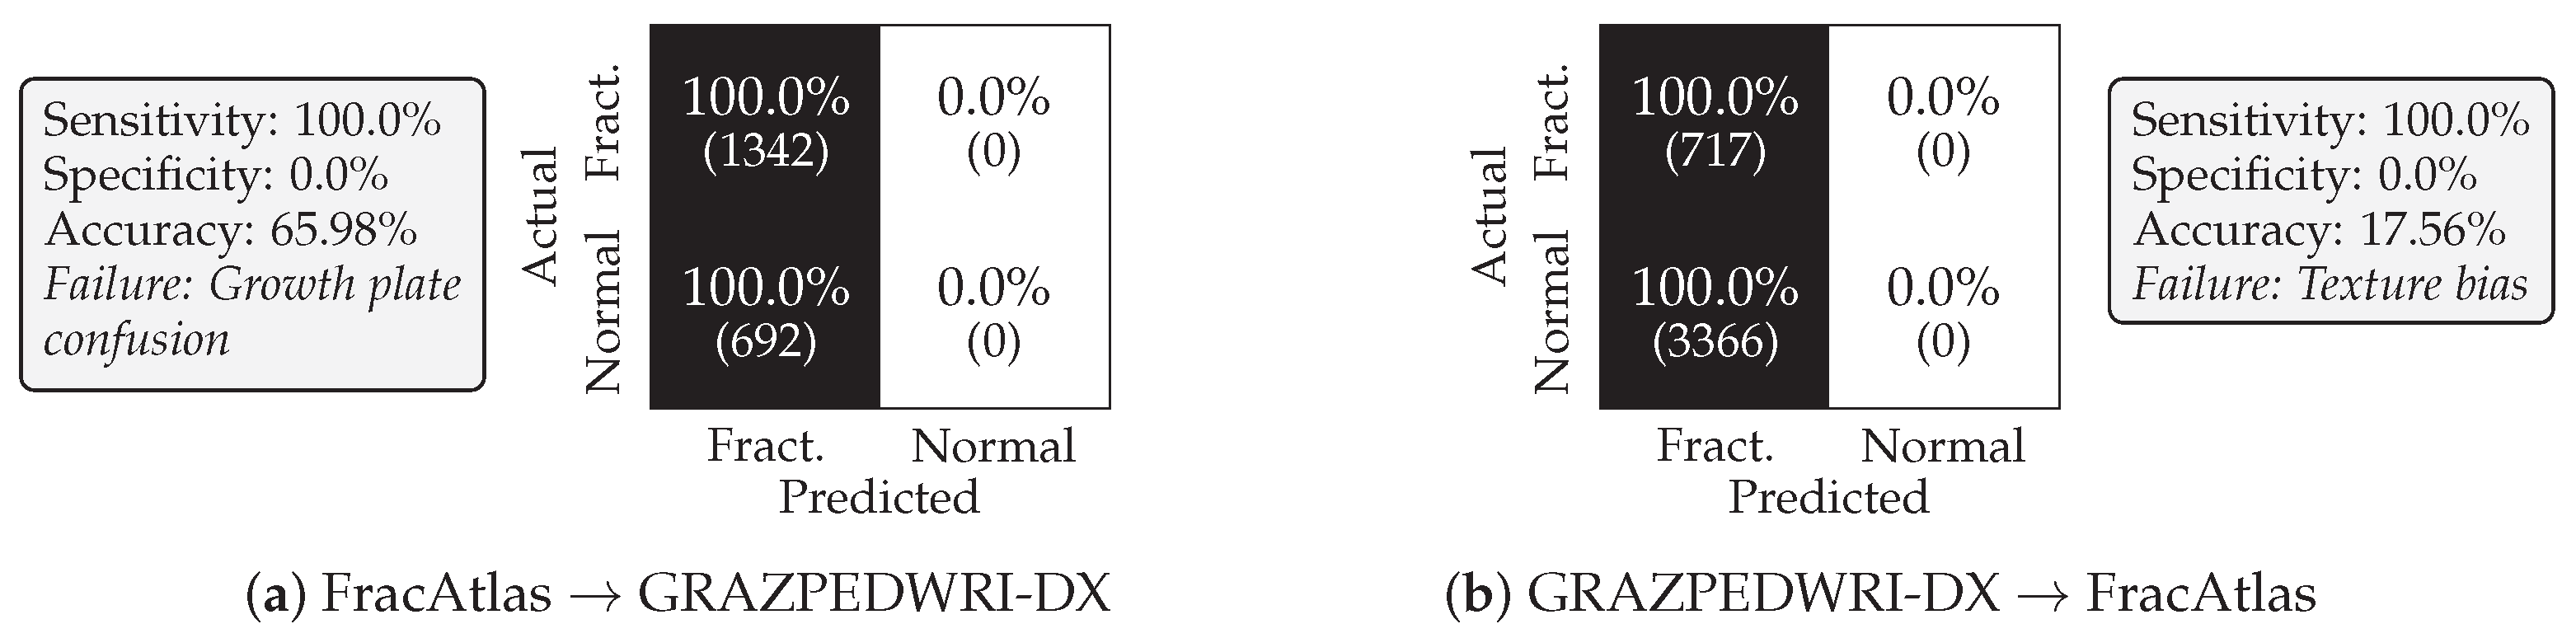
External validation through cross-dataset testing revealed complete generalization failure for both models, as documented in
Figure 7. When evaluated outside their respective training distributions, both classifiers collapsed into degenerate prediction modes characterized by universal positive classification.
The FracAtlas model (FracAtlas-trained) was evaluated on the complete GRAZPEDWRI-DX pediatric wrist dataset comprising 2034 images. As shown in
Figure 7a, the model classified every image as fractured, including all 692 non-fractured cases. This resulted in 100% sensitivity but 0% specificity, with overall accuracy of 65.98% attributable entirely to the dataset’s class distribution rather than discriminative capability. The model’s failure to identify any negative cases indicates a fundamental inability to recognize normal pediatric skeletal anatomy.
The GRAZPEDWRI-DX model (pediatric-trained) exhibited identical collapse when evaluated on the FracAtlas mixed-age dataset containing 4083 images across seven anatomical subgroups. As illustrated in
Figure 7b, the model predicted fracture for every image, misclassifying all 3366 non-fractured cases while correctly identifying all 717 true fractures by default. The resulting 100% sensitivity and 0% specificity yielded an overall accuracy of only 17.56%, substantially below the chance performance level for a balanced binary classifier.
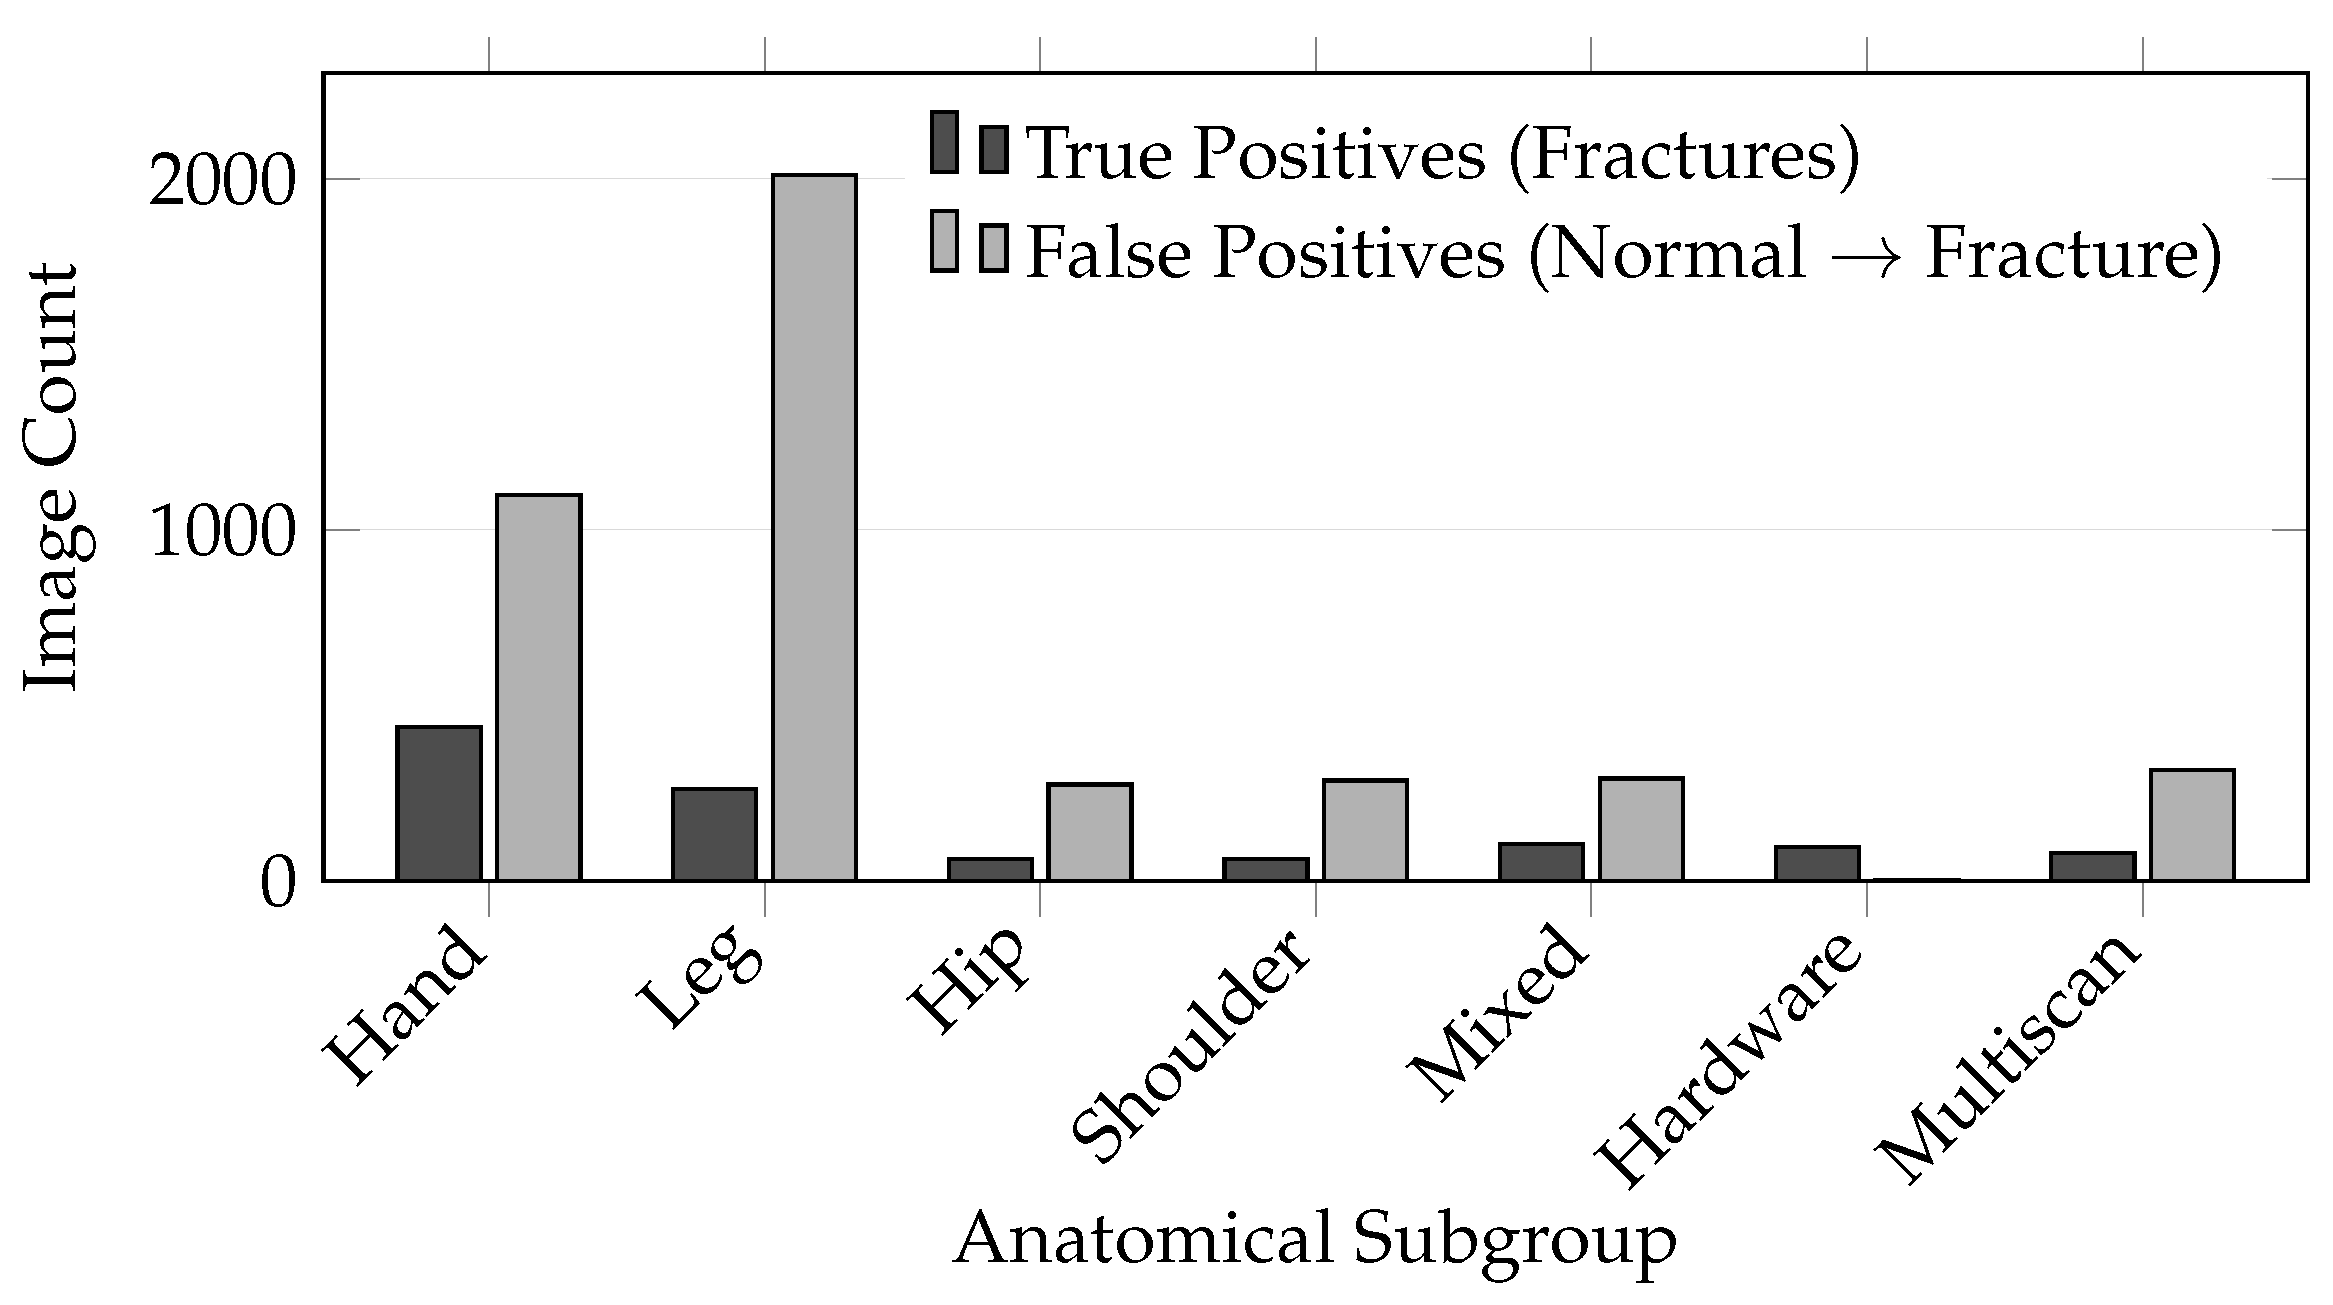
Figure 8 and
Table 2 provide a detailed breakdown of the GRAZPEDWRI-DX model performance across anatomical subgroups within the FracAtlas dataset. The FracAtlas annotation scheme permits non-mutually exclusive subgroup assignments: the four anatomical regions (hand, leg, hip, shoulder) may overlap with acquisition-based categories (mixed, hardware, multiscan), as images containing orthopedic hardware or composite multi-region scans retain their primary anatomical classification. Consequently, subgroup counts exceed the dataset total of 4083 unique images. The uniform 100% sensitivity and 0% specificity pattern persisted across all seven anatomical categories, confirming that the generalization failure was systematic rather than region-specific.
Figure 9 quantifies the magnitude of performance degradation from internal to external evaluation. The GRAZPEDWRI-DX model’s specificity dropped from 69.94% on internal testing to 0% on cross-testing, representing complete loss of negative class discrimination. Similarly, the FracAtlas model’s specificity declined from 94.85% to 0%. Both models exhibited paradoxical sensitivity increases to 100% during cross-testing, an artifact of the all-positive prediction strategy rather than improved fracture-detection capability.
The completeness and uniformity of this collapse pattern provides evidence that the failure reflects a fundamental breakdown in transferable representation rather than simple threshold miscalibration or a shift in output distribution. Several observations support this interpretation. First, both models maintained balanced prediction distributions on their respective internal test sets, demonstrating functional decision boundaries within their training domains. Second, the collapse to identical degenerate behavior (100% sensitivity, 0% specificity) occurred symmetrically for both models despite their markedly different internal calibration profiles; the GRAZPEDWRI-DX model exhibited sensitivity-dominant classification while the FracAtlas model exhibited specificity-dominant classification. Third, the all-positive prediction pattern persisted uniformly across all seven anatomical subgroups in the FracAtlas dataset (
Table 2), including regions with substantially different class distributions. If the failure were attributable to threshold drift or calibration mismatch, we would expect graded degradation and subgroup-dependent variation rather than universal binary collapse. The observed pattern is instead consistent with models learning dataset-specific shortcuts (such as pediatric growth plate morphology or adult trabecular texture patterns) that become categorically misleading when applied to the opposing population.
3.5. Grad-CAM Explainability Analysis
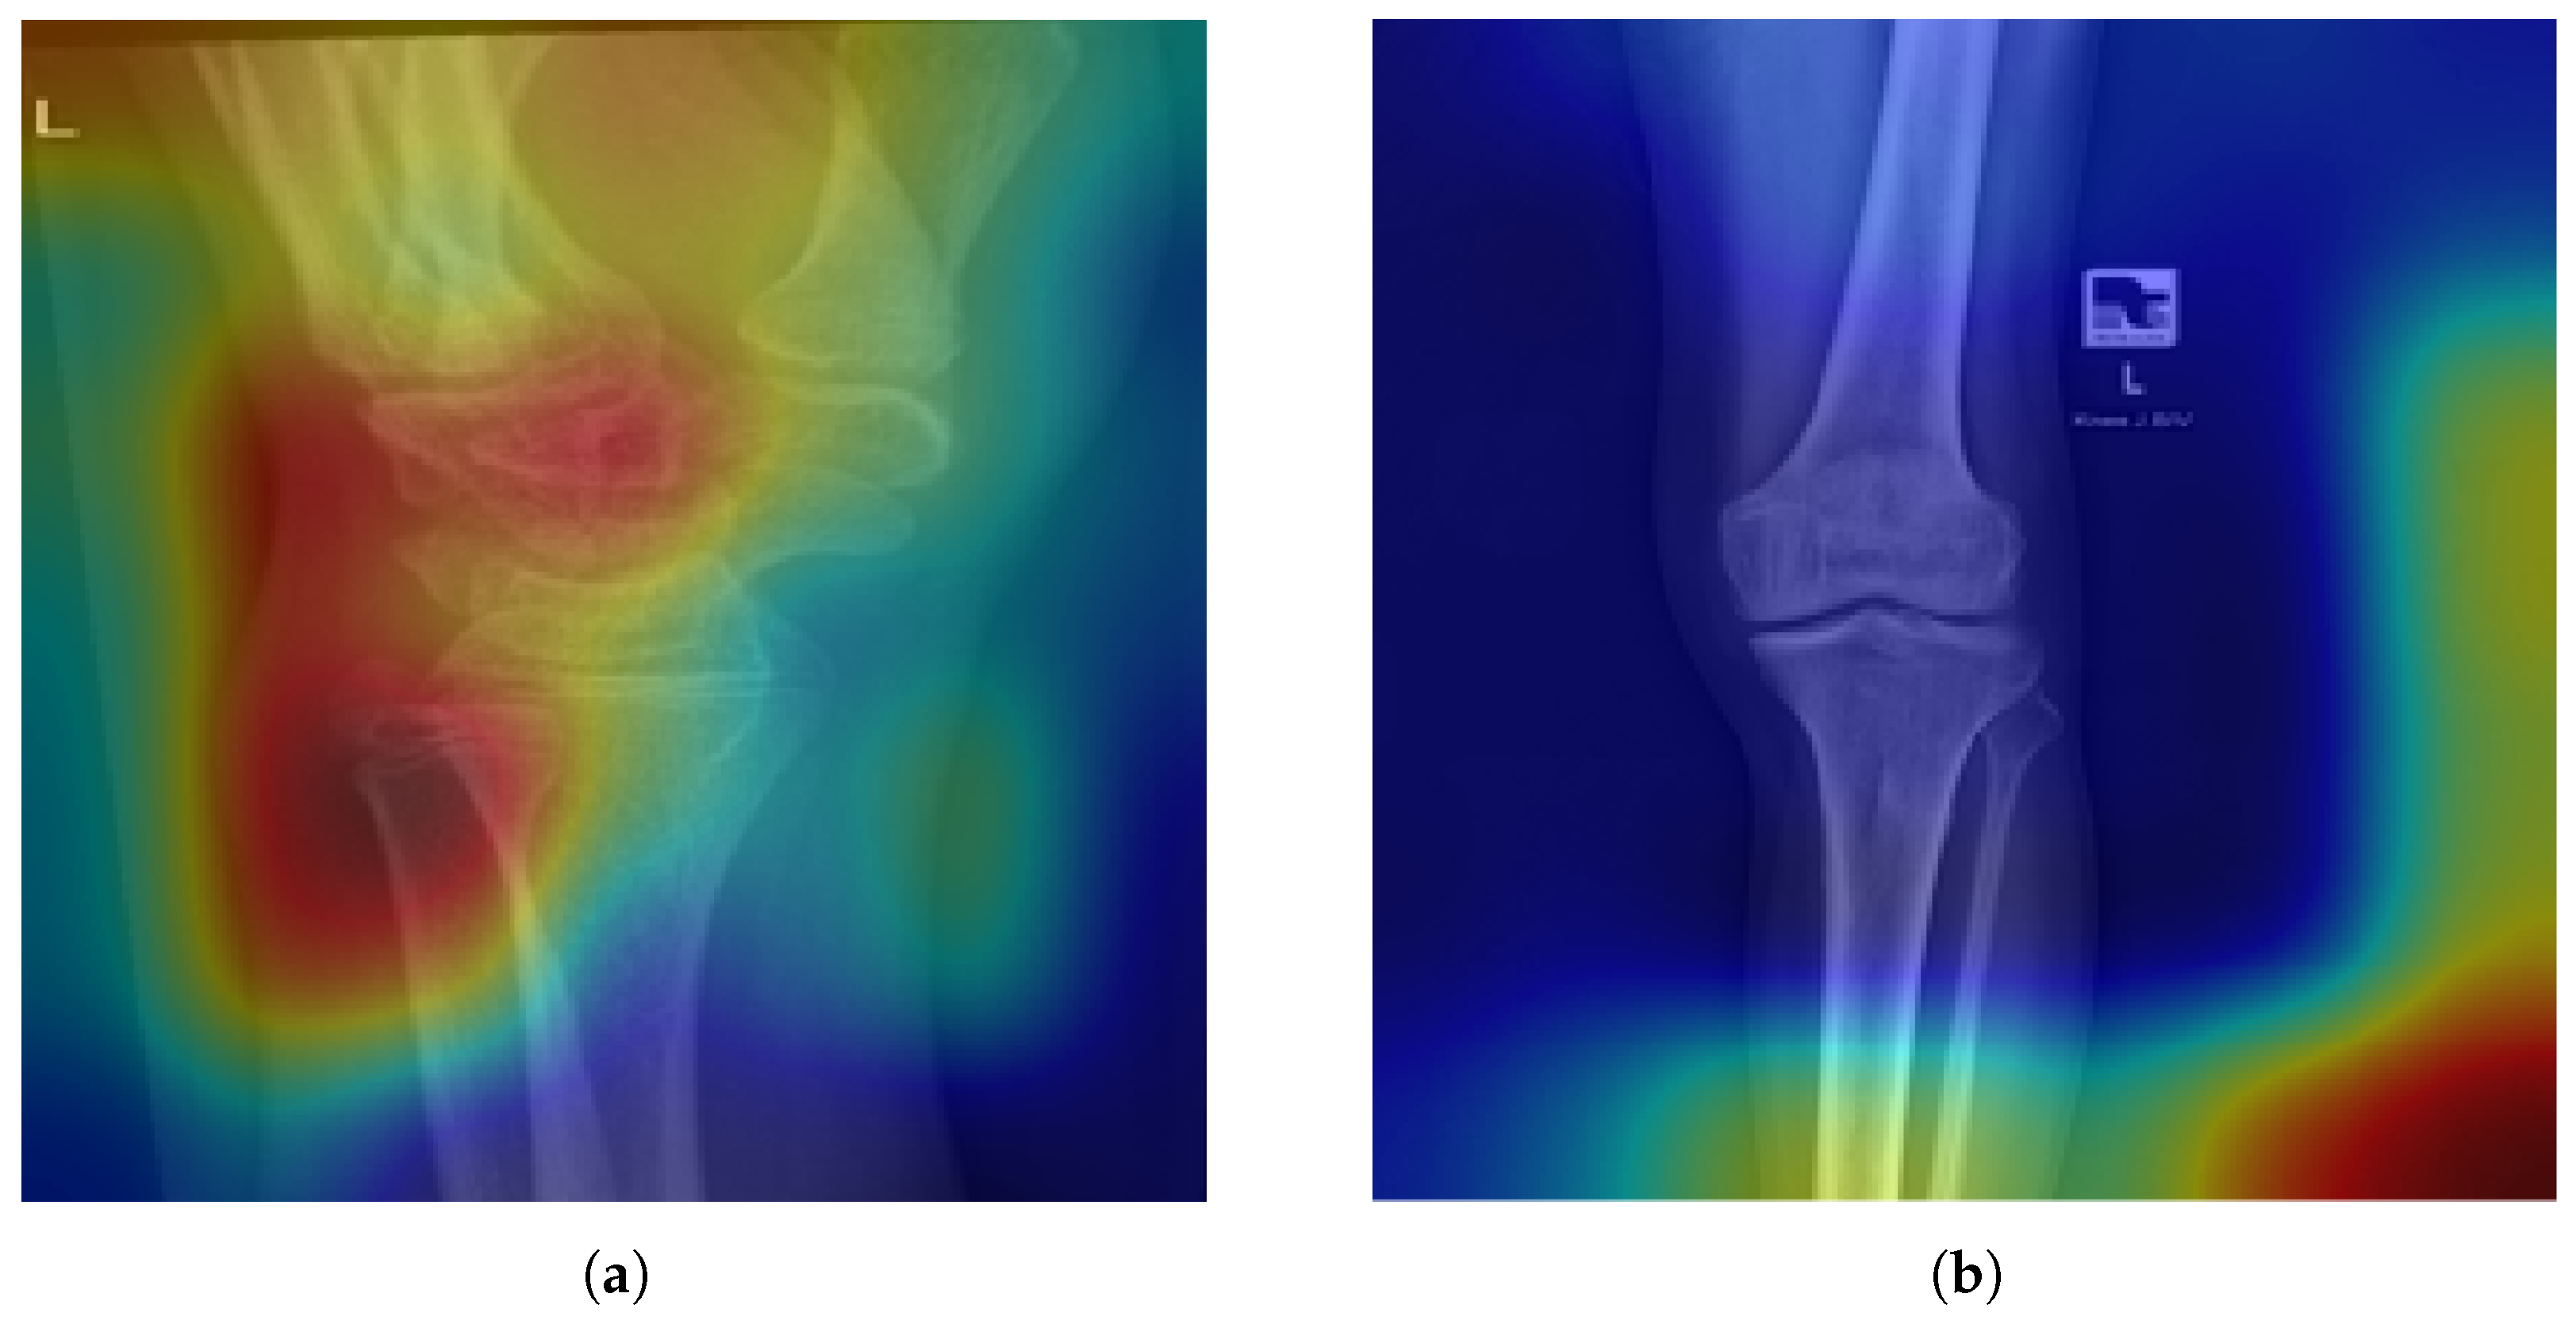
To investigate the mechanistic basis of cross-dataset generalization failure, Grad-CAM (Gradient-weighted Class Activation Mapping) visualizations were generated for representative misclassified cases.
Figure 10 presents activation heatmaps, revealing the image regions most influential in driving erroneous fracture predictions.
The FracAtlas model (FracAtlas-trained) exhibited concentrated activation over the distal radial physis when applied to normal pediatric wrist radiographs, as shown in
Figure 10a. This growth plate structure, characterized by a transverse radiolucent band, was systematically misinterpreted as a fracture line, explaining the model’s universal positive predictions on pediatric data.
The GRAZPEDWRI-DX model (pediatric-trained) demonstrated diffuse activation patterns when applied to adult radiographs, with attention concentrated on image boundaries and background regions rather than anatomical structures, as illustrated in
Figure 10b. This texture bias suggests the model learned acquisition-specific features from the homogeneous pediatric wrist dataset that triggered false positive responses when confronted with the heterogeneous imaging characteristics of multi-site adult data.
The Grad-CAM visualizations presented represent selected cases illustrating the dominant failure patterns observed during qualitative review. Future work should include statistical characterization of Grad-CAM distributions across case categories to substantiate the qualitative patterns described here. Additionally, subgroup analysis of FracAtlas hand images would clarify whether the texture bias observed in GRAZPEDWRI-DX model predictions persists when anatomical similarity to the training domain is greater; such analysis was not conducted in the present study.
4. Discussion
4.1. Comparison with Prior External Validation Studies
The complete specificity collapse observed in our cross-testing experiments represents an extreme manifestation of generalization failures documented in the medical AI literature; while prior studies report moderate degradation (such as 24 percentage point specificity reductions [
23] or declines from 94% to 70% [
22]), our results demonstrate that cross-population transfer can produce total discrimination failure. This aligns with Maleki et al.’s findings, wherein a pneumonia classifier achieving 98.7% internal accuracy correctly identified only 3.8% of external healthy samples [
24], confirming that certain distribution shifts trigger catastrophic failure modes.
The cross-population generalization barrier has precedent in prior research. Studies achieving 90.5% accuracy on pediatric supracondylar fractures [
30] typically lack external validation against adult populations. The diagnostic challenge posed by pediatric growth plates has been documented, with CNN-based systems achieving only 85% accuracy on pediatric distal radius fractures due to physis–fracture confusion [
18]. Our Grad-CAM analysis confirms this confound affects the FracAtlas-trained model, which misinterprets normal physes as pathology. The pediatric-trained model exhibited a distinct failure mode characterized by texture bias rather than anatomical misinterpretation, attending to background regions and image boundary artifacts rather than skeletal structures when applied to adult radiographs.
4.2. Interpretation of Cross-Testing Failure
The complete failure of both models, irrespective of whether trained on one anatomical region or many, suggests that neither learned the abstract concept of bone fracture. Both models failed to acquire the foundational ability to identify what constitutes bone on a radiograph and subsequently to assess whether such bone exhibits structural discontinuity. This observation is particularly significant given the theoretical expectation that a model trained on multiple anatomical regions and diverse patient ages should generalize better to an unseen single region than a model trained on only one region would generalize to multiple unseen regions. The FracAtlas model—having been exposed to fractures across hand, leg, hip, shoulder, and other skeletal sites, and containing pediatric patients (ages 8 months to 7 years) with visible growth plates—should theoretically have developed more region- and age-invariant representations of fracture than the narrowly trained GRAZPEDWRI-DX model. The fact that physis–fracture confusion nonetheless occurred suggests the model failed to learn from its pediatric training examples in a way that would transfer to a purely pediatric test population. The fact that both models collapsed to identical all-positive prediction behavior, regardless of training breadth, indicates that neither extracted the universal radiographic signature of cortical discontinuity that defines fracture across all bony anatomy.
This failure cannot be attributed solely to anatomical region mismatch or patient age differences. A robust fracture-detection system should, at minimum, restrict its attention to skeletal structures when making predictions. The Grad-CAM visualizations confirm that neither model demonstrated this basic competency when confronted with unfamiliar populations: the mixed-age-trained model fixated on developmental structures irrelevant to fracture, while the pediatric-trained model attended to background texture rather than bone. These patterns indicate reliance on non-generalizable shortcuts rather than anatomically grounded diagnostic reasoning. Such shortcut learning is itself a critical finding warranting investigation, not merely a predictable consequence of applying a model outside its nominal specifications. If a fracture-detection algorithm functions only when test images closely resemble training images in population characteristics, this constitutes evidence that the model has encoded features irrelevant to the diagnostic task itself. Bone remains bone, and fracture remains fracture, across demographic boundaries; the inability of either model to recognize this fundamental invariance reveals a deeper limitation in how current deep learning systems acquire medical diagnostic concepts.
4.3. Implications for Object Detection Architectures
The classification-based approach employed here may not represent the optimal architecture for clinically deployable systems. Recent object-detection frameworks have demonstrated superior fracture localization performance: YOLOv8-based systems achieved robust accuracy on the GRAZPEDWRI-DX dataset [
31], hybrid MobileNetV3–YOLOv8 architectures showed high accuracy for tibial plateau fractures [
32], and YOLOv12 outperformed radiologists for lateral malleolar avulsion fractures [
33].
Object-detection approaches may offer advantages for cross-population generalization by forcing spatial localization rather than relying on global features encoding population-specific characteristics. Multi-task learning frameworks performing simultaneous classification and localization have shown promise for complex anatomical regions [
34], and whole-body trauma CT algorithms have successfully localized multiple fracture types [
35]. Whether localization-based approaches exhibit greater resilience to cross-population domain shifts remains an important question for future investigation.
4.4. Clinical Integration Considerations
Our findings have direct implications for clinical deployment of fracture detection AI. Current evidence suggests AI systems should function as complementary tools requiring clinical oversight. A study comparing BoneView AI against orthopedic surgeons found similar accuracy, yet concluded AI should remain supplementary due to false positive risks [
36,
37,
38]. Our results strengthen this recommendation by demonstrating that false positive rates can reach 100% on out-of-distribution populations.
Strategic frameworks for clinical AI integration emphasize model transparency and cross-institutional generalizability as deployment prerequisites [
13]. Multicenter training and GAN augmentation have been identified as strategies for improving robustness [
23]. However, systematic reviews continue to highlight that most research lacks independent external validation, compromising reliability estimates for diverse clinical settings [
39].
4.5. Methodological Recommendations
Our findings support the consensus that external validation should be mandatory for medical AI prior to clinical deployment. Only 6% of radiology AI studies include external validation [
20] and only 5% of small-dataset studies perform external testing [
21], indicating systematic methodological deficiency. Data leakage and improper feature selection represent additional methodological pitfalls that can artificially inflate internal performance estimates [
40]. The “shortcut learning” phenomenon, wherein models exploit acquisition biases rather than clinically meaningful features [
25,
41,
42], can only be detected through rigorous external validation [
43].
Meta-analyses of fracture detection studies found models consistently achieve over 90% sensitivity while suffering from substantial heterogeneity and high bias risk [
7,
44,
45,
46]. Even nominally successful models exhibit inconsistent performance across regions and hardware, supporting the need for multi-institutional, cross-population validation. Future studies should explicitly test generalization across demographic boundaries rather than relying on within-distribution test sets that may provide false assurance of clinical readiness.
4.6. Interpretation of Internal Classification Performance
The confusion matrices in
Figure 4 reveal fundamentally different learning strategies adopted by the two models, with significant implications for understanding how deep learning systems encode domain-specific knowledge and how such encoding may limit cross-population generalizability [
47,
48].
The GRAZPEDWRI-DX model exhibited balanced sensitivity and specificity across all partitions (training: 87.7%/72.7%; validation: 86.5%/69.4%; test: 88.5%/69.9%), suggesting generalizable features learned within the pediatric domain. The moderate false positive rate (30%) indicates slight positive prediction bias, possibly reflecting the model’s prior learning about wrist fracture prevalence in the pediatric population.
In contrast, the FracAtlas model demonstrated pronounced sensitivity–specificity asymmetry; while achieving 94.9% specificity on the test set, sensitivity remained at 31.5%, indicating most fractures were misclassified as normal. The sensitivity decline from training (54.3%) to test (31.5%) suggests fracture-positive features did not generalize well, potentially reflecting heterogeneity across anatomical regions.
The low sensitivity of the FracAtlas model on internal validation was not regarded as disqualifying for the cross-testing experiment because the primary research question concerned cross-population generalization rather than optimal within-domain performance. The model successfully learned to distinguish classes within its training distribution, as evidenced by above-chance accuracy and high specificity; the sensitivity–specificity imbalance reflects dataset class distribution rather than complete learning failure. For the purpose of establishing baseline cross-population transferability, the critical requirement was that each model achieve non-trivial internal discrimination, which both models satisfied despite differing metric profiles. Furthermore, the cross-testing failure manifested as specificity collapse rather than sensitivity collapse, indicating that internal sensitivity levels did not determine the nature of external failure. A robust fracture-detection system should be capable of recognizing what constitutes normal bone regardless of patient population; the inability of both models to do so, irrespective of their internal metric profiles, suggests neither had learned the foundational skill of distinguishing bone from non-bone as a prerequisite to fracture detection.
These patterns have direct clinical implications. The GRAZPEDWRI-DX classifier would function effectively as a screening tool minimizing missed fractures, while the FracAtlas classifier would be poorly suited for screening where missed diagnoses carry significant consequences. Both models achieved >80% accuracy, yet their divergent sensitivity–specificity profiles highlight that comparable accuracy values can mask fundamentally different classification behaviors.
The contrast between models also reflects dataset differences. GRAZPEDWRI-DX contains balanced class distributions focused on a single region, while FracAtlas exhibits substantial class imbalance favoring non-fractured cases, which is known to bias learning toward the majority class. The stability of metrics across partitions indicates appropriate regularization without substantial overfitting, providing a reliable foundation for interpreting cross-dataset experiments.
4.7. Interpretation of Performance Metric Patterns
The performance trajectories in
Figure 5 reveal fundamental differences in how the two models learned to distinguish fractured from non-fractured radiographs.
The GRAZPEDWRI-DX model achieved favorable sensitivity–specificity balance. High sensitivity (88.52% on test) indicates successful learning of discriminative features, while moderate specificity (69.94%) suggests tendency toward false positives, which are clinically preferable since missed fractures carry greater consequence than over-referrals. The narrow training–testing F1-score gap (0.36 percentage points) demonstrates good within-domain generalization.
The FracAtlas model presents a concerning profile despite acceptable accuracy. The disparity between accuracy (83.69%) and balanced accuracy (63.17%) highlights the danger of relying on single metrics for imbalanced datasets. High specificity (94.85%) coupled with low sensitivity (31.48%) indicates a conservative strategy defaulting to negative predictions, rendering the model unsuitable for screening where false negatives represent primary risk. The steep F1-score decline from training (63.31%) to testing (40.48%), i.e., a 22.83 percentage point reduction, suggests fracture-positive features were not robust representations.
These contrasting patterns illustrate how dataset characteristics influence learned representations. GRAZPEDWRI-DX, trained on a single region with consistent protocols, developed stable features generalizing well within-distribution. FracAtlas, confronting greater anatomical diversity and class imbalance, converged on a high-specificity strategy sacrificing sensitivity. These findings underscore the importance of evaluating systems using multiple complementary metrics [
49,
50] and inform expectations for cross-dataset generalization: models with balanced internal performance may maintain reasonable performance under distribution shifts, while those with extreme bias may collapse unpredictably.
4.8. Interpretation of Learning Dynamics
The learning curves in
Figure 6 reveal distinct optimization trajectories illuminating the relationship between dataset characteristics and model learning behavior.
The FracAtlas model exhibited characteristic transfer learning convergence with rapid initial gains (55% to 88% training accuracy in epoch one), reflecting the immediate utility of ImageNet-pretrained features for the mixed-age multi-region radiographs. The subsequent plateau indicates task-specific adaptation occurred early, with later epochs fine-tuning decision boundaries. The moderate training–validation gap of 5.7 percentage points suggests generalizable features with some overfitting.
The GRAZPEDWRI-DX model began from lower initial accuracy (40%), reflecting greater distributional distance between ImageNet images and pediatric wrist radiographs. The gradual trajectory with continuous improvement through all epochs suggests more extensive feature adaptation was required. The remarkably small training–validation gap of 1.1 percentage points indicates strong generalization, attributable to anatomical homogeneity supporting robust feature learning.
The loss curves provide complementary evidence: FracAtlas achieved lower absolute loss (0.35 versus 0.42), though lower loss does not necessarily imply superior clinical performance. Parallel descent of training and validation curves confirms neither classifier exhibited pathological behaviors such as oscillation or divergence.
These convergence characteristics inform generalization expectations: tight training–validation coupling, as with GRAZPEDWRI-DX, might enable more reliable transfer to external data. The absence of overfitting indicators validates the training configuration (learning rate 0.0001, 4 epochs, validation monitoring), successfully balancing task-relevant feature extraction with preserved generalization capacity [
49,
50].
4.9. Interpretation of Cross-Dataset Generalization Failure
The cross-testing results in
Figure 7,
Figure 8,
Figure 9,
Figure 10 and
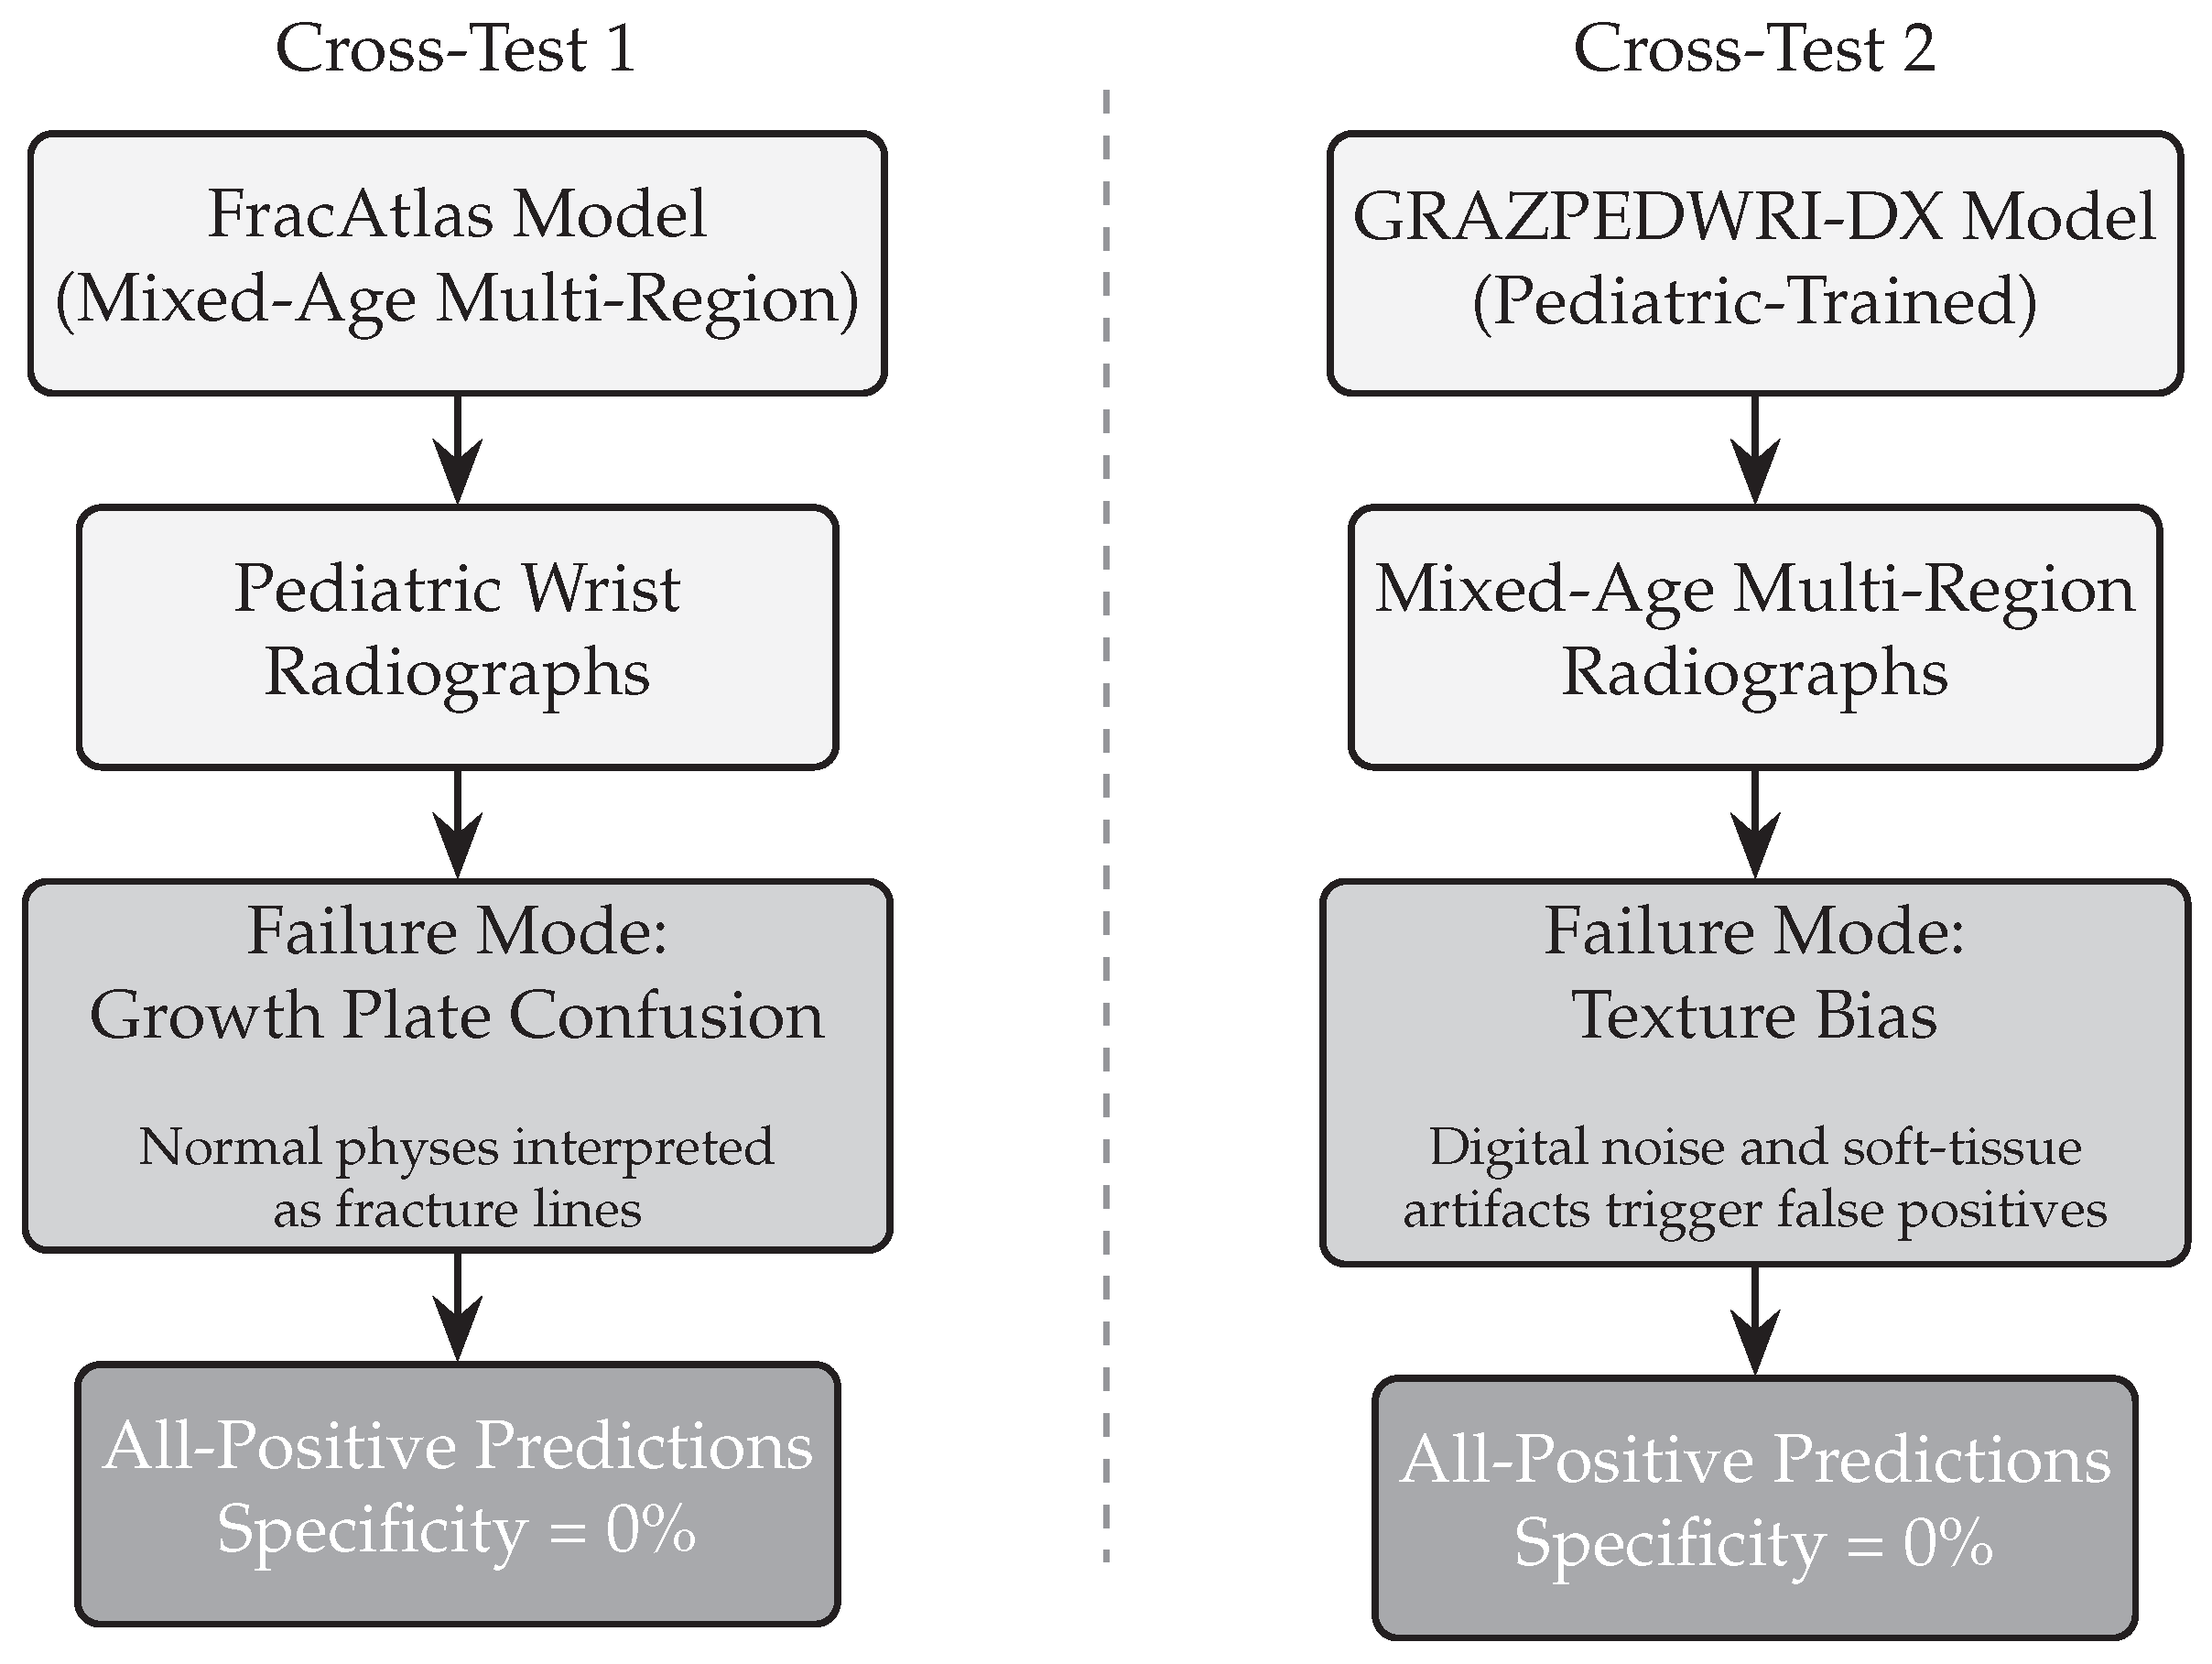
Figure 11 demonstrate catastrophic failure of both models to generalize beyond their training distributions, with profound implications for clinical deployment across patient populations.
The uniform collapse into all-positive prediction modes suggests neither network learned robust, transferable fracture representations. Both classifiers encoded population-specific features that triggered systematic false positive activation on out-of-distribution data, aligning with the concept of shortcut learning, wherein deep networks exploit spurious correlations rather than causally relevant features.
The FracAtlas model’s failure stems from pediatric growth plates (physes), i.e., cartilaginous structures resembling fracture lines that are absent in skeletally mature patients. Grad-CAM analysis revealed consistent activation on these normal developmental structures, misinterpreting physiological radiolucency as pathology (
Figure 10a). The GRAZPEDWRI-DX model’s failure reflects complementary texture bias: trained exclusively on pediatric wrist radiographs with consistent protocols, it developed sensitivity to acquisition-specific features and interpreted unfamiliar textural characteristics in heterogeneous FracAtlas images as fracture indicators (
Figure 10b).
Figure 11 schematically summarizes these failure modes.
The anatomical subgroup analysis (
Figure 8,
Table 2) shows the GRAZPEDWRI-DX model maintained 0% specificity across all seven categories, including hand regions structurally similar to wrist. Even partial anatomical overlap was insufficient for generalization, indicating highly specific learned representations.
The performance degradation visualization (
Figure 9) illustrates how the paradoxical sensitivity increase from internal testing to 100% during cross-testing reflects complete loss of discriminative capability rather than improved detection. This reinforces evaluating sensitivity and specificity jointly, as either metric alone provides incomplete information.
The symmetric failure of both scenarios, despite asymmetric internal profiles, suggests the pediatric–adult generalization barrier is bidirectional and potentially irreducible through standard transfer learning. Within-domain metrics, regardless of magnitude or balance, do not predict cross-domain capability. Models trained on adult populations cannot be assumed to transfer to pediatric applications without population-specific validation or explicit domain adaptation accounting for morphological and acquisition-related differences. The complete specificity failure represents a worst-case outcome wherein deployed systems would generate false positive alerts for every examination, overwhelming workflows while providing no diagnostic value.
4.10. Limitations and Future Research
The FracAtlas dataset contains pediatric patients aged 8 months to 7 years with visible growth plates, yet the FracAtlas-trained model nonetheless exhibited physis–fracture confusion when tested on GRAZPEDWRI-DX. This paradox suggests that mere presence of pediatric cases in training data is insufficient to prevent growth plate misinterpretation; the model may have failed to learn generalizable physis representations from its limited pediatric subset, or the pediatric cases within FracAtlas may have been too few or too heterogeneous across anatomical regions to establish robust growth plate features. It remains an open question whether more balanced mixed-age training, with explicit representation of physes across multiple anatomical sites labeled as non-fracture, would produce models capable of distinguishing developmental radiolucencies from pathological cortical discontinuities.
The present study intentionally avoided such mixed training to isolate the effect of population boundaries under conditions of complete distributional separation; however, this design choice limits the direct applicability of findings to scenarios where some degree of population overlap exists in the training data. It remains an open question whether mixed training would produce models that have genuinely learned to identify bone and detect fracture as abstract concepts, or whether such models would simply memorize a larger catalog of population-specific patterns. The ideal fracture-detection system would learn that bone is characterized by certain radiodensity and structural properties, and that fracture is characterized by cortical discontinuity, independent of patient demographics. The extent to which current deep learning architectures can achieve such abstraction, rather than superficial pattern matching, warrants further investigation.
The Grad-CAM explainability analysis in the present study was qualitative rather than quantitative. Visualizations were generated for a representative subset of cross-testing cases to illustrate dominant failure patterns, but systematic statistical analysis of activation distributions was not performed. Future research should include quantitative characterization of Grad-CAM outputs, specifically measuring the proportion of class activation falling within versus outside bony structures across case categories and stratified by prediction outcome. Such analysis would require automated bone segmentation to define anatomical regions of interest, followed by computation of summary statistics describing the spatial distribution of activation relative to skeletal anatomy. This quantitative approach would substantiate the qualitative observations reported here and permit formal statistical comparison of attention patterns between models and across population boundaries. Additionally, subgroup analysis comparing model performance and attention patterns on anatomically similar cases, such as FracAtlas hand images compared to GRAZPEDWRI-DX wrist images, would clarify the extent to which anatomical similarity moderates cross-population generalization failure.