Abstract
The study focuses on green competitive advantage from a multi-dimensional perspective, investigating the impact of green marketing tools and company descriptive variables on these dimensions. The data were collected from small, medium and micro enterprises (SMME) from Western Cape/South Africa, an area marked by long-term water consumption restrictions. A qualitative approach was considered for variable tailoring to the SMMEs’ peculiarities, followed by a quantitative study, employing a sample of 237 companies, for testing each competitive advantage dimension against the established green marketing tools and company descriptive variables using logistic regressions. Each competitiveness variable was explained by at least one green marketing tool. Donating money and/or allocating time for environmental purposes explained three dependent variables, while selling biodegradable/recycled/refurbished products had an inverse relationship with two of them. Business type and number of operational years had a significant impact on three dimensions. This study enriches the literature by using green competitive advantage dimensions and not a latent factor, analyzing the impact of company descriptive variables as explanatory variables and prompting green strategies for small and medium businesses. The model could be improved by tests in other geographic areas, including green distribution and price variables and other descriptive factors (turnover, responsible investment and internationalization).
1. Introduction
Sustainability can be attained when businesses satisfy needs and desires without endangering the environment [1,2]. Environmentally-centered businesses opt usually between employing either a compliance model of environmental management, aiming to adjust processes to regulations and laws, or a strategic one, planning to attain sustainable competitive advantage [3]. Focusing on acquiring sustainable competitive advantage but also, to a certain extent, just to comply with regulations and laws, businesses can make use of double-bottom line or triple-bottom line models [4,5]. The double-bottom line perspective takes into consideration sustainability (social, economic and environmental) alongside profitability, while the triple-bottom line one includes environmental quality and social justice besides economic indicators. These two types of value-rendering models delineate the importance of sustainability in obtaining a competitive advantage or a green market position [6]. Hartmann et al. [7] argue that in building a green market position or green competitive advantage, companies should rely on the usage of a mixture between consumer emotional benefits and concrete environmentally-focused product features, a goal which can definitely be obtained based on green or environmental marketing endeavors.
1.1. Research Context, Aim and Main Conclusions
The literature centered on consumer motivation to buy green products and services underlines a number of purchasing decision criteria: desire to recycle, green packaging focus, saving energy and resources, pollution or community cleanness, enforcing environmental law, safety and health performance or status significance and convenience [8,9,10]. Companies respond to them by employing a number of established green marketing strategies, such as green branding, green alliances, green innovation, greening the organization [11,12] or even strategies that display different degrees of green focus, namely lean, defensive, shaded or extreme, as posited by Ginsberg and Bloom [13]. Green marketing strategies and their derived tactics can lead to competitive advantage which can be perceived by consumers and prospects in the form of lower prices or better value offers [14]. An offer to be comprehended as being cheaper or better entails actions from the company on the competitive advantage dimensions. The extant literature presents evidence of such dimensions building up to competitive advantage, the most prompted ones being green innovation or offer features [3,15,16,17].
The literature also supports the idea that there is a difference between what managers believe would be appropriate for their companies in going green and the actual usage and implementation of green strategies and tactics. The difference is determined by insufficient reasons to go green, lack of knowledge about the adequate green constructs and implementation costs [18,19,20].
Also, there are differences between large companies and SMEs (Small and Medium Enterprises), understood as micro, small and medium enterprises according to the European Union Commission [21], when it comes to green endeavors [22,23]. Adding to these perspectives the dearth of studies on factors influencing green marketing endeavors in SMEs [24], it becomes clear that a thorough analysis of green competitive dimensions, which actually represent measurements, will shed light into what managers believe to be important at present and what will shape the future green endeavors of such companies.
Thus, aiming to enrich the literature and provide managerial insight, this paper proposes and tests a model focusing on competitive advantage from a broad perspective, developing on the work of Saeidi et al. [25], by inquiring about six competitive advantage dimensions, exploring whether they can be explained based on green marketing tools. In this regard, the present paper expands on the work of Singh et al. [26], by using five important instruments, as the paper concluded that companies should reconsider their marketing strategies and tactics using green perspectives, as they were uncovered to be important consumer buying decision criteria. To give more substance to the study, the model was tested in an environmentally challenged area, Western Cape, South Africa, a geographic region marked by drastic long-term water consumption restrictions imposed due to severe draught and inadequate municipality management, which induced significant consumer behavior changes [27,28] with a significant impact on businesses. Although the SME concept includes micro, small and medium enterprises [21], in South Africa, the SMME acronym takes precedence as the micro businesses are emphasized among the other categories [29]. Due to the significant variety of such companies in South Africa, these being ranked based on three indicators and industry [29], the model was enriched with descriptive variables (business type, industry, number of employees and number of operational years). After testing the formulated hypotheses about the impact of the green marketing tools and descriptive variables on the competitive advantage dimensions, assessed as dependent variables, the first conclusion was that each competitive advantage dimension was explained by at least one green marketing tool. Moreover, donating money and/or allocating time for environmental purposes explained three dependent variables, while selling biodegradable or recycled or refurbished products had an inverse relationship with two of them. Only two descriptive variables, business type and number of operational years, had a significant impact on three competitive advantage dimensions. Based on the findings, managers can make use of six green competitive dimensions and five green marketing tools considering the business type and market experience.
The paper is structured in several sections, presenting main literature considerations based on which the research hypotheses are configured. Firstly, a presentation of green competitive advantage dimensions and green marketing from a broad perspective to a narrower one on micro, small and medium enterprises is made to underline the necessity of probing into competitive advantage dimensions in the case of such companies. Secondly, green marketing tools used by businesses are presented, based on which the first hypothesis was formulated. Thirdly, the current situation of green endeavor focus and integration by South African small, medium and micro enterprises is emphasized, leading to the configuration of the other four hypotheses. The paper continues with materials and methods, results and discussions. The paper ends with conclusions, underlining, also, managerial implications and research limitations.
1.2. Main Literature Consideration and Research Hypotheses
1.2.1. Competitive Advantage and Green Marketing
Green marketing strategies and tools can aid organizations in positioning themselves by delivering value [30] based on greenness and, thus, obtaining competitive advantage. Every company tries to acquire a competitive advantage aiming to become special in the minds of their prospects and clients [31], hence its successful competitive endeavor not being easily replicated by competitors [30]. Nowadays, because of the fierce competition in various markets, companies go beyond the traditional 4Ps (product, price, promotion and placement) attempting to be competitive [32]. By implementing effective environmental strategies, businesses can become better or unique in various markets, thus, achieving sustainable benefits through differentiation or low cost [14], such benefits being in the forms of customer satisfaction and loyalty, or improved financial indicators [33], representing, actually, competitive advantage effects. Although a growing number of prospects in every industry tend to show interest and care about environmental issues when making buying decisions, not all companies attempting to position themselves as being green acquire a competitive advantage based on sustainability [19].
Porter [30] posited three competitive strategies based on competitive advantage and scope. On one hand, aiming for a sizeable market, a company can make use of either a cost leadership strategy pursuing to acquire the low-cost market position or a differentiation strategy desiring to be unique in aspects important to consumers. On the other hand, aiming for a smaller market, a company can employ either a cost focus strategy attempting to obtain cost advantages or a differentiation focus seeking to acquire a unique position to cater for special needs. Probing further, in a green context, considering two variables, competitive focus (organizational processes over products and services) and competitive advantage (differentiation over lower costs), Orsato [19] proposed four competitive strategies. Thus, these four strategies can be summarized as eco-efficiency strategies (lower costs-organizational processes), suitable for companies in B2B markets, beyond compliance leadership strategies (differentiation-organizational processes), appropriate for companies desiring to communicate significantly about their environmental efforts, eco-branding strategies (products-differentiation) adequate, especially, for businesses focusing on product features and environmental cost leadership strategies (products-lower costs), approachable essentially by companies attempting to focus on product functions (services) rather than attributes.
Looking from a different perspective, corporate environmental ethics and management [34,35] are considered prerequisites for green competitive advantage, while green marketing strategies and tactics are guidelines and tools necessary to attain them. Going further, Arseculeratne and Yazdanifard [36] argued that green marketing would contribute to a qualitative change in the interaction between one company and its customers, being, actually, a consequence of the stricter environmental regulations and more concerned consumers [37].
The relationship between competitive advantage and green marketing has been investigated considering various perspectives. Shrivastava [15] uncovered a direct relationship between green product and process innovation and competitive advantage, underlining, also, green product design and development as means for charging higher prices. Dangelico and Pujari [16] asserted that green product innovation at each stage of the product life cycle could add more value and, thus, lead to competitive advantage. Isaak [17] posited that green design and content could represent value-added aspects which could lead to competitive advantage, while Miles and Covin [3] argued that at international level competitive advantage could be obtained and preserved through qualitative offers matching societal and environmental values. Prakash [38] concluded that companies would involve themselves in green marketing and convey their actions if the most important stakeholders displayed interest in this regard.
Probing further, a number of studies focused on company size to investigate green endeavors [39,40], as there are differences between SMEs, comprising micro, small and medium enterprises [21] and large companies in the ways they engage [22,23,41]. Although evidence on competitive advantage is found in comparative studies between large companies and SMEs [4,5,40], a focus just on SMEs is not well represented [24]. The little evidence found in the literature connecting just SMEs with green endeavors and competitive advantage shows that SMEs should employ responsible business practices in their marketing strategies and instruments if they wanted to be competitive [42]. The same line of thought is also supported by Simpson et al. [18] as they argued that SMEs could also acquire competitive advantage by employing environmental good practices (a UK perspective). Other studies extend to these types of companies the green marketing innovation role in attaining competitiveness [24,43] or the stakeholders’ pressures and employees’ engagement in implementing sustainable practices [44]. On the other hand, Gupta and Borua [45] emphasize the green innovation importance in supplier selection in meeting competitiveness goals. Revell et al. [46] posit that SMEs use green strategies and instruments for push reasons, entailing complying with environmental rules and regulations [47], and/or pull reasons, aiming to acquire competitive advantage by emphasizing environmental concerns [14]. Leonidou et al. [48] reinforce this perspective by underlining the significance of green business strategy implementation in obtaining competitive advantage especially in conditions induced by stricter regulations, a more dynamic environment and intensified market conditions.
These works present the factors underlying green competitiveness from a narrow perspective, focusing mainly on offer innovation and features. A broader appraisal of measurement factors of green competitive advantage would provide a better understanding of this concept. Chen et al. [37] used eight variables for measuring competitive advantage (low cost, product/service quality, R&D capabilities, managerial capabilities, profitability, company growth, being the first and corporate image), while Chang [34] dropped low cost, R&D capabilities and being the first and added competitors’ efforts necessary to replace the competitive advantage. Dunk [49], on the other hand, used cost per unit, delivery and supply-shipment durations, volume flexibility and inventory proceeds. Building on these works, Saeidi et al. [25] measured competitive advantage by using six dimensions, offer quality, company’s image, market position, differentiation and diversity, company’s growth and market leaderships. Yet, a drawback of all these studies is that they treated competitive advantage as a latent factor of these dimensions and no evidence is given either on the impact or effect of each of these competitive advantage dimensional variables. Developing further, the appropriateness of a multi-dimensional analysis of competitive advantage is reinforced by the idea that there is a difference between managers’ perceptions on what businesses should enterprise and the actual implementation status of green strategies [18,19,20]. This gap is caused by reasons pertaining to motivation to go green, lack of knowledge of what green strategies and actions should be considered and the costs of implementing green marketing.
In conclusion, considering the lack of studies of in-depth analysis of SME green competitive advantage dimensions and the difference between managers’ beliefs and their actions on green strategies, this study aims to enrich the literature and provide managerial insights by adapting the six competitive advantage dimensions applied by Saeidi et al. [25] to assess whether their usage/implementation in acquiring competitive advantage, understood as a position in consumers’ minds difficult to be replicated by competitors [30,31], can be explained based on green marketing tools in the case of SMEs.
1.2.2. Green Marketing Tools—Delineating Instruments Used by Companies in Acquiring Competitive Advantage
The extant literature provides evidence of green marketing tools used by organizations. A significant number of works present such tools as being derived from the classic marketing mix. Rivera-Camino [50] and Arseculeratne and Yazdanifard [36] underlined green product design, green prices, green publicity and sponsoring or green distribution as effective business instruments. In a more focused approach, Prakash [38] argued that companies should communicate their green advantages using advertising, direct mailing, eco-labels or in-store displays, while Delafrooz et al. [51] underlined environmental advertising and eco-brands as tools influencing consumer behavior. Eco-labels are used for providing information about green products [52], while eco-brands are useful tools in delineating green products from non-green ones [53]. Green advertising, on the other hand, underlines benefits of purchasing green offers for consumers and the environment [53]. In a different approach, Zaman et al. [54] provided a more comprehensive perspective of green marketing tools by detailing besides eco-labels, environmental justice, a compelling instrument explained as attempts of fair value distribution between people using environmental movements and ecosystem services, clarified as the balance between natural ecosystems and their inhabitants for supporting human life [55]. From another angle, closely related to green product design, green product innovation, looming as an important tool even for SMEs, entails using recycled, renewable or biodegradable materials and even reducing product size or weight [16].
Focusing on green consumer behavior, Singh et al. [26] concluded that companies should reconsider their marketing strategies and tactics by centering on green perspectives based on five consumer motives supporting buying decisions, namely (i) buying biodegradable, or recycled or refurbished products, (ii) buying environmentally friendly brands, (iii) being proactive about environmental community activities, (iv) being assertive about environment and (v) donating money and/or time for environmental purposes.
In conclusion, companies can make use of various green marketing tools in attaining their goals and, as a consequence, to build competitive advantage. This study develops on the work of Singh et al. [26] because of its broad consumer behavior focus, strengthening the competitive advantage standing, that of acquiring a position in consumers’ minds difficult to be copied by competitors [30,31]. Thus, the study proposes five green marketing tools, actually their degree of integration, to be assessed against each of the six competitive advantage dimensions delineated in the previous section to ascertain whether such tools can explain the respective dimensions in the case of micro, small and medium enterprises.
Hence, drawing from the buying motives, five hypotheses were formulated, each green marketing tool being derived from one green offer buying motive.
The first green consumer buying motive, namely buying biodegradable, recycled or refurbished products, is also highlighted in literature from a number of marketing instrumental perspectives. One perspective focuses on green product design, as this is considered an effective marketing tool not just for meeting environmental conditions and restrictions, but, more importantly, for serving consumer requirements [36,50]. A different perspective is given by the green product constituents or size, as green features and smaller sizes are deemed as effective ways in achieving sustainability and competitiveness [16]. Moreover, the usage of recycled and biodegradable constituents in product and package manufacturing processes is considered most often a very important offer differentiator [16,56,57].
Considering the abovementioned buyer-seller views and the relevance of biodegradable, recycled or refurbished characteristics for consumers when making buying decisions, the first green marketing tool was derived and hypothesis H1 proposed:
Hypothesis 1 (H1).
Managers integrate selling biodegradable or recycled or refurbished products to impact on price differentiation and diversity, market position (being known in a particular way), company’s image, market leadership, offer quality or company’s growth.
The second green consumer buying motive, purchasing environmentally friendly brands, is also found in literature with references to eco-brands, as these are considered important buying decision criteria used by people. People look for environmental information on product labels when they analyze offers, buying for rational, emotional and experiential reasons derived from green product features and environmental endeavors performed by companies [52,53,58]. If buyers are satisfied with their purchases and return to buy, eco-brands emerge as a guarantee for steady quality, Delafrooz et al. [51] recommending that businesses should be transparent about the green impact of their brands in order to be competitive. Furthermore, Majid and Russell [59] underlined that pure green brands in comparison to non-green ones preserved better their value in time due to product features. Thus, building a brand identity centered on green benefits looms as a top priority for businesses [60].
Based on the importance of environmentally friendly brands in consumer buying decisions, the second green marketing tool was configured and hypothesis H2 formulated:
Hypothesis 2 (H2).
Managers integrate selling environmentally friendly brands to impact on price differentiation and diversity, market position (being known in a particular way), company’s image, market leadership, offer quality or company’s growth.
The third green consumer buying motive, acquiring offers from companies actively involved in environmental community activities, has been materialized in business. Kumar and Ghodeswar [58] uncovered that environmentally driven companies dedicated to protecting the environment were chosen by consumers over other enterprises. Arseculeratne and Yazdanifard [36] contended that businesses focusing on green endeavors should be proactive in their interactions with various stakeholders in order to be perceived in a particular way by consumers and, thus, to acquire a green competitive position. Chekima et al. [61] suggested that companies should focus on cause-related marketing as an option to attain market goals. Zaman et al. [54] argued that environmental justice should be aimed by companies as it could be transformed into an effective marketing instrument through helping prospects understanding better environmental efforts made by businesses.
Considering the consumer interest on active involvement of companies in environmental activities as a buying decision criterion, the third green marketing tool was projected and hypothesis H3 delineated:
Hypothesis 3 (H3).
Managers integrate being proactively involved in environmental community activities to impact on price differentiation and diversity, market position (being known in a particular way), company’s image, market leadership, offer quality or company’s growth.
The fourth green consumer buying motive, purchasing from companies that are assertive about environment, has been employed by businesses in the sense that preoccupations and innovations aimed at protecting the environment should be thoroughly and properly communicated. Thus, conveying information about green effort is considered crucial in green marketing [38], consumers acknowledging that advertisements are effective means for gathering information on green offers and environmental preoccupations and making buying decisions [51,53]. Therefore, businesses should communicate about green ingredients and benefits [62] using green certification logos and messages matching consumers’ expectations of what green or sustainable should represent [57,63], aiming, thus, to convey their environmental accomplishments [64].
Thus, establishing the significance of buying from companies that are assertive about environment as a consumer buying decision motive, the fourth green marketing tool was delineated and hypothesis H4 formulated:
Hypothesis 4 (H4).
Managers integrate being assertive about environment and communicating the endeavors to impact on price differentiation and diversity, market position (being known in a particular way), company’s image, market leadership, offer quality or company’s growth.
The fifth green consumer buying motive, acquiring offers from companies acknowledged for donating money and/or spending time for environmental purposes, has been implemented by companies especially through partnerships for assisting the community. Arseculeratne and Yazdanifard [36] underlined that for green marketing effectiveness companies should support local communities by educating people on environmental issues and partner with organizations to endorse environmental causes. Additionally, Goh and Balaji [65] pointed out a direct relationship between educating people and environmental image. Prakash [38] reinforced the company-community strategic partnership perspective by positing that businesses should get involved in sponsoring environmental matters.
In view of the importance of the effort allocated by companies (money and/or time) to consumers as a buying decision criterion, the fifth green marketing tool was proposed and hypothesis H5 built:
Hypothesis 5 (H5).
Managers integrate donating money and/or allocating time for environmental purposes to impact on price differentiation and diversity, market position (being known in a particular way), company’s image, market leadership, offer quality or company’s growth.
Table 1 presents hypotheses H1 to H5.

Table 1.
Hypotheses—green marketing tools—competitive advantage dimensions.
1.2.3. Green Competitive Advantage and Marketing Endeavors in an Environmentally Challenged Geographic Region—Western Cape, South Africa
Green competitive advantage dimensions and marketing strategies and tactics in environmentally challenged regions entail distinct peculiarities because of constraints specific to such areas rendering necessary adaptation and mitigation strategies [27]. An example of such a region is Western Cape (South Africa). This part of the world has been marked by dire water consumption restrictions imposed due to severe draught and inadequate municipality management, which caused important consumer behavior changes [27,28] and, as a consequence, important adaptations on the ways micro, small and medium enterprises operate (adapted from Bauer and Scholz [27]). South Africa lies in an area marked by mild to serious rain deficiency for periods of time exceeding six months in a year [66]. Western Cape has relied significantly on its wet winters to replenish the water dams supplying the province but the situation changed dramatically in 2014 due to the bellow-level precipitation, the forecast for this province being a pessimistic one with an estimated drop of 30% in the rainfall by 2050 [28,67]. In order to control the situation, authorities imposed water consumption restrictions, which will continue to be enforced because of the poor public management policies [68], at least until the envisaged strategies focusing on using additional water sources will be implemented [67]. These water restrictions caused significant changes in consumption behavior and business focus. People started saving water and finding alternative water sources for household usage, such as extracting ground water, using grey water (water from household sinks, showers or baths) or collecting rain water [69]. This change in water usage behavior had important consequences, one being the occurrence and/or prosperity of companies selling water and water-sourcing and storage equipment, such as pumps or tanks, or sanitizing products [70]. On the other hand, farmers were very affected as they had to choose the more profitable crops to be irrigated [71], with a significant impact on quantity, quality and size of output, as well as on shelf brand display [72], as various produces and by-products were not produced anymore.
Because of the necessity of saving and reusing water, plus sourcing water from the ground, many people display a growing concern about the environmental friendliness of the products consumed or used in their households [69]. Farms and manufacturing companies are forced to find technological conditions to provide output with less water intake as well as with least possible output waste in order to reuse the water or make use of additional sources, all of these being done aiming to acquire a particular margin. Considering these facts, although many businesses are already environmentally friendly, being forced to use less water, they should focus on obtaining green competitiveness using green marketing tools and, very importantly, communicating about such endeavors.
In South Africa, small, medium and micro enterprises (SMME) are ranked in three important groups based on three indicators (number of employees, turnover and assets) and operating industry [29]. The few existing works focusing on green endeavors and competitiveness in the case of South African SMMEs represent interesting case studies because of challenges these companies face from a marketing perspective, such as shortage of skills and difficulties in forecasting trends and needs and meeting them profitably [73]. Mukonza [74], for example, referred to an impressive increase of the number of green companies and management confidence in green activity-based competitive advantage induced by population lifestyle changes, such as a growing preoccupation for organic food or recycling, while Maziriri and Chinomona [73] suggested that business performance was significantly influenced in a positive way by green marketing endeavors. Moreover, Lekhanya [75] established that customer satisfaction for green manufactured goods was especially influenced by product prices, green branded products, product labelling, quality and packaging. Struwig and Riyaadh [76] uncovered a direct relationship between managers’ attitudes on environmental norms and management systems and the intentions to implement such systems, while in a more focused approach, Hamann et al. [41] concluded that in the case of wine farms, managers’ environmental responsibility played a very important role in competitiveness-related actions. Going further, Hamann et al. [41] emphasized the lack of studies on environmental responsiveness regarding the South African SMMEs, as well as the necessity of industry comparisons. On the other hand, Lekhanya [75] supported the idea that deeper understanding of green marketing concepts would boost South African SMMEs’ brand choice and market share.
The current study aims to test the hypothesis and sub-hypotheses on the impact of green marketing tools on the six competitive advantage dimensions formulated in the previous sections in a South African context by focusing on SMMEs operating in the Western Cape Province. In doing so, the study also employs four descriptive variables as explaining factors for using competitive advantage dimensions. Thus, pursuing the idea of Lopez-Rodriguez [40], to include in a model of descriptive variables for explanatory reasons and developing on the works of Struwig and Riyaadh [76] and Mukonza [74], four variables were chosen, business type and number of employees from the former and industry and number of operational years from the later.
In conclusion, four hypotheses (H6–H9) about the impact of each of the four descriptive variables on the usage of the six internal competitive advantage dimensions were formulated:
Hypothesis 6 (H6).
Business type explains the usage of price differentiation and diversity, market position (being known in a particular way), company’s image, market leadership, offer quality or company’s growth.
Hypothesis 7 (H7).
Industry in which the SMME operates explains the usage of price differentiation and diversity, market position (being known in a particular way), company’s image, market leadership, offer quality or company’s growth.
Hypothesis 8 (H8).
Number of employees explains the usage of price differentiation and diversity, market position (being known in a particular way), company’s image, market leadership, offer quality or company’s growth.
Hypothesis 9 (H9).
Number of operational years explains the usage of price differentiation and diversity, market position (being known in a particular way), company’s image, market leadership, offer quality or company’s growth.
Table 2 presents hypotheses H6 to H9.
Table 2.
Hypotheses—company descriptive variables—competitive advantage dimensions.
Summing up, micro, small and medium enterprises play a highly important role in the spreading of green focus not just in the established industries but, also, in the emerging ones [77]. However, there is little evidence on the green competitive advantage dimensions aimed by such companies and the green marketing tools used to attain each of them. The present study aims to fill this research gap by proposing a model in which competitive advantage dimensions employed by managing staff are assessed in accordance with the degree of integration of five green marketing tools and four descriptive variables, the model being tested in an environmentally challenged region, Western Cape (South Africa), thus providing a different view on competitive advantage, as well as managerial insights (see Figure 1).
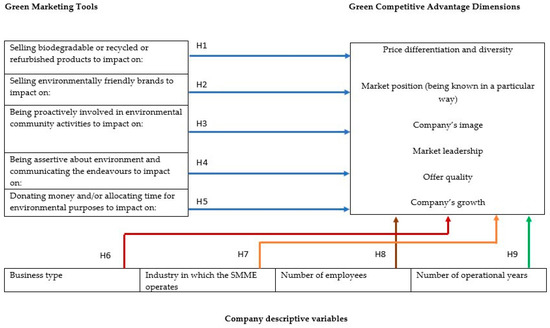
Figure 1.
The conceptual model.
In this paper, the SMME acronym is used when the topic refers just to the South African context, while the SME one is used when the matter is not limited to South Africa.
2. Materials and Methods
The research methodology entailed a two-prong approach. An initial qualitative study was employed through the use of in-depth interviews. Subsequently, based on the findings, a questionnaire was developed to be used in a quantitative study.
The study measured competitive advantage by adapting the six dimensions used by Saeidi et al. [25] to the South African SMMEs, these ones being: price differentiation and diversity, market position, company’s image, market leadership, offer quality and company’s growth. These dimensions were explained using logistic regressions [40] against five green marketing tools configured based on the findings and recommendations of Singh et al. [26], namely selling biodegradable or recycled or refurbished products, selling environmentally friendly brands, being proactively involved in environmental community activities, being assertive about environment and communicating the endeavors and donating money and/or allocating time for environmental purposes and four descriptive variables, business type, industry, number of employees and number of operational years [74,76].
Initially, the six dimensions used for competitive advantage and the five green marketing tools were discussed in in-depth interviews with 10 professionals (3 managers, 3 marketers and 4 owners), building on the works of Saeidi et al. [25], Maziriri and Chinomona [73] and Struwig and Riyaadh [76]. Based on these interviews, the competitive advantage dimensions were reformulated as aims and goals for: being recognized as delivering green value to the market by being different based on price, acquiring a distinct market position based on being green, acquiring a green public image/ brand enhancement, being recognized as the first or best through green endeavors, being recognized through improving/innovating products and/or services based on green process and constituents and developing the business through green opportunities. The five green marketing tools were retained as presented and the four descriptive variables were considered sufficient for the purpose of the study.
Based on the findings, a questionnaire was drafted, employing dichotomic scales (yes/no) to assess the usage/implementation of the six competitive advantage dimensions [25,40]. The five green marketing tools were measured considering their degree of integration in the business (low-high) through the use of 5-level Semantic Differential scales (adapted from Lopez-Rodriguez [40]), while the descriptive variables were measured using categorical scales [40], several categories being employed.
The sample was drawn from seven business directories [34,73], totaling 2362 SMMEs located in Western Cape (considering the SMME diversity, the most important criterion being employing less than 200 people [76]). Thus, using a systematic sampling method, choosing every other 5th company from the lists [78], 472 managers, marketers and owners [73] were initially approached by email or phone to uncover whether they had a green orientation and were interested to take part in the study, subsequently, the questionnaire being sent by email to 261 respondents that showed interest in the study (adapted from Struwig and Riyaadh [76]). 243 questionnaires were collected within six weeks based on additional interactions by phone and email. After scrutinizing the questionnaires, 237 valid responses were obtained. This sample size is found within the limits of previous studies on South African SMMEs’ preoccupation on environmental issues [73,74,75,76]. Also, in a comparison with studies on environmental issues but from a CSR perspective, in which data were collected from managers, the sample size matches or exceeds previous works [79,80].
3. Results
Data were collected from managers, marketers and owners from services, merchandise and manufacturing companies from 14 industries, operating on their markets for periods of time varying from less than 2 years up to over 20 and employing between 1 and 200 employees (see Table 3, Table 4, Table 5 and Table 6).
Table 3.
Business type—descriptive statistics.
Table 4.
Industry—descriptive statistics.
Table 5.
Number of employees—descriptive statistics.
Table 6.
Number of operational years—descriptive statistics.
The study focused on appraising the degree of integration by small, medium and micro enterprises (SMME) of five green marketing tools (Table 7) and their impact on the usage/implementation of each of the six competitive advantage dimensional variables, as well as on identifying whether the four descriptive variables mentioned above could explain the usage of the competitive dimensions (see Table 8).
Table 7.
Green marketing tools—integration by SMMEs—central tendency.
Table 8.
Logistic regression results.
Considering the median and mode values (see Table 7), three green marketing tools are highly integrated (selling biodegradable or recycled or refurbished products, being proactively involved in environmental community activities and being assertive about environment and communicating the endeavors), while selling environmentally friendly brands (with a median value of 3, assigned to the Neutral level), has the largest number of answers on the highly-integrated level, with 49% of the respondents selecting the high and very high company integration levels of this tool. The fifth marketing tool, donating money and/or allocating time for environmental purposes, with a median value of 4 (high integration) has the largest number of answers on the Neutral level but 53.6% of the respondents mentioned that this tool was highly and very highly integrated in the company (see Appendix A). Overall, it can be stated that these green marketing tools are considerably integrated in the South African SMMEs from Western Cape.
Subsequently, in measuring the impact of the green marketing tools (based on their integration) and effect of the descriptive variables on each competitive advantage dimension (its usage), two logistic regressions were performed for the purpose of complying with the sample size assumption of this method [81,82] and for simplifying the analysis [40]. The first logistic regression entailed uncovering the significant green marketing tools, while the second one retained the significant tools and included the four descriptive variables. Table 8 displays the most comprehensive models for each competitive advantage variable once the logistic regression assumptions were checked (see Table 9).
Table 9.
Logistic regression assumptions.
The usage/implementation of the competitive advantage dimensional variable being recognized as delivering green value to the market by being different based on price, was explained through two green marketing tools. Thus, selling biodegradable or recycled or refurbished products with an odds ratio of 0.520 shows that a decrease of one unit on the integration measurement scale (moving from very high to very low) increases the odds of the company being recognized as delivering green value to the market by being different based on price by a multiplicative factor of 1.923. In the other case, the variable selling environmentally friendly brands, with an odds ratio of 1.515, displays that an increase of one unit on the integration measurement scale (moving from very low to very high) increases the odds of the company being recognized as delivering green value to the market by being different based on price by a multiplicative factor of 1.515. Considering the findings, it can be stated that the integration of biodegradable, recycled or refurbished products does not necessarily help companies to acquire a competitive advantage based on price. This situation could be explained by a probable managerial reluctance to focus on price in the South African context because of the risk of not reaching a sufficient number of consumers [88] based on the fact that in most situations companies charge premium prices for green products because of the incurred costs, hence being considered expensive by many consumers, while a low price might create confusion amongst consumers, as such products are perceived to be expensive and not cheap (adapted from Arseculeratne and Yazdanifard [36]). On the other hand, selling environmentally friendly brands can help companies to acquire a competitive advantage based on price, as such offers are purchased usually for better-value considerations [14].
The usage/implementation of the competitive advantage dimension acquiring a distinct market position based on being green was explained by three variables, one green marketing tool and two descriptive variables. Thus, being assertive about environment and communicating the endeavors, with an odds ratio of 3.019, displays that an increase with one unit on the integration measurement scale (moving from very low to very high) increases the odds of the company to acquire a distinct market position based on being green by a multiplicative factor of 3.019. On the other hand, business type (significant overall at p < 0.05), with an odds ratio of 0.212 (p < 0.05 for this category), shows that services businesses are 4.717 times more inclined to acquire a distinct market position based on being green than manufacturing businesses. The other descriptive variable, operating time (significant overall at p < 0.01), with an odds ratio of 0.246 (p < 0.1 for this category), shows that businesses operating for less than two years tend to be 4.065 times more inclined to acquire a distinct market position based on being green than the companies with 2 to 4 years of market operating time. Based on the findings, these three variables can explain well the dependent variable but the results for operating time should be treated with caution as the only significant variable category was significant at p < 0.1. Nonetheless, services businesses operating for less than two years and focusing on being active about environment and communicating their endeavors are more inclined to acquire a distinct market position based on being green than other companies.
The usage/implementation of the third competitive dimension, acquiring a green public image/brand enhancement, was explained by one green marketing tool, donating money and/or allocating time for environmental purposes and two descriptive variables, business type and operating time. The green marketing tool, with an odds ratio of 3.740, shows that an increase with one unit on the integration measurement scale (moving from very low to very high) increases the odds of the company to acquire a green public image or enhance its brand by a multiplicative factor of 3.740. Business type (significant overall at p < 0.01), with an odds ratio of 36.243, displays that merchandise businesses (p < 0.01) are 36.243 times more inclined to acquire a green public image or enhance the brand compared to services businesses, while operating time (significant overall at p < 0.01), with odds ratio of 0.021 (p < 0.01), 0.130 (p < 0.1) and 0.035 (p < 0.01), shows that companies with less than two years of operations are 47.62 times more inclined to acquire a green public image or enhance the brand than those with 2–4 years of operating time, 7.69 times more inclined than those operating between 5 and 9 years and 28.57 times more inclined than those being active between 10 and 19 years. Considering the findings, there are clear indications that by making efforts for environmental purposes (money and/or time), companies can acquire a green public image or enhance their brands, the most inclined ones being those active on the market for less than two years, especially from the merchandise sector.
The usage/implementation of the fourth competitive dimension, being recognized as the first or best through green endeavors, was explained by two green marketing tools. Selling biodegradable ore recycled or refurbished products (p < 0.01), with an odds ratio of 0.291, shows that a decrease with one unit on the integration measurement scale (moving from very high to very low) increases the odds of the company to be recognized as the first or best in the respective category through green endeavors by a multiplicative factor of 3.436. On the other hand, donating money and/or allocating time for environmental purposes (p < 0.01), with an odds ratio of 2.089, displays that an increase with one unit on the integration measurement scale (moving from very low to very high) increases the odds of the company to be recognized as the first or best through green endeavors by a multiplicative factor of 2.089. To summarize, being the first or best can be achieved through significant effort (money and/or time) put into environmental purposes, while an increased push on selling biodegradable or recycled or refurbished products does not necessarily lead to this competitive goal. An explanation for this situation can, probably, be derived from managers’ beliefs that the usage of this marketing tool could be sensitive in South Africa due to difficulties to control production and other costs that would have to lead to higher price levels [36], thus, rendering long-term risks [88], regardless of the possibility of being the first or best through green offers at a certain point in time. However, Lekhanya [75] uncovered that managers ranked green product prices as the most important customer satisfaction criterion.
The usage/implementation of the fifth competitive dimension, being recognized through improving/innovating products and/or services based on green processes and constituents, was explained just by one green marketing tool, being proactively involved in environmental community activities (p < 0.01) which, with an odds ratio of 2.110, displays that an increase with one unit on the integration measurement scale (moving from very low to very high) increases the odds of the company to be recognized through improving/innovating products and/or services by a multiplicative factor of 2.110. Thus, a direct effect was uncovered, so, by tackling environmental issues in the community, companies can gain recognition if they pursue to develop their portfolio.
The usage/implementation of the sixth competitive dimension, developing the business through green opportunities, was explained by one green marketing tool and two descriptive variables. Donating money and/or allocating time for environmental purposes (p < 0.01), with an odds ratio of 2.070, shows that an increase with one unit on the integration measurement scale (moving from very low to very high) increases the odds of the company to develop through green opportunities by a multiplicative factor of 2.070. Business type (significant overall at p < 0.05), with odds ratios of 3.398 (p < 0.1) and 6.806 (p < 0.05), shows that merchandise businesses and manufacturing companies are 3.398 times and 6.806 times more inclined than services enterprises to develop through green opportunities. Operating time (significant overall at p < 0.01), with odds ratios of 0.07 (p < 0.01), 0.036 (p < 0.01), 0.022 (p < 0.01) and 0.032 (p < 0.01), displays that companies operating for less than two years are 14.29 times more inclined to develop their businesses through green opportunities than those operating between 2 and 4 years, 27.78 times more inclined than those operating between 5 to 9 years, 45.45 times more inclined than those operating between 10 and 19 years and 31.25 times more inclined than those operating for 20 years and more. Based on the findings, merchandise companies (but treated with caution because of the significance level, p < 0.1) and manufacturing enterprises operating for less than 2 years, donating money and/or putting time for/on environmental purposes, are more prone to develop their businesses through green opportunities than other types of companies.
4. Discussion
The study focused on determining whether the usage of six dimensions of competitive advantage can be explained by the degree of integration of five green marketing tools, hypotheses H1–H5 being formulated and by four company descriptive variables, hypotheses H6–H9 being formulated. Considering the outcome for each competitive advantage dimensional variable, conclusions can be drawn regarding these hypotheses.
Thus, acquiring a green public image/brand enhancement and developing the business through green opportunities were found to be influenced by one green marketing tool (directly, p < 0.01), donating money and/or allocating time for environmental purposes and two descriptive variables, business type (p < 0.01 and p < 0.05) and operating time (p < 0.01). Being recognized as delivering green value to the market by being different based on price and being recognized as the first or best through green endeavors were found to be influenced by selling biodegradable or recycled or refurbished products (indirectly, p < 0.01), while the first one was also found to be influenced by selling environmentally friendly brands (directly, p < 0.05) and the second one by donating money and/or allocating time for environmental purposes (directly, p < 0.01). Acquiring a distinct market position based on being green was found to be influenced by being assertive about environment and communicating the endeavors (directly, p < 0.01) and two descriptive variables, business type (p < 0.05) and operating time (p < 0.01), while being recognized through improving/innovating products and/or services based on green processes and constituents was found to be influenced only by being proactively involved in environmental community activities (directly, p < 0.01).
Based on the findings, hypotheses H1–H5 were partially retained with the amendment that one green marketing tool (donating money and/or allocating time for environmental purposes) was found to have an impact on three competitive advantage dimensions, another one (selling biodegradable or recycled or refurbished products) on two dependent variables, while the other three tools were found to impact only one dependent variable each (see Table 8 and Figure 2).
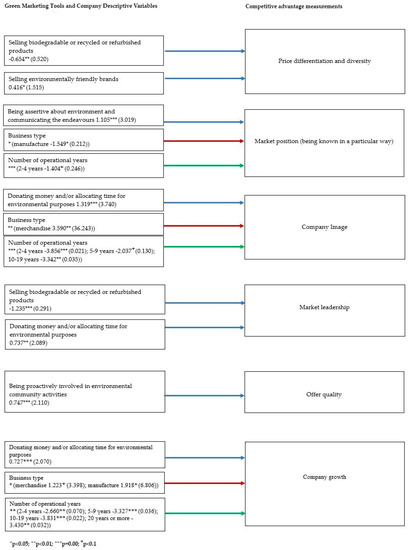
Figure 2.
Significant relationships between variables.
Regarding hypotheses H6–H9, hypotheses H7 and H8 were rejected as the industry in which the SMME operates and the number of employees were not found significant in any appraisal of the six competitive advantage dimensions, while H6 and H9 were partially retained as business type and number of operational years explained the usage of only three competitive advantage dimensions (see Table 8 and Figure 2).
Comparing the findings with previous works, donating money and/or allocating time for environmental purposes was underlined as an important motive to buy green products, Singh et al. [26] recommending these two types of effort as suitable marketing tools for companies. Arseculeratne and Yazdanifard [36] and Prakash [38] mentioned local community support and endorsement partnerships, focusing on sponsorships, as appropriate green marketing tools. Moreover, Goh and Balaji [65] underlined a strong relationship between the effort put in by businesses in educating people about green topics and company environmental image. Thus, the findings of the present study support these recommendations as in all statistically significant situations, a higher degree of integration of this marketing tool (donating money and/or allocating time for environmental purposes) rendered a higher tendency of a company to acquire a competitive advantage. Also, it is worth mentioning that in the case of three dimensional variables of competitive advantage (see Table 8), this marketing tool did not have a significant impact, these results providing a different perspective on the effectiveness of this marketing tool.
Evidence about selling biodegradable or recycled or refurbished products, as a green marketing tool, is found in literature. Arseculeratne and Yazdanifard [36], Rivera-Camino [50] and Kuo and Smith [89] referred to green product design as an adequate marketing tool for companies in order to meet environmental conditions and restrictions, and, more importantly, to satisfy consumer needs and desires [90], while Singh et al. [26] proposed that companies should sell green products, as they are highly appreciated by consumers. This perspective is presented also at SME level by Dangelico and Pujari [16] as they emphasized the impact of using biodegradable and recycled constituents in manufacturing processes as a precursor for acquiring competitive advantage. Furthermore, Dangelico and Vocalelli [91] pointed out that focusing on green packaging as a crucial marketing endeavor, a recyclable package being an effective tool in attaining competitiveness [56,57]. In a South African context, the abovementioned recommendation can be inferred based on the findings of Lekhanya [75], customer satisfaction in the case of green manufactured goods being affected by product features (quality), packaging and labelling and Mukonza [74], underlining a growing preoccupation of the South African consumers for organic food and recycling. However, the findings of the present study do not support the results presented in previous works as selling biodegradable or recycled or refurbished was found to have a significant but inverse impact on two competitive advantage dimensions (see Table 8), meaning a lower degree of integration of this marketing tool could render a higher tendency of a company to attain competitive advantage, while for the other four dimensions this tool did not render a significant impact. An explanation for the inverse impact of this marketing tool on the two dimensional variables could be derived from the managerial perception that green products incur significant expenses which must be passed on to consumers. Hence, managers might probably be reluctant in focusing just on selling biodegradable/recycled/refurbished products in an attempt to acquire competitive advantage based on being different on price in South Africa, considering the risk of not targeting a sufficient number of consumers using premium prices [88,91,92], or, conversely, if a low price strategy is possible, the risk of creating confusion about the offer might be significant (adapted from Arseculeratne and Yazdanifard [36]). Going further, considering these risks, managers might believe that being the first of best through being green could be very difficult to be attained just on selling green products (adapted from Schaper [88]). However, these findings render necessary further investigation.
Selling environmentally friendly brands should be discussed in association with green branded products. Previous works on green brands underline their positive impact on consumer behavior induced by information clarity and richness and weight in buying decision [26,51,52,53]. Green brands provide consumer assurance about rational, emotional and experiential benefits [58]. From a company’s perspective, a green brand identity leads in many cases to a long-term competitive asset [60], as true green brands retain their market value for longer periods of time compared to non-green ones [59]. Lekhanya [75], on the other hand, focusing on South African consumers, underlined the significant impact of green branded products in attaining customer satisfaction for green manufactured products. The results of the current study support the conclusions of previous works in the case of one competitive advantage dimension, being recognized as delivering green value to the market by being different based on price, as a higher degree of integration of selling environmentally friendly brands rendered a higher tendency of acquiring competitive advantage. However, for the other five competitive advantage dimensions, this marketing tool did not have a significant effect, hence, these findings not supporting the results and/or recommendations found in literature.
Being proactively involved in environmental community activities was uncovered to have a strong impact on consumer buying decisions [26]. Arseculeratne and Yazdanifard [36] emphasized that enterprises should pursue proactive interactions with stakeholders aiming to be perceived in a particular way by consumers Chekima et al. [61] argued that companies should rely on cause-related marketing because of its impact within a community and, hence, its competitive effectiveness, while Kumar and Ghodeswar [58] underlined that dedicated companies to protecting the environment would be chosen by consumers over other enterprises. Furthermore, Zaman et al. [54] suggested that businesses should implement environmental justice for acquiring competitive advantage. In a South African context, Struwig and Riyaadh [76] found a direct relationship between managers’ attitudes on environment and the implementation of management systems. The findings of the study are on the same length with the results loomed by previous works in the case of one competitive advantage dimension, being recognized through improving/innovating products and/or services based on green processes and/or constituents, as a higher degree of integration of being proactively involved in environmental community activities rendered a higher tendency of acquiring a competitive advantage. However, for the other five competitive advantage dimensions (see Table 8), this marketing tool did not have a significant impact, the results not supporting the findings of previous works.
Being assertive about environment and communicating the endeavors is discussed based on the communication side, on one hand and the responsiveness approach, on the other hand. Thus, Prakash [38], Delafrooz et al. [51] and Rahbar and Abdul Wahid [53] underlined the high importance of communicating green advantages for acquiring marketing effectiveness based on information delivery and buying stimulation. Moreover, Moravcikova et al. [64] posited that businesses should communicate effectively their environmental accomplishments. In this regard, Khare [62] suggested that companies should communicate about a mix of green product features and health benefits, while Maniatis [57] suggested that companies should disseminate about ingredients and display green certification logos to differentiate themselves from other suppliers. From an instrumental perspective, for communication effectiveness businesses should design messages that would match green consumer expectations [63]. On the other hand, Singh et al. [26] suggested that companies should be assertive about environment to be noticed by prospects. The results of this study are on the same line with these works, regarding one competitive advantage dimension, acquiring a distinct market position based on being green, as a higher degree of integration of being assertive about environment and communicating the endeavors rendered a higher tendency of acquiring a competitive advantage. However, for the other five competitive advantage dimensions (see Table 8), this marketing tool did not have a significant impact, hence, the findings not supporting the results of previous works.
Assessing the findings from a competitive advantage strategic framework perspective, centering on Porter’s [30] and Orsato’s [19] works and Dangelico and Vocalelli’s [91] suggestions about using green ideas and endeavors to attain market differentiation, the paper prompts interesting results. The findings display that companies can attain competitive advantage based on being different on the six competitive advantage dimensions using four out of the five investigated green marketing tools. Surprising result were revealed in the case of selling biodegradable or recycled or refurbished products. According to the findings, this green marketing tool does not necessarily lead to competitive advantage based on being different on price and being recognized as the first or best through green endeavors, hence not supporting previous works emphasizing a direct relationship between green offers and higher prices [91,92] on one hand and between green products and innovation [89] on the other hand.
Going further to the descriptive variables, such variables are found in previous works on green competitiveness and marketing, especially for describing sample structure and not for explaining dependent variables [25,37,49,74,76]. However, the works of Lopez-Rodriguez [40] and Junquera and Barba-Sanchez [93] are two important exceptions. In the first work, the author used company size (based on the number of employees) and market type to explain the variance of green marketing integration, while in the second one, the authors employed company size (assessed based on the number of employees and turnover) and number of operational years to explain company performance and managerial perception of performance. The present study uncovered that business type had a significant effect on three competitive advantage dimensions (see Table 8). Thus, for the first variable, in comparison with other types of enterprises, services companies were more inclined to acquire a distinct market position based on being green, for the second variable, merchandise companies tended to be more inclined to acquire a green public image/brand enhancement, while for the third variable, manufacturing companies and to a lesser degree merchandise entities were more inclined to develop their businesses through green opportunities. Considering the findings, they do not support the results of Lopez-Rodriguez [40] in the case of these three significant situations and support them for the other three competitive advantage dimensions, as this descriptive variable did not have a significant effect. Number of employees did not render a significant effect in any assessment of the six dependent variables, so, the findings support the findings of Lopez-Rodriguez [40]. Industry in which the SMME operates did not have a significant effect in any of the six assessments. Due to a dearth of research on competitive dimensions, a direct comparison of the findings is difficult. Yet, in a broader perspective, the findings do not support the results of Banerjee et al. [94], as they concluded that industry type moderated an important number of relationships defining corporate environmentalism, which partially was also influenced by competitive advantage. Moreover, Brammer and Millington [95] uncovered that corporate community involvement, including environmental endeavors, was significantly impacted by the industry in which the company was operating. Thus, considering the non-significant study findings, they do not support the results and conclusions of these two works. The fourth descriptive variable, number of operational years had a significant effect on three competitive advantage dimensions. Hence, in comparison with other businesses, companies operating for less than two years were more inclined to acquire a distinct market position based on being green and a green public image/brand enhancement and to develop the business through green opportunities. For the other three dependent variables (see Table 8), this descriptive variable did not render a significant effect. The mixture of findings is quite similar with the findings of Junquera and Barba-Sanchez [93], as in their investigation on competitive advantage they found a significant relationship between the number of operational years and managerial perception of performance but a non-significant one between the operating time and company performance.
5. Conclusions
The study aimed to address green competitive advantage by using competitiveness dimensions, inquiring about the impact of green marketing tools and company description variables on these dimensions in the case of SMEs, comprising micro, small and medium enterprises (according to the European Commission’s classification [21]. This paper acknowledges competitive advantage as being more than a latent factor, namely the result of reduction techniques of a number of competitiveness dimensions [25,34,37,49]. This study focuses on investigating these dimensions as they represent the competitive advantage core which can be pursued by businesses. Also, the study develops on the few works probing into the explanatory effect of company descriptive variables [40,93] on green endeavors by investigating how each competitive advantage dimension can be used by different types of micro, small and medium enterprises. Thus, from a conceptual perspective the paper offers an alternative for comprehending and assessing green competitive advantage through a broader approach.
From a methodological perspective, a model is proposed using six competitive advantage dimensions, as dependent variables, starting from the work of Saeidi et al. [25]. The dependent variables are assessed using logistic regressions, in the first instance, against the degree of integration within companies of five green marketing tools derived from consumer buying decision criteria of green offers [26]. Subsequently, company descriptive variables were included in the model for explanatory purposes, aiming to delineate appropriate competitive advantage dimensions for various types of micro, small and medium companies. The green perspective of the model is augmented by the fact that it was tested in Western Cape, South Africa, a region marked by long-term drastic water consumption restrictions imposed due to severe draught and inadequate municipality management, which caused important consumer behavior changes [27,28] and, as a consequence, important adaptations on the ways micro, small and medium enterprises operate. Thus, the company descriptive variables were selected from previous green studies on such companies operating in South Africa (locally named SMMEs).
Based on results, the study enriches the literature on SMEs by displaying green marketing tools adequate for each green competitive advantage dimension and delineating competitiveness options based on descriptive variables. Each competitive advantage dimension was explained by at least one green marketing tool. Two green marketing tools had a significant effect on several dimensions. One of them, donating money and/or allocating time for environmental purposes, explained three dimensions (acquiring a green public image/brand enhancement; being recognized as the first or best through green endeavors; developing the business through green opportunities), while another one, selling biodegradable or recycled or refurbished products, had an inverse relationship with two of them (being recognized as delivering green value to the market by being different based on price; being recognized as the first or best through green endeavors). Two descriptive variables, business type and number of operational years, had a significant impact on three competitive advantage dimensions (acquiring a distinct market position based on being green; acquiring a green public image/brand enhancement; developing the business through green opportunities).
Regarding managerial implications, the results offer clear solutions for SMMEs in Western Cape, South Africa and provide viable options for companies in other parts of the world that would want to focus on sustainability for market positioning [96,97], as SMEs are the appropriate vehicles to support environmental causes in established and new industries [77]. Based on the findings, recommendations can be made to companies to opt between five marketing tools based on the business type and experience on the market, of course, considering their competitive advantage goals, capabilities and market opportunities and threats. Companies planning to donate money or allocate time for environmental purposes stand a better chance of acquiring competitive advantage because of the broader effect of this marketing tool. Companies selling environmentally friendly brands stand a better chance to be recognized as delivering green value to the market by being different based on price, while those ones being assertive about environment and communicating the endeavors stand a better chance of acquiring a distinct market position based on being green. Alternatively, companies proactively involved in environmental community activities stand a better chance of being recognized through improving/innovating products and/or services based on green processes and constituents. Based on the significant company descriptive variables, merchandise companies should aim for acquiring a green public image/brand enhancement or developing the business through green opportunities, manufacturing companies should focus on developing the business through green opportunities, while services companies should intent to acquire a distinct market position based on being green. Moreover, companies operating for less than two years should aspire to develop their businesses through green opportunities or acquire a green public image/brand enhancement or a distinct market position based on being green. Regardless of the usage of any of the described marketing options, SMEs must envisage a long-term green orientation [98] and constantly appraise their green performance [99], and, at the same time, make efforts to educate consumers towards an ecological conscious behavior [90].
The study provides valuable academic and managerial insights but it is not without limitations. One research limitation can be the focus on just one geographic area, although this region is appropriate to test the formulated hypotheses considering its environmental challenges [27,28] and the study is in line with many other works on SME environmental issues confined to a specific territory [100]. Future research should consider other geographic areas that are environmentally challenged for testing the research hypotheses and compare the findings. A second research limitation could be drawn from the green marketing tools included in the model. Hence, the model could be completed with tools treating explicitly green distribution, especially transport and/or logistic processes and green prices [101] to cover the traditional marketing mix [102], although aspects pertaining to these two areas are already comprised, such as reverse logistics [101] through investigating about selling biodegradable, recycled or refurbished products. Another research limitation could be the sampling methodology. Although the sample size is within the limits of previous studies on green endeavors in South African SMMEs [73,74,75,76], future research should use a different sampling methodology, a multiple layer one based on the descriptive variables would probably add more value to the findings [103]. Not necessarily as limitations but more as future research recommendations, firstly, the model should be enriched by including other descriptive variables, initially filtered through qualitative research methods [104,105]. For example, company turnover [39,93], responsible investment [106] or internationalization [107] could be employed to explain differences in the implementation of environmental practices Secondly, future research should address in more depth the inverse relationships uncovered in this study between the competitive dimensions focusing on price and market leadership and selling biodegradable, recycled or refurbished products to check whether these outcomes are isolated or not.
Author Contributions
All authors contributed to the conceptualization and methodology parts. Data curation was performed by R.D. and N.H., while Formal analysis was done by T.E., R.Z. and I.-C.N. All authors contributed to discussions and conclusions.
Funding
This research received no external funding.
Conflicts of Interest
The authors declare no conflict of interest.
Appendix A
Table A1.
Selling biodegradable or recycled or refurbished products—descriptive statistics.
Table A1.
Selling biodegradable or recycled or refurbished products—descriptive statistics.
| Frequency | Percent | Valid Percent | Cumulative Percent | ||
|---|---|---|---|---|---|
| Valid | Very low | 40 | 16.9 | 16.9 | 16.9 |
| Low | 12 | 5.1 | 5.1 | 21.9 | |
| Neutral | 48 | 20.3 | 20.3 | 42.2 | |
| High | 72 | 30.4 | 30.4 | 72.6 | |
| Very high | 65 | 27.4 | 27.4 | 100.0 | |
| Total | 237 | 100.0 | 100.0 | ||
Source: own research.
Table A2.
Selling environmentally friendly brands—descriptive statistics.
Table A2.
Selling environmentally friendly brands—descriptive statistics.
| Frequency | Percent | Valid Percent | Cumulative Percent | ||
|---|---|---|---|---|---|
| Valid | Very low | 61 | 25.7 | 25.7 | 25.7 |
| Low | 15 | 6.3 | 6.3 | 32.1 | |
| Neutral | 45 | 19.0 | 19.0 | 51.1 | |
| High | 67 | 28.3 | 28.3 | 79.3 | |
| Very high | 49 | 20.7 | 20.7 | 100.0 | |
| Total | 237 | 100.0 | 100.0 | ||
Source: own research.
Table A3.
Being proactively involved in environmental community activities—descriptive statistics.
Table A3.
Being proactively involved in environmental community activities—descriptive statistics.
| Frequency | Percent | Valid Percent | Cumulative Percent | ||
|---|---|---|---|---|---|
| Valid | Very low | 43 | 18.1 | 18.1 | 18.1 |
| Low | 18 | 7.6 | 7.6 | 25.7 | |
| Neutral | 48 | 20.3 | 20.3 | 46.0 | |
| High | 79 | 33.3 | 33.3 | 79.3 | |
| Very high | 49 | 20.7 | 20.7 | 100.0 | |
| Total | 237 | 100.0 | 100.0 | ||
Source: own research.
Table A4.
Being assertive about environment and communicating the endeavors—descriptive statistics.
Table A4.
Being assertive about environment and communicating the endeavors—descriptive statistics.
| Frequency | Percent | Valid Percent | Cumulative Percent | ||
|---|---|---|---|---|---|
| Valid | Very low | 46 | 19.4 | 19.4 | 19.4 |
| Low | 15 | 6.3 | 6.3 | 25.7 | |
| Neutral | 51 | 21.5 | 21.5 | 47.3 | |
| High | 65 | 27.4 | 27.4 | 74.7 | |
| Very high | 60 | 25.3 | 25.3 | 100.0 | |
| Total | 237 | 100.0 | 100.0 | ||
Source: own research.
Table A5.
Donating money and/or allocating time for environmental purposes—descriptive statistics.
Table A5.
Donating money and/or allocating time for environmental purposes—descriptive statistics.
| Frequency | Percent | Valid Percent | Cumulative Percent | ||
|---|---|---|---|---|---|
| Valid | Very low | 22 | 9.3 | 9.3 | 9.3 |
| Low | 12 | 5.1 | 5.1 | 14.3 | |
| Neutral | 76 | 32.1 | 32.1 | 46.4 | |
| High | 68 | 28.7 | 28.7 | 75.1 | |
| Very high | 59 | 24.9 | 24.9 | 100.0 | |
| Total | 237 | 100.0 | 100.0 | ||
Source: own research.
References
- Magretta, J. Growth through global sustainability: An interview with Monsato’s CEO, Robert B. Shapiro. Harvard Bus. Rev. 1997, 75, 79–88. [Google Scholar]
- Hart, L.S.; Milstein, B.M. Creating sustainable value. Acad. Manag. Exec. 2003, 17, 56–67. [Google Scholar] [CrossRef]
- Miles, M.P.; Covin, J.G. Environmental Marketing: A source of reputational, competitive, and financial advantage. J. Bus. Ethics 2000, 23, 299–311. [Google Scholar] [CrossRef]
- Bryson, R.J.; Lombardi, R. Balancing product and process sustainability against business profitability: Sustainability as a competitive strategy in the property development process. Bus. Strateg. Environ. 2009, 18, 97–107. [Google Scholar] [CrossRef]
- Elkington, J. Cannibals with Forks: The Triple Bottom Line of 21st Century Business; Capstone Publishing: Oxford, UK, 1997; ISBN 978-18-4112-084-3. [Google Scholar]
- Singh, S. Environmentally-friendly. In Green Consumerism: An A-To-Z Guide; Mansvelt, J.R., Robbins, P., Eds.; Sage Knowledge: Thousand Oaks, CA, SUA, 2010; ISBN 978-1-4129-9685-3. [Google Scholar]
- Hartmann, P.; Ibáñez, V.A.; Sainz, F.J.F. Green branding effects on attitude: Functional versus emotional positioning strategies. Mark. Intell. Plan. 2005, 23, 9–29. [Google Scholar] [CrossRef]
- Straughan, R.D.; Roberts, J.A. Environmental segmentation alternatives: A look at green consumer behavior in the new millennium. J. Consum. Mark. 1999, 16, 558–575. [Google Scholar] [CrossRef]
- Ottman, J.A.; Stafford, R.E.; Hartman, L.C. Avoiding green marketing myopia: Ways to improve consumer appeal for environmentally preferable products. Environ. Sci. Policy Sustain. Dev. 2006, 48, 22–36. [Google Scholar] [CrossRef]
- Coleman, L.J.; Bahnan, N.; Kelkar, M.; Curry, N. Walking the walk: How the theory of reasoned action explains adult and student intentions to go green. J. Appl. Bus. Res. 2011, 27, 107–116. [Google Scholar] [CrossRef]
- Grant, J. Green marketing. Strateg. Dir. 2008, 24, 25–27. [Google Scholar] [CrossRef]
- Cronin, J.J.; Smith, J.S.; Gleim, M.R.; Ramirez, E.; Martinez, J.D. Green marketing strategies: An examination of stakeholders and the opportunities they present. J. Acad. Mark. Sci. 2011, 39, 158–174. [Google Scholar] [CrossRef]
- Ginsberg, J.M.; Bloom, P.N. Choosing the right green-marketing strategy. MIT Sloan Manag. Rev. 2004, 46, 79–84. [Google Scholar]
- Porter, M.E.; van der Linde, C. Toward a New conception of the environment-Competitiveness Relationship. J. Econ. Perspect. 1995, 9, 97–118. [Google Scholar] [CrossRef]
- Shrivastava, P. Environmental technologies and competitive advantage. Strateg. Manag. J. 1995, 16, 183–200. [Google Scholar] [CrossRef]
- Dangelico, R.M.; Pujari, D. Mainstreaming green product innovation: Why and How Companies Integrate Environmental Sustainability. J. Bus. Ethics 2010, 95, 471–486. [Google Scholar] [CrossRef]
- Isaak, R. The Making of the ecopreneur. In Making Ecopreneurs: Developing Sustainable Entrepreneurship, 2nd ed.; Schaper, M., Ed.; Routledge: New York, NY, USA, 2016; pp. 43–78. ISBN 978-0-566-08875-9. [Google Scholar]
- Simpson, M.; Taylor, N.; Barker, K. Environmental responsibility in SMEs: Does it deliver competitive advantage? Bus. Strateg. Environ. 2004, 13, 156–171. [Google Scholar] [CrossRef]
- Orsato, R.J. Competitive environmental strategies: When does it pay to be green? Calif. Manag. Rev. 2006, 48, 127–143. [Google Scholar] [CrossRef]
- Worthington, I.; Patton, D. Strategic intent in the management of the green environment within SMEs: An analysis of the uk screen-printing sector. Long Range Plan. 2005, 38, 197–212. [Google Scholar] [CrossRef]
- European Union Commission. Commission recommendation of 6 May 2003 concerning the definition of micro, small and medium-sized enterprises. Off. J. Eur. Union 2003, 46, 36–41. [Google Scholar]
- Taylor, M.J.; Thrift, J.N. Industrial linkage and the segmented economy: 1. Some theoretical proposals. Environ. Plan. A 1982, 14, 1601–1613. [Google Scholar] [CrossRef]
- Taylor, M.J.; Thrift, J.N. Industrial linkage and the segmented economy: 2. An empirical reinterpretation. Environ. Plan. A 1982, 14, 1615–1632. [Google Scholar] [CrossRef]
- Kumar, P. Green marketing innovations in small Indian firms. World J. Entrep. Manag. Sustain. Dev. 2015, 11, 176–190. [Google Scholar] [CrossRef]
- Saeidi, S.P.; Sofian, S.; Saeidi, P.; Saeidi, S.P.; Saaeidi, S.A. How does corporate social responsibility contribute to firm financial performance? The mediating role of competitive advantage, reputation, and customer satisfaction. J. Bus. Res. 2015, 68, 341–350. [Google Scholar] [CrossRef]
- Singh, S.; Vrontis, D.; Thrassou, A. Green marketing and consumer behavior: The case of gasoline products. J. Transnat. Manag. 2011, 16, 84–106. [Google Scholar] [CrossRef]
- Bauer, S.; Scholz, I. Adaptation to climate change in Southern Africa: New boundaries for development? In Adaptation to Climate Change in Southern Africa: New Boundaries for Development, 2nd ed.; Bauer, S., Scholz, I., Eds.; Routledge: London, UK, 2015; ISBN 978-11-3654-202-2. [Google Scholar]
- Muller, M. Understanding the origins of cape town’s water crisis. Civ. Eng. 2017, 25, 11–16. [Google Scholar]
- Bureau for Economic Research (BER). The Small, Medium and Micro Enterprise Sector of South Africa. BER Research Note. 2016, p. 1. Available online: http://www.seda.org.za/Publications/Publications/The%20Small,%20Medium%20and%20Micro%20Enterprise%20Sector%20of%20South%20Africa%20Commissioned%20by%20Seda.pdf (accessed on 15 October 2017).
- Porter, M.E. Competitive Advantage: Creating and Sustaining Superior Performance; FreePress: New York, NY, USA, 1985; ISBN 978-06-8484-146-5. [Google Scholar]
- Ries, A.; Trout, J. Positioning-The Battle for Your Mind; McGraw-Hill: New York, NY SUA, 2001; ISBN 978-00-7137-358-6. [Google Scholar]
- Edu, T.; Negricea, I.C. CSR Market Positioning Constructs: From Planning to Action. Evidence from Romanian Internet Service Providers. In The Dynamics of Corporate Social Responsibility; Aluchna, M., Idowu, S.O., Eds.; Springer: Cham, Switzerland, 2017; pp. 117–137. ISBN 978-33-1939-088-8. [Google Scholar]
- Day, G.S.; Wensley, R. Assessing advantage: A framework for diagnosing competitive superiority. J. Mark. 1988, 52, 1–20. [Google Scholar] [CrossRef]
- Chang, C.H. The influence of corporate environmental ethics on competitive advantage: The mediation role of green innovation. J. Bus. Ethics 2011, 104, 361–370. [Google Scholar] [CrossRef]
- Peattie, K. Green Marketing; Pitman Publishing Corp.: London, UK, 1992; ISBN 071-210-843-2. [Google Scholar]
- Arseculeratne, D.; Yazdanifard, R. How green marketing can create a sustainable competitive advantage for a business. Int. Bus. Res. 2013, 7, 130–137. [Google Scholar] [CrossRef]
- Chen, Y.S.; Lai, S.B.; Wen, C.T. The influence of green innovation performance on corporate advantage in Taiwan. J. Bus. Ethics 2006, 67, 331–339. [Google Scholar] [CrossRef]
- Prakash, A. Green marketing, public policy and managerial strategies. Bus. Strateg. Environ. 2002, 11, 285–297. [Google Scholar] [CrossRef]
- Uhlaner, L.M.; Berent-Braun, M.M.; Jeurissen, J.M.J.; de Wit, G. Beyond size: Predicting engagement in environmental management practices of Dutch SMEs. J. Bus. Ethics 2012, 109, 411–429. [Google Scholar] [CrossRef]
- Lopez-Rodríguez, S. Green marketing and a broader stakeholder orientation. Acad. Mark. Stud. J. 2016, 20, 14–25. [Google Scholar]
- Hamann, R.; Smith, J.; Tashman, P.; Marshall, R.S. Why do SMEs go green? An analysis of wine firms in South Africa. Bus. Soc. 2017, 56, 23–56. [Google Scholar] [CrossRef]
- Ryan, A.; O’Malley, L.; O’Dwyer, M. Responsible business practice: Re-framing CSR for effective SME engagement. Eur. J. Int. Manag. 2010, 4, 290–302. [Google Scholar] [CrossRef]
- Fiore, M.; Silvestri, R.; Conto, F.; Pellegrini, G. Understanding the relationship between green approach and marketing innovations tools in the wine sector. J. Clean. Prod. 2017, 142, 4085–4091. [Google Scholar] [CrossRef]
- Aboelmaged, M. The drivers of sustainable manufacturing practices in Egyptian SMEs and their impact on competitive capabilities: A PLS-SEM model. J. Clean. Prod. 2018, 175, 207–221. [Google Scholar] [CrossRef]
- Gupta, H.; Barua, M.K. Supplier selection among SMEs on the basis of their green innovation ability using BWM and fuzzy TOPSIS. J. Clean. Prod. 2017, 152, 242–258. [Google Scholar] [CrossRef]
- Revell, A.; Stokes, D.; Chen, H. Small businesses and the environment: Turning over a new leaf? Bus. Strateg. Environ. 2010, 19, 273–288. [Google Scholar] [CrossRef]
- Delchet-Cochet, K.; Vo, L.C.; Akeb, H. From compliance with environmental regulations to pursuit of environmental-Based competitive advantages: Mediators of the relationship in a SME context. J. Appl. Bus. Res. 2015, 31, 987–1004. [Google Scholar] [CrossRef]
- Leonidou, L.C.; Christodoulides, P.; Kyrgidou, L.P.; Palihawadana, D. Internal drivers and performance consequences of small firm green business strategy: The moderating role of external forces. J. Bus. Ethics 2017, 140, 585–606. [Google Scholar] [CrossRef]
- Dunk, A.S. Assessing the effects of product quality and environmental management accounting on the competitive advantage of firms. Australa. Account. Bus. Financ. J. 2007, 1, 28–38. [Google Scholar]
- Rivera-Camino, J. Re-evaluating green marketing strategy: A stakeholder perspective. Eur. J. Mark. 2007, 41, 1328–1358. [Google Scholar] [CrossRef]
- Delafrooz, N.; Taleghani, M.; Nouri, B. Effect of green marketing on consumer purchase behavior. QSci. Connect 2014, 5. [Google Scholar] [CrossRef]
- D’Souza, C.; Taghian, M.; Lamb, P. An Empirical study on the influence of environmental labels on consumers. Corp. Commun. Int. J. 2006, 11, 162–173. [Google Scholar] [CrossRef]
- Rahbar, E.; Wahid, N.A. Investigation of green marketing tools’ effect on consumers’ purchase behavior. Bus. Strategy 2011, 12, 73–83. [Google Scholar] [CrossRef]
- Zaman, A.U.; Miliutenko, S.; Nagapetan, V. Green marketing or green wash?: A comparative study of consumers’ behavior on selected eco and fair trade labeling in Sweden. J. Ecol. Nat. Environ. 2010, 2, 104–111. [Google Scholar]
- Daily, G.C. Introduction: What are ecosystem services? In Nature’s Services: Societal Dependence on Natural Ecosystems; Daily, G.C., Ed.; Island Press: Washington, DC, USA, 1997; pp. 1–10. ISBN 1-55963-476-6. [Google Scholar]
- Goncalves, H.M.; Lourenco, T.F.; Silva, G.M. Green buying behavior and the theory of consumption values: A fuzzy-set approach. J. Bus. Res. 2016, 69, 1484–1491. [Google Scholar] [CrossRef]
- Maniatis, P. Investigating factors influencing consumer decision-making while choosing green products. J. Clean. Prod. 2016, 132, 215–228. [Google Scholar] [CrossRef]
- Kumar, P.; Ghodeswar, B.M. Factors affecting consumers’ green product purchase decisions. Mark. Intell. Plan. 2015, 33, 330–347. [Google Scholar] [CrossRef]
- Majid, K.A.; Russell, C.A. Giving green a second thought: Modeling the value retention of green products in the secondary market. J. Bus. Res. 2015, 68, 994–1002. [Google Scholar] [CrossRef]
- Mohd Suki, N. Green product purchase intention: Impact of green brands, attitude, and knowledge. Br. Food J. 2016, 118, 2893–2910. [Google Scholar] [CrossRef]
- Chekima, B.; Wafa, S.A.W.S.K.; Igau, O.A.; Chekima, S.; Sondoh, S.L., Jr. Examining green consumerism motivational drivers: Does premium price and demographics matter to green purchasing? J. Clean. Prod. 2016, 112, 3436–3450. [Google Scholar] [CrossRef]
- Khare, A. Antecedents to green buying behaviour: A study on consumers in an emerging economy. Mark. Intell. Plan. 2015, 33, 309–329. [Google Scholar] [CrossRef]
- Line, N.D.; Hanks, L.; Zhang, L. Sustainability communication: The effect of message construals on consumers’ attitudes towards green restaurants. Int. J. Hosp. Manag. 2016, 57, 143–151. [Google Scholar] [CrossRef]
- Moravcikova, D.; Krizanova, A.; Kliestikova, J.; Rypakova, M. Green Marketing as the Source of the Competitive Advantage of the Business. Sustainability 2017, 9, 2218. [Google Scholar] [CrossRef]
- Goh, S.K.; Balaji, M.S. Linking green skepticism to green purchase behavior. J. Clean. Prod. 2016, 131, 629–638. [Google Scholar] [CrossRef]
- Mekonnen, M.M.; Hoekstra, A.Y. Four billion people facing severe water scarcity. Sci. Adv. 2016, 2, e1500323. [Google Scholar] [CrossRef] [PubMed]
- Nevondo, H. Independent economic regulation for water: Is it a solution to the water sector woes? CIGFARO J. 2017, 18, 28–31. [Google Scholar]
- Besada, H.; Werner, K. An assessment of the effects of Africa’s water crisis on food security and management. Int. J. Water Resour. Dev. 2015, 31, 120–133. [Google Scholar] [CrossRef]
- Nel, N.; Jacobs, H.E.; Loubser, C.; Du Plessis, K.J. Supplementary household water sources to augment potable municipal supply in South Africa. Water SA 2017, 43, 553–562. [Google Scholar] [CrossRef]
- Venter, J. Cautious optimism for the future of SA. Farmer’s Wkly. 2018, 18, 14. [Google Scholar]
- Human, U. Overview of weather conditions and water availability. Oilseeds Focus 2018, 4, 14–17. [Google Scholar]
- Cordes, M. Drought and markets. Farmer’s Wkly. 2018, 18, 51–52. [Google Scholar]
- Maziriri, E.T.; Chinomona, E. Modeling the influence of relationship marketing, green marketing and innovative marketing on the business performance of small, medium and micro enterprises (SMMES). J. Econ. Behav. Stud. 2016, 8, 127–139. [Google Scholar]
- Mukonza, C. Analysis of Factors Influencing green entrepreneurship in South Africa. In Collection of United Nations University Institute for Natural Resources in Africa (UNU-INRA) Working Papers; Yong Nje, D., Nutakor, P., Eds.; UNU-INRA: Accra, Ghana, 2016; Volume 20, p. IV-31. ISBN 978-9-9886-3318-9. [Google Scholar]
- Lekhanya, L.M. The Level of Awareness of green marketing and its managerial implications amongst selected south african manufacturing small, medium and micro enterprises (SMMEs) in KwaZulu–Natal. J. Econ. Behav. Stud. 2014, 6, 625–635. [Google Scholar]
- Struwig, F.M.W.; Riyaadh, L. South African small and medium-sized enterprise owners’ intention to implement an environmental management system. South. Afr. J. Entrep. Small Bus. Manag. 2017, 9, a104. [Google Scholar] [CrossRef]
- OECD (Organisation for Economic Cooperation and Development) Working Party on SMEs and Entrepreneurship (WPSMEE). SMEs and Green Growth: Promoting Sustainable Manufacturing and Eco-Innovation in Small Firms. Presented at the Bologna+10 High-Level Meeting on Lessons from the Global Crisis and the Way Forward to Job Creation and Growth, Paris, France, 17–18 November 2010; Available online: https://www.oecd.org/cfe/smes/46404383.pdf (accessed on 11 September 2017).
- Kothari, C.R. Research Methodology: Methods and Techniques, 2nd ed.; New Age International: New Delhi, India, 2004; ISBN 978-81-2241-522-3. [Google Scholar]
- Mishra, S.; Suar, D. Does corporate social responsibility influence firm performance of Indian companies? J. Bus. Ethics 2010, 95, 571–601. [Google Scholar] [CrossRef]
- Maignan, I.; Ferrell, O.C. Antecedents and benefits of corporate citizenship: An investigation of French businesses. J. Bus. Res. 2001, 51, 37–51. [Google Scholar] [CrossRef]
- Peduzzi, P.N.; Concato, J.; Kemper, E.; Holford, T.R.; Feinstein, A.R. A simulation study of the number of events per variable in logistic regression analysis. J. Clin. Epidemiol. 1996, 49, 1373–1379. [Google Scholar] [CrossRef]
- Babyak, A.M. What You See May Not Be What you get: A brief, nontechnical introduction to overfitting in regression-type models. Psychosom. Med. 2004, 66, 411–421. [Google Scholar] [CrossRef] [PubMed]
- Field, A. Discovering Statistics Using SPSS, 3rd ed.; Sage Publications: London, UK, 2009; ISBN 978-18-4787-907-3. [Google Scholar]
- Wuensch, K.L. Binary Logistic Regression with SPSS. 2014. Available online: http://core.ecu.edu/psyc/wuenschk/MV/MultReg/Logistic-SPSS.pdf (accessed on 10 February 2018).
- Menard, S. Applied Logistic Regression Analysis, 2nd ed.; Sage Publication: Thousand Oaks, CA, SUA, 2002; ISBN 978-0-7619-2208-7. [Google Scholar]
- Muir, S.W.; Berg, K.; Chesworth, B.; Klar, N.; Speechley, M. Balance impairment as a risk factor for falls in community-dwelling older adults who are high functioning. A prospective study. Phys. Ther. 2010, 90, 338–347. [Google Scholar] [CrossRef] [PubMed]
- Friendly, M. Visualising Categorical Data; SAS Institute: Carry, NC, USA, 2000; ISBN 1-58025-660-0. [Google Scholar]
- Schaper, M. Understanding the Green Entrepreneur. In Making Ecopreneurs: Developing Sustainable Entrepreneurship, 2nd ed.; Schaper, M., Ed.; Routledge: New York, NY, USA, 2016; pp. 7–20. ISBN 978-0-5660-8875-9. [Google Scholar]
- Kuo, T.C.; Smith, S. A systematic review of technologies involving eco-innovation for enterprises moving towards sustainability. J. Clean. Prod. 2018, 192, 207–220. [Google Scholar] [CrossRef]
- Taufique, K.M.R.; Vaithianathan, S. A fresh look at understanding Green consumer behavior among young urban Indian consumers through the lens of Theory of Planned Behavior. J. Clean. Prod. 2018, 183, 46–55. [Google Scholar] [CrossRef]
- Dangelico, R.M.; Vocalelli, D. “Green Marketing”: An analysis of definitions, strategy steps, and tools through a systematic review of the literature. J. Clean. Prod. 2017, 165, 1263–1279. [Google Scholar] [CrossRef]
- Rosenbaum, M.S.; Wong, I.A. Green marketing programs as strategic initiatives in hospitality. J. Serv. Market. 2015, 29, 81–92. [Google Scholar] [CrossRef]
- Junquera, B.; Barba-Sánchez, V. Environmental Proactivity and Firms’ Performance: Mediation Effect of Competitive Advantages in Spanish Wineries. Sustainability 2018, 10, 2155. [Google Scholar] [CrossRef]
- Banerjee, S.B.; Iyer, E.S.; Kashyap, R.K. Corporate Environmentalism: Antecedents and Influence of Industry Type. J. Mark. 2003, 67, 106–122. [Google Scholar] [CrossRef]
- Brammer, S.; Millington, A. The effect of stakeholder preferences, organizational structure and industry type on corporate community involvement. J. Bus. Ethics 2003, 45, 213–226. [Google Scholar] [CrossRef]
- Mousiolis, D.T.; Zaridis, A.D.; Karamanis, K.; Rontogianni, A. Corporate social responsibility in smes and mnes. The different strategic decision making. Procedia Soc. Behav. Sci. 2015, 175, 579–583. [Google Scholar] [CrossRef]
- Stoian, C.; Zaharia, R.M. CSR development in post-communist economies: Employees’ expectations regarding corporate socially responsible behaviour–the case of Romania. Bus. Ethics A Eur. Rev. 2012, 21, 380–401. [Google Scholar] [CrossRef]
- Chen, F.; Ngniatedema, T.; Li, S. A cross-country comparison of green initiatives, green performance and financial performance. Manag. Decis. 2018, 56, 1008–1032. [Google Scholar] [CrossRef]
- Seth, D.; Seth, N.; Dhariwal, P. Application of value stream mapping (VSM) for lean and cycle time reduction in complex production environments: A case study. Prod. Plan. Contr. 2017, 28, 398–419. [Google Scholar] [CrossRef]
- Aykol, B.; Leonidou, L.C. Researching the green practices of smaller service firms: A theoretical, methodological, and empirical assessment. J. Small Bus. Manag. 2015, 53, 1264–1288. [Google Scholar] [CrossRef]
- Sohail, M.S. Green Marketing Strategies: How Do They Influence Consumer-Based Brand Equity? J. Glob. Bus. Adv. 2017, 10, 229–243. [Google Scholar] [CrossRef]
- Kotler, P.; Keller, K.L.; Brady, M.; Goodman, M.; Hanser, T. Marketing Management, 3rd ed.; Pearson Education: Harlow, SUA, 2016; ISBN 978-0-13-385646-0. [Google Scholar]
- Haydam, N.; Purcarea, T.; Edu, T.; Negricea, I.C. Explaining Satisfaction at a Foreign Tourism Destination—An Intra-Generational Approach Evidence within Generation Y from South Africa and Romania. Amfiteatru Econ. 2017, 19, 528–542. [Google Scholar]
- Zaharia, R.; Zaharia, R.M. Qualitative Research Methods: How to Ask and Whom to Ask? A Comparison between Focus Group and In-depth Interviews. In Proceedings of the International E-Conference on Enterprises in the Global Economy; Vancea, D.P.C., Zaharia, R.M., Eds.; Filodirito Publisher: Bologna, Italy, 2017. [Google Scholar]
- Epuran, G.; Tescasiu, B.; Todor, R.D.; Sasu, K.A.; Cristache, N. Responsible consumption—Source of competitive advantages and solution for tourist protection. Amfiteatru Econ. 2017, 19, 447–462. [Google Scholar]
- Frias-Aceituno, J.V.; Rodríguez-Ariza, L.; Garcia-Sánchez, I.M. Explanatory factors of integrated sustainability and financial reporting. Bus. Strateg. Environ. 2014, 23, 56–72. [Google Scholar] [CrossRef]
- Dyduch, J.; Krasodomska, J. Determinants of corporate social responsibility disclosure: An empirical study of Polish Listed companies. Sustainability 2017, 9, 1934. [Google Scholar] [CrossRef]


© 2018 by the authors. Licensee MDPI, Basel, Switzerland. This article is an open access article distributed under the terms and conditions of the Creative Commons Attribution (CC BY) license (http://creativecommons.org/licenses/by/4.0/).