Article

How Water Bottle Refill Stations Contribute to Campus Sustainability: A Case Study in Japan

1
College of Policy Science, Ritsumeikan University, 2-150 Iwakura-cho, Ibaraki City, Osaka 567-8570, Japan
2
Research Organization of Open Innovation and Collaboration, Ritsumeikan University, 2-150 Iwakura-cho, Ibaraki City, Osaka 567-8570, Japan
*
Author to whom correspondence should be addressed.
Sustainability 2018, 10(9), 3074; https://doi.org/10.3390/su10093074
Submission received: 24 July 2018 / Revised: 21 August 2018 / Accepted: 26 August 2018 / Published: 29 August 2018

Abstract

:
The purpose of this study was to explore the feasibility of installing Water bottle Refill Stations (WRSs) and their contributions to campus sustainability by means of encouraging pro-environmental behavior in students. Plastic waste is one of the most critical environmental issues. Therefore, we investigated how WRS can deter students from using disposable plastic bottles. We conducted a survey at a Japanese university to address (1) students’ Willingness To Pay (WTP) to install WRS, (2) their Willingness To Use (WTU) WRSs while acknowledging its environmental benefits, and (3) the impact of communicating information about points (1) and (2). We utilized Goal-Framing Theory (GFT) and the Integrated Framework for Encouraging Pro-Environmental Behavior (IFEP) as the theoretical background of our study. The results of our survey found that the mean WTP was 2211 JPY (1 JPY = 0.01 USD), an amount students would donate just once. This finding indicates students would be willing to pay to install a WRS at their university. The mean WTP students supported would be enough to cover the WRS installation and maintenance costs. According to our study, 58.82% of students stated that they would be willing to use WRS. In doing so, students would save 45,191 disposable plastic bottles and reduce 10,846 kg of related CO2 emissions every year. Our study also showed a statistically significant increase in WTP and WTU WRS as we introduced more and more information about pro-environmental behaviors to students. This finding indicates the importance of information campaigning and learning how to encourage pro-environmental behavior.

1. Introduction

Campus sustainability as a discipline is of growing importance not only for university campuses, but also for its possible implications for society as a whole [1,2,3]; Universities have a social responsibility to address environmental issues, and they can play unique role in a sustainable society [1]. This role could include educating future leaders, researchers, consumers and entrepreneurs [1,4]. In other words, campus sustainability practices could make a long-term and wide contribution to society by educating students [4], in addition to direct and short-term contributions such as reducing waste and saving energy.
Among the various environmental issues universities need to address [5], plastic waste is one of the major issues in the era of “plasticene” [6] or “plastisphere” [7], therefore, its management becomes a critical issue [4]. It is estimated 8300 million metric tons of virgin plastic have been produced and 79% of it is accumulated in landfills or the natural environment [8]. A significant amount of plastic waste has also polluted the oceans [9,10,11,12]. Jambeck et al. [9] estimated 4.8–12.7 million metric tons of plastic waste was dumped into the ocean in 2010 because of insufficient plastic waste management. Due to this, there is a growing concern on how plastic waste could potentially impact human bodies, animals, plants, economies, and ecosystems [13,14]. By utilizing the natural capital valuation approach, the UNEP estimated that the natural capital cost of plastic in the consumer goods sector was 75 billion USD per year and the natural cost of plastic in marine ecosystems was 13 billion USD per year [13].
This paper intends to shed light on how Water bottle Refill Stations (WRSs) could potentially contribute to campus sustainability by reducing the amount of disposable plastic bottles with a device that utilizes refillable water bottles. A WRS is a device designed to provide drinkable tap water to users with a refillable water bottle. Users simply place a refillable bottle under the WRS’s sensor and it dispenses water directly into the bottle. Universities in the United States have begun installing WRSs in an effort to reduce the number of plastic bottles used on campuses [15,16]. Installing WRSs is just one way universities can contribute to campus sustainably goals. While there is no agreed-upon definition of campus sustainability [17], it generally comprises of four main attributes; (1) ecological (e.g., food and recycling), (2) economic and financial (e.g., endowment transparency), (3) institutional (e.g., student involvement) and (4) energetic (e.g., climate change and energy) [5]. For example, Washington University in St. Louis, installed a WRS in order to meet one of their campus sustainability goals. In 2014–2015, due to the campus wide bottle water ban and the implementation of a WRS, the university saw a reduction of 567,000 plastic bottle purchases [18]. It also reduced the university’s carbon footprint levels by decreasing the production and transportation of plastic bottles as well as limited the number of un-recyclable plastic bottles ending up in landfills [19].
While WRSs offer a number of promising contributions to campus sustainability, there seems to be a paucity of academic literature on the subject. Most information currently available can be found from campus reports (e.g., Reference [16]), online newspapers [20,21], and campus project proposals [22], though not rigorous scientific studies. In addition, most of the campus reports and studies have been conducted solely in the U.S. Our study intends to fill these gaps. Due to a number of universities banning the sale of plastic bottles [23,24,25,26], there have since been extensive studies on drinking water preferences (e.g., tap water vs bottled water) in the U.S. Our study has taken advantage of the information gathered from these related studies.
The purpose of this study was to investigate how WRSs could contribute to campus sustainability by students answering three Research Questions (RQs). First, we measured how many students would support a WRS by analyzing their Willingness To Pay (WTP) for WRS (RQ1). Second, we measured students’ Willingness To Use (WTU) WRS and its impacts on the environment measured by avoiding disposable plastic bottle uses with related CO2 emissions (RQ2). Third, we analyzed the impact of disseminating information about RQ1 and RQ2 (RQ3). We conducted a survey at a university in Japan to answer these research questions.
The remainder of the paper is organized as follows. Section 2 explains materials and methods, including the theoretical background of our study. Section 3 outlines the results. The last section discusses the implications of our findings regarding the three research questions, the limitation of our study, and the conclusion.

2. Materials and Methods

This section addresses the materials and methods used to answer our three research questions. After introducing our case study, we explain the theoretical background we based our questionnaire design on. Then, we explain the questionnaire design and assessment methods. Lastly, we explain how we analyzed the data obtained from the questionnaire survey.

2.1. Case Study

We conducted a survey in a class composed of first-year policy science students at Ritsumeikan University, located in Osaka, Japan. Ritsumeikan University strives to achieve campus sustainability. One way Ritsumeikan University has tried to enhance campus sustainability and contribute to a sustainable society is by creating a set of guidelines intended to encourage pro-environmental behavior in students and staff [27].
The survey was distributed to first-year students in an introduction to policy science research methods class, taught by one of the authors. Of the 410 students enrolled in the College of Policy Science, 362 participated in our survey. The remainder of the students are enrolled in the Community and Regional Policy Students (CRPS) degree program, and are not registered for this particular research methods class and therefore did not complete the survey. Since we did not have the opportunity to ask CRPS students to participate in the survey, they are excluded from our sample pool.

2.2. Theoretical Background

There have been a number of theories developed to understand pro-environmental behavior. For example, Theory of Planned Behavior (TPB), Value-Belief-Norm theory (VBN), and Goal-Framing Theory (GFT) are prediction models commonly used in environmental research [28,29]. Each theory has a different focus. While the TPB focuses on individual cost-benefit analysis [30,31,32], the VBN focuses on personal norm [33]. GFT is more comprehensive than TPB and VBN because it proposes three different goals (hedonic, gain, and normative) to encourage pro-environmental behavior [34]. Self-regulation models are another type of theory focusing on the dynamic psychological mechanisms explaining people’s behavior, as opposed to predicting people’s behavior [28].
Our research adopted the Integrated Framework for Encouraging Pro-Environmental Behavior (IFEP), which draws on GFT [29], for our theoretical background. There have been a number of studies conducted utilizing the IFEP and GFT. One example is its use to test the empirical validity of the IFEP in Sweden [35]. Another example is the work of Rezvani et al. [36], who applied GFT to try to explain consumer electric vehicle adoption. Pro-environmental behavior often involves a conflict between hedonic or gain goals with normative goals; therefore, strategies to encourage pro-environmental behavior should take into account the conflict or balance among them. The IFEP proposes two strategies to influence hedonic, gain and normative goals. The first strategy is to reduce the conflict between hedonic (e.g., enjoyable) or gain goals (e.g., cost saving) with normative goals (e.g., right thing to do). It is important to note there is some risk in encouraging hedonic and gain goals exclusively as it may push normative goals to the background and undermine sustainable pro-environmental behavior [29]. Therefore, the second strategy is critical to strengthen normative goals for substantial behavior change. If a person focuses on normative goals, it strengthens individual values which in turn can impact the way a person perceives the importance of a situation. If normative goals are linked to a person’s values, the strength of those values can outweigh perceived costs of pro-environmental behavior.
There are two reasons we adopted the IFEP for our research. First, it includes more comprehensive goals than other theories and our case study utilizes these various goals. Other theories, such as the theory of planned behavior, focuses more on individual cost-benefit analyses [30], which is not the focus of our particular case study. Second, the IFEP emphasizes that situational factors play a prominent role [29]. The main intention behind installing WRS on campuses is to introduce a situational factor, which in this case, would be to deter students from using disposable plastic bottles.

2.3. Questionnaire Design and Asessment Methods

Based on the IFEP framework, we designed a survey to test how WRS could contribute to influencing students’ pro-environmental behaviors. The target pro-environmental behavior was to encourage students not to use disposable plastic bottles, which would result in less plastic waste and CO2 emissions. This behavioral change may create a conflict between hedonic or gain goals and normative goals; students would have to give up convenient and better tasting water (i.e., disposable plastic water bottles) in order to support a pro-environmental choice. Therefore, the IFEP may be effective in encouraging students to make the pro-environmental change by reducing the conflict between these goals.
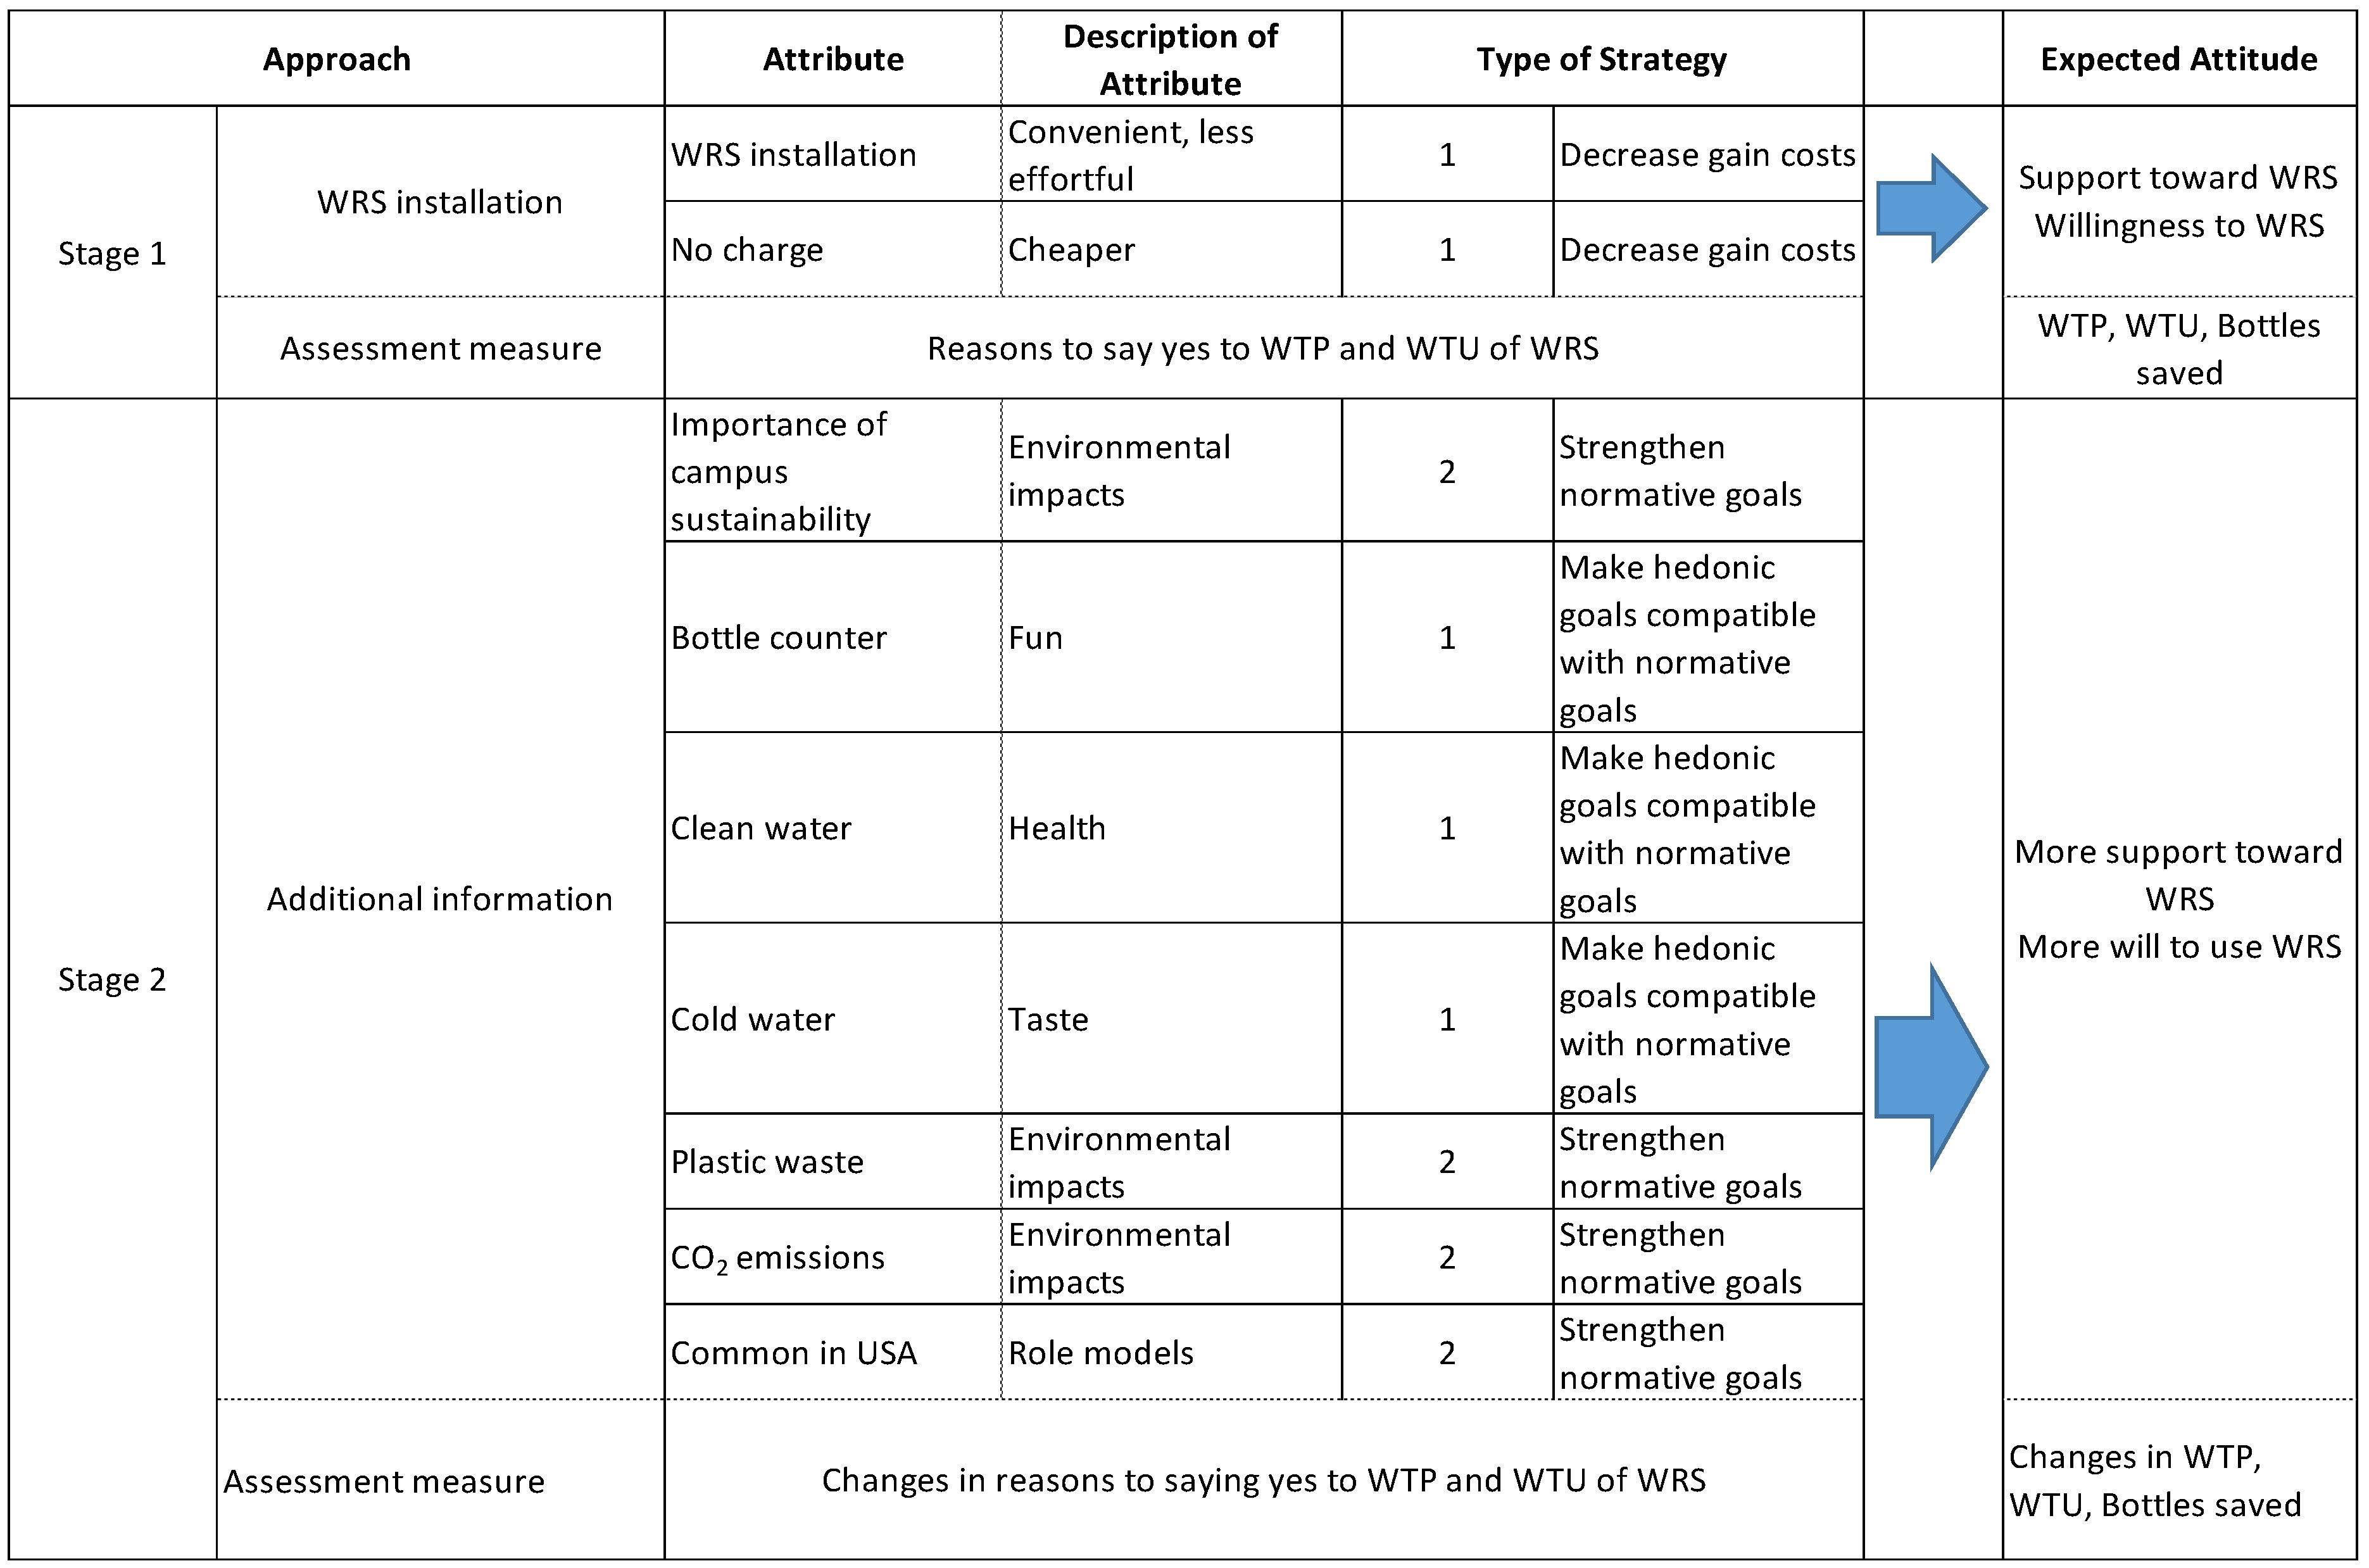
Figure 1 describes the main components of the survey including their hypothetical relationships and expected attitudes, along with the two corresponding strategies proposed in the IFEP. The Type of Strategies ‘1’ label indicates the removal or reduction of the conflict between hedonic or gain goals and normative goals. The Type of Strategies ‘2’ label indicates strengthening normative goals.
The survey was comprised of two stages. For Stage 1, we proposed the installation of WRS on campus without giving a lot of detailed information about WRS or its background, and then asked for their support and WTU. The installation is a so-called contextual factor (or situational cue) intended to make pro-environmental behaviors more accessible by reducing the cost of engaging in pro-environmental behaviors [29,37]. The students’ support was measured by their WTP for the installation of WRS, and its environmental consequences were estimated by their WTU and changes to their plastic bottle usage. The students would donate an amount just once. While our study adopted a one-time donation method, there are other types of payment vehicles available such as paying higher prices, taxes, or a surcharge on utility bills [38]. Each payment vehicle has its own strengths and weaknesses. For example, while donation methods could yield an underestimate of value, taxes could lead to protest responses [39]. In other words, the specification of a payment vehicle could cause unintended effects or vehicle bias [38,
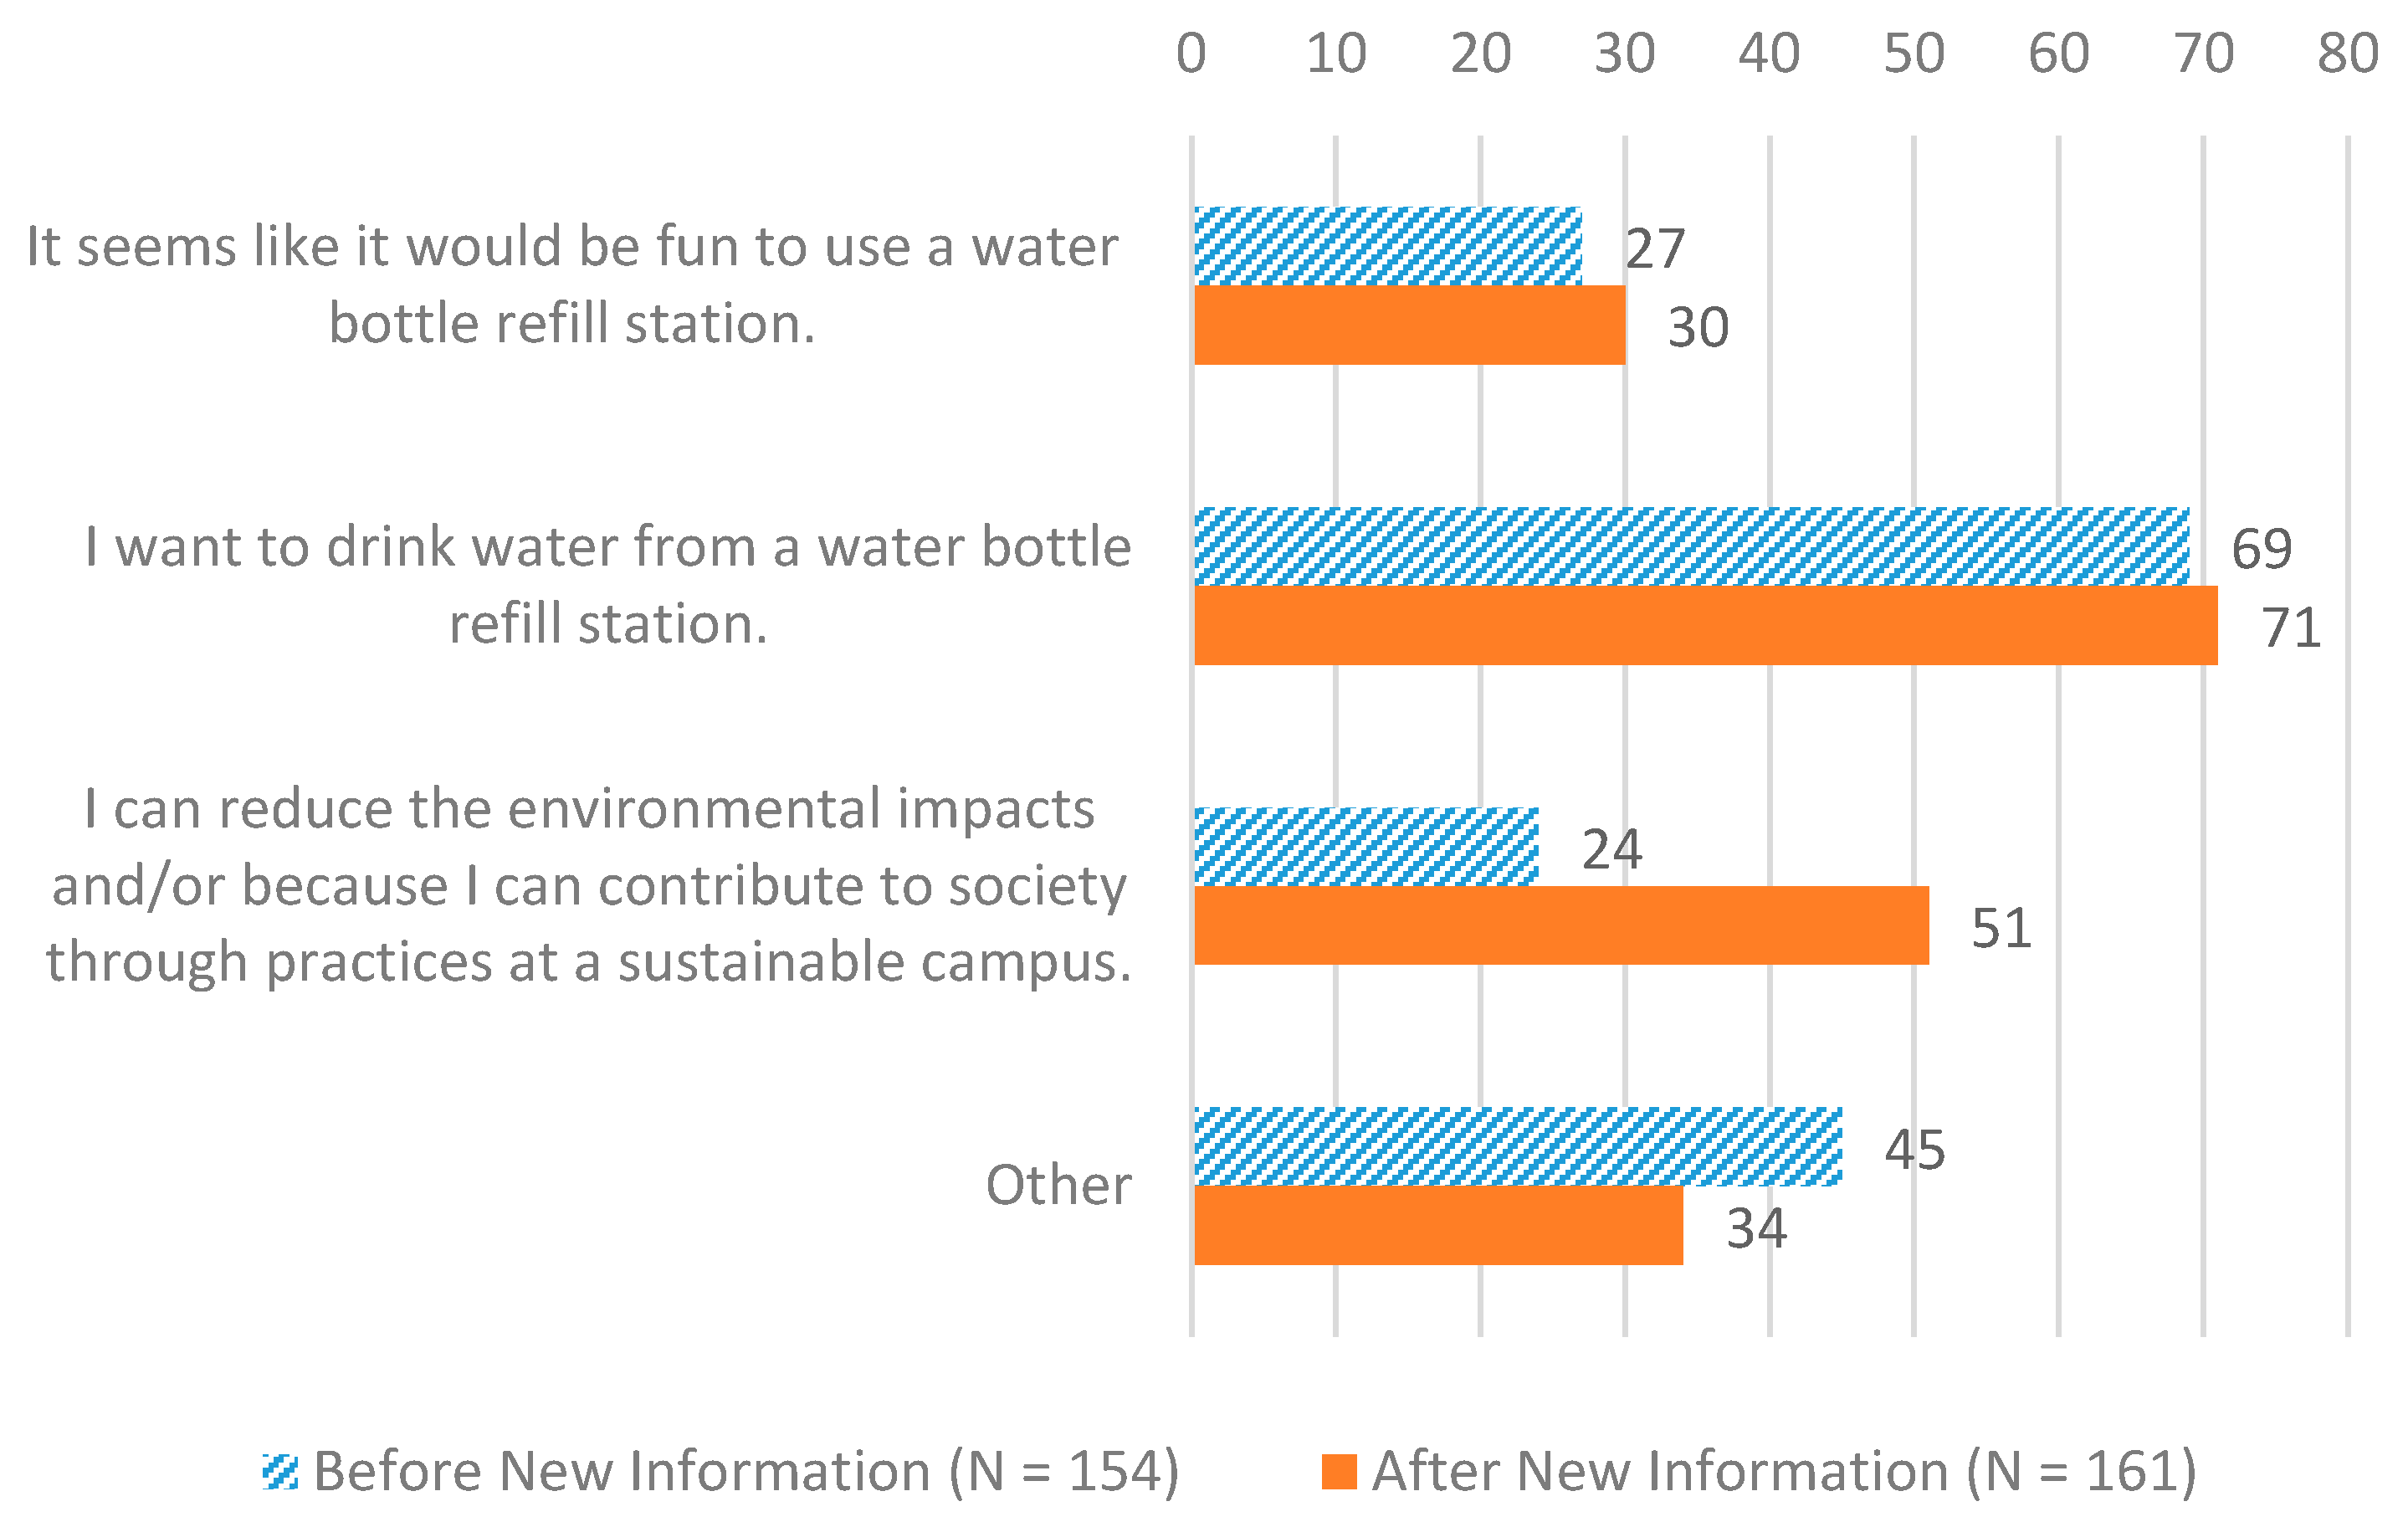
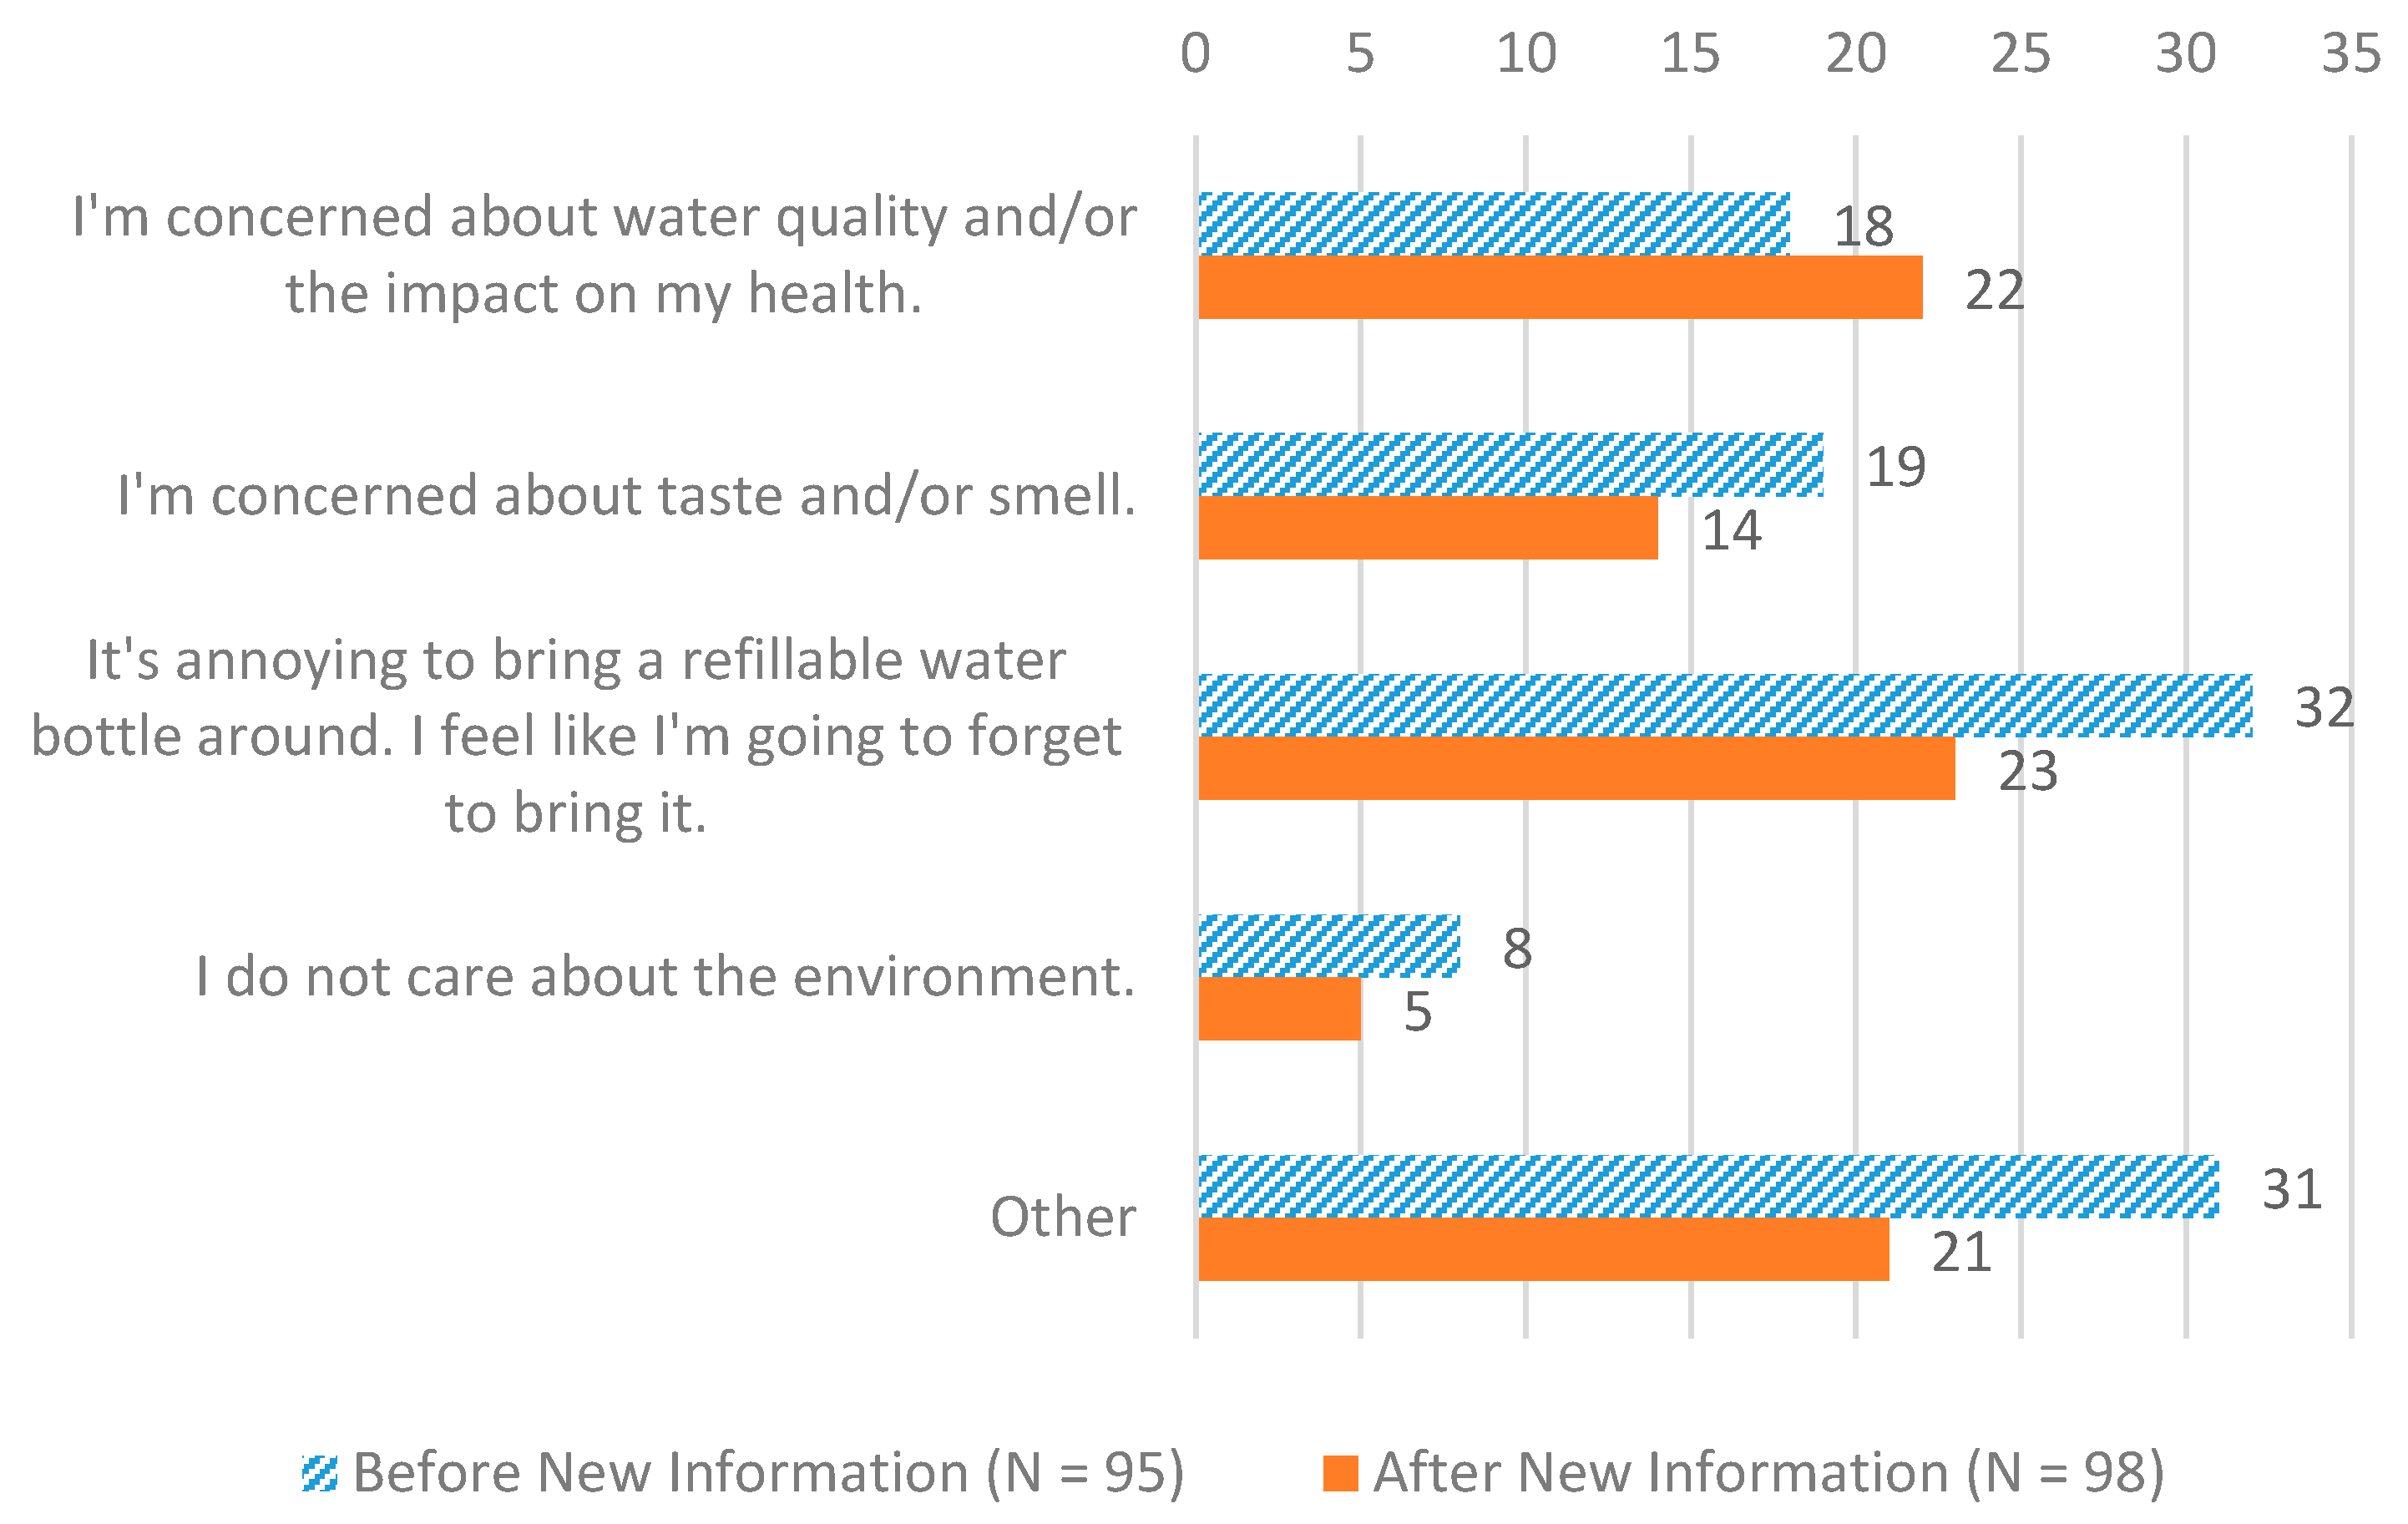
39]. We confirmed the validity of a donation method as a payment vehicle in our pre-test prior to our main survey. We further questioned the students’ reasons for their approval or disapproval of the WRS installation plan and their WTU WRS in order to test hypothetical relationships.
For WTP estimates, we adopted a double-bound dichotomous choice method, a type of Contingent Valuation Method (CVM), to elicit students’ WTP for the WRS’s installation because it is less susceptible to biases compared to other methods [40]. We proposed seven different bid amounts (250, 500, 1000, 2000, 4000, 8000, and 16,000 JPY) (see Supplementary Materials SI1 for the scenario for CVM). Five different combinations for bid values (in JPY) were used (Initial; Lower; Upper): (500; 250; 1000), (1000; 500; 2000), (2000; 1000; 4000), (4000; 2000; 8000) and (8000; 4000; 16,000). Selecting the bid amounts was critical [41,42] and a challenge for our study because, to our knowledge, there are not any similar studies in the literature we can refer to. A double-bound question (or one follow-up) is said to increase estimation efficiency when a priori knowledge is not available, as in our study, to guide bid design [42]. As a reference, we chose the combination of bids used by Sakurai and Uehara [43] from their survey with similar sample (i.e., students in the same department at the same university). However, since the topic is not germane to our study (to reduce smoking on campus), we carefully verified the validity of the combination from the smoking survey in 2017 in our pre-test prior to our main survey. Using a pre-test or a focus group is a common method used to choose bid amounts [44,45]. The combination was verified from the pre-test; it was neither too low nor too high [39]. A smaller number of bids (five to eight) is also considered to be an effective method to increase estimation efficiency [39,41].
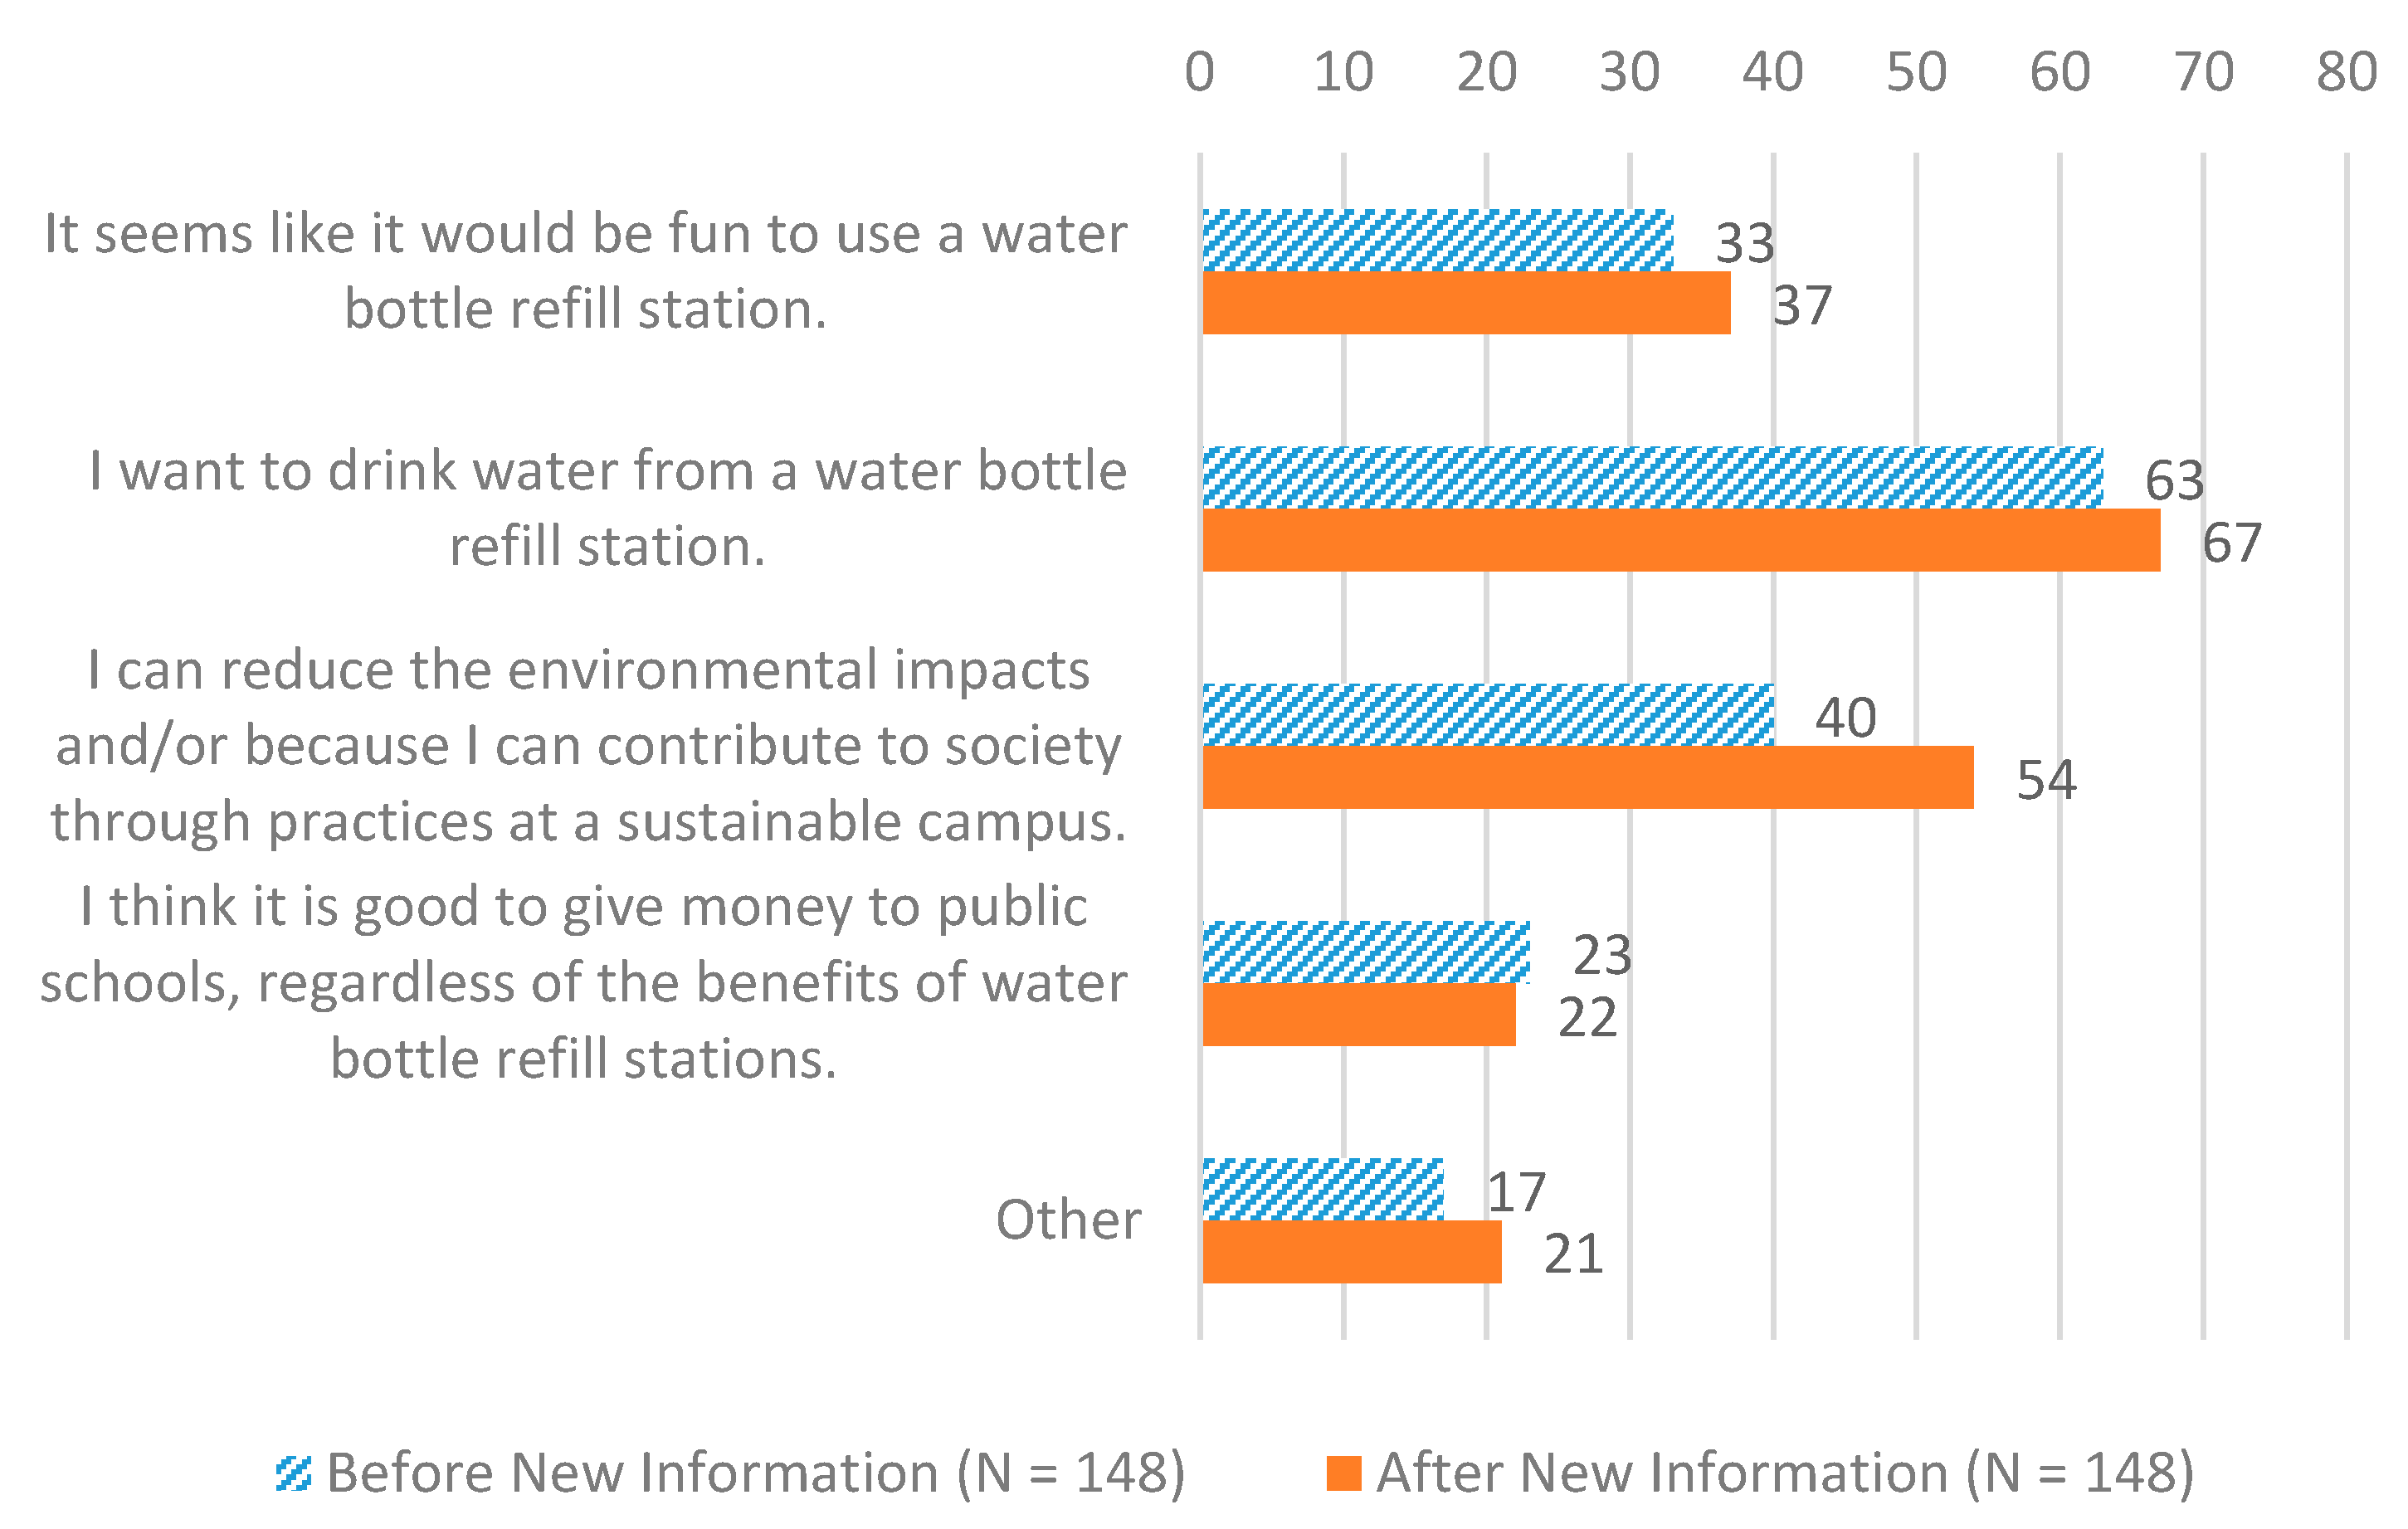
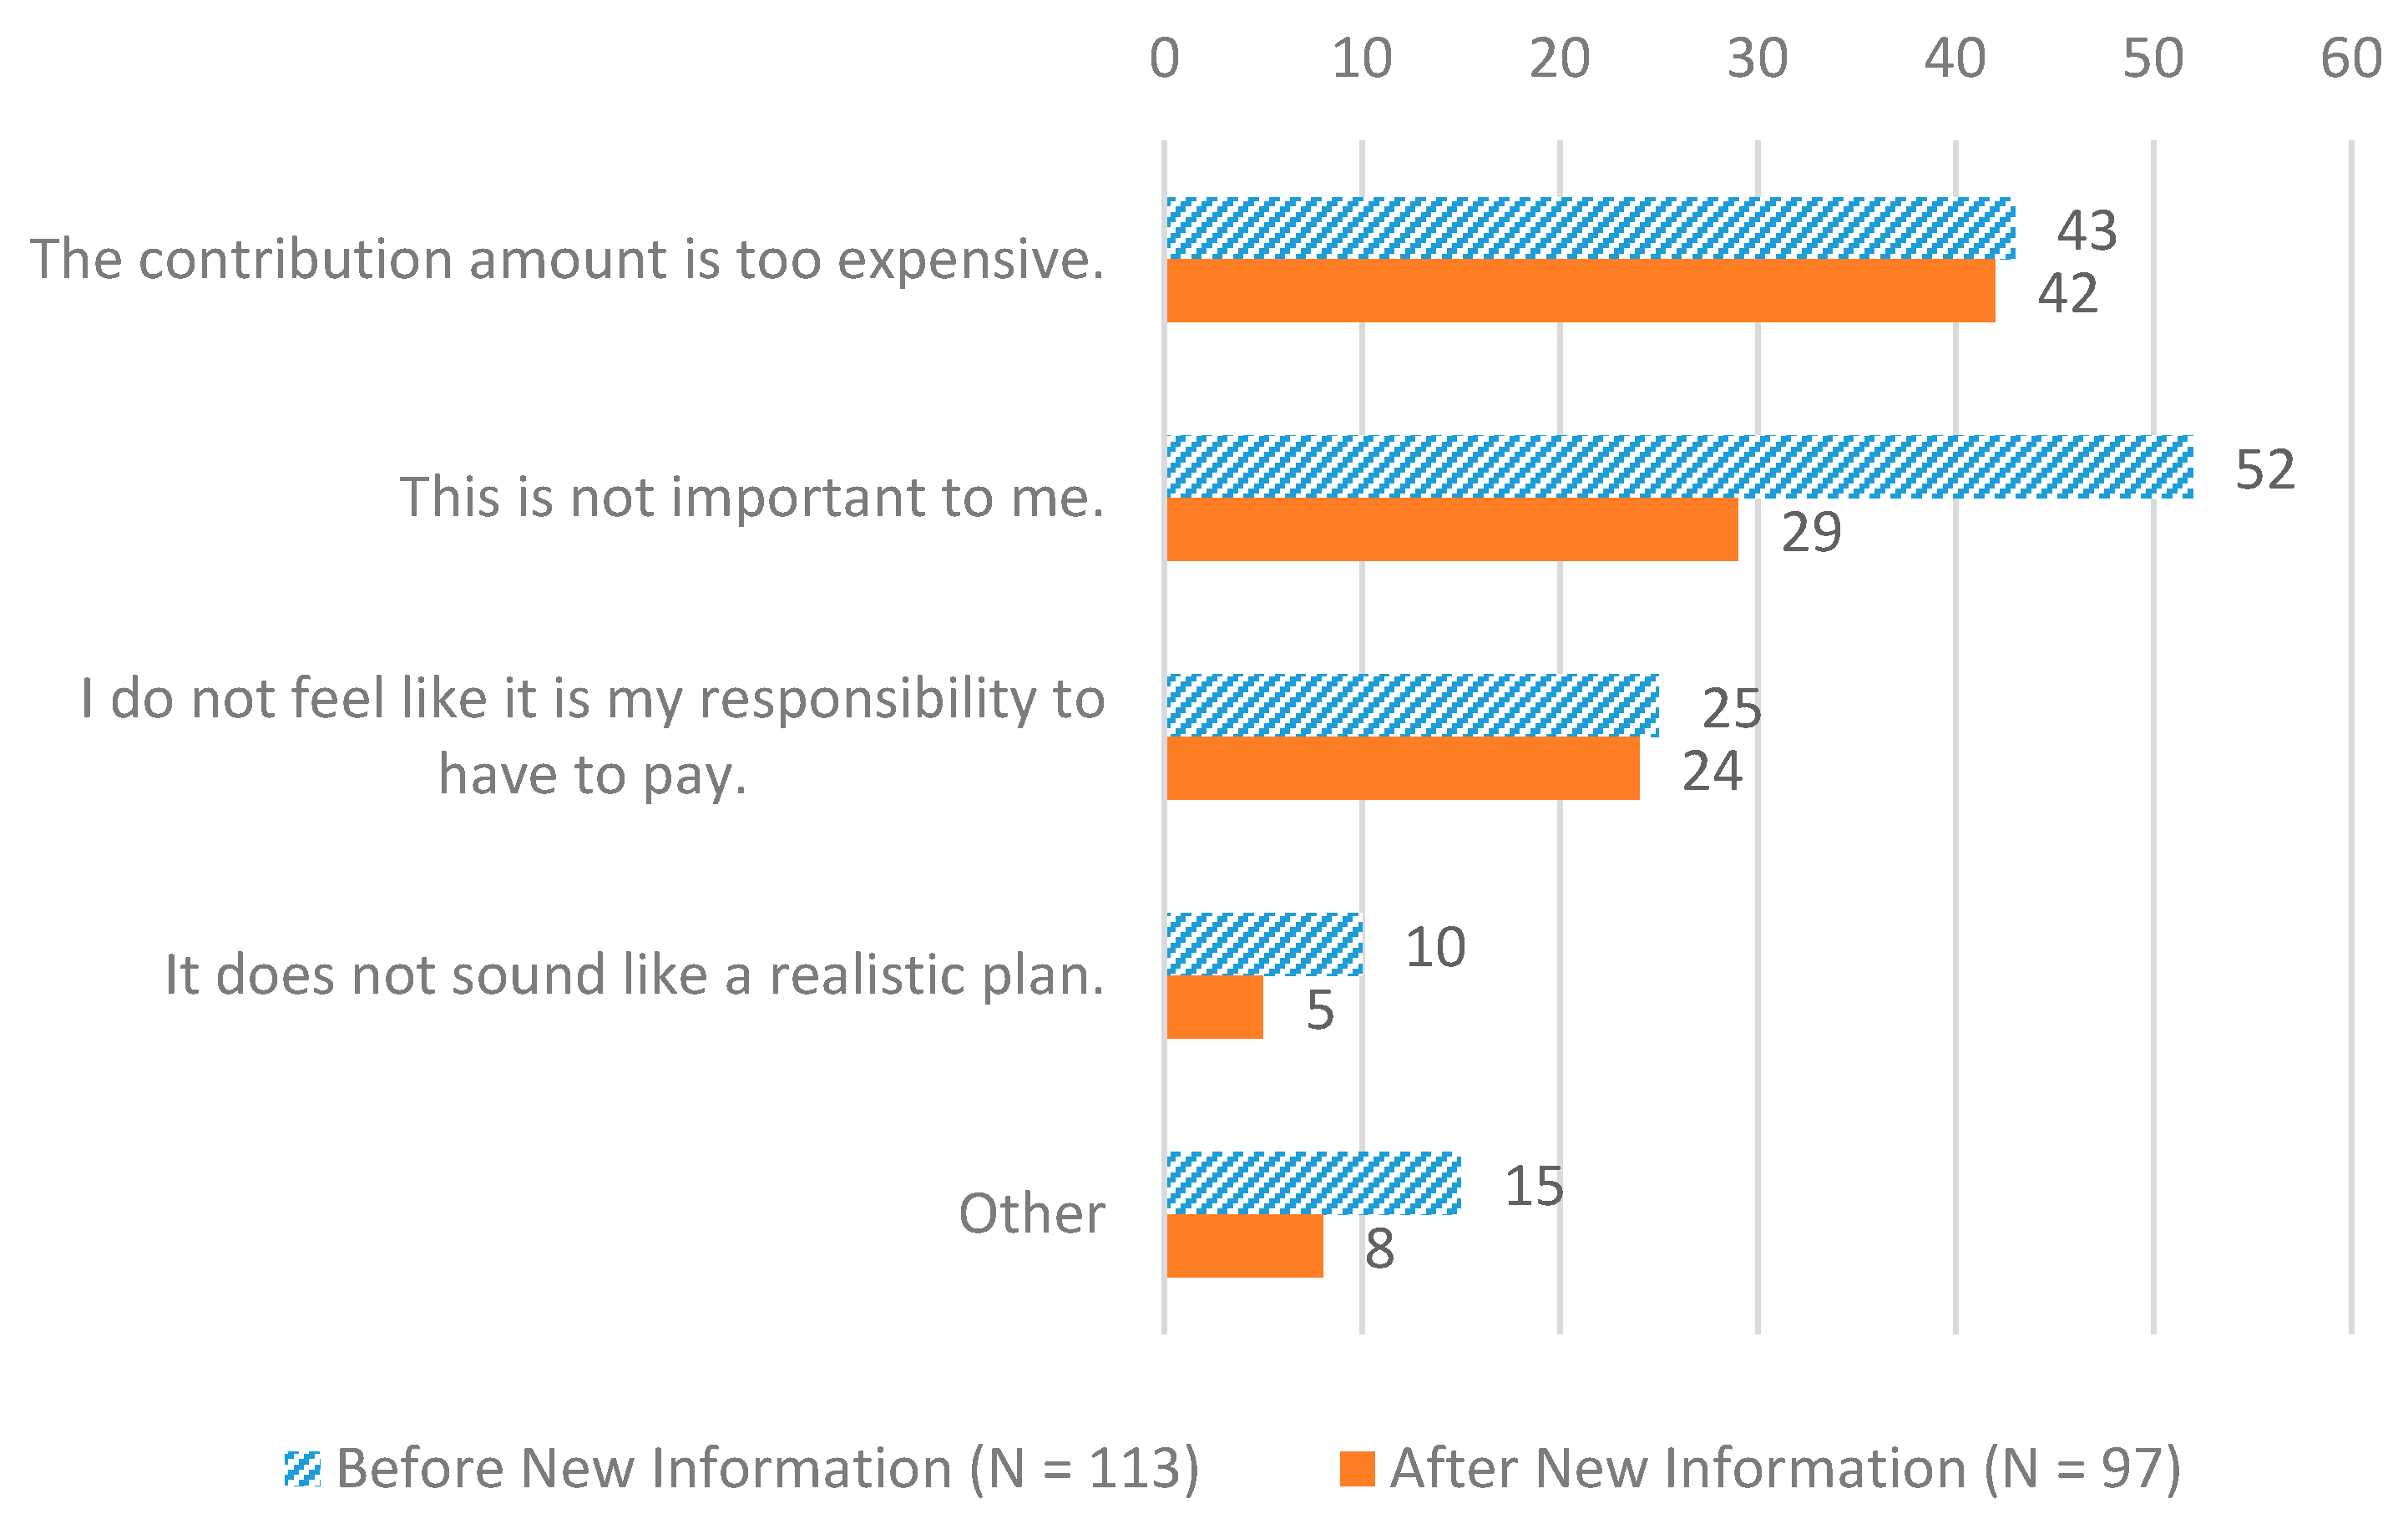
At Stage 2, we provided further information about the WRS including the background of the device’s installation to examine how additional information might change students’ support and WTU. For Stage 2, Figure 1 describes the different kinds of additional information we provided and its hypothetical impact on students’ attitudes toward a WRS. We explained how focusing on environmental issues and campus sustainability is not only important for the university but it is also a social responsibility [46]. We also reminded students that their university, Ritsumeikan University, had created a guideline to support pro-environmental behavior and which asks students and faculty members to contribute to the realization of a sustainable society [27]. We explained the severity of increasing plastic waste including related CO2 emissions [8,47] and its potential impact on humans, animals, plants, and ecosystems [14]. We also explained additional characteristics of a WRS such as how it could be fun to see the counter counting the number of bottles saved and its water quality in comparison with bottled water. Lastly, we mentioned how WRS are common on U.S. campuses. To assess the impacts of the information as it was disseminated, we measured changes in WTP, WTU, and plastic bottle usage. We further investigated the student’s reasons to approve and disapprove the bid amount to install the WRS and their WTU WRS to test hypothetical relationships.
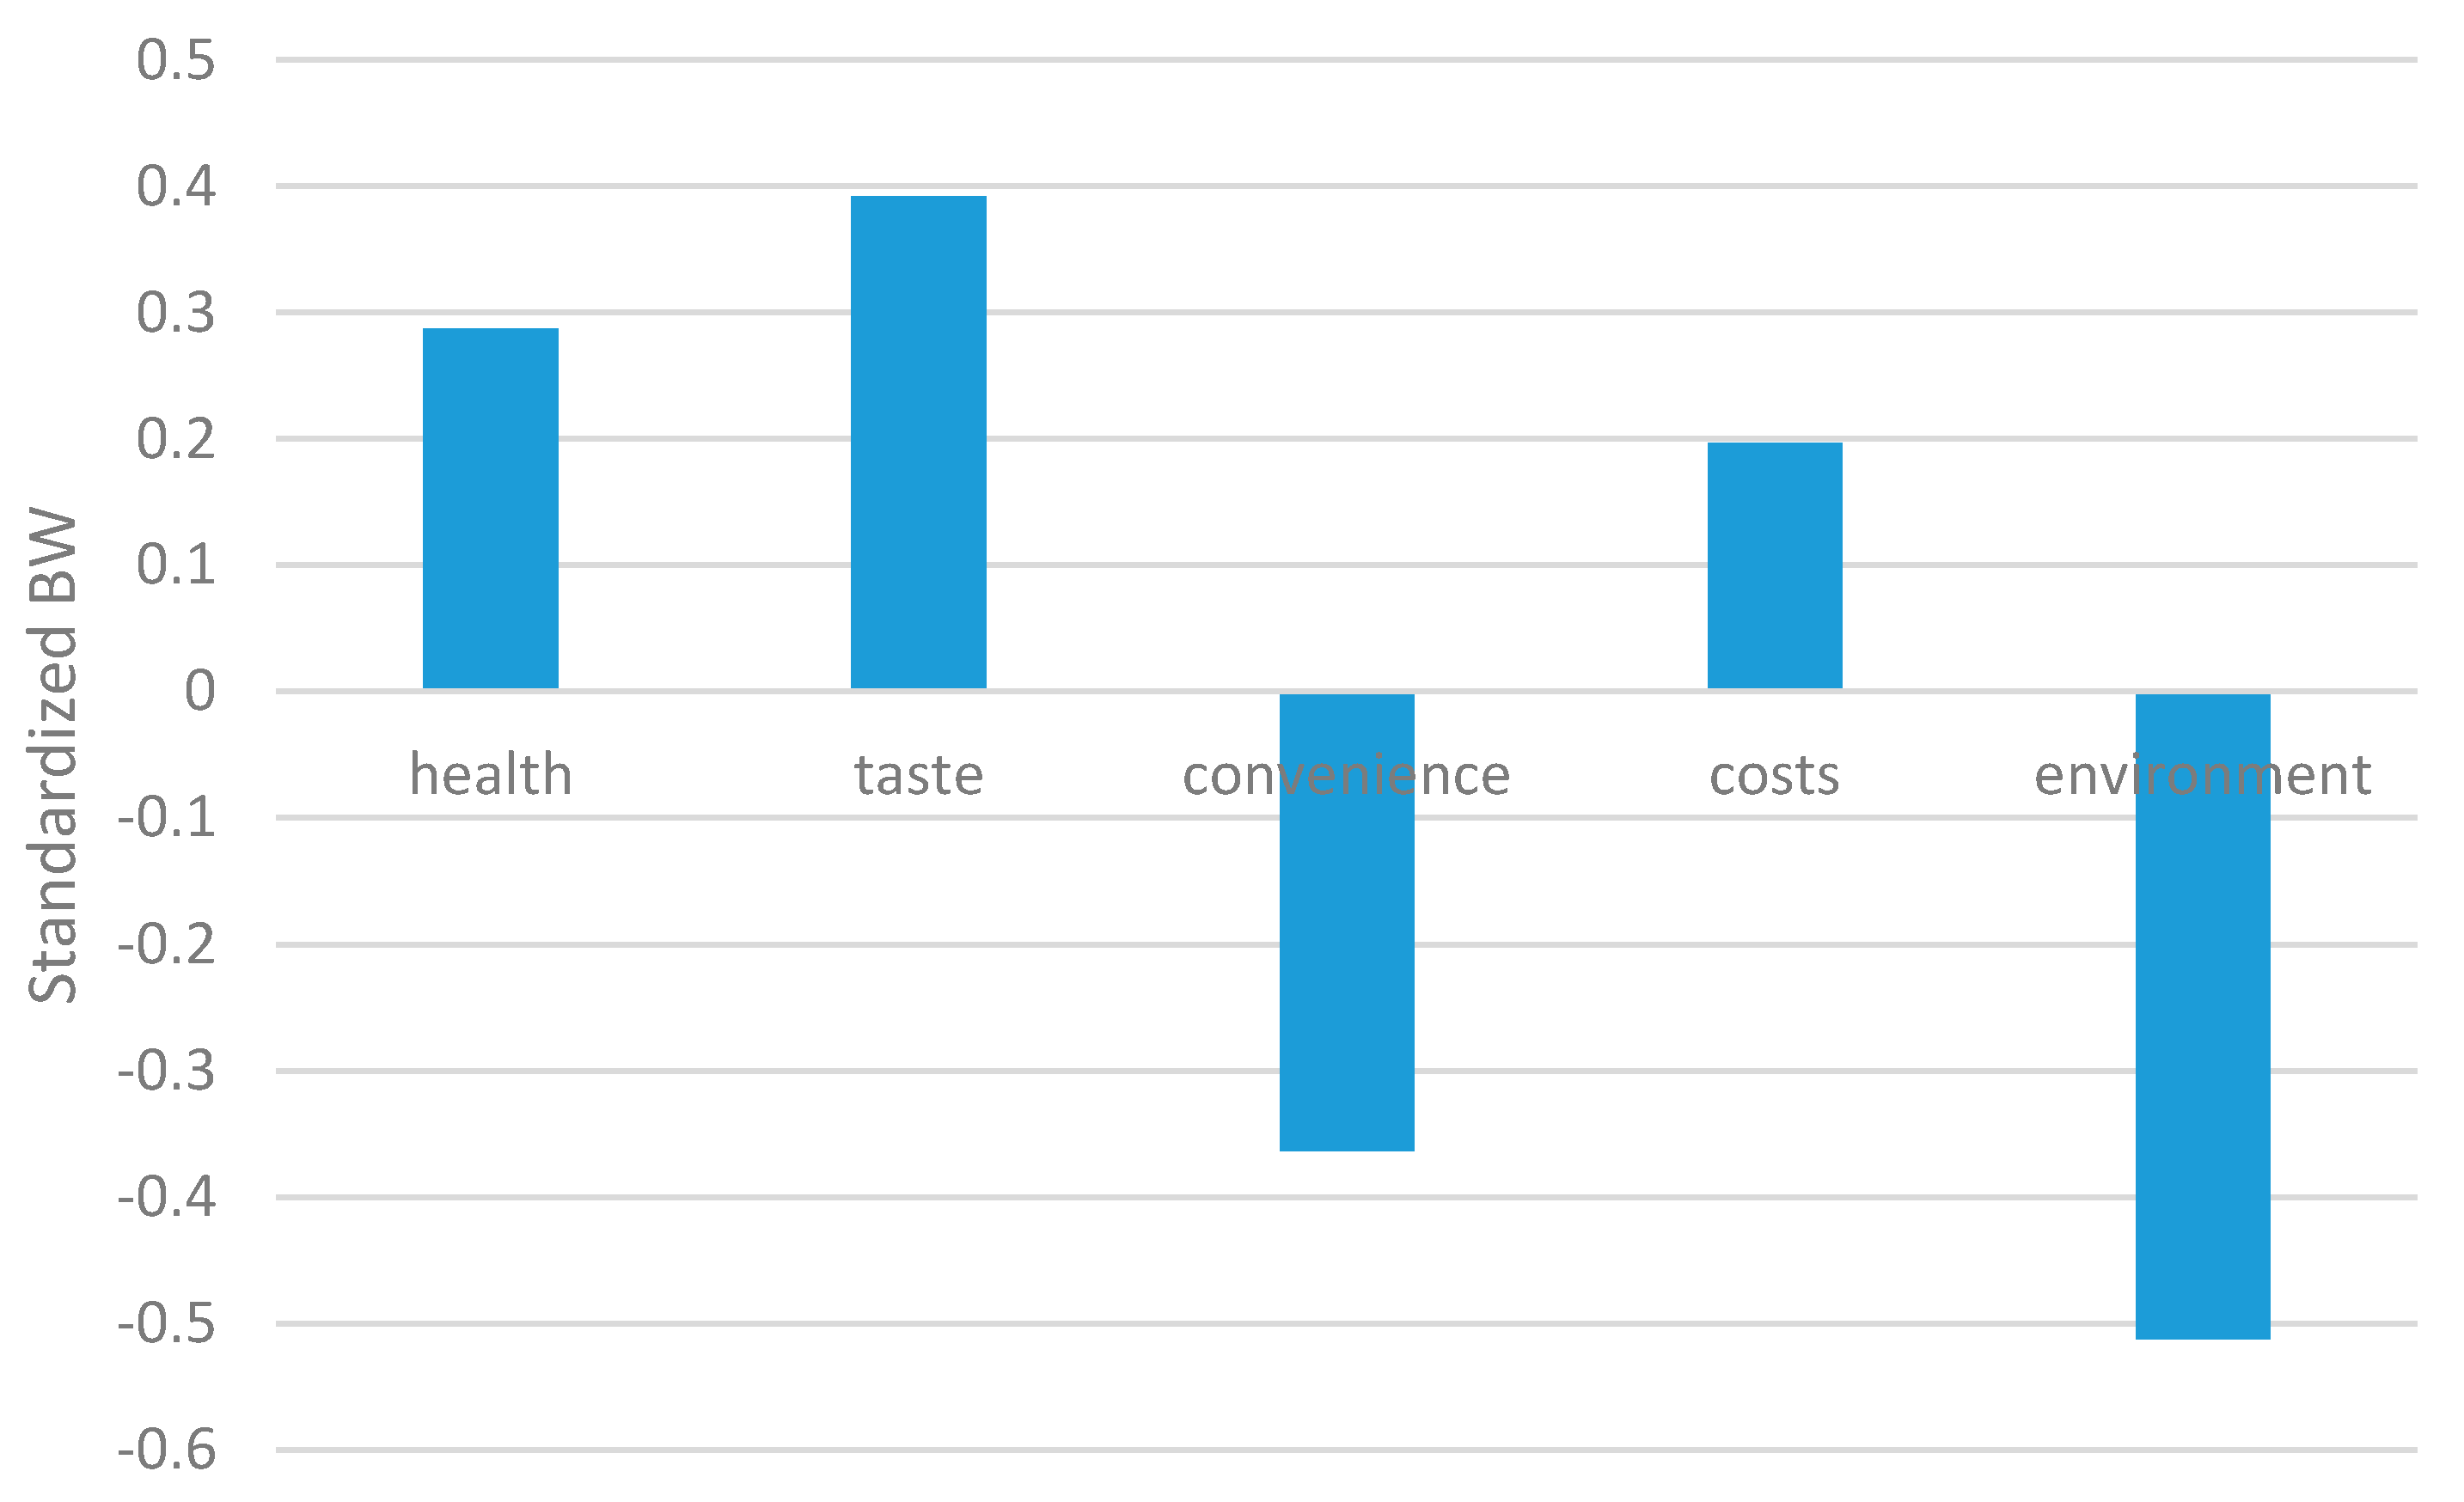
In addition to questions directly related to WTP, WTU, and plastic bottle use calculations, we also asked students about their basic characteristics and daily habits (e.g., gender, frequency to campus, etc.), preference of drinking water [25], attitudes toward sustainability at school/community and their own personal responsibility [5], as well as educational background [3] in order to examine their potential relevance to WTP, WTU, and plastic bottle use. We adopted a best-worst scaling (BWS) [48] method in order to measure the students’ priorities for their choice in drinking water (i.e., health, taste, convenience, costs, and environmental costs). BWS is easier to answer because it asks respondents to choose what they feel are least and most important, rather than having to individually rank a large number of possible options. By reiterating these possible options in a number of different sets, the ranking of all the possible choices were revealed. We used the counting approach [49] and adopted the following Standardized   BW i to measure how to present the relative importance of choice i .
Standardized   BW i   = n B i n n W i n N r ,
B i n and W i n indicates the number of times choice i is selected as the best and the worst out of all the questions by respondent n respectively. r is the number of times item i appears in all the questions. N indicates the number of respondents. Standardized   BW i is zero when respondents select choice i as the best as frequent as they select it as the worst or, if they select it neither as the best nor the worst.

2.4. Survey Implementation and Data Analysis

On 24 May 2018, we tested the survey on six students from a different class than the one analyzed in this study in order to make sure it was designed as expected [39]. Given the students’ feedback and our own findings, the survey was amended accordingly and the implementation the survey was reconsidered (e.g., speed of proceeding the questionnaire). The finalized survey, endorsed by the Human Research Ethics Review Committee at Ritsumeikan University (Kinugasa-Jin-2018–6), was conducted in class on 30 May 2018. To avoid potential student-teacher bias, we explained to students that their answers would not influence their grade for the course and they had the option to not participate.
We used R (Version 3.3.2 for Windows (64 bit)) by the R foundation [50] to compute WTP and BWS estimates, and a statistical analysis software STATA (Version 14.2) by StataCorp LP [51] for the rest of data analyses.

3. Results

This section explains our case study results including summary statistics, WTP for WRS, and the number of disposable plastic bottles with related CO2 emissions saved if a WRS is installed.

3.1. Summary Statistics

Not all first-year students registered for the class completed the survey (268 out of 362, 74.03%) mainly because some of them did not attend class on the day the survey was conducted. Among the respondents, 59.55% were male, similar to the composition of all first-year students (62.15%); 51.54% of students were taking or had taken courses related to environmental issues; on average, the students surveyed came to campus 4.49 days out of 5 days per week (see Supplementary Materials SI3 for further detail of summary statistics).
Table 1 shows the students’ attitudes toward sustainability in their school/community and how they feel about their own personal responsibilities. We adopted questions used by the authors of Reference [5] who had previously surveyed college students in Alabama and Hawaii. All of the questions used the same Likert scale (1. Strongly agree, 2. Agree, 3. Neutral, 4. Disagree, 5. Strongly disagree). In order to make our survey comparable to Reference [5], we calculated the sum of choices ‘strongly agree’ and ‘agree’ into one column, and the sum of choices ‘strongly disagree’ and ‘disagree’ into another. As Table 1 shows, both types of responsibility, school/community and personal, were strongly favored. In contrast to the findings in Alabama and Hawaii, our survey found that students felt more responsibility toward school/community than their own personal responsibility. In addition, the students in our survey tended to support school/community responsibility more than the findings in Reference [5] (69% (Hawaii) and 57% (Alabama) for the first question and 68% (Hawaii) and 56% (Alabama) for the second). Chronbach’s α statistic, which measures the internal consistency or homogeneity of statements [52], was 0.7502. Since the value was higher than proposed threshold values (0.7 to 0.8) [53], we used the simple sum of these four values as a composite index for attitudes toward campus sustainability in WTP estimates.
Figure 2 shows the students’ preferences when choosing drinking water utilizing a standardized best-worst score (Equation (1)). While taste, health, and costs were considered priorities, convenience and environment were less of a priority when choosing drinking water.

3.2. WTP for WRS

Table 2 shows how frequently participants responded to each of the five bid combinations. Table 3 is a logit model used to calculate WTP estimates. The responses before and after information about WRS provided were pooled. The logit model revealed a statistically significant increase in WTP (a 10% level) if more information was provided versus when it was not (Information dummy). While the mean WTP truncated at maximum bid without information provided was 1997 JPY per student, it was 2211 JPY per student after information was provided. Their 95% confidence intervals (Lower; Upper) were (1652; 2424) and (1932; 2589) respectively. Likewise, while the median WTP without information provided was 921 JPY per student, it was 1042 JPY after information was provided. Their 95% confidence intervals (Lower; Upper) were (749; 1128) and (901; 1216) respectively.
To explore attributes that affect students’ WTP, we also estimated a full model including attributes potentially relevant to their WTP as shown in Table 4. Table 5 describes the variables used in the full model. The number of students with prior knowledge of WRS was statistically significant, at a 10% level. Students who tended to answer affirmatively to “Attitudes toward campus sustainability” also raised their probability of saying yes to the bids. “Attitudes toward campus sustainability” is a composite index comprising of four questions regarding attitudes toward sustainability in their school/community and their own personal responsibility (Table 1). Students who tended to come to campus more frequently, also tended to support WRS more often. Lastly, female students tended to support WRS more than male students.
The primary reasons for students saying yes to the bid were answers “I want to drink water from a water bottle refill station.”, “I can reduce the environmental impacts and/or because I can contribute to society through practices at a sustainable campus.”, and “It seems like it would be fun to use a water bottle refill station.” (Figure 3). Respondents who chose answer “I think it is good to give money to public schools, regardless of the benefits of water bottle refill stations.” are not valid yes respondents [38], therefore they were excluded from WTP estimates. After comparing the first three reasons before and after information was provided, we found that their frequency had increased. Among which, answer “I can reduce the environmental impacts and/or because I can contribute to society through practices at a sustainable campus.” increased the most.
The primary reasons for students saying no to the bid were answers “This is not important to me.”, “The contribution amount is too expensive.”, and “I do not feel like it is my responsibility to have to pay.” (Figure 4). Following Reference [38], answers “This is not important to me.”, “I do not feel like it is my responsibility to have to pay.”, and “It does not sound like a realistic plan.” were considered to be protest responses therefore respondents who chose one of these answers were excluded from the WTP estimate. Protest responses occur when a respondent rejects paying for the bid offered for certain aspects of a scenario in CVM different from the amount of bid, though they may value the good benefited from the scenario. After comparing the answers from before and after information provided, there was a significant drop regarding the answer “This is not important to me.”

3.3. WTU and Disposable Plastic Bottles with Related CO2 Emissoins Saved

Table 6 compares the number of students who chose “Water from the water bottle refill station” from before and after information provided. After information was provided, the number of students who were willing to use WRS increased from 130 (54.62%) to 140 (58.82%). The difference was statistically significant (Paired t-test p = 0.029). However, WTU was lower than a previous survey conducted in the U.S. which had reported that 91% of students currently using disposable bottles would be willing to switch to a reusable water bottle if there were WRS in prominent locations on campus [54].
Figure 5 shows the reasons for WTU. Answer “I want to drink water from a water bottle refill station” was the main reason. After comparing before and after information was provided, there was a stark contrast regarding an environmental and sustainability concern (“I can reduce the environmental impacts and/or because I can contribute to society through practices at a sustainable campus.”), more than doubling (from 24 to 51) after information was provided.
Figure 6 shows the reasons students chose not to use WRS. The main reason was because “It’s annoying to bring a refillable water bottle around. I feel like I’m going to forget to bring it.” However, after information was provided, this reason as well as the concern regarding taste and/or smell (“I’m concerned about taste and/or smell.”) decreased. Students who chose they do not care about the environment (“I do not care about the environment.”) also decreased. In contrast to our initial expectation, there was an increase in concern regarding water quality and/or health (“I’m concerned about water quality and/or the impact on my health.”).
We have to note that students’ WTU does not necessarily reduce the number of plastic bottles used because some students might use both plastic bottles and get water from a WRS. As Table 7 shows, with WRS installed, all other types of beverage containers reduced. However, the total usage of beverage containers increased from 356 to 375. Plastic bottle use decreased by around half (from 135 without WRS to 74 respondents with WRS installed and information provided), though if we compare the responses before and after information provided, the reduction of plastic bottle usage did not change significantly.

4. Discussion

Priorities for choosing drinking water differs from findings in the U.S. [23,25] and Southeastern Asian cities (Singapore, Hong Kong, and Macau) [32], highlighting the importance of contextual differences. Figure 2 shows that taste, health, and costs (related to gain goals) were focal, whereas convenience (related to gain goals) and environment (related to normative goals) were less of a concern. The reason for convenience being a higher priority than environmental reasons requires interpretation. The reason is probably because students in Japan have more access to drinking water and therefore convenience is not considered a priority. In Southeastern Asian cities, convenience and availability were rated highest on average, which is probably because it is more difficult for students to access drinking water than for those in Japan. When it comes to switching from disposable water bottles to refillable bottles, convenience would probably play a more important role. Without WRSs, students in Japan would have to fill their refillable water bottles at home and bring them to campus. Although there are water dispensers in the cafeterias on campus for students to refill the cafeteria cups, they are not allowed to fill up their own personal bottles. Hence, the installation of a WRS (i.e., contextual factor [37]) is appealing as a gain goal and the distribution of information about WRS (i.e., information campaign [29]) is strengthening a normative goal as well as appealing to a hedonic goal, all of which seem to be effective strategies to encourage students to give up disposable plastic bottles. These strategies also employ to the two strategies (i.e., reducing or removing a conflict and strengthening normative goals) proposed by the IFEP [29]. As discussed above, the information given to students regarding WRS installation and its background showed that installing the device would be a feasible and effective way to encourage students’ pro-environmental behavior. This in turn, shows the validity of the IFEP in our context.

4.1. RQ1. Students’ Support for WRS

The mean WTP (truncated at maximum bid) was 2211 JPY, indicating that WRS gained students’ support after information was disseminated. The two mean WTP amounts (i.e., before and after information) were notably higher than the corresponding median WTP amounts, indicating the distribution of the WTP was skewed [55]. While the median WTP addresses what the majority of respondents are actually willing to pay, the mean WTP gives greater weight to a minority of respondents who have strong and positive preferences [55]. As shown in Table 2, a notable difference occurs when there is a large number of respondents bidding a small or zero value and a small number of respondents bidding large values. As the choice involves value judgment and is an ongoing debate [55,56], our study reported both measures. To our knowledge, there has been no similar estimate in order for us to make a comparison. The installation of a WRS on campus employs the first strategy of the IFEP; as the installation makes it convenient, less effortful, and free of charge to access water from a WRS rather than using disposable plastic bottles. It would result in reducing conflict between gain and hedonic values on one hand and strengthening normative values on the other. The students’ reasons for saying yes to the bid (Figure 3) indicate that the motivations behind supporting WRS included all three gain goals. Students valued not only the water to drink (gain goal), but also how fun it would be to use a WRS (hedonic goal) as well as acknowledging the WRS’s potential contribution to the environment and campus sustainability (normative goal). The full model (Table 3) revealed the types of respondents who would support installing a WRS. Similar to the findings from reasons for yes (Figure 3), environmental concern (“Attitudes toward campus sustainability”) is statistically significant (i.e., more concern leads to more support). “Frequency to campus” (i.e., more opportunity to use WRS) is also statistically significant. Prior knowledge of WRS and gender (i.e., female students tend to support WRS more) are statistically significant. Although a previous study [25] also found that gender played a role in drinking water preferences, we do not have a good interpretation for the difference. The reasons for saying no to the bid (Figure 4) indicate that campuses should reconsider how they would pay for a WRS. For example, at Portland State University, the installation costs were paid by students’ building fees [16]. Since some students felt WRS were not important to them, educating them more about the importance of campus sustainability could also be an effective way to gain support (Figure 4).
Students’ support for WRS can be measured by an aggregate welfare estimate (aggWTP) using a mean WTP from the sample multiplied by the affected population N [39]. That is,
agg W T P = W T P ¯   N ,
where W T P ¯ is the mean WTP truncated at maximum bid (2211 JPY). There are a total of 410 first-year students in the College of Policy Science (362 students taking courses in Japanese and the rest in English), and we adjusted N by multiplying it by 0.78 in order to exclude a proportion of students who chose protest responses or contributing to the school, irrespective of the benefits of WRS as a reason for saying yes to the bid. We assumed students taking courses in English hold the same preferences for WRS. Hence, we estimated every year, first-year students would be willing to pay 706,984 JPY ( = 410   students × 0.78 × 2211   JPY ). The cost of WRS varies, for example, purchase and installation costs of the three bottle refills stations could be 4000 USD to 7000 USD (≈700,000 JPY) [16,22]. In addition, WRS require subsequent maintenance costs ranging, for example, from 600–650 USD (≈60,000–65,000 JPY) per year at Pennsylvania State University [57]. Though, the cost of installing three WRS could be paid off in a few years.
We should note however, that the WTP estimates could be exaggerated because people tend to overstate how much they would actually pay in hypothetical situations as seen in CVM [58,59]. Calibration factors (mean hypothetical value/mean actual value) tend to exceed 1 [59]. Therefore, the actual payment for a WRS could be lower than the WTP estimates.

4.2. RQ2. Students’ WTU and Its Environmental Impacts

WTP measures the benefits of using a WRS such as being able to drink water but also how much fun it could be to use WRS and, its contributions to the environment and campus sustainability. On the other hand, WTU directly measures how many students would want to use a WRS. It is interesting to note that out of 100 students who stated they were not willing to use the WRS, 44 of those students were still willing to pay for the WRS. This indicates that the WTP could include more than hedonic and gain values, but also, normative values.
After further information about WRS was provided, 58.82% of students said that they were willing to use the WRS. To calculate the number of plastic bottles saved with the installation of WRS, we compare Q6 with Q37, which asked students what kind of beverage containers they usually drink from (Supplementary Materials SI1). We assumed that a student would purchase one bottle per visit to campus if the student chooses “1. PET bottles or plastic bottles” in Q6 and/or Q37. There was a study done which calculated U.S. college students’ average weekly use of disposable water bottles and found that approximately 40 percent of students purchase more than one bottle [54] a day. However, this data is not directly comparable to our study because it includes the use of plastic water bottles off campus. When installed, the use of plastic bottles would reduce from 135 to 74 (N = 237), or 61 bottles. Therefore, 0.26 plastic bottles (= 61 / 237 ) could be saved for each student when they come to campus. Using this data, it is estimated all first-year students could save 474 plastic bottles and reduce 108.96 kg of CO2 emissions per week (Table 8).
Assuming the students come to campus 30 weeks per year, they could save 14,213 plastic bottles and save 3411 kg of CO2. Furthermore, if we assume the second and third year students come to campus at the same frequency as the first-year and if the fourth-year students come once a week, students enrolled in College of Policy Science could save 45,191 plastic bottles and 10,846 kg of CO2 emissions every year. We should also note that since students buy plastic bottles not only on campus but also off campus, the environmental impacts are not only for campus sustainability but also for community sustainability [2] (i.e., bearing social responsibility [1]). One report in the U.S. (multiple-choice survey) showed that 48.84% of students and staff on campus purchase plastic bottles off campus [60].
The motivations behind students’ WTU were in line with their reasons to support WRS and included all three gain goals. Answer “I want to drink water from a water bottle refill station” (gain goals) was the main reason (Figure 5). The main reason for not wanting to use a WRS was answer “It’s annoying to bring a refillable water bottle around. I feel like I’m going to forget to bring it.” To have students bring around a water bottle is a precondition, therefore this barrier could be difficult to overcome. However, we could still alleviate the difficulty by, for example, hanging eye-catching signs on doors such as “Don’t forget your refillable water bottle” [26]. A report at University of the Sunshine Coast [60] showed that 60.46% of students and staff admitted that they chose to buy bottled water rather than using a WRS on campus because they forget to carry a refillable bottle with them. However, the other top two reasons for not wanting to support a WRS (i.e., concern about water quality, health impacts, taste, smells) can be overcome through education (or information campaigning) and further improvement of water quality. Saylor et al. [26] have proposed more comprehensive strategies to reduce the barriers of using tap water and to discourage buying bottled water.

4.3. RQ3. The Impacts of Information on Students’ WTP, WTU, and the Environment

It has been well researched that information can influence people’s preferences about environmental causes. For example, information can influence WTP for wetland protection [61], endangered species conservation [62], and willingness to accept genetically modified food [63]. Güngör-Demirci et al. [25] has revealed the type of information provided plays an important role in influencing how people choose between bottled and tap water. Although its mechanism and effectiveness are still controversial, information about the environment and environmental education seems to be key to influencing pro-environmental attitudes and behavior [4].
We hypothesized that information would influence WTP and WTU because the type of information we provided could appeal to three gain goals (i.e., environmental contributions of WRS, it would be fun to use because of the counter, and taste and health impacts). Our study revealed that both WTP and WTU increased at statistically significant levels after further information about WRS was provided. The students’ reasons for WTP and WTU provided some clues as to how information affected their preferences. Their reasons for saying yes to the bid revealed the information seemed to appeal to all three goals (“It seems like it would be fun to use a water bottle refill station.” (hedonic), “I want to drink water from a water bottle refill station.” (gain), and “I can reduce the environmental impacts and/or because I can contribute to society through practices at a sustainable campus.” (normative) (Figure 3). One reason for students saying no to the bid, answer “This is not important to me.”, decreased from 52 to 29 (Figure 4). Students seem to become aware of its importance after the information was provided. We did not see the impact of how the information about the common usages of WRS in the U.S. might have influenced their choice. However, it might be hidden in answer “Other” as seen in Figure 3. In most cases, the students’ reasons for saying yes or no to use the WRS (Figure 5 and Figure 6) generally supported the same findings with the exception of the increase of answer “I’m concerned about water quality and/or the impact on my health.” and a significant decrease in answer “Other” as a reason for not wanting to use the WRS. It is difficult to interpret the increase in answer “I’m concerned about water quality and/or the impact on my health.” because that choice only includes positive information about water from WRS. The number of respondents who chose answer “Other” was quite significate compared to the other choices. Therefore, it is possible we missed some important reason for students not wanting to use a WRS. Although there were not many, some students wrote the reason for chose answer “Other” on the back of their surveys. Some students stated that they do not even like drinking water, or, some just prefer to drink tea rather than water.

5. Conclusions

Our study investigated the feasibility and potential contributions of WRSs to campus sustainability. Adopting GFT and the IFEP as theoretical frameworks, we hypothesized the installation of WRSs and dissemination of information about WRSs encourages students’ pro-environmental behavior (using less disposable plastic bottles). We designed a questionnaire survey to test our hypotheses.
There were three major findings corresponding with our three research questions. First, our study revealed that amount students were WTP for a WRS was sufficient enough to cover the installation and maintenance costs of a WRS. To our knowledge, there had been no study regarding students’ WTP for a WRS. Students’ reasons for supporting a WRS were consistent with all three reasons proposed by the IFEP. Students’ reasons for opposing a WRS and the predictors for the full model for WTP estimate provided important implications for gaining further support for a WRS. Second, utilizing their WTU, it was estimated that students in College of Policy Science, including CRPS students and all years, could save 45,191 plastic bottles and 10,846 kg of CO2 emissions every year. While the WTP includes students who would support installing a WRS but not necessarily use it, the WTU tells us how many students would use a WRS and can be used measure its environmental impacts by the number of plastic bottles and CO2 emissions saved. It was interesting to find that there were students who would be willing to support installing a WRS in WTP but were not willing to do use WRS measured in WTU. Lastly, as we hypothesized, disseminating information about WRSs positively influenced WTP and WTU.
There are several limitations of our study, which should be considered in future research. The main limitation of our study is that we used self-reports from our survey to analyze respondents’ attitudes [37]. Empirical studies have revealed that the link between attitudes and environmental behavior is not always clear or contradictory [3,4,64]. In particular, there could have been a significant gap between attitudes and behavior if university students were asked to make radical changes, rather than light changes (called “light green”) [65]. In our study, there are two primary gaps we should expect: WTP vs actual donation, and WTU vs actual use of WRS. As discussed in previous sections, WTP tends to be overstated. However, a smaller donation, such as a one-third donation as List and Gallet [59] discussed, may not be a serious issue if the university could pay the upfront costs until future first-year students could repay later. The gap between WTU and actual use of a WRS also may not be significant. While in general pro-environmental behaviors mostly appeal to normative goals and less so for hedonic and gain goals, WRS appeal to hedonic and gain goals as it is fun to use and students would at no cost receive clean and healthy drinking water. As our study revealed, the installation of a WRS corresponds with the strategies proposed in the IFEP. However, relying on self-reports about their attitudes is certainly the biggest limitation of our study and further studies on actual behavior should be looked into. The second limitation of our study is the representativeness of our sample. The estimated aggregated WTP and WTU and its environmental impacts may be biased because our sample did not include the CRPS students or students in upper-grades. We assumed that other students’ WTP and WTU would be the same as the first-year students who participated in the survey. However, it is possible for CRPS students, mostly international students, to have different preferences. Upper-grade students could also have different preferences as they spent more time on campus. The third limitation of our study was that it was not entirely comprehensive in that it did not consider all the costs and benefits of a WRS. For example, there is a cost-benefit analysis of implementing a ban on the sale of plastic water bottles and introducing WRSs on campus in the U.S. [66]; the analysis showed that there is loss in revenue from sale of water bottles, while the environmental benefits measured in monetary value were limited. Therefore, when proposing the installation of a WRS, such possible positive and negative aspects should be carefully considered.

Supplementary Materials

The following are available online at https://www.mdpi.com/2071-1050/10/9/3074/s1, SI1: Questionnaire, SI2: Summary statistics, SI3: Summary tables.

Author Contributions

Conceptualization, T.U.; Methodology, T.U.; Software, T.U.; Formal Analysis, T.U.; Data Curation, T.U. and A.Y.; Writing-Original Draft Preparation, T.U. and A.Y.; Writing-Review & Editing, A.Y.; Visualization, T.U.; Supervision, T.U.; Project Administration, T.U.; Funding Acquisition, T.U.

Funding

This research was funded by Ritsumeikan University.

Acknowledgments

We thank to College of Policy Science at Ritsumeikan University for providing us with an opportunity to conduct an in-class survey.

Conflicts of Interest

The authors declare no conflicts of interest.

References

  1. Amaral, L.P.; Martins, N.; Gouveia, J.B. Quest for a sustainable university: A review. Int. J. Sustain. High. Educ. 2015, 16, 155–172. [Google Scholar] [CrossRef]
  2. Velazquez, L.; Munguia, N.; Platt, A.; Taddei, J. Sustainable university: What can be the matter? J. Clean. Prod. 2006, 14, 810–819. [Google Scholar] [CrossRef]
  3. Zsóka, Á.; Szerényi, Z.M.; Széchy, A.; Kocsis, T. Greening due to environmental education? Environmental knowledge, attitudes, consumer behavior and everyday pro-environmental activities of Hungarian high school and university students. J. Clean. Prod. 2013, 48, 126–138. [Google Scholar] [CrossRef]
  4. Vicente-Molina, M.A.; Fernández-Sáinz, A.; Izagirre-Olaizola, J. Environmental knowledge and other variables affecting pro-environmental behaviour: Comparison of university students from emerging and advanced countries. J. Clean. Prod. 2013, 61, 130–138. [Google Scholar] [CrossRef]
  5. Emanuel, R.; Adams, J.N. College students’ perceptions of campus sustainability. Int. J. Sustain. High. Educ. 2011, 12, 79–92. [Google Scholar] [CrossRef]
  6. Ten Brink, P.; Schweitzer, J.-P.; Watkins, E.; De Smet, M.; Leslie, H.; Galgani, F. Circular economy measures to keep plastics and their value in the economy, avoid waste and reduce marine litter. Econ. Discuss. Pap. 2018, 3, 1–15. Available online: http://www.economics-ejournal.org/economics/discussionpapers/2018-3/file (accessed on 28 August 2018).
  7. Zettler, E.R.; Mincer, T.J.; Amaral-Zettler, L.A. Life in the “Plastisphere”: Microbial Communities on Plastic Marine Debris. Environ. Sci. Technol. 2013, 47, 7137–7146. [Google Scholar] [CrossRef] [PubMed]
  8. Geyer, R.; Jambeck, J.R.; Law, K.L. Production, use, and fate of all plastics ever made. Sci. Adv. 2017, 3. [Google Scholar] [CrossRef] [PubMed]
  9. Jambeck, J.R.; Geyer, R.; Wilcox, C.; Siegler, T.R.; Perryman, M.; Andrady, A.; Narayan, R.; Law, K.L. Plastic waste inputs from land into the ocean. Science 2015, 347, 768–771. [Google Scholar] [CrossRef] [PubMed]
  10. Eriksen, M.; Lebreton, L.C.M.; Carson, H.S.; Thiel, M.; Moore, C.J.; Borerro, J.C.; Galgani, F.; Ryan, P.G.; Reisser, J. Plastic pollution in the world’s oceans: More than 5 trillion plastic pieces weighing over 250,000 tons afloat at sea. PLoS ONE 2014, 9, e111913. [Google Scholar] [CrossRef] [PubMed] [Green Version]
  11. do Sul, J.A.I.; Costa, M.F. The present and future of microplastic pollution in the marine environment. Environ. Pollut. 2014, 185, 352–364. [Google Scholar] [CrossRef] [PubMed]
  12. Lebreton, L.; Slat, B.; Ferrari, F.; Sainte-Rose, B.; Aitken, J.; Marthouse, R.; Hajbane, S.; Cunsolo, S.; Schwarz, A.; Levivier, A. Evidence that the Great Pacific Garbage Patch is rapidly accumulating plastic. Sci. Rep. 2018, 8, 4666. [Google Scholar] [CrossRef] [PubMed] [Green Version]
  13. UNEP. Valuing Plastics: The Business Case for Measuring, Managing and Disclosing Plastic Use in the Consumer Goods Industry; UNEP: Nairobi, Kenya, 2014. [Google Scholar]
  14. Vethaak, A.D.; Leslie, H.A. Plastic debris is a human health issue. Environ. Sci. Technol. 2016, 50, 6825–6826. [Google Scholar] [CrossRef] [PubMed]
  15. Roth, B. Campus Water Stations Save 400,000 Plastic Bottles|Duke Today. Duke Today, 2015. Available online: https://today.duke.edu/2015/10/hydrationstations(accessed on 28 August 2018).
  16. Zalkow, D.; Lieb, E. Report of the PSU Sustainable Drinking Water Task Force; Portland State University: Portland, OR, USA, 2012. [Google Scholar]
  17. Moganadas, S.R.; Corral-Verdugo, V.; Ramanathan, S. Toward systemic campus sustainability: Gauging dimensions of sustainable development via a motivational and perception-based approach. Environ. Dev. Sustain. 2013, 15, 1443–1464. [Google Scholar] [CrossRef]
  18. Vasquez, M.; Carter, J.; Valko, P. Bottled Water Ban: Update 2015; Washington University in St. Louis: St. Louis, MO, USA, 2015. [Google Scholar]
  19. Thompson, R.C.; Moore, C.J.; vom Saal, F.S.; Swan, S.H. Plastics, the environment and human health: Current consensus and future trends. Philos. Trans. R Soc. Lond. B Biol. Sci. 2009, 364, 2153–2166. [Google Scholar] [CrossRef] [PubMed]
  20. Cornell University Drinking Water. Available online: https://www.sustainablecampus.cornell.edu/initiatives/drinking-water (accessed on 7 July 2018).
  21. Michigan State University Graduate Class Uncovers Key Campus Drinking Water Preferences. Available online: https://sustainability.msu.edu/get-involved/faculty-resources/get-involved-faculty-water-study.html (accessed on 7 July 2018).
  22. The University of Arizona. Reduce and Reuse: One UA Water Bottle Refill STATION at a Time; The University of Arizona: Tucson, AZ, USA, 2016. [Google Scholar]
  23. King, A.; Bjerregaard, Z.; Booth, M.; Clugston, S.; Dittmore, M.; Fossett, S.; Pilkington, D.; Sawatzki, P.; Trentelman, C.K. Behaviors, Motivations, Beliefs, and Attitudes Related to Bottled Water Usage at Weber State University. J. Utah Acad. Sci. Arts Lett. 2014, 191–211. Available online: https://www.researchgate.net/publication/282735738_Behaviors_Motivations_Beliefs_and_Attitudes_Related_to_Bottled_Water_Usage_at_Weber_State_University (accessed on 28 August 2018).
  24. Curtis, I.A. Valuing ecosystem goods and services: A new approach using a surrogate market and the combination of a multiple criteria analysis and a Delphi panel to assign weights to the attributes. Ecol. Econ. 2004, 50, 163–194. [Google Scholar] [CrossRef]
  25. Güngör-Demirci, G.; Lee, J.; Mirzaei, M.; Younos, T. How do people make a decision on bottled or tap water? Preference elicitation with nonparametric bootstrap simulations. Water Environ. J. 2016, 30, 243–252. [Google Scholar] [CrossRef]
  26. Saylor, A.; Prokopy, L.S.; Amberg, S. What’s wrong with the tap? Examining perceptions of tap water and bottled water at Purdue University. Environ. Manag. 2011, 48, 588–601. [Google Scholar] [CrossRef] [PubMed]
  27. The Ritsumeikan Trust Environmental Action Guideline. Available online: http://www.ritsumei.ac.jp/rs/eco/guideline/ (accessed on 24 July 2018).
  28. Nielsen, K.S. From prediction to process: A self-regulation account of environmental behavior change. J. Environ. Psychol. 2017, 51, 189–198. [Google Scholar] [CrossRef]
  29. Steg, L.; Bolderdijk, J.W.; Keizer, K.; Perlaviciute, G. An Integrated Framework for Encouraging Pro-environmental Behaviour: The role of values, situational factors and goals. J. Environ. Psychol. 2014, 38, 104–115. [Google Scholar] [CrossRef] [Green Version]
  30. Ajzen, I. The theory of planned behavior. Organ. Behav. Hum. Decis. Process. 1991, 50, 179–211. [Google Scholar] [CrossRef]
  31. De Leeuw, A.; Valois, P.; Ajzen, I.; Schmidt, P. Using the theory of planned behavior to identify key beliefs underlying pro-environmental behavior in high-school students: Implications for educational interventions. J. Environ. Psychol. 2015, 42, 128–138. [Google Scholar] [CrossRef] [Green Version]
  32. Qian, N. Bottled Water or Tap Water? A Comparative Study of Drinking Water Choices on University Campuses. Water 2018, 10, 59. [Google Scholar] [CrossRef]
  33. Hiratsuka, J.; Perlaviciute, G.; Steg, L. Testing VBN theory in Japan: Relationships between values, beliefs, norms, and acceptability and expected effects of a car pricing policy. Transp. Res. Part F Traffic Psychol. Behav. 2018, 53, 74–83. [Google Scholar] [CrossRef]
  34. Lindenberg, S.; Steg, L. Normative, gain and hedonic goal frames guiding environmental behavior. J. Soc. Issues 2007, 63, 117–137. [Google Scholar] [CrossRef]
  35. Ruepert, A.M.; Keizer, K.; Steg, L. The relationship between Corporate Environmental Responsibility, employees’ biospheric values and pro-environmental behaviour at work. J. Environ. Psychol. 2017, 54, 65–78. [Google Scholar] [CrossRef]
  36. Rezvani, Z.; Jansson, J.; Bengtsson, M. Consumer motivations for sustainable consumption: The interaction of gain, normative and hedonic motivations on electric vehicle adoption. Bus. Strategy Environ. 2018, 1–12. [Google Scholar] [CrossRef]
  37. Steg, L.; Vlek, C. Encouraging pro-environmental behaviour: An integrative review and research agenda. J. Environ. Psychol. 2009, 29, 309–317. [Google Scholar] [CrossRef]
  38. Freeman, A.M., III; Herriges, J.A.; Kling, C.L. The Measurement of Environmental and Resource Values: Theory and Methods; Routledge: Oxon, UK, 2014; ISBN 1317703936. [Google Scholar]
  39. Boyle, K.J. Contingent valuation in ractice. In A Primer on Nonmarket Valuation; Champ, P.A., Boyle, K.J., Brown, T.C., Eds.; Springer: Dordrecht, The Netherlands, 2017; pp. 81–131. [Google Scholar]
  40. Mitchell, R.C.; Carson, R.T. Using Surveys to Value Public Goods: The Contingent Valuation Method; Resources for the Future: Washington, DC, USA, 1989; ISBN 0915707322. [Google Scholar]
  41. Boyle, K.J.; MacDonald, H.F.; Cheng, H.; McCollum, D.W. Bid design and yea saying in single-bounded, dichotomous-choice questions. Land Econ. 1998, 74, 49–64. [Google Scholar] [CrossRef]
  42. Scarpa, R.; Bateman, I. Efficiency gains afforded by improved bid design versus follow-up valuation questions in discrete-choice CV studies. Land Econ. 2000, 76, 299–311. [Google Scholar] [CrossRef]
  43. Sakurai, R.; Uehara, T. Contingent Valuation Study regarding Placing Campus Patrol for Reducing Smoking at a University: Applying Inferred Valuation Approach. Int. J. Ecol. Econ. Stat. 2017, 38, 124–140. [Google Scholar]
  44. Seroa da Motta, R.; Ortiz, R.A. Costs and Perceptions Conditioning Willingness to Accept Payments for Ecosystem Services in a Brazilian Case. Ecol. Econ. 2018, 147, 333–342. [Google Scholar] [CrossRef]
  45. Subroy, V.; Rogers, A.A.; Kragt, M.E. To Bait or Not to Bait: A Discrete Choice Experiment on Public Preferences for Native Wildlife and Conservation Management in Western Australia. Ecol. Econ. 2018, 147, 114–122. [Google Scholar] [CrossRef]
  46. Department of Facilities Planning and Administration, Minister’s Secretariat. Guidelines for Planning National University Campuses; Department of Facilities Planning and Administration: Tokyo, Japan, 2013.
  47. The Council for PET Bottle Recycling. Annual Report for PET Bottle Recycling 2017; The Council for PET Bottle Recycling: Tokyo, Japan, 2017. [Google Scholar]
  48. Louviere, J.J.; Flynn, T.N.; Marley, A.A.J. Best-Worst Scaling: Theory, Methods and Applications; Cambridge University Press: Cambridge, UK, 2015; ISBN 1107043158. [Google Scholar]
  49. Aizaki, H.; Nakatani, T.; Sato, K. Stated Preference Methods Using R; Chapman & Hall/CRC The R Series; CRC Press: Boca Raton, FL, USA, 2015; ISBN 9781439890479. [Google Scholar]
  50. The R Foundation R. Available online: https://www.r-project.org/ (accessed on 6 August 2018).
  51. StataCorp LP STATA. Available online: http://www.stata.com (accessed on 6 August 2018).
  52. Cronbach, L.J. Coefficient alpha and the internal structure of tests. Psychometrika 1951, 16, 297–334. [Google Scholar] [CrossRef] [Green Version]
  53. Field, A.; Miles, J.; Field, Z. Discovering Statistics Using R; SAGE Publications: London, UK, 2012; ISBN 9781446289136. [Google Scholar]
  54. Chudwick, E.; Salvemini, M.; Welker, A. Implementing Water Refill Stations across Campus to Promote Reusable Water Bottle Use; Villanova University: Pennsylvania, PA, USA, 2013. [Google Scholar]
  55. Pearce, D.; Atkinson, G.; Mourato, S. Cost-Benefit Analysis and the Environment: Recent Developments; OECD: Paris, France, 2006; ISBN 9264010041. [Google Scholar]
  56. Hanemann, W.M. Welfare Evaluations in Contingent Valuation Experiments with Discrete Responses. Am. J. Agric. Econ. 1984, 66, 332–341. [Google Scholar] [CrossRef]
  57. The Pennsylvania State University Water Bottle Refill Stations. Available online: http://sustainability.psu.edu/waterbottles (accessed on 24 July 2018).
  58. Bohm, P. Estimating demand for public goods: An experiment. Eur. Econ. Rev. 1972, 3, 111–130. [Google Scholar] [CrossRef]
  59. List, J.A.; Gallet, C.A. What experimental protocol influence disparities between actual and hypothetical stated values? Environ. Resour. Econ. 2001, 20, 241–254. [Google Scholar] [CrossRef]
  60. University of the Sunset Coast. Reuse Refill and Reduce: The Eco-Logical Way to Drink Water; University of the Sunshine Coast: Queensland, Australia, 2014. [Google Scholar]
  61. Bergstrom, J.C.; Stoll, J.R. The impact of information on environmental commodity valuation decisions. Am. J. Agric. Econ. 1990, 72, 614–621. [Google Scholar] [CrossRef]
  62. Tkac, J. The Effects of Information on Willingness-to-Pay Values of Endangered Species. Am. J. Agric. Econ. 1998, 80, 1214–1220. [Google Scholar] [CrossRef]
  63. Lusk, J.L.; House, L.O.; Valli, C.; Jaeger, S.R.; Moore, M.; Morrow, J.L.; Traill, W.B. Effect of information about benefits of biotechnology on consumer acceptance of genetically modified food: Evidence from experimental auctions in the United States, England, and France. Eur. Rev. Agric. Econ. 2004, 31, 179–204. [Google Scholar] [CrossRef]
  64. Scott, D.; Willits, F.K. Environmental attitudes and behavior: A Pennsylvania survey. Environ. Behav. 1994, 26, 239–260. [Google Scholar] [CrossRef]
  65. Kagawa, F. Dissonance in students’ perceptions of sustainable development and sustainability: Implications for curriculum change. Int. J. Sustain. High. Educ. 2007, 8, 317–338. [Google Scholar] [CrossRef]
  66. Curtis-Murphy, M.; Sessions, C. Ban the Bottle: Implementing a Ban on the Sale of Plastic Water Bottles. Evans Law Sch. Rev. 2014, 4, 44–58. [Google Scholar]
Figure 1. Hypothetical relationships between the survey design and expected influences on students’ attitudes toward pro-environmental behavior.
Sustainability 10 03074 g001
Figure 2. Priorities in choosing drinking water utilizing a standardized best-worst score (N = 255).
Sustainability 10 03074 g002
Figure 3. Reasons for saying yes to bid.
Sustainability 10 03074 g003
Figure 4. Reasons for saying no to bid.
Sustainability 10 03074 g004
Figure 5. Reasons for WTU.
Sustainability 10 03074 g005
Figure 6. Reasons for students not wanting to use WRS.
Sustainability 10 03074 g006
Table 1. Students’ attitudes toward sustainability in school/community and their own personal responsibility.
ItemStrongly Agree or Agree (%)Strongly Disagree or Disagree (%)N
School/community responsibilityDo you think campus maintenance, development and management should prioritize sustainability?80.833.39266
Do you think every member of the university should support sustainable solutions?76.326.76266
Personal responsibilityDo you want to be part of creating of a sustainable campus, community and/or world?78.124.15265
Would you support and/or participate in environmental conservation activities put on by the university?72.454.91265
Table 2. Frequencies of responses to each of the five bid combinations.
First BidSecond Bid If Yes to the FirstSecond Bid If No to the FirstYYYNNYNNTotal
500100025013(14%)39(43%)16(18%)23(25%)91(100%)
100020005003(5%)21(34%)18(29%)20(32%)62(100%)
2000400010007(9%)16(20%)28(35%)30(37%)81(100%)
4000800020004(5%)8(11%)29(38%)35(46%)76(100%)
800016,00040004(5%)4(5%)28(37%)39(52%)75(100%)
YY: yes to the first bid, yes to the second one; YN: yes to the first bid, no to the second one; NY: no to the first bid, yes to the second one; NN: no to the first bid, no to the second one.
Table 3. A simple logit model for WTP estimates.
VariableCoefficientStd. Errorp-Value
Constant9.1440.556<0.001****
Information dummy0.3330.1950.088*
log(Bid)−1.3400.076<0.001****
Log-likelihood−545.256
AIC1096.512
BIC1108.372
N385
**** p < 0.001, *** p < 0.01, ** p < 0.05, * p < 0.10.
Table 4. A full logit model to explore the factors affecting WTP estimates.
VariableCoefficientStd. Errorp-Value
Constant10.3261.352<0.001****
Information dummy0.4280.2100.041**
Environmental education0.0720.2120.734
Knew about WRS−0.4610.2710.089*
Attitudes toward campus sustainability−0.1490.045<0.001****
Frequency to campus0.4120.1950.035**
Gender−0.3790.2160.079*
Part-time Job−0.1130.2380.636
log(Bid)−1.4050.083<0.001****
Log-likelihood−479.397
AIC976.7933
BIC1011.411
N346
**** p < 0.001, *** p < 0.01, ** p < 0.05, * p < 0.10.
Table 5. Description of variables used in the full logit model.
VariableDescriptionMeanStd. Dev.
Information dummy0: Not informed, 1: Informed0.4960.501
Environmental education1: Yes, 2: No1.5030.501
Knew about WRS1: Yes, 2: No1.8330.374
Attitudes toward campus sustainabilityThe sum of four questions regarding attitudes toward campus sustainability (Q7, 8, 9, and 10). 4: Strongly agree with all four questions, …, 20: Strongly disagree with all four questions7.9582.393
Frequency to campus1: Once a week, 2: Twice a week, 3: Three times a week, 4: Four times a week, 5: Every day (Five times a week)4.4910.630
Gender1: Male, 2: Female1.4270.495
Part-time Job1: Yes, 2: No1.2990.458
Table 6. Students’ WTU before and after new information.
WTUNew Information
Before After
Freq.PercentFreq.Percent
Yes13054.62%14058.82%
No10845.38%9841.18%
Total238100.00%238100.00%
Table 7. The types of beverage container students drink from (N = 237).
ItemWithout WRSWRS without InformationWRS with Information
(1) PET bottles or plastic bottles1357674
(2) Paper cartons352226
(3) A reusable bottle with water or tea brought from home1179997
(4) Water from the water bottle refill station-129139
(5) Others (tea or water from the cafeteria, etc.)693439
Total356360375
Table 8. Estimation of the number of plastic bottles saved and reduction of CO2 emissions per week by all first-year students.
Number of First-Year StudentsNumber of Days per Week to Come to CampusPlastic Bottles Saved per Student per VisitPlastic Bottles Saved per WeekCO2 Emissions per Bottle (g)CO2 Emissions Avoided (kg)
1234 = 1 × 2 × 356 = 4 × 5/1000
4104.490.26473.76240113.70
CO2 emissions per bottle represents the carbon footprint of a disposable plastic water bottle (Japan Environmental Management Association for Industry, 2012).

