
Article

Habitat Association of Key Wildlife Species in One of the Largest Lowland Evergreen Forests in Southeast Asia


1
Conservation International-Cambodia, Phnom Penh Center, Phnom Penh 12300, Cambodia
2
School of Archaeology and Anthropology, Australian National University, Canberra ACT 2601, Australia
*
Author to whom correspondence should be addressed.
Biosphere 2026, 2(3), 7; https://doi.org/10.3390/biosphere2030007

Submission received: 2 April 2026 / Revised: 16 July 2026 / Accepted: 21 July 2026 / Published: 28 July 2026

Abstract

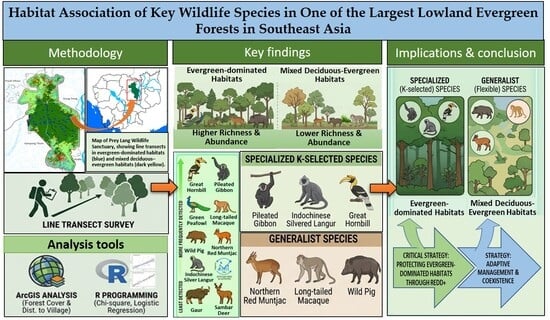
Wildlife plays a vital role in maintaining ecological balance and biodiversity, relying on habitats that provide shelter, food, and essential resources. This study investigated wildlife distribution and diversity across the REDD+ program area in Cambodia’s Prey Lang Wildlife Sanctuary, a lowland evergreen forest ecosystem, and assessed the effects of forest habitats and anthropogenic pressure on their distribution. We used square transects for sampling and ArcGIS to calculate forest cover and distance to the nearest village as a proxy for human impact. Overall, we recorded seven mammals and two birds, with the great hornbill (Buceros bicornis) most frequently detected, followed by pileated gibbon (Hylobates pileatus), wild pig (Sus scrofa), long-tailed macaque (Macaca fascicularis), green peafowl (Pavo muticus), northern red muntjac (Muntiacus vaginalis), and Indochinese silvered langur (Trachypithecus germaini), while gaur (Bos gaurus) and sambar deer (Rusa unicolor) were least detected. Wildlife richness and abundance were higher in evergreen-dominated habitats than in mixed deciduous–evergreen forests. Certain K-selected species, including pileated gibbon, Indochinese silvered langur, and great hornbill, were highly specialized and preferred intact forests, whereas generalist species such as northern red muntjac, long-tailed macaque, and wild pig showed ecological flexibility in habitat use. These findings emphasize tailored conservation strategies: protecting intact evergreen forests via REDD+ supports specialized species, while adaptive management in mosaic landscapes benefits generalists, enhancing wildlife conservation and sustainable management of the Prey Lang Wildlife Sanctuary.

Graphical Abstract

1. Introduction

Wildlife is an important component in natural ecosystems, contributing to ecological balance and biodiversity [1]. The survival, reproduction, and daily activities of wildlife in the ecosystem depend on a suitable habitat that provides essential resources such as food, water, shelter, and space [2]. The required amount of these resources varies from one taxonomic group to another and across habitat types. For instance, some K-selected species such as the Asian elephant (Elephas maximus) and gaur (Bos gaurus) in lowland evergreen forest are more associated with dense forest cover and perennial water sources [3,4]. Bird species such as the great hornbill are influenced by the availability of large fruiting trees and nesting cavities [5], and others, such as the giant ibis, lesser adjutant, and Asian woolly-necked stork, have been mainly recorded in protected areas where deeper waterholes and wetlands are present [6].
Lowland evergreen forests are globally recognized for their exceptional biodiversity and complex ecological interactions, particularly species–habitat relationships [7]. In mainland Southeast Asia, Cambodia’s Prey Lang Wildlife Sanctuary (PLWS) represents one of the largest remaining tracts of lowland evergreen forest, comprising a mosaic of evergreen and deciduous forest types [7]. The PLWS supports a remarkable diversity of wildlife, including iconic species such as the Asian elephant (Helarctos malayanus), Malayan sun bear (Helarctos malayanus), pileated gibbon (Hylobates pileatus), long-tailed macaque (Macaca fascicularis), great hornbill (Buceros bicornis), and green peafowl (Pavo muticus) [8,9]. Notably, species richness recorded in this sanctuary are highest in the dense forest areas concentrated near the core zone, whereas wildlife abundance appears more randomly distributed across the broader landscape, for example, the abundance of wild pig, Malayan sun bear, northern red muntjac, and long-tailed macaque [9,10].
In Cambodia, diverse forest ecosystems across protected areas continue to support rich wildlife biodiversity, yet research on species’ habitat associations remains limited. Some exceptions include the study of Gray et al. [11], who investigated the habitat requirements of the Bengal florican and found that the species depends on grassland habitats maintained by traditional agricultural practices. Gray et al. [10] assessed the status and habitat association of wild cattle and large carnivores in eastern Cambodia, indicating that these species rely on mosaics of deciduous dipterocarp and mixed deciduous/semi-evergreen forest. Similarly, Gray and Phan [12] reported that large mammals in the Phnom Prich Wildlife Sanctuary prefer mixed deciduous and semi-evergreen forest. While these contributions provide valuable insights, the habitat associations of other wildlife species in different protected areas, including the PLWS, remain poorly studied. Moreover, the influences of different forest-cover classes (e.g., evergreen forest, semi-evergreen forest, and dry dipterocarp forest) and anthropogenic pressures on wildlife distribution are scarcely documented, despite increasing threats from logging, land encroachment, and hunting.
To address this need and contribute to biodiversity research on habitat associations of key species in the PLWS, we (1) describe patterns of species occurrence, diversity, richness, and relative abundance of ecologically important mammal and bird species across the sanctuary and (2) assess the levels of impact of the evergreen forest proportion and anthropogenic pressure on the faunal distribution. The results of this study also serve as a baseline survey using transect sampling for long-term biodiversity monitoring in the area and a preliminary assessment of the REDD+ project implementation. Previous records of the target species are also discussed and compared with their present records in this study to confirm their existence in the PLWS.

2. Methodology

2.1. Study Site

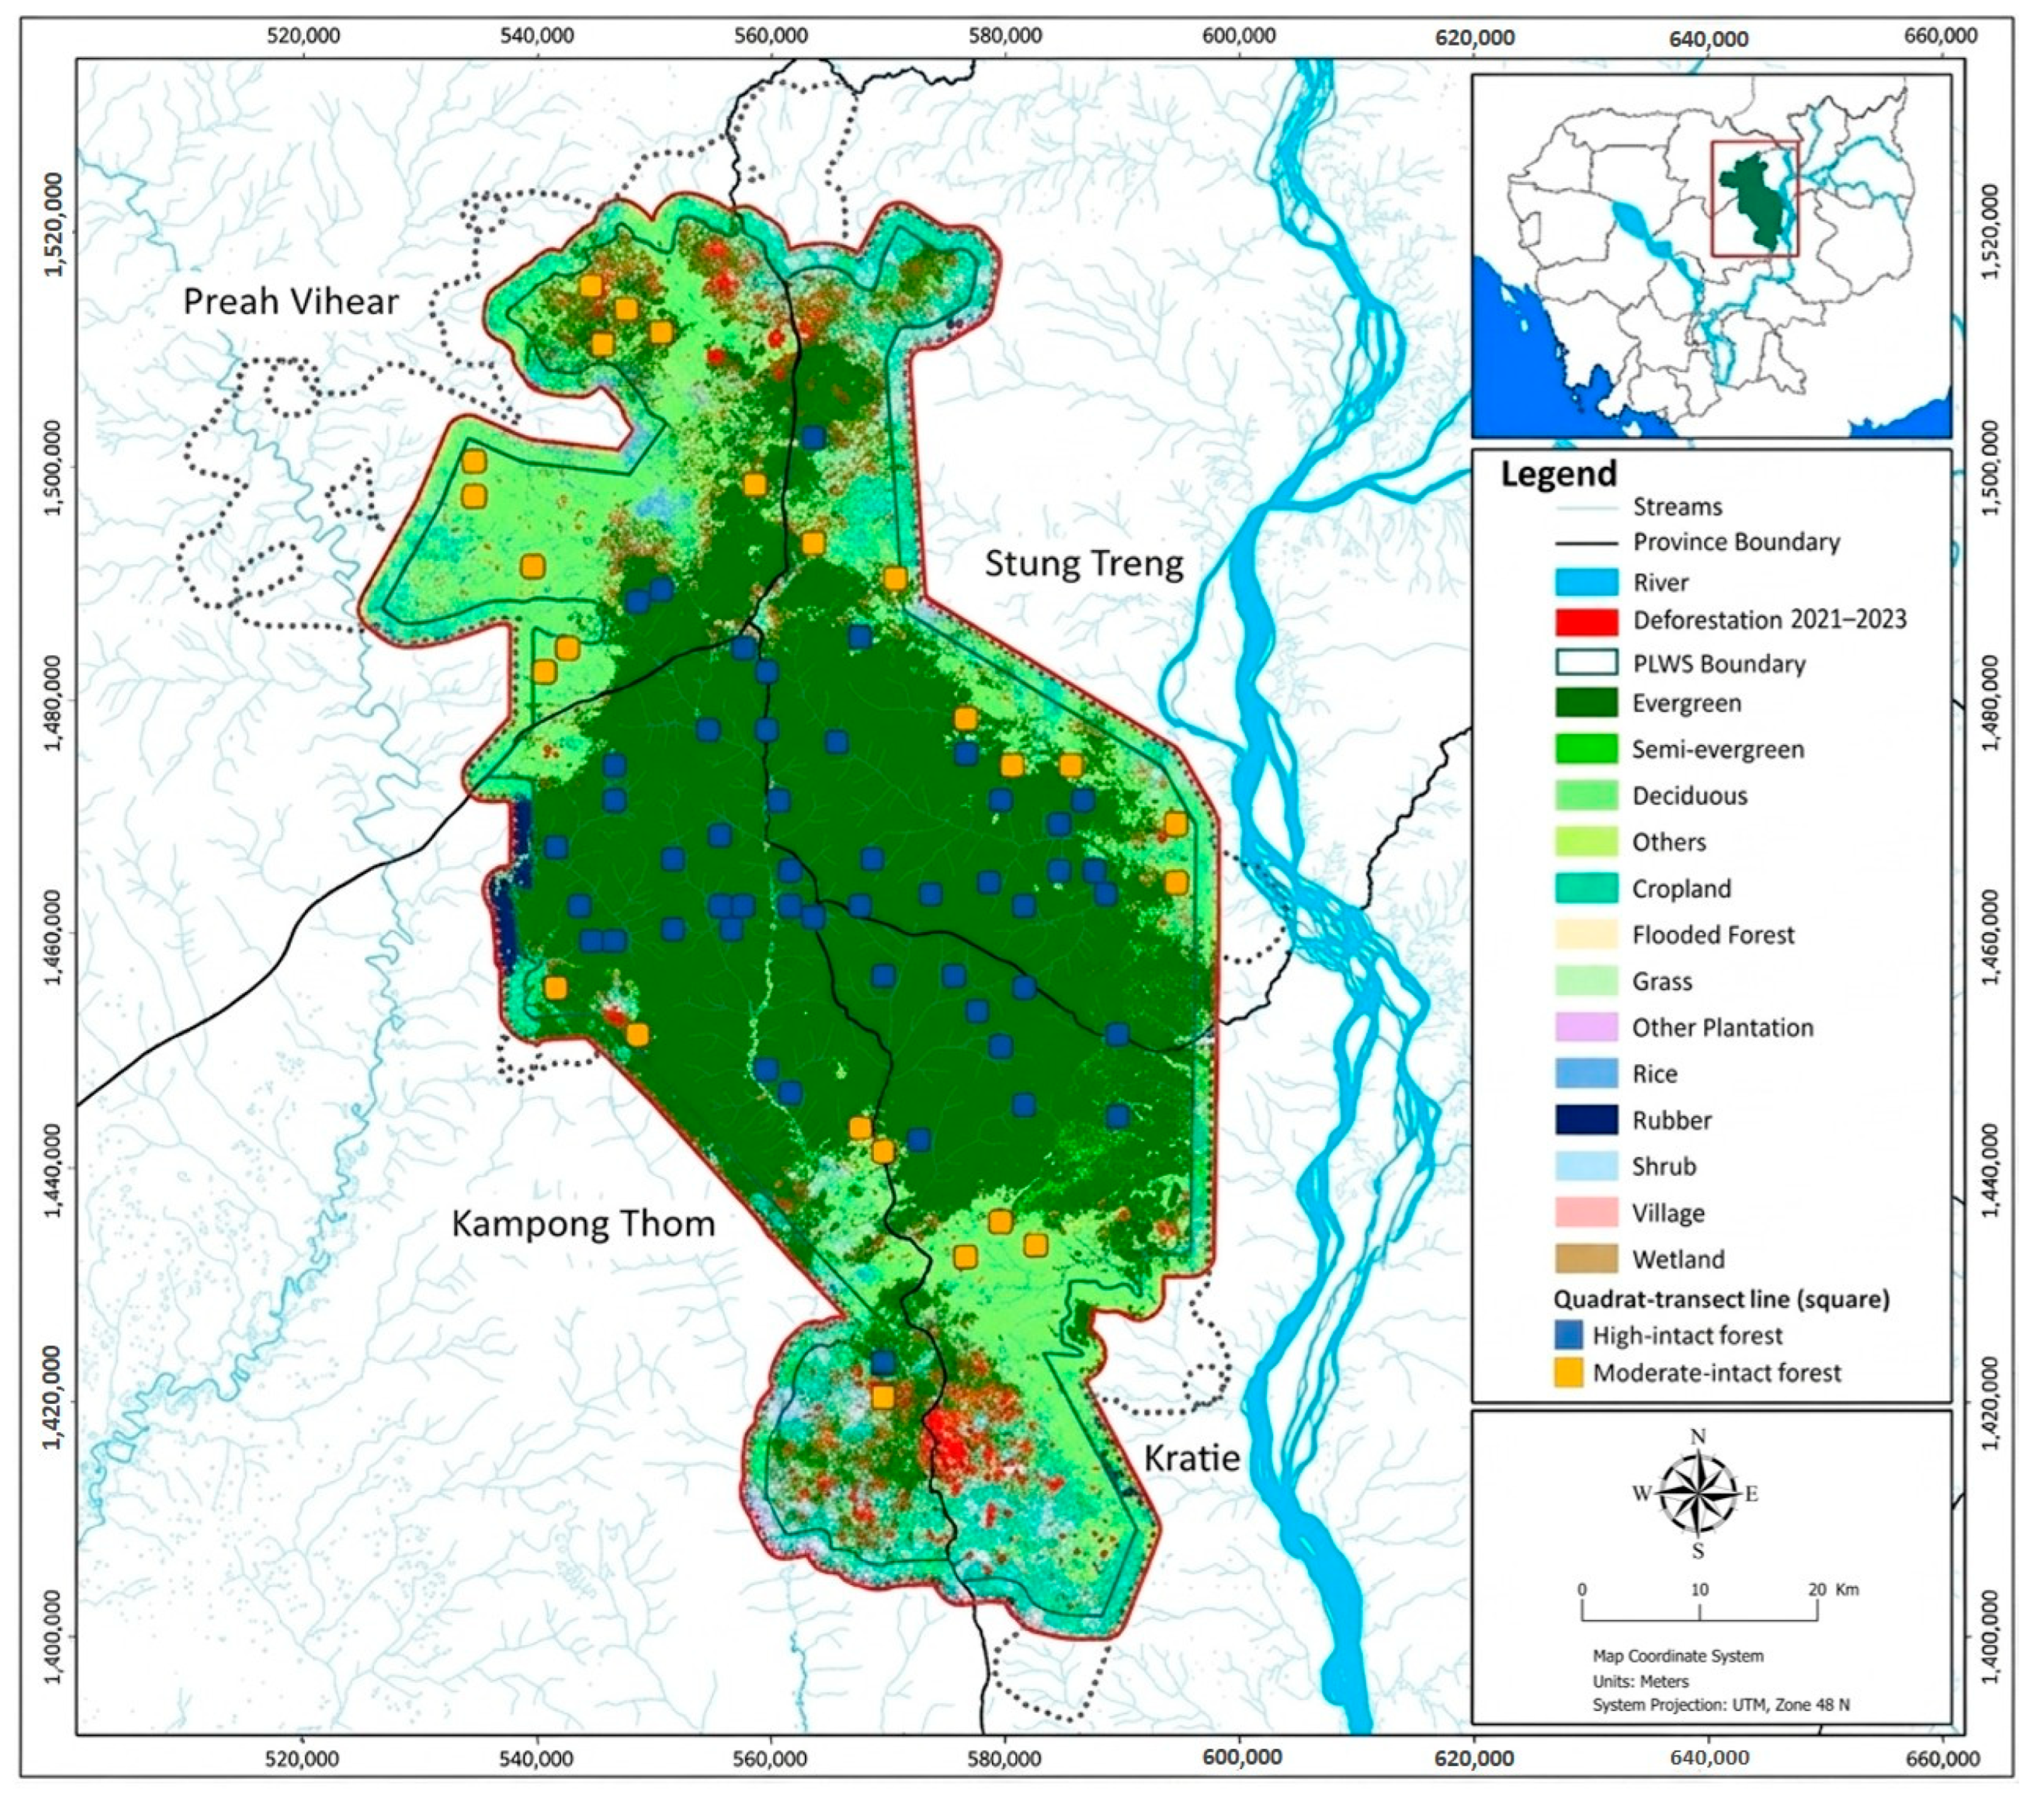
The study was conducted in the PLWS, located in the central plains of Cambodia, comprising areas of four provinces: Stung Treng, Kampong Thom, Preah Vihear, and Kratie. The total area of the PLWS is 4316.83 km2, mainly attributed to evergreen forest (57%) and deciduous forest (26%). The PLWS experiences a tropical climate with distinct wet and dry seasons. The wet season typically spans from May to October, with the southwest monsoon bringing substantial rainfall, while the dry season lasts from November to April. During this period, the region receives approximately 1300 to 1800 mm of precipitation.
The PLWS is essential to the well-being of over 250,000 indigenous and local people. The majority of local communities live in the western and northern parts of Prey Lang (particularly in Kampong Thom and Preah Vihear provinces) (Figure 1). The forest is deeply woven into their cultural and spiritual lives, and they rely heavily on the rich ecosystem services from the forest to meet their social and economic needs. Local villagers engage in fisheries and agriculture and gather resin, building materials, medicine, and local food from the forest, with many depending on these resources for their livelihoods [13].
Our study site is located in the REDD+ project area (3752 km2) of the PLWS. As of 2023, this REDD+ project area was mainly characterized by evergreen forests (69%), deciduous forests (24.35%), semi-evergreen forests (0.14%), cropland (0.33%), grassland (1.94%), and other plantations (0.043%). Forest clearance for agriculture is also occurring within the sanctuary at an estimated rate of approximately 0.81% [14].

2.2. Target Species

Fifteen species of mammals and birds were targeted for the survey (Table 1). The selection of these species was based on the fact that their occurrences are crucial for informing conservation strategies and facilitating the development of targeted management plans, particularly for species experiencing population declines. The fifteen species are also of high conservation value (i.e., threatened category in the IUCN Red List), and their ecological and biological significance in the ecosystem are recognized. For instance, gibbons are critical for seed dispersal, while dholes serve as top predators, regulating the prey population in the landscape [15,16]. These species play pivotal roles in maintaining ecological balance and are therefore essential components of conservation monitoring efforts [17]. For additional information on each species, we refer to Table 1 below.

2.3. Transect Designs and Development

In this study, we used a square transect with 1 km sides (i.e., a 1 km2 grid) as the distance sampling method. This approach is an effective method to estimate key species density and population size and is a standard monitoring approach in two other protected landscapes in Cambodia [32].
A total of 74 squares with 1 km side were randomly selected across the REDD+ project area in the PLWS (Figure 2) using the ArcMap 10.81 Global Information System. We initially generated 400 1 km2 grids. To maintain the spatial independence of our sampling units, we excluded grids that were previously deforested, adjacent, or interconnected. While this approach ensures independence, we acknowledge that it may reduce the representation of habitat characteristics within the study area. This resulted in a reduced set of 149 grids. Due to time, resources, and logistic constraints, we randomly selected 74 grids from the 149 grids. The number of selected grids eventually corresponded to ~2.4% of the total area. This approach of using a subset of grids is commonly practiced in ecological studies, where the sampling of a smaller representative area is both efficient and effective for data collection and analysis [33].
Comprehensive training sessions of the field teams were conducted from 26 to 28 July 2022 to ensure that sampling and methodological protocols were highly adhered to (Figure 2a). Transects were established using a compass, and the transect trails and corners were marked with paint. The transect trails along the four sides of each square were cleared using machetes, creating a trail width of ~1 m to minimize the impact on vegetation cover.
For each square transect, a trail with a 4 km cumulative length (4 sides × 1 km length) required a collaborative effort of 8 individuals, corresponding to an average of 6 to 8 h of work. We spent approximately 4 months to complete the development of the 74 square transects at the study site, commencing on 13 September 2022 and concluding on 29 December 2022. The total length of all transect trails is 296 km.

2.4. Data Collection, Processing, and Preparation

The data collection period was from 13 January to 21 May 2023, corresponding to the second half of the dry season (which runs from around December through May). The order of square-transect establishment was arranged for data collection, meaning that the square transect that was first developed was chosen for the first data collection and so forth. In this way, each square transect had about four months without any human presence. We adopted this process to minimize the effects of human-made trails on animal behaviors (e.g., foraging, courting, etc.).
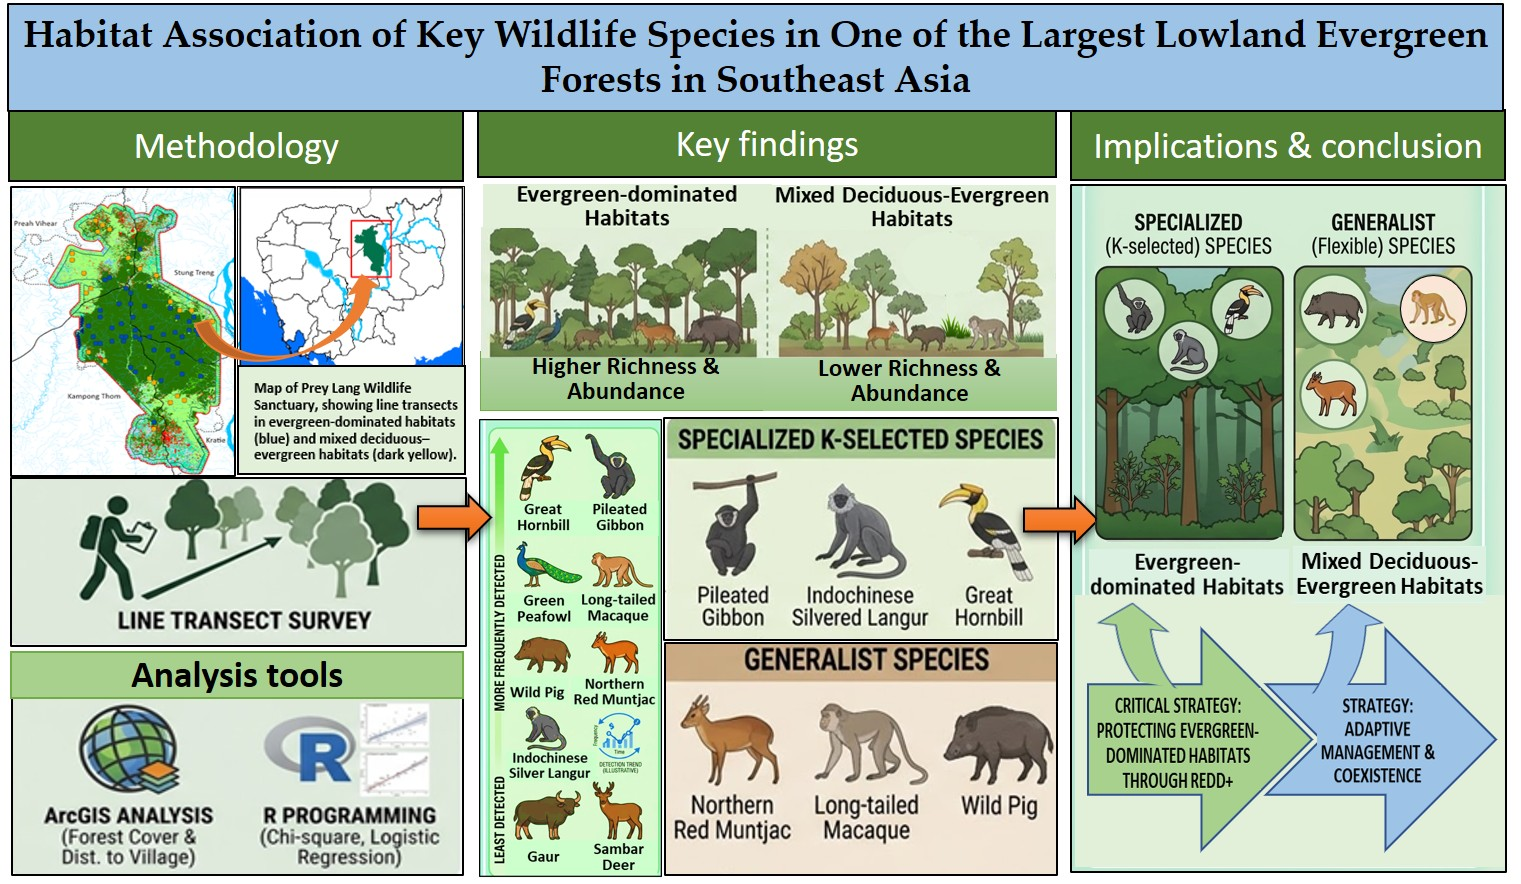
Each square transect was walked twice per day—once in the morning from 06:00 to 11:30 and once from 13:00 to 16:30. The morning team began their walk from right to left (4 km) at a starting point and ended their walk when arriving back at the starting point. The afternoon team reversed their walk direction (from left to right, 4 km), also beginning and ending at the same starting point (Figure 2b). Each team consisted of two trained observers who walked along the transect line. One observer focused on the area directly along or near the transect, while the other observer focused on the areas to the left and right of the transect [32]. Only animals detected through direct visual sightings were recorded; other evidence, such as calling or signs, was not included in this study. Although it may produce false negatives, this approach was applied to ensure standardized direct observations during the surveys. During the survey, team members remained silent to avoid disturbing wildlife. They walked slowly along the transects, stopping whenever animals were observed. If no animals were detected, they paused every 50 m to conduct a careful search.
A Global Positioning System (GPS) unit was used to record the relative location of detected animals. Some other field equipment was also used: a timer to record the time during the survey, a compass to measure the bearing from the observer to the detected animals, and a laser rangefinder to measure the distance from the observer to the detected animals. A measuring tape was used instead in cases in which the laser rangefinder was not applicable, e.g., in a densely forested area.
The perpendicular distance (PD) from the transect line to the detected animals was computed using the formula: D = B × Sinα, where B is the distance from the observer to the detected animal and α is the bearing angle between the walking direction along the transect and the detected animal (Figure 2a). The perpendicular distance was also calculated for further analysis to estimate the density of target species.

2.5. Forest Cover Proportion Calculation and Anthropogenic Pressure

The estimation of forest cover proportion and anthropogenic pressure are used to assess their levels of impact on the faunal distribution. The percentage of forest cover classes (e.g., evergreen forest, cropland, dry dipterocarp forest, semi-evergreen forest, shrub, other plantations, rice field, and grass) representing the forest habitat for each transect was calculated from an area of 9 km2, combining each surveyed transect located in the center and the eight surrounding squares with 1 km sides. The process of combining the surrounding 8 km2 was the same across the 74 square transects. An area of 9 km2 is indicative of habitat association for animals’ daily activities, especially foraging [35]. While individual home ranges vary across our target fauna, this 9 km2 scale serves as an optimized multi-species baseline [36]. It is large enough to encompass local foraging patches for wide-ranging birds and large ungulates (e.g., great hornbills, gaur, and sambar deer) while effectively capturing the broader landscape matrix and edge effects that influence territorial primates and generalist mammals [37]. Based on the 2023 forest cover, deforestation, and administrative data [14], we used ArcGIS version 3.4.0 to calculate the percentage of each forest cover class characterizing each surveyed transect. The forest-cover and deforestation datasets were sourced from the Regional Land Cover Monitoring System (RLCMS) and GLAD laboratory databases and acquired as georeferenced raster datasets (GeoTIFF) with a spatial resolution of 30 m, while the administrative data were provided as vector shapefiles. The distances from each transect to the nearest village center and the nearest deforested areas were also computed using ArcGIS version 3.4.0 to represent proxies for anthropogenic pressure on wildlife distribution.
Based on the calculated percentage of forest cover classes characterizing each transect, we further categorized them into two main habitat types: forest habitat dominated by evergreen forest or highly intact forest (hereafter referred to as high-intact) habitat, which comprises ≥80% of evergreen forest, and forest habitat dominated by deciduous and evergreen forest or moderately intact forest (hereafter referred to as moderate-intact) habitat, which comprises <80% of evergreen forest. We used these thresholds because most of the global intact forest habitats comprise approximately 75% of evergreen forest [38]. This selecting criterion (80% threshold) is important to indicate landscape biodiversity hotspots or climate-sensitive regions in order to ensure the long-term sustainability of the study landscape, i.e., the PLWS. The two categories of forest habitats were classified to analyze their associations with wildlife diversity, species composition, and occurrences.

2.6. Data Analysis

2.6.1. Species Occurrence, Detection, and Diversity

For each transect, the total number of species (richness) and individuals (abundance), as well as the diversity index (Shannon index; a higher value indicates greater diversity), were computed. Species diversity was also assessed using Hill numbers, which estimate the effective number of species across different diversity orders (q). Diversity profiles were generated from q = 0 to q = 3, with higher q values giving greater weight to common species and lower weight to rare species. We calculated the encounter rate (per km) for every sighted animal in each square transect by taking the total number of sightings of each species and dividing it by the length of the walked transect, as described by Pramod et al. [39]. ArcMap 10.81 was then used to visualize the number of species and their abundance, which were recorded on a map to illustrate their occurrence patterns. To detect differences, species diversity metrics such as richness, abundance, and the Shannon diversity index (diversity H) were compared between the high- and moderate-intact forest habitats using an unpaired t-test, given that the two datasets had normal distributions and homogeneity of variance; otherwise, the alternative Mann–Whitney U test was used.

2.6.2. Influences of Habitat Characteristics and Anthropogenic Pressure

Our recorded data may appear suitable for occupancy modelling to estimate detection probability separately from occupancy. However, although transects were surveyed twice, both surveys were conducted within the same day and therefore could not be treated as independent detection occasions as required for occupancy modelling. Consequently, occupancy models were not applied to avoid violating key model assumptions. Instead, a conservative analytical approach was adopted, using logistic regression and complementary chi-square tests to evaluate species occurrence patterns.
Logistic regression analysis was employed to evaluate the influences of habitat characteristics (evergreen forest, cropland, dry dipterocarp forest, semi-evergreen forest, shrub, rice, other plantation, and grass) and anthropogenic pressure (distances from each transect to the nearest village center and the nearest deforested areas) on the presence or absence of detected wildlife species. The logistic regression model was used because it can estimate the probability of species occurrence at each site, revealing how different habitat characteristics and proximity to human activities and settlements influence the habitat suitability of wildlife species [40,41]. In this model, the presence/absence of wildlife species was fitted using the standardized predictor variables, which were measured on different scales (e.g., kilometers and hectares) [42]. To identify which predictors mainly influence wildlife occurrence, we performed a forward stepwise selection, starting from a null model (no predictor included) to the final model that selected the most important predictors from the full model (all predictors included). This process resulted in a parsimonious logistic regression model based on the lowest value of the Akaike Information Criterion (AIC), which included only the predictors that significantly contributed to explaining the variation in the presence/absence of a given wildlife species. The 95% and 85% confidence interval (CIs) were also computed for each logistic regression of the final model to identify whether the selected variables were highly or moderately informative [43]. Multicollinearity among the predictors was assessed using the Variance Inflation Factor (VIF), with all values falling within acceptable thresholds. Moreover, to analyze whether any of the key species is associated with a forest habitat, we used a chi-square test to identify a significant association between the presence–absence of each species and the two categorized forest habitat types (high- and moderate-intact habitats). For the analysis that yielded significant association results (p < 0.05), we sorted the frequencies of only the presence data of the species, then compared frequencies between the two forest habitat types, also using the chi-square test. This two-step chi-square analysis provides a sound and reliable result indicating which condition of the forest is the associated habitat of sighted animals, thereby informing conservation strategies in human-impacted landscapes.
To strengthen inference beyond simple spatial representation, we applied model-based analyses of observed counts using negative binomial generalized linear models (GLMs). This approach accounts for overdispersion in count data and allows for examination of relationships between relative abundance (observed counts) and ecological covariates (e.g., habitat characteristics and anthropogenic pressure) while avoiding violations of key model assumptions.
All statistical analyses were performed using the R statistical program (version 4.5.1) [44], and a p-value < 0.05 was considered significant for all analyses. Diversity indices and alpha Hill diversity profiles were calculated via the vegan package [45]. Logistic regression, t-tests, Mann–Whitney U tests, and chi-square tests were conducted using functions in the stats package (version 4.5.1) [44]. Forward stepwise model selection based on the AIC and negative binomial GLMs were modeled using the MASS package [46]. Multicollinearity was assessed using the car package [47], and all ecological figures were generated using ggplot2 (version 4.0.3) [48].

3. Results

3.1. Specires Occurrence Patterns and Diversity

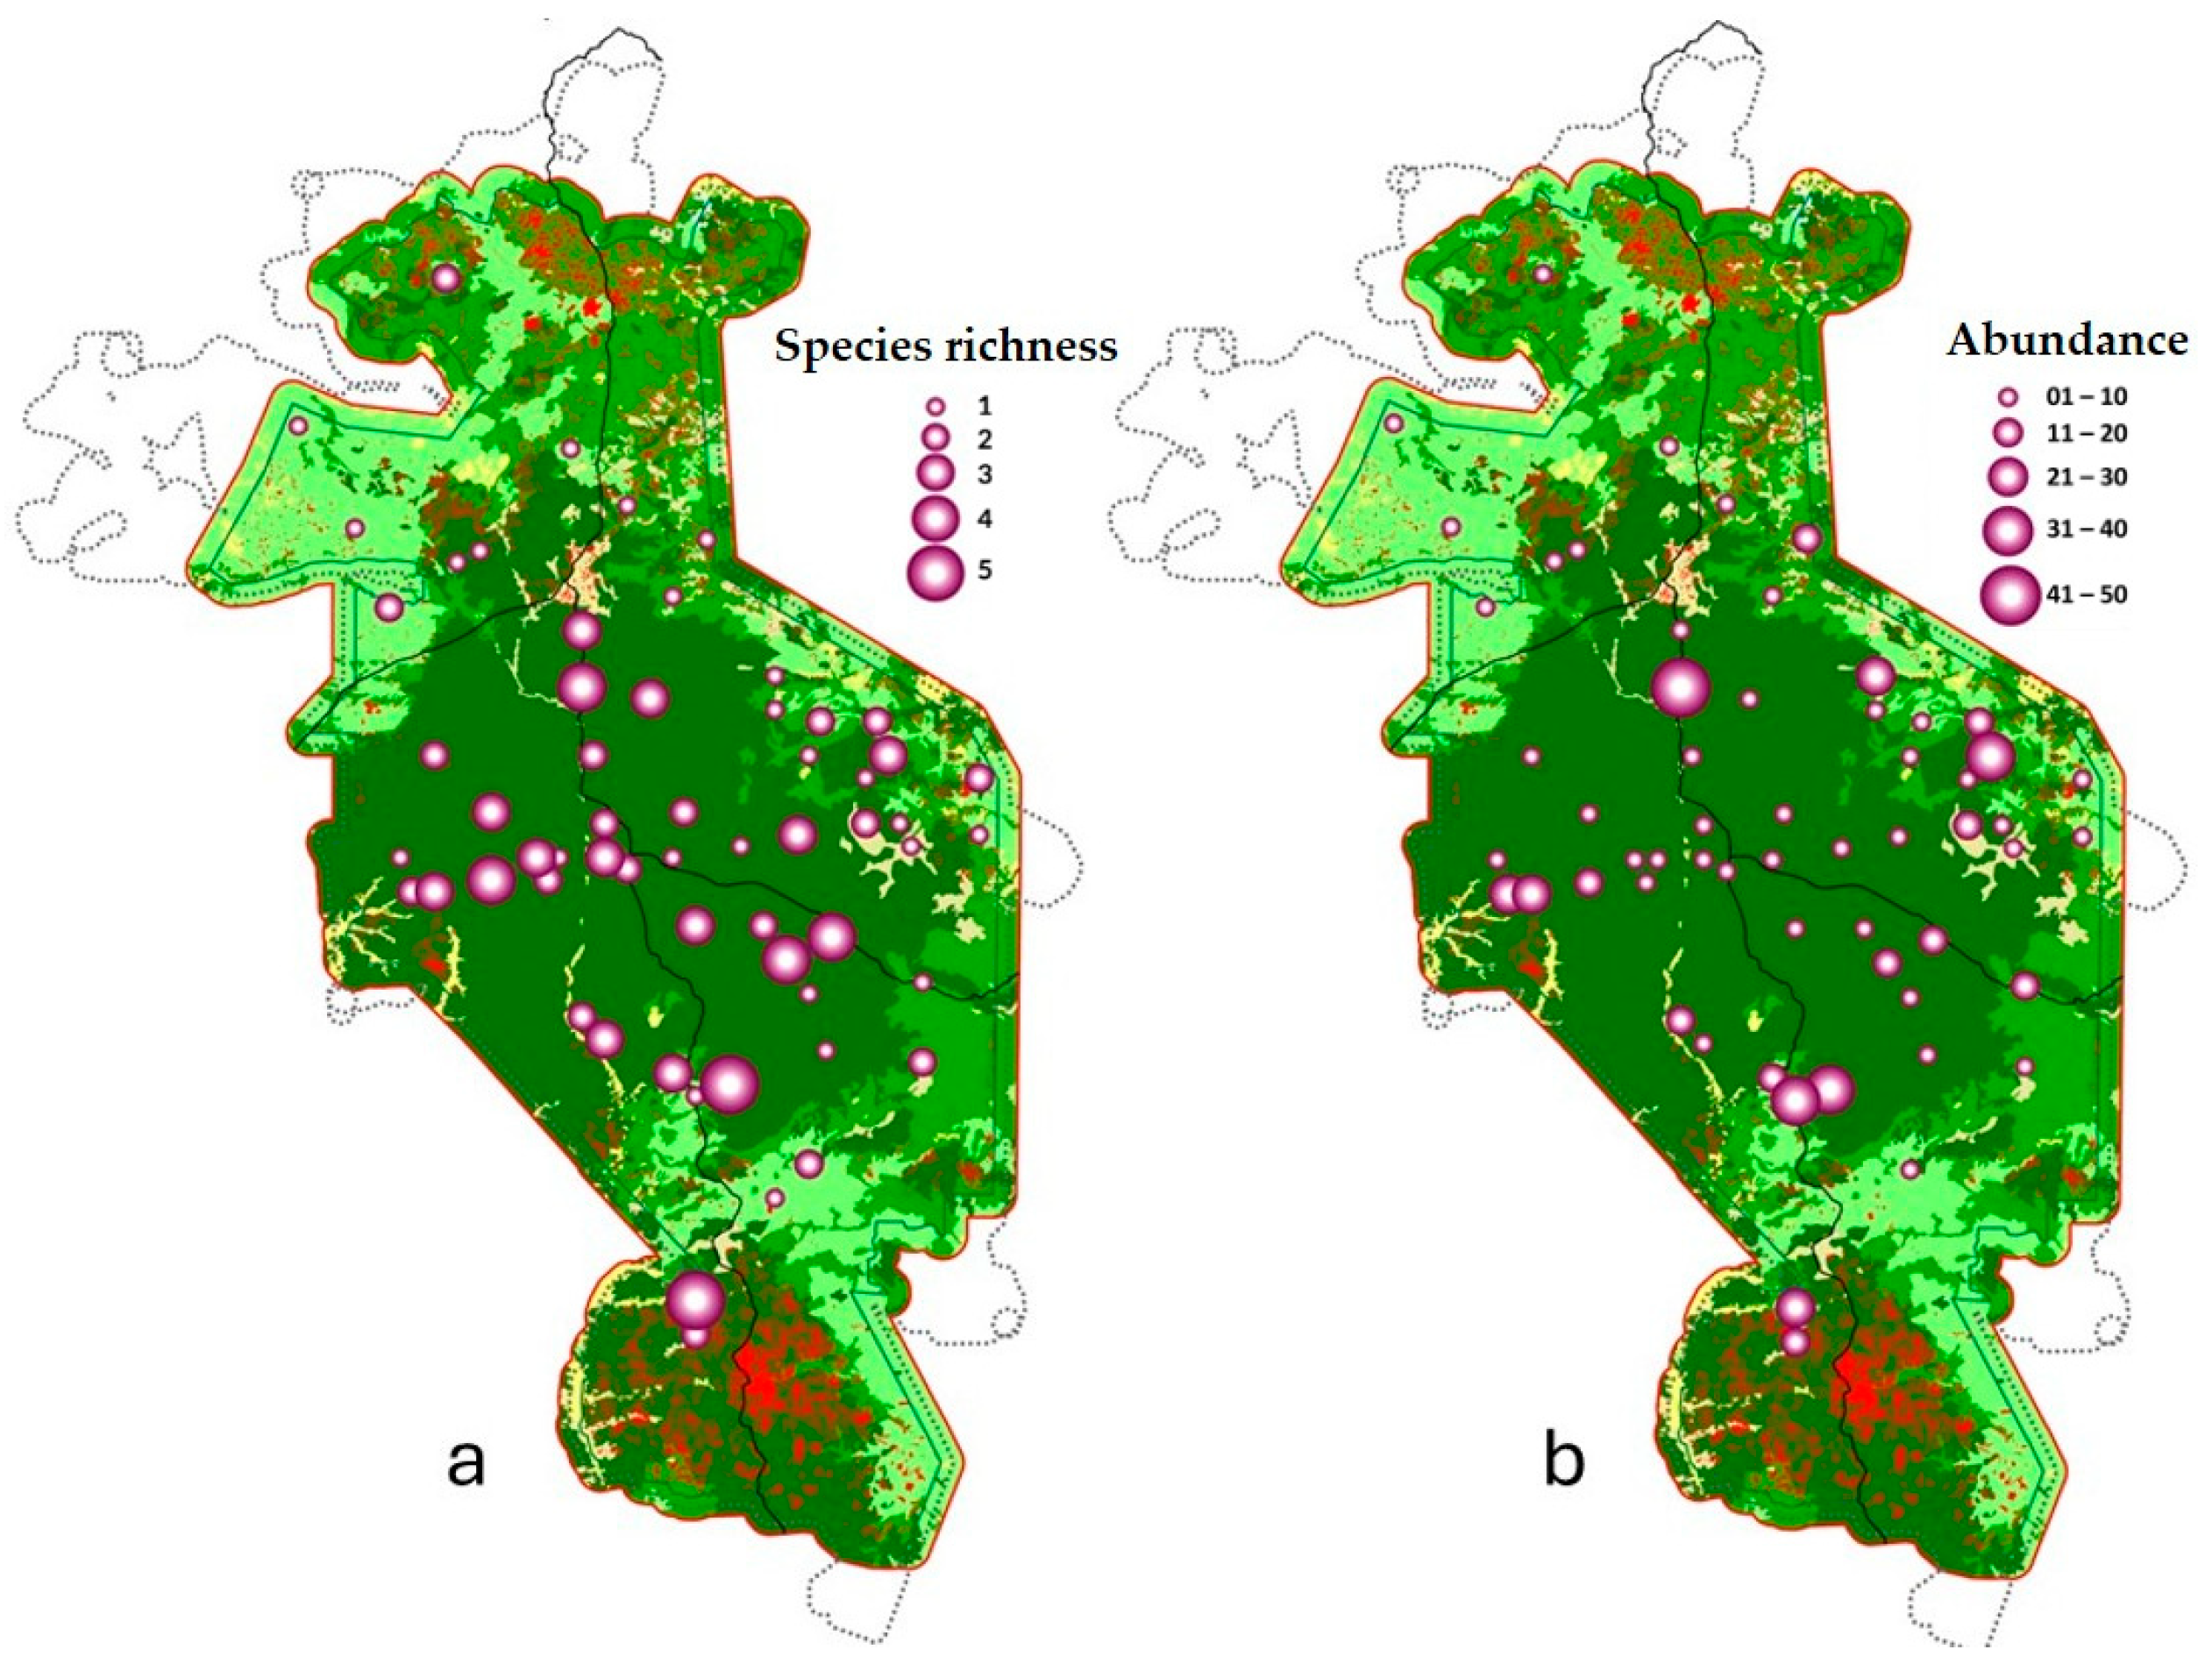
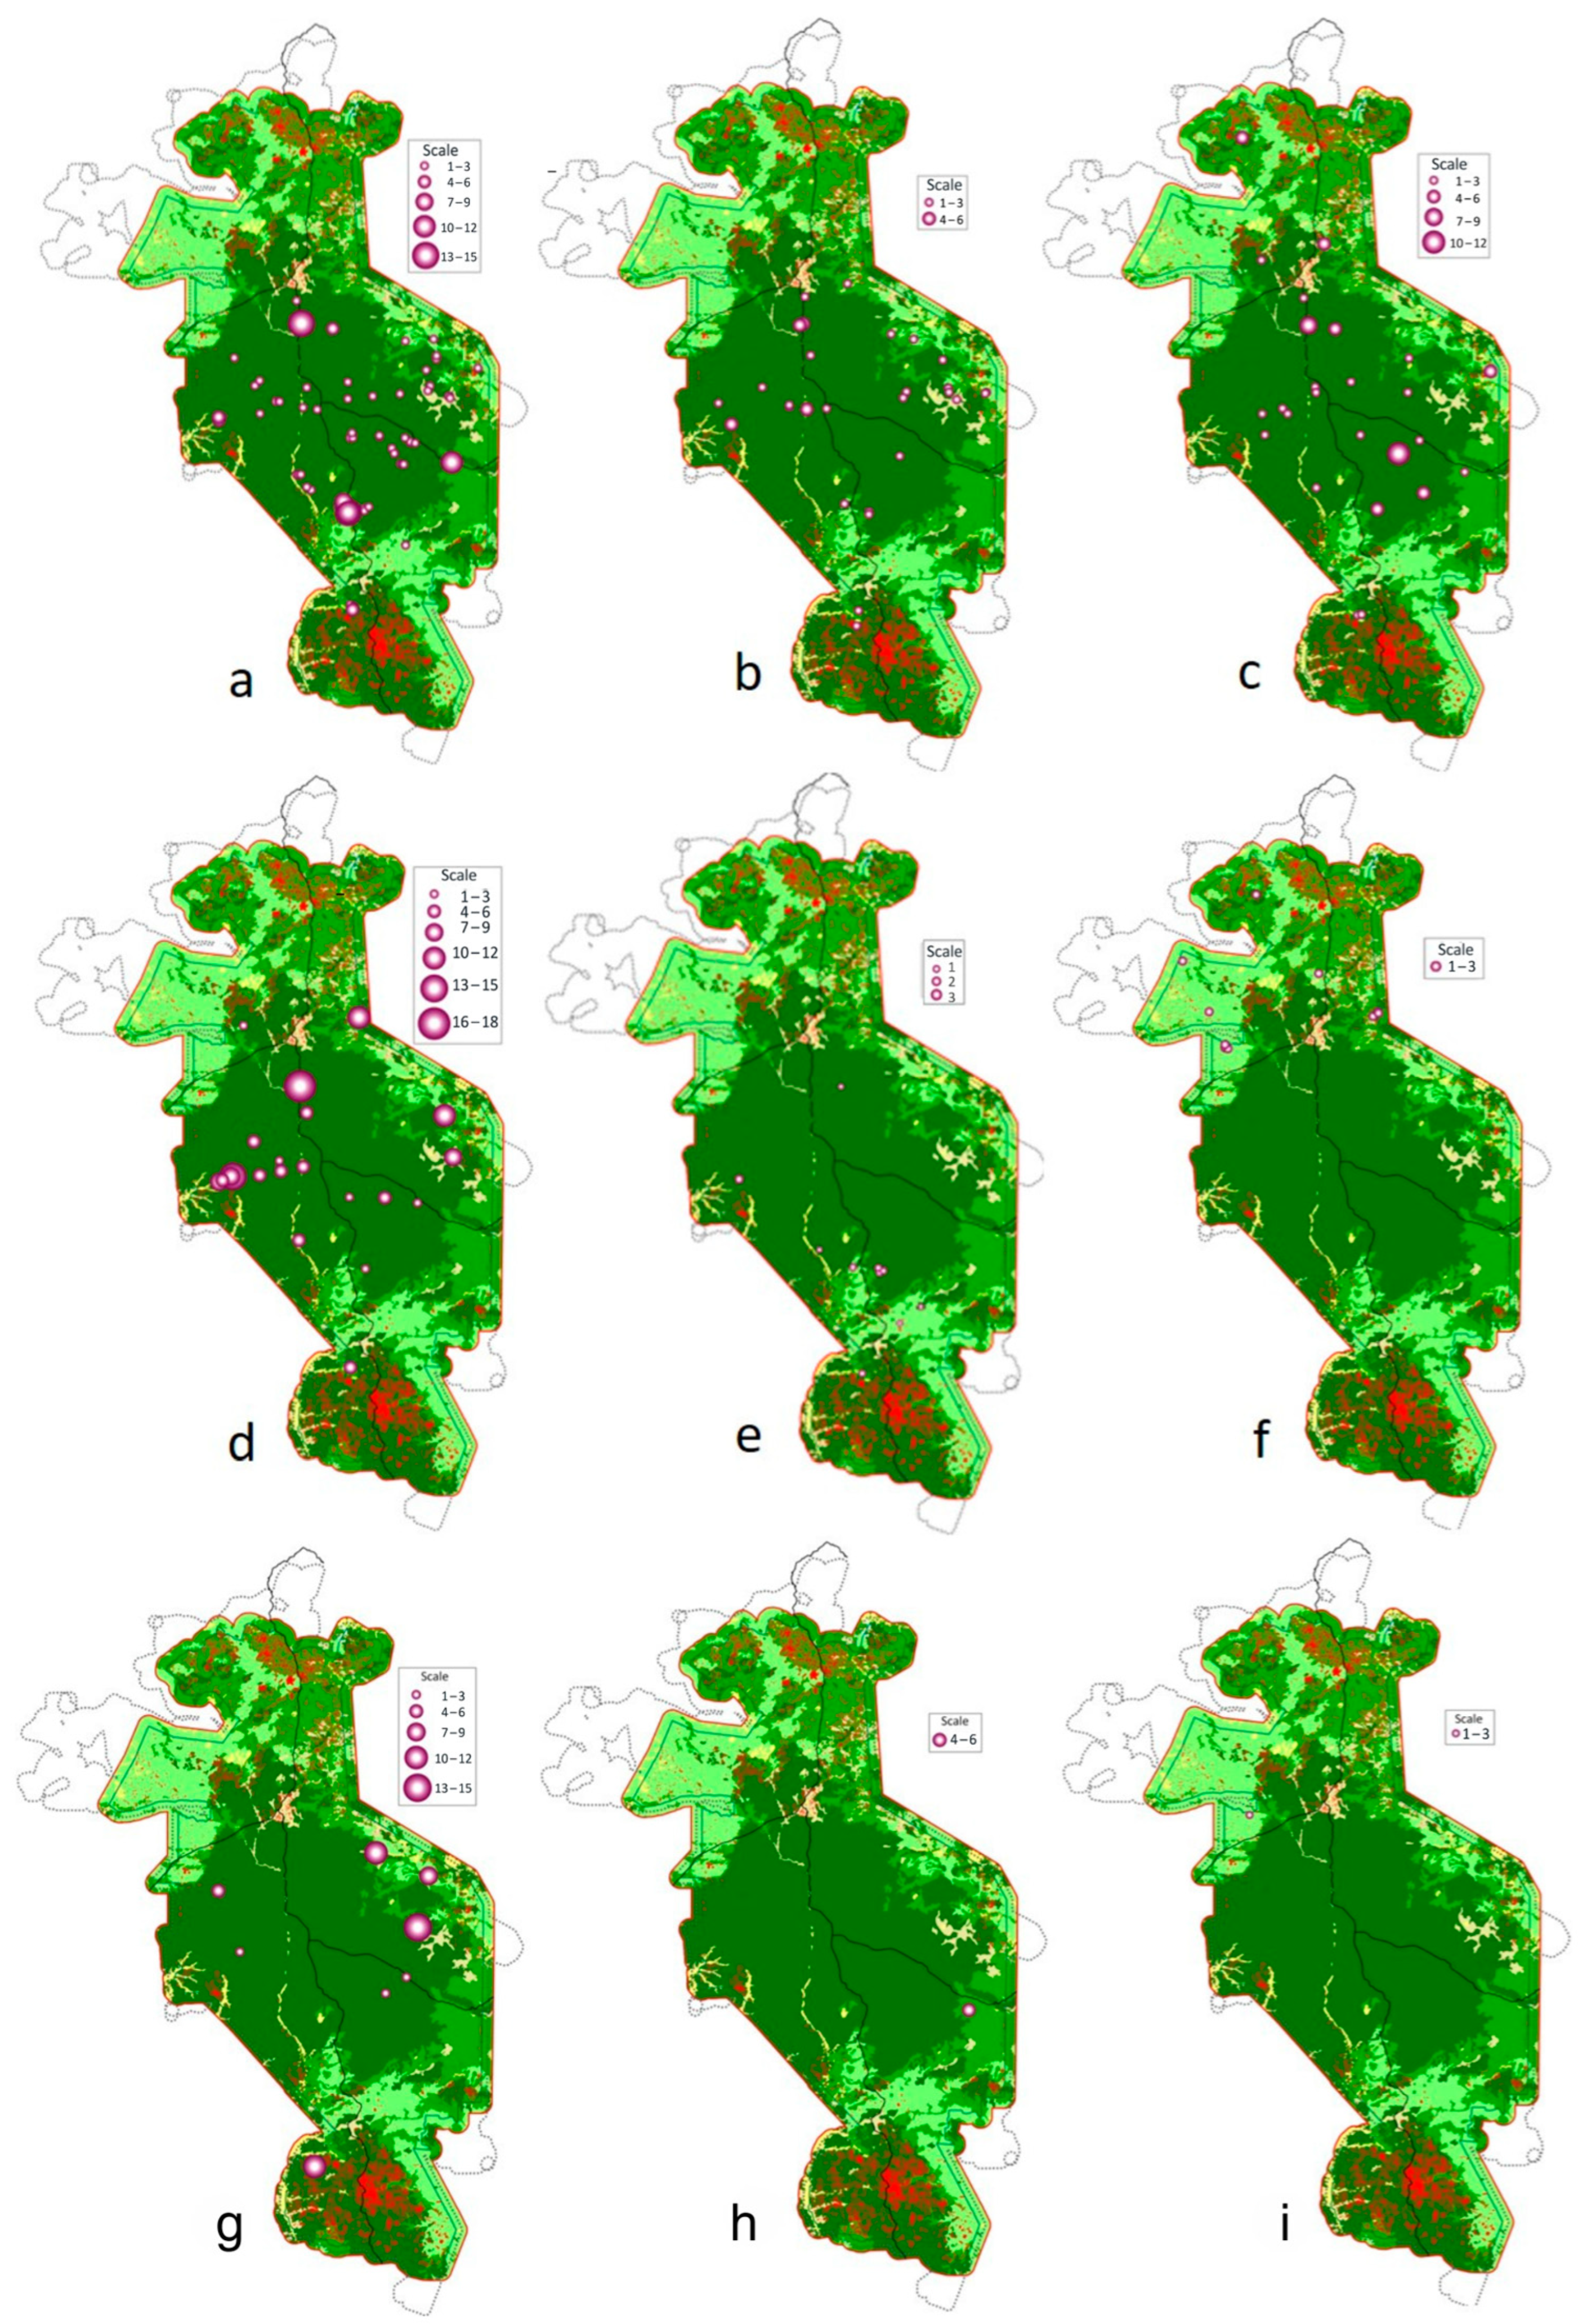
Out of the fifteen targeted species, we detected only nine during the entire course of the survey. Seven species were mammals, and the remaining two species were birds. The most detected animals were great hornbills (B. bicornis, 76 sightings), followed by pileated gibbons (H. pileatus, 31), wild pigs (S. scrofa, 25), and long-tailed macaques (M. fascicularis, 23), whereas the least detected species, with only one sighting, were gaur (B. gaurus) and sambar deer (R. unicolor) (Table 2). We did not observe a clear spatial pattern in species occurrence based on visual records across the sanctuary. However, species counts were notably lowest in the northern sections of the park (Figure 3a), while abundances were highest around the central area of the park (Figure 3b). This pattern was similarly observed for the four most detected species (Figure A1a–d). For the less and least detected species, however, the small number of detections prevented a clear spatial inference (Figure A1e–i).
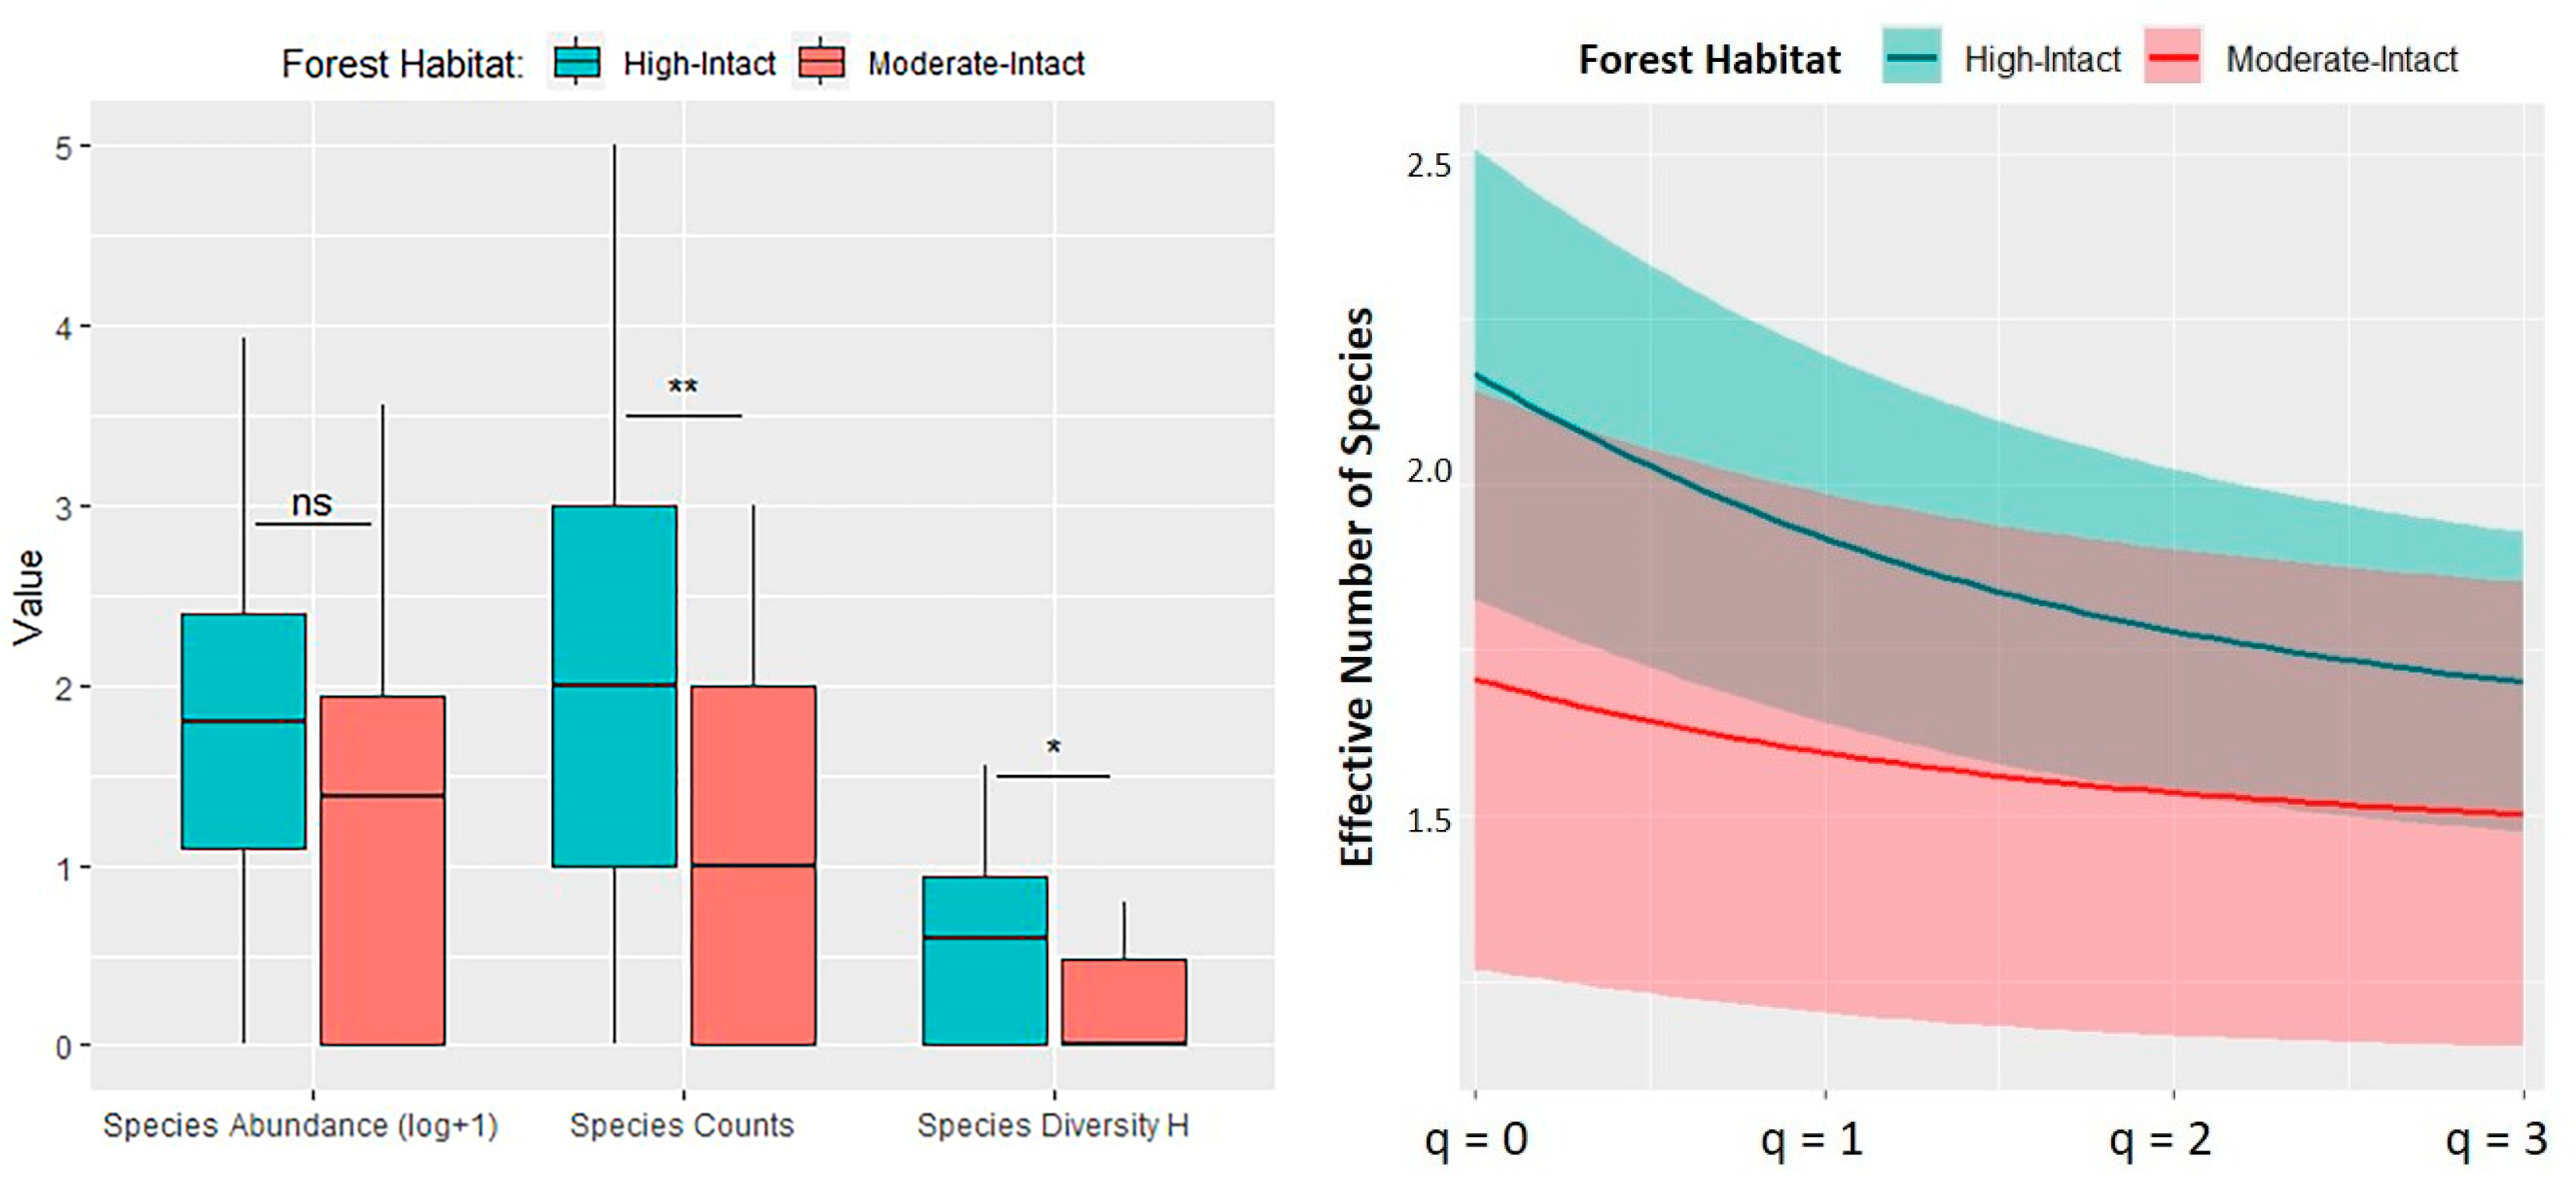
Overall, we detected an average of 1.6 ± 1.27 species, 7.6 ± 9.75 individuals, and 0.4 ± 0.46 of diversity H per transect. When computed based on each forest habitat type, the high-intact habitat supported an average of 1.9 ± 1.4 species, 8.5 ± 10.4 individuals, and 0.49 ± 0.49 of diversity H, while the moderate-intact habitat supported an average of 1.0 ± 0.89 species, 5.8 ± 8.3 individuals, and 0.21 ± 0.29 of diversity H per transect. Given that the data were not normally distributed, the Mann–Whitney U test was applied, and based on this test, species richness (p = 0.008) and species diversity H (p = 0.015) were found to be significantly higher in the high-intact habitat compared to the moderate-intact habitat (Figure 4, left). The alpha Hill diversity also showed that the high-intact habitat supports higher effective numbers of species than the moderate-intact habitat (Figure 4, right).

3.2. Habitat Associations and Anthropogenic Pressure

Based on the logistic regression model, the 95% confidence intervals (hereafter referred to as CIs) and the 85% CIs (hereafter referred to as CI85%), evergreen forest was selected as the most important variable, appearing in the final models for three species—the great hornbill, pileated gibbon, and northern red muntjac. It had a positive association with the occurrence of the great hornbill (β = 1.54, SE = 0.47, CI = (0.75, 2.62), p = 0.001) and pileated gibbon (β = 0.69, SE = 0.37, CI = (0.06, 1.55), p = 0.06) but a negative association with the northern red muntjac (β = −2.67, SE = 1.05, CI = (−5.79, −1.16), p = 0.01). Dry dipterocarp forest was selected as the key variable negatively influencing the occurrence of green peafowl (β = −798.56, SE = 807, CI = (−2931.78, −344.70), p = 0.32) and long-tailed macaque (β = −1.01, SE = 0.56, CI = (−2.47, −0.15), p = 0.07), while other plantations showed a positive association with the occurrence of the northern red muntjac (β = 5.23, SE = 2.85, CI = (0.85, 13.01), p = 0.07). For the long-tailed macaque, other plantations was a moderately informative variable (β = 0.46, SE = 0.41, CI = (−0.098, NA), CI85% = (0.04, 1.65), p = 0.27). Cropland, rice field, and the distance to the nearest village were important variables for only one species; cropland exhibited a positive association (β = 30.22, SE = 35.27, CI = (27.20, 152.38), p = 0.39) with green peafowl; and rice field and distance to the nearest village showed negative associations with Indochinese silvered langur (β = −506.7, SE = 89,825.2, CI = (−9133.34, NA), p = 0.99) and northern red muntjac (β = −3.6, SE = 2.05, CI = (−8.99, −0.57), p = 0.08). No predictors were retained as the key predictors in the final model for wild pig (Table 3). Full model outputs for each species are provided in the Supplementary Materials (Table S1).
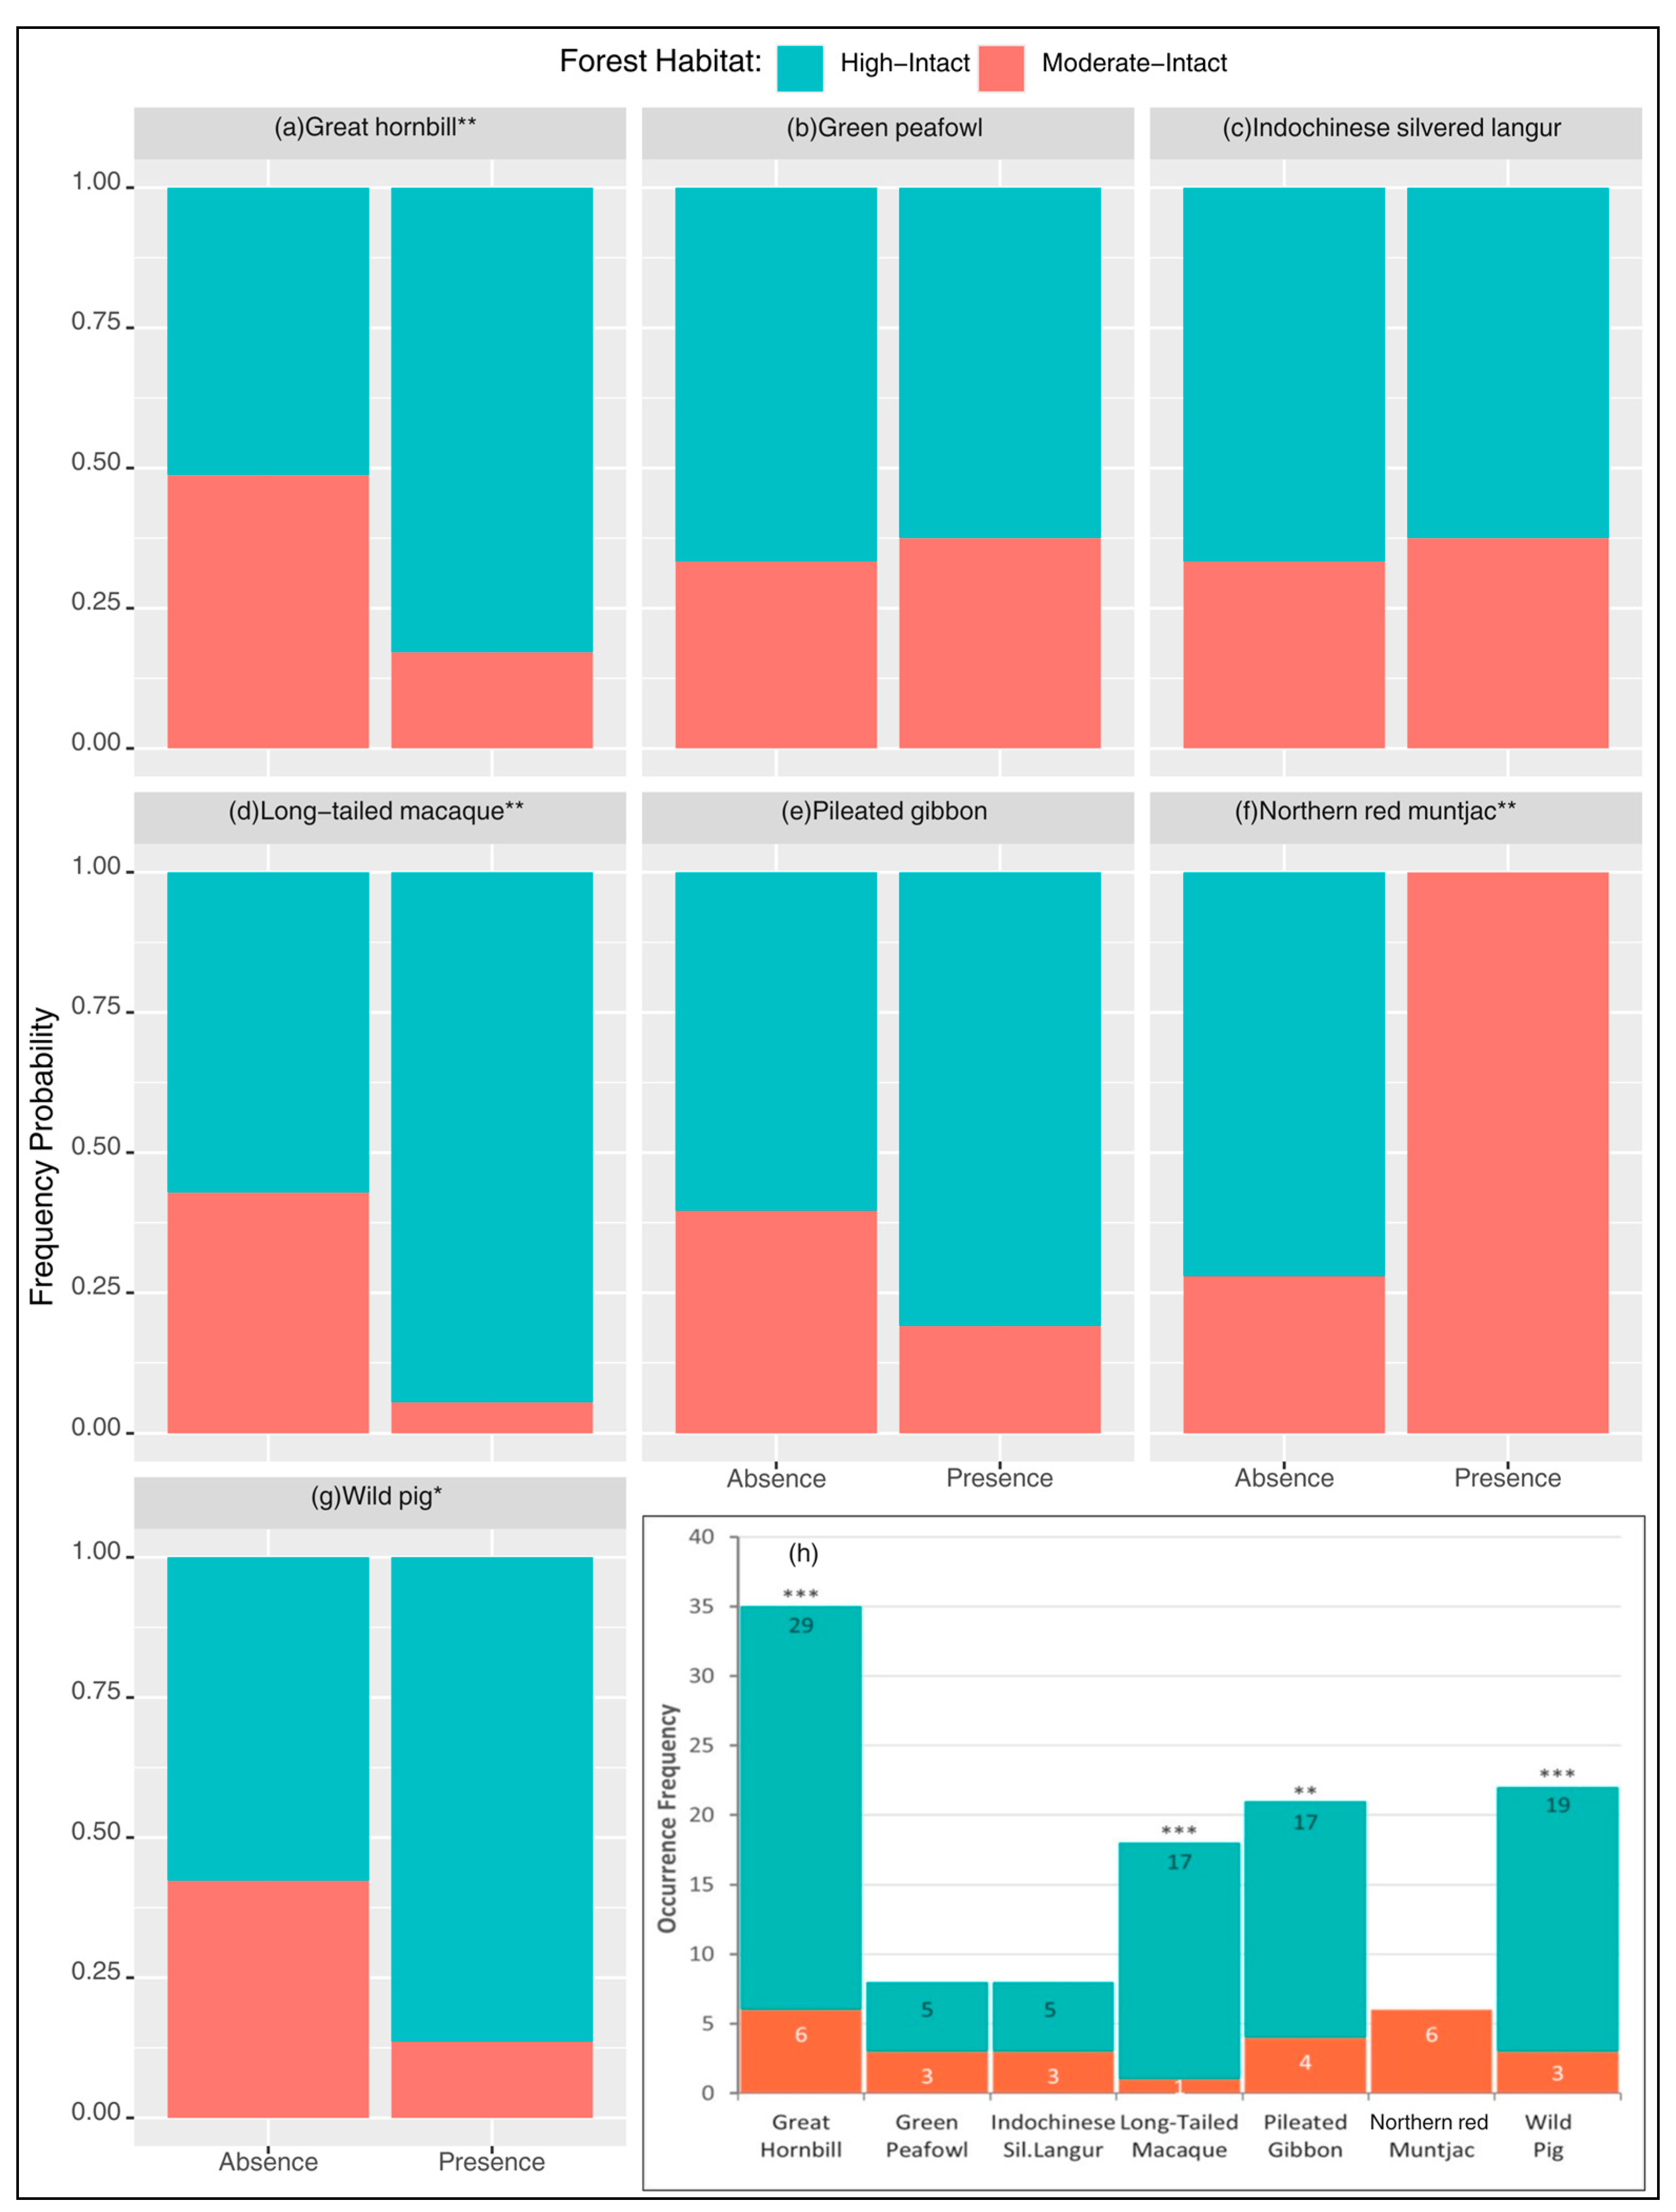
In the comparative analysis of species–habitat association, we found that the presence/absence of the great hornbill (Chi-squared = 6.87, p = 0.009), long-tailed macaque (Chi-squared = 6.89, p = 0.009), northern red muntjac (Chi-squared = 9.78, p = 0.002), and wild pig (Chi-squared = 4.47, p = 0.034) were significantly dependent on the conditions of the forest habitats (high- vs. moderate-intact habitats). The occurrence probability of the great hornbill, long-tailed macaque, and wild pig is strongly dependent on the high-intact forest habitat, whereas that of the northern red muntjac is entirely dependent on the moderate-intact habitat (Figure 5a–g).
Further analysis of the comparison of species presence data revealed a significantly high occurrence frequency of the great hornbill, long-tailed macaque, pileated gibbon, and wild pig in the high-intact forest habitats (Figure 5h).
With respect to the species abundance, the negative binomial GLM analyses showed that none of the examined covariates, including habitat characteristics and measures of anthropogenic pressure, had a statistically significant association with their abundance across the study area. Coefficient estimates suggested generally weak and inconsistent relationships (range: −8.25 to 0.06) between the predictors and observed data, with relatively large standard errors and low z-values.

4. Discussion

We detected nine species out of the 15 targeted species that are important for ecosystem functions, e.g., Indochinese silvered langur regulates forest growth and structures, and pileated gibbon distributes plant seeds across its habitat, while others play different important roles in their ecosystems, such as seed dispersal, plant and insect population control, vegetation modification, and forest regeneration (see Table 1).
Average species richness and abundance were significantly higher in high-intact forest habitats, suggesting these areas are associated with forest-dependent wildlife. This observation is consistent with the work of Gibson et al. [49], who emphasized the critical and irreplaceable role of high-intact forests in sustaining tropical biodiversity. Compared to moderate-intact forests, high-intact forests generally support greater biodiversity due to increased food availability, the presence of numerous microhabitats, and diverse tree compositions [50]. These forests also provide essential cover from predators and protection from environmental and anthropogenic disturbances [51]. Furthermore, they demonstrate greater resistance to short-term climatic anomalies such as droughts and wildfires and support high intraspecific genetic diversity, which enhances species’ adaptability to changing environmental conditions [52].
Analysis of habitat association and anthropogenic pressure reveals a clear ecological gradient among the detected species in relation to forest integrity. Highly specialized species like the great hornbill and pileated gibbon are strongly associated with high-intact forests, with CIs is greater than null, not overlapping with zero, underscoring the need for strict protection of evergreen forest ecosystems to ensure their survival [53,54]. The Indochinese silvered langur, also a specialized species, showed a negative association with rice fields, indicating its sensitivity to human-modified landscapes and highlighting the detrimental impacts of agricultural expansion. These findings align with global studies demonstrating the vulnerability of K-selected species, such as gibbons and langurs, and forest-dependent species (hornbills) to habitat loss and fragmentation [55,56]. However, microclimatic variables such as temperature and humidity were not included in the analyses, although they may influence wildlife activity and detection patterns.
On the other hand, species such as the northern red muntjac, long-tailed macaque, and wild pig exhibited broader habitat associations. These species were found either in the high- or moderate-intact forests or in human-modified landscapes including plantations, croplands, and areas near villages (Figure 5, Table 3), especially for the northern red muntjac and long-tailed macaque, as inferred by their CIs, which did not overlap zero [43]. Their presence in these environments suggests either a lower sensitivity to disturbance or an ability to exploit available resources. While this adaptability may indicate resilience, it could also reflect shifts in ecological roles or increased reliance on human-provided resources, potentially leading to human–wildlife conflicts. For instance, the northern red muntjac is capable of inhabiting a wide range of habitats, including various forest types and dense vegetation [25]. Long-tailed macaques selectively use human-modified habitats when food and cover are sufficient [57]. Wild pigs in croplands can cause significant agricultural damage, a common issue across Southeast Asia [58]. The green peafowl, with CI values not overlapping zero, showed a strong negative association with dry dipterocarp forest (DFF) and a positive association with cropland (CRL), suggesting a more nuanced habitat use. While pheasant species are typically associated with forests, this finding may indicate an association with transitional zones, forest edges, or mosaic landscapes that include agricultural elements [59,60].
Despite previous documentation (Table 1), several targeted species, including the Asian elephant, dhole, northern pig-tailed macaque, banteng, Malayan sun bear, and Asiatic black bear, were not detected during this survey. However, indirect evidence such as footprints, scratches, and dung confirmed their presence in the study area. Their non-detection from direct sightings likely reflects imperfect detection rather than true absence and may be attributed to behavioral factors (e.g., nocturnal vs. diurnal activity), habitat types, and sensitivity to human disturbance. These species are often elusive and difficult to detect through line-transect sampling, especially in dense vegetation. Elephants, for example, are known to be elusive and sensitive to human presence, particularly in areas with hunting pressure [61]. The dhole is considered one of the most obscure apex carnivores in Asia’s tropical forests [62]. Similarly, Malayan sun bears and Asiatic black bears exhibit elusive behaviors and are rarely observed directly, though they leave clear signs such as claw marks on trees [63].
This study, which employed transect surveys as a distance-sampling method, represents the second biodiversity monitoring campaign in the PLWS following the systematic camera-trap survey conducted in 2021, which reported the presence of 54 species [8]. In our study, we selected 15 key fauna species to monitor wildlife biodiversity distribution and assess the impact of the REDD+ program in the sanctuary. Most species sightings and individual detections were reported in high- intact forests. However, we were unable to estimate species density and populations across the entire sanctuary. Future research should aim to address this gap, particularly for species detected above the threshold (≥60–80 detections), such as the great hornbill, to better assess the impact of forest conversion under the REDD+ project [34].
This study relied on a single survey method using daytime line transects, which may not adequately detect the studied species in different areas and at different times, particularly those that are cryptic, nocturnal, or less responsive to visual surveys. Another limitation of this study is that the classification of high- and moderate-intact habitats was based solely on the proportion of evergreen forest and did not account for edge effects. Future studies should incorporate edge effects and other landscape characteristics (e.g., elevation and proximity to water sources) to provide a more comprehensive assessment of habitat integrity. The absence of complementary sampling techniques such as camera trapping or nocturnal surveys may have limited the detection probability for our studied taxa and could influence estimates of their occurrence and abundance.

5. Implication and Conclusions

As the PLWS has been considered as one of the last and largest areas of lowland tropical forests left in mainland Southeast Asia, protecting the forest as a habitat for wildlife biodiversity is crucial. There have been conservation efforts operated in this area, such as through law enforcement, community engagement, livelihood improvement, environmental safeguards, and biodiversity monitoring. Despite these significant protection efforts, ongoing threats continue to cause loss of wildlife biodiversity due to wildlife trade, agricultural expansion, and especially habitat loss [13]. In our survey, we encountered hunting, habitat fragmentation, agricultural land clearance, and illegal logging—in particular, along the edges in the northern and southern parts of the PLWS. These threats may affect the distribution and populations of the key wildlife species in the area. Implementing the REDD+ program is one of the crucial approaches to protecting habitats and wildlife biodiversity because it reduces deforestation and forest degradation. Protecting intact forests via REDD+ implementation means providing homes to a significant portion of the world’s terrestrial biodiversity and protecting key wildlife species in particular ecosystems [64]. One notable example of REDD+ conserving wildlife species is the Orangutan Conservation Project in Indonesia [65,66], which focuses on protecting the habitat of the critically endangered orangutans in the forests of Borneo and Sumatra by preventing deforestation and promoting sustainable forest management.
The findings of our study, although synthesized from a single daytime transect method, support the positive impact of REDD+ on wildlife conservation. We found a higher number of species with greater abundances in the high-intact forest habitats of the REDD+ project in the PLWS. This strategy serves as one of the sustainable conservation approaches for Cambodian wildlife biodiversity. Without significant enhancements in conservation management, key species in the PLWS, like the endangered pileated gibbon, Indochinese silvered langur, banteng, etc., may follow the fate of the kouprey (now considered almost certainly globally extinct), tiger, and wild water buffalo, (likely extirpated from Cambodia), leading to local extirpation from the sanctuary [67]. The ecological ramifications of such a loss are profound because the absence of such species not only disrupts the ecological equilibrium but also adversely affects the indigenous communities whose subsistence and genetic resources are inextricably linked to these forest resources. Therefore, effective and adaptive management of the sanctuary should be put in place by incorporating wildlife monitoring, conservation planning, and sustainable carbon financing (e.g., via REDD+). The suggestion from our study is that conservation efforts need to prioritize strict protection against deforestation, illegal logging, hunting, and habitat disturbance, as well as restoration of core forest areas for species highly dependent on intact forests (e.g., the great hornbill, pileated gibbon, and silver langur). For more adaptable species, management strategies might focus on mitigating human–wildlife conflict and promoting coexistence in mosaic landscapes while still ensuring the ecological integrity of the habitats. Effective conservation efforts and adaptive management of the sanctuary (both the high- and moderate-intact forests, as well as edge/mosaic areas) will enhance biodiversity and maintain the system’s integrity, functions, and services (e.g., climate regulation, water and air purification, nutrient cycling, carbon sequestration, and erosion and flood control) [68] and consequently contribute to human–nature harmonization, employment, and the socioeconomics of the people sharing this important protected area, the Prey Lang Wildlife Sanctuary.

Supplementary Materials

The following supporting information can be downloaded at: https://www.mdpi.com/article/10.3390/biosphere2030007/s1, Table S1: Full logistic regression results for habitat and anthropogenic predictors across species.

Author Contributions

Conceptualization, R.S.; methodology, K.K.; formal analysis, K.K. and R.S.; investigation, K.K., V.C. and S.S.; data curation, K.K., R.S., V.C. and N.H.; writing—original draft preparation, K.K. and R.S.; writing—review and editing, K.K., R.S., J.F. and N.H.; visualization, K.K. and R.S.; project administration, K.K., V.C., S.S. and N.H.; funding acquisition, S.S., J.F. and N.H.; research design, J.F. and N.H. All authors have read and agreed to the published version of the manuscript.

Funding

This research was funded by the United States Agency for International Development (USAID) Cambodia under the Greening Prey Lang (GPL) initiative (Award Number: 72044218C00001); Mitsui & Co., Ltd.; and Conservation International Cambodia (CI Cambodia).

Institutional Review Board Statement

Ethical review and approval were waived for this study because it involved non-invasive observational fieldwork using distance sampling (line-transect methods), which caused minimal disturbance to wildlife. The study was conducted with permission from the Cambodian Ministry of Environment.

Data Availability Statement

The raw data supporting the conclusions of this article will be made available by the authors on request.

Acknowledgments

We extend our deepest gratitude to the individuals and organizations whose invaluable contributions made this line transect survey possible. This research was made possible through the support of USAID/Cambodia under the Greening Prey Lang (GPL) initiative; Mitsui & Co., Ltd.; the Royal Government of Cambodia’s Ministry of Environment (MoE); and the Provincial Ministries of Environment (PDoE) involved in the PLWS. We also gratefully acknowledge the support and guidance of Nathan Conaboy, Cambodia Conservation lead at CI Cambodia. Our sincere thanks go to the Conservation Technology team (Socheat Kong and Samnang Hean) for their exceptional work in creating the maps featured in this paper. We particularly appreciate the dynamic participation of all individuals who dedicated numerous days to fieldwork in the forest. Google Gemini (Gemini 1.5 Pro, Google LLC) was used to refine texts and improve the clarity and flow of ideas throughout the manuscript and assist in creating parts of the graphical abstract; all content was reviewed and approved by the authors.

Conflicts of Interest

The authors declare that this study received funding from the United States Agency for International Development (USAID) Cambodia under the Greening Prey Lang (GPL) initiative; Mitsui & Co., Ltd.; and Conservation International Cambodia (CI Cambodia). The funder was not involved in the study design, collection, analysis, interpretation of data, the writing of this article or the decision to submit it for publication. The authors declare that there are no financial conflicts of interest or personal relationships that could have influenced this work.

Abbreviations

The following abbreviations are used in this manuscript:
AICAkaike Information Criterion
CIConservation International
CIsConfidence Intervals
CRLCropland
DDFDry Dipterocarp Forest
DNVDistance to Nearest Village
EVEEvergreen Forest
GLMsGeneralized Linear Models
GPSGlobal Positioning System
MoEMinistry of Environment
OTPOther Plantations
PDPerpendicular Distance
PLWSPrey Lang Wildlife Sanctuary
PDoEProvincial Ministries of Environment
RIFRice Field
USAIDUnited States Agency for International Development
VIFVariance Inflation Factor

Appendix A

Figure A1. Patterns of abundance recorded for each species: (a) great hornbill, (b) pileated gibbon, (c) wild pig, and (d) long-tailed macaque, (e) green peafowl, (f) northern red muntjac, (g) Indochinese silvered langur, (h) gaur, and (i) sambar deer.
Biosphere 02 00007 g0a1

References

  1. Dirzo, R.; Young, H.S.; Galetti, M.; Ceballos, G.; Isaac, N.J.B.; Collen, B. Defaunation in the Anthropocene. Science 2014, 345, 401–406. [Google Scholar] [CrossRef] [PubMed]
  2. Yarrow, G. Habitat Requirements of Wildlife: Food, Water, Cover and Space. 2009. Available online: https://www.academia.edu/121106097/Habitat_Requirements_of_Wildlife_Food_Water_Cover_and_Space (accessed on 1 April 2026).
  3. Leimgruber, P.; Gagnon, J.B.; Wemmer, C.; Kelly, D.S.; Songer, M.A.; Selig, E.R. Fragmentation of Asia’s remaining wildlands: Implications for Asian elephant conservation. Anim. Conserv. 2003, 6, 347–359. [Google Scholar] [CrossRef]
  4. Duckworth, J.W.; Steinmetz, R.; Timmins, R.J.; Pattanavibool, A.; Than Zaw, D.T.; Hedges, S. Bos gaurus. The IUCN Red List of Threatened Species. 2008. Available online: https://www.iucnredlist.org/species/2891/9491805 (accessed on 1 April 2026).
  5. Datta, A.; Rawat, G.S. Nest-site selection and nesting success of three hornbill species in Arunachal Pradesh, north-east India: Great Hornbill Buceros bicornis, Wreathed Hornbill Aceros undulatus and Oriental Pied Hornbill Anthracoceros albirostris. Bird Conserv. Int. 2004, 14, S39–S52. [Google Scholar] [CrossRef]
  6. Pin, C.; Ngoprasert, D.; Gray, T.N.; Savini, T.; Crouthers, R.; Gale, G.A. Utilization of waterholes by globally threatened species in deciduous dipterocarp forest of the Eastern Plains Landscape of Cambodia. Oryx 2018, 54, 572–582. [Google Scholar] [CrossRef]
  7. Theilade, I.; Phourin, C.; Schmidt, L.; Meilby, H.; van de Bult, M.; Friborg, K.G. Evergreen forest types of the central plains in Cambodia: Floristic composition and ecological characteristics. Nord. J. Bot. 2022, 2022, e03494. [Google Scholar] [CrossRef]
  8. Auda, E. Prey Lang Extended Landscape Camera Trap Survey; USAID Greening Prey Lang: Phnom Penh, Cambodia, 2023. [Google Scholar]
  9. Olsson, A.; Emmett, D.E. A Floral and Faunal Biodiversity Assessment of Prey Long; Conservation International, Forest & Landscape, University of Copenhagen, and Forestry Administration: Phnom Penh, Cambodia, 2007; Available online: https://preylang.net/wp-content/uploads/Other%20reports/PL-Floral-and-Faunal-Biodiversity-Assessment.pdf (accessed on 1 April 2026).
  10. Gray, T.N.E.; Ou, R.; Huy, K.; Pin, C.; Maxwell, A.L. The status of large mammals in eastern Cambodia: A review of camera trapping data 1999–2007. Cambodian J. Nat. Hist. 2012, 1, 42–55. [Google Scholar]
  11. Gray, T.N.; Chamnan, H.; Borey, R.; Collar, N.J.; Dolman, P.M. Habitat preferences of a globally threatened bustard provide support for community-based conservation in Cambodia. Biol. Conserv. 2007, 138, 341–350. [Google Scholar] [CrossRef]
  12. Gray, T.N.E.; Phan, C. Habitat preferences and activity patterns of the larger mammal community in Phnom Prich Wildlife Sanctuary, Cambodia. Raffles Bull. Zool. 2011, 59, 311–318. [Google Scholar]
  13. Theilade, I.; Schmidt, L. REDD+ and Conservation of Prey Long Forest, Cambodia. Summary of Scientific Findings 2007–2010. Forest & Landscape Working Papers No. 66. 2011. Available online: https://lib.ncdd.gov.kh/storage/app/public/library_backend/CAT_18287_1/2011-REDD-PreyLang-conservation-en.pdf (accessed on 20 July 2026).
  14. SERVIR-Mekong. Biophysical M&E Dashboard Map Viewer. 2025. Available online: https://cambodia-me-servir.adpc.net/mapviewer (accessed on 1 April 2026).
  15. Traeholt, C.; Bunthoen, R.; Rawson, B.; Samuth, M.; Vrak, C.; Vuthin, S. Status Review of Pileated Gibbon, Hylobates Pileatus and Yellow-Cheeked Crested Gibbon, Nomascus Gabriellae, in Cambodia; Fauna & Flora International: Phnom Penh, Cambodia, 2005. [Google Scholar]
  16. Srivathsa, A.; Karanth, K.K.; Jathanna, D.; Kumar, N.S.; Karanth, K.U. On a Dhole Trail: Examining Ecological and Anthropogenic Correlates of Dhole Habitat Occupancy in the Western Ghats of India. PLoS ONE 2014, 9, e98803. [Google Scholar] [CrossRef] [PubMed]
  17. Ruikar, S.; Suryavanshi, N.; Nanaware, J.; Balasundaram, H.; Patil, D.; Pathade, G. The Role of Wildlife in Eco-system Health: Interactions and Impacts. REDVET Rev. Electrón. Vet. 2024, 25, 275–295. [Google Scholar]
  18. Ong, L.; Tan, W.H.; Davenport, L.C.; McConkey, K.R.; Amin, M.K.A.b.M.; Campos-Arceiz, A.; Terborgh, J.W. Asian elephants as ecological filters in Sundaic forests. Front. For. Glob. Chang. 2023, 6, 1143633. [Google Scholar] [CrossRef]
  19. Hayes, B.; Khou, E.H.; Thy, N.; Furey, N.; Sophea, C.; Holden, J.; Seiha, H.; Sarith, P.; Pengly, L.; Simpson, V. Biodiversity Assessment of Prey Lang–Kratie, Kampong Thom, Stung Treng and Preah Vihear Provinces; Conservation International, Winrock International, USAID: Phnom Penh, Cambodia, 2015. [Google Scholar]
  20. Chaichanathong, S.; Klinsawat, W.; Sukmak, M.; Sakulthai, A.; Wajjwalku, W.; Sripiboon, S.; Kaolim, N.; Nakbhun, S.; Tunpradit, B.; Nipanunt, T.; et al. Genetic characterization of banteng (Bos javanicus) populations in Thailand for conservation. Thai J. Vet. Med. 2021, 51, 647–654. [Google Scholar] [CrossRef]
  21. Prayoon, U.; Suksavate, W.; Chaiyes, A.; Winitpornsawan, S.; Tunhikorn, S.; Angkaew, C.; Wanna, N.; Sriracha, S.; Pattanakiat, S.; Pattanavibool, A.; et al. Importance of protected areas in conservation and recovery of gaur (Bos gaurus) in Thailand. BULLetin 2022, 7, 25–33. [Google Scholar]
  22. Quin, M.J.; Morgan, J.W.; Murphy, N.P. Assessing the diet and seed dispersal ability of non-native sambar deer (Rusa unicolor) in native ecosystems of south-eastern Australia. Ecol. Evol. 2023, 13, e10711. [Google Scholar] [CrossRef] [PubMed]
  23. Gazagne, E.; Pitance, J.-L.; Savini, T.; Huynen, M.-C.; Poncin, P.; Brotcorne, F.; Hambuckers, A. Seed Shadows of Northern Pigtailed Macaques within a Degraded Forest Fragment, Thailand. Forests 2020, 11, 1184. [Google Scholar] [CrossRef]
  24. Hoang, M.D.; Van, B.T.; Le, T.H.; Covert, H.H. Diet of Indochinese Silvered Langur (Trachypithecus germaini) in Kien Luong Karst Area, Vienam. 2017. Available online: https://www.researchgate.net/publication/282652802 (accessed on 1 April 2026).
  25. Bernathirdin, A.N.H.; Wijayanto, H.; Kusindarta, D.L.; Budipitojo, T. Population Estimation and Identification of Long-Tailed Macaque (Macaca fascicularis) Group at Tlogo Muncar Tourism Area, Mount Merapi National Park, After Two Years Closure Caused by the COVID-19 Pandemic. In IoP Conference Series: Earth and Environmental Science; IoP Publishing: Bristol, UK, 2023. [Google Scholar] [CrossRef]
  26. Sharma, C.M.; Bhattacharjee, S.; Sharief, A.; Joshi, B.D.; Thakur, M.; Sharma, L.K. A tapestry of habitats: Exploring abundance and habitat preferences of the Northern Red Muntjac (Muntiacus vaginalis) across the Central Himalayan landscape. Mammalia 2024, 88, 280–291. [Google Scholar] [CrossRef]
  27. Cuevas, M.F.; Ojeda, R.A.; Jaksic, F.M. Ecological strategies and impact of wild boar in phytogeographic provinces of Argentina with emphasis on aridlands. Mastozool Neotrop. 2016, 23, 239–254. [Google Scholar]
  28. Liang, H.; McConkey, K.R.; Lim, J.Y. From beak to fruit: An Asian hornbill database for frugivory and seed dispersal research. Glob. Ecol. Conserv. 2024, 51, e02879. [Google Scholar] [CrossRef]
  29. Hernowo, J.B.; Mardiastuti, A.; Alikodra, H.S.; Kusmana, C. Behavior Ecology of the Javan Green Peafowl (Pavo muticus muticus Linnaeus 1758) in Baluran and Alas Purwo National Park, East Java. HAYATI J. Biosci. 2011, 18, 164–176. [Google Scholar] [CrossRef]
  30. Scotson, L.; Fredriksson, G.; Augeri, D.; Cheah, C.; Ngoprasert, D.; Wai-Ming, W. IUCN Sun bear Helarctos malayaus Red List Assessment 2016. 2017. Available online: https://www.researchgate.net/publication/321682540 (accessed on 1 April 2026).
  31. Steinmetz, R.; Garshelis, D.L.; Chutipong, W.; Seuaturien, N. Foraging ecology and coexistence of Asiatic black bears and sun bears in a seasonal tropical forest in Southeast Asia. J. Mammal. 2013, 94, 1–18. [Google Scholar] [CrossRef]
  32. Griffin, O.; Nuttall, M. Status of Key Species in Keo Seima Wildlife Sanctuary 2010–2020. 2020. Available online: https://library.wcs.org/Scientific-Research/Research-Publications/Publications-Library/ctl/view/mid/40093/pubid/DMX3851100000.aspx (accessed on 1 April 2026). [CrossRef]
  33. Nuñez-Penichet, C.; Cobos, M.E.; Soberón, J.; Gueta, T.; Barve, N.; Barve, V.; Navarro-Sigüenza, A.G.; Peterson, A.T. Selection of sampling sites for biodiversity inventory: Effects of environmental and geographical considerations. Methods Ecol. Evol. 2022, 13, 1595–1607. [Google Scholar] [CrossRef]
  34. Buckland, S.T.; Rexstad, E.A.; Marques, T.A.; Oedekoven, C.S. Methods in Statistical Ecology Distance Sampling: Methods and Applications. 2015. Available online: http://www.springer.com/series/10235 (accessed on 1 April 2026).
  35. Pavlacky, D.C.; Green, A.W.; George, T.L.; Iovanna, R.; Bartuszevige, A.M.; Correll, M.D.; Panjabi, A.O.; Ryder, T.B. Landscape-scale conservation mitigates the biodiversity loss of grassland birds. Ecol. Appl. 2022, 32, e2548. [Google Scholar] [CrossRef] [PubMed]
  36. Miguet, P.; Jackson, H.B.; Jackson, N.D.; Martin, A.E.; Fahrig, L. What determines the spatial extent of landscape effects on species? Landsc. Ecol. 2015, 31, 1177–1194. [Google Scholar] [CrossRef]
  37. Leite, M.d.S.; Boesing, A.L.; Metzger, J.P.; Prado, P.I. Matrix quality determines the strength of habitat loss filtering on bird communities at the landscape scale. J. Appl. Ecol. 2022, 59, 2790–2802. [Google Scholar] [CrossRef]
  38. Mittermeier, R.A.; Mittermeier, C.G.; Brooks, T.M.; Pilgrim, J.D.; Konstant, W.R.; Da Fonseca, G.A.B.; Kormos, C. Wilderness and Biodiversity Conservation. 2003. Available online: https://www.pnas.org/doi/abs/10.1073/pnas.1732458100 (accessed on 1 April 2026).
  39. Pramod, A.F.; Kumara, V.; Raghavendra Gowda, H.T. Encounter rate of large mammals in Thanigebyle range of Bhadra wildlife sanctuary, Karnataka. Int. Multidiscip. Res. J. 2012, 2, 9–11. [Google Scholar]
  40. Harrel, F.E., Jr. Regression Modeling Strategies: With Applications to Linear Models, Logistic and Ordinal Regression, and Survival Analysis, 2nd ed.; Springer: Berlin/Heidelberg, Germany, 2015; Available online: https://link.springer.com/book/10.1007/978-3-319-19425-7 (accessed on 1 April 2026). [CrossRef]
  41. Sor, R.; Park, Y.-S.; Boets, P.; Goethals, P.L.; Lek, S. Effects of species prevalence on the performance of predictive models. Ecol. Model. 2017, 354, 11–19. [Google Scholar] [CrossRef]
  42. Zuur, A.F.; Ieno, E.N.; Walker, N.; Saveliev, A.A.; Smith, G.M. Mixed Effects Models and Extensions in Ecology with R, 1st ed.; Springer: New York, NY, USA, 2009; Volume 574, ISBN 9780387874586. [Google Scholar]
  43. Arnold, T.W. Uninformative parameters and model selection using Akaike’s Information Criterion. J. Wildl. Manag. 2010, 74, 1175–1178. [Google Scholar] [CrossRef]
  44. R Core Team. R: A Language and Environment for Statistical Computing; R Foundation for Statistical Computing: Vienna, Austria, 2021. [Google Scholar]
  45. Oksanen, J.; Simpson, G.L.; Blanchet, F.G.; Kindt, R.; Legendre, P.; Minchin, P.R.; O’Hara, R.B.; Solymos, P.; Stevens, M.H.H.; Szoecs, E.; et al. Vegan: Community Ecology Package. 2025. Available online: https://CRAN.R-project.org/package=vegan (accessed on 18 September 2025).
  46. Venables, W.N.; Ripley, B.D. Modern Applied Statistics with S; Springer: Cham, Switzerland, 2013. [Google Scholar]
  47. Fox, J.; Weisberg, S. An R Companion to Applied Regression; SAGE: Thousand Oaks, CA, USA, 2018. [Google Scholar]
  48. Wickham, H. Data analysis. In Ggplot2: Elegant Graphics for Data Analysis; Springer: Cham, Switzerland, 2016; pp. 189–201. [Google Scholar]
  49. Gibson, L.; Lee, T.M.; Koh, L.P.; Brook, B.; Gardner, T.A.; Barlow, J.; Peres, C.; Bradshaw, C.; Laurance, W.F.; Lovejoy, T.E.; et al. Primary forests are irreplaceable for sustaining tropical biodiversity. Nature 2011, 478, 378–381. [Google Scholar] [CrossRef] [PubMed]
  50. Khanaposhtani, M.G.; Kaboli, M.; Karami, M.; Etemad, V. Effect of Habitat Complexity on Richness, Abundance and Distributional Pattern of Forest Birds. Environ. Manag. 2012, 50, 296–303. [Google Scholar] [CrossRef] [PubMed]
  51. Spitzer, H.B.; Meagher, R.K.; Proudfoot, K.L. The impact of providing hiding spaces to farmed animals: A scoping review. PLoS ONE 2022, 17, e0277665. [Google Scholar] [CrossRef] [PubMed]
  52. Miraldo, A.; Li, S.; Borregaard, M.K.; Flórez-Rodríguez, A.; Gopalakrishnan, S.; Rizvanovic, M.; Wang, Z.; Rahbek, C.; Marske, K.A.; Nogués-Bravo, D. An Anthropocene map of genetic diversity. Science 2016, 353, 1532–1535. [Google Scholar] [CrossRef] [PubMed]
  53. Datta, A. Hornbill abundance in unlogged forest, selectively logged forest and a forest plantation in Arunachal Pradesh, India. Oryx 1998, 32, 285–294. [Google Scholar] [CrossRef]
  54. Phoonjampa, R.; Koenig, A.; Brockelman, W.Y.; Borries, C.; Gale, G.A.; Carroll, J.P.; Savini, T. Pileated Gibbon Density in Relation to Habitat Characteristics and Post-logging Forest Recovery. Biotropica 2011, 43, 619–627. [Google Scholar] [CrossRef]
  55. Fahrig, L. Effects of Habitat Fragmentation on Biodiversity. Annu. Rev. Ecol. Evol. Syst. 2003, 34, 487–515. [Google Scholar] [CrossRef]
  56. Gibbons, M.A.; Harcourt, A.H. Biological Correlates of Extinction and Persistence of Primates in Small Forest Fragments: A Global Analysis. Trop. Conserv. Sci. 2009, 2, 388–403. [Google Scholar] [CrossRef]
  57. Brotcorne, F.; Maslarov, C.; Wandia, I.N.; Fuentes, A.; Beudels-Jamar, R.C.; Huynen, M. The role of anthropic, ecological, and social factors in sleeping site choice by long-tailed Macaques (Macaca fascicularis). Am. J. Primatol. 2014, 76, 1140–1150. [Google Scholar] [CrossRef] [PubMed]
  58. Linkie, M.; Dinata, Y.; Nofrianto, A.; Leader-Williams, N. Patterns and perceptions of wildlife crop raiding in and around Kerinci Seblat National Park, Sumatra. Anim. Conserv. 2007, 10, 127–135. [Google Scholar] [CrossRef]
  59. Delacour, J. The Pheasants of the World, 2nd ed.; Spur Publications for the World Pheasant Association: Hindhead, UK, 1977; Available online: https://obnb.uk/p11638941-the-pheasants-of-the-world (accessed on 1 April 2026).
  60. Saridnirun, G.; Meckvichai, W.; Dumrongrojwatthana, P. Seasonal Distribution and Habitat Use of the Green Peafowl Pavo muticus, Linnaeus 1766, in Wiang Lor Wildlife Sanctuary, Phayao Province, Northern Thailand. Chiang Mai J. Sci. 2017, 44, 824–838. [Google Scholar]
  61. Blake, S.; Hedges, S. Sinking the Flagship: The Case of Forest Elephants in Asia and Africa. Conserv. Biol. 2004, 18, 1191–1202. [Google Scholar] [CrossRef]
  62. Kamler, J.F. Extreme Dogs: Dholes. 2013. Available online: https://www.researchgate.net/publication/277588881 (accessed on 1 April 2026).
  63. Steinmetz, R.; Garshelis, D.L. Distinguishing Asiatic Black Bears and Sun Bears by Claw Marks on Climbed Trees. J. Wildl. Manag. 2008, 72, 814–821. [Google Scholar] [CrossRef]
  64. Gardner, T.A.; Burgess, N.D.; Aguilar-Amuchastegui, N.; Barlow, J.; Berenguer, E.; Clements, T.; Danielsen, F.; Ferreira, J.; Foden, W.; Kapos, V.; et al. A framework for integrating biodiversity concerns into national REDD+ programmes. Biol. Conserv. 2012, 154, 61–71. [Google Scholar] [CrossRef]
  65. Wilson, H.B.; Meijaard, E.; Venter, O.; Ancrenaz, M.; Possingham, H.P. Conservation Strategies for Orangutans: Reintroduction versus Habitat Preservation and the Benefits of Sustainably Logged Forest. PLoS ONE 2014, 9, e102174. [Google Scholar] [CrossRef] [PubMed]
  66. Gaveau, D.L.A.; Wich, S.; Epting, J.; Juhn, D.; Kanninen, M.; Leader-Williams, N. The future of forests and orangutans (Pongo abelii) in Sumatra: Predicting impacts of oil palm plantations, road construction, and mechanisms for reducing carbon emissions from deforestation. Environ. Res. Lett. 2009, 4, 034013. [Google Scholar] [CrossRef]
  67. Gray, T.; Eames, J.; Lyon, J.; Meyerhoff, M. Rewilding in Southeast Asia: An assessment of conservation. Cambodian J. Nat. Hist. 2019, 2019, 98–112. [Google Scholar]
  68. Svensson, J.; Bubnicki, J.W.; Jonsson, B.G.; Andersson, J.; Mikusiński, G. Conservation significance of intact forest landscapes in the Scandinavian Mountains Green Belt. Landsc. Ecol. 2020, 35, 2113–2131. [Google Scholar] [CrossRef]
Figure 1. Map of Prey Lang Wildlife Sanctuary and the selected quadrat-transect lines (squares) inside the REDD+ area, with high-intact forest indicated in blue and moderate-intact forest in yellow.
Biosphere 02 00007 g001
Figure 2. The distance sampling design (methodology based on [34]). (a) The observers walk along the transect line following the walking direction to detect the target animal at location (x), and (b) the opposite walking direction between the morning (blue short-dashed line) and the afternoon (orange long-dashed line) around the square transect corners (A, B, C, D) that begins and ends at the starting point.
Biosphere 02 00007 g002
Figure 3. The pattern of (a) species richness (counts) and (b) abundance of the target species recorded in the transect survey.
Biosphere 02 00007 g003
Figure 4. (Left) Box plots of species abundance, richness (counts), and diversity H, and (Right) the Hill diversity profile indicating the effective number of species in high- and moderate-intact forest habitats with diversity orders (q = 0–3). Note: “ns” in the right panel indicates no significant difference, * p < 0.05; ** p < 0.01. Diversity orders (q = 0–3) on the right panel correspond to q = 0 (species counts), q = 1 (exponential Shannon diversity), q = 2 (inverse Simpson diversity), and q = 3 (Hill diversity of order 3).
Biosphere 02 00007 g004
Figure 5. Results of habitat association analysis. Subfigures (ag) indicate significant associations between the species presence/absence and the two types of forest habitats: high-intact and moderate-intact. Subfigure (h) shows significant differences in the proportion of occurrence frequency of the species between the two types of forest habitats (high-intact in teal and moderate-intact in orange) based on a chi-square test. Note: For (ag), the y-axis ranges from 0.00 to 1.00 (equivalent to 0–100%) and represents the probability of species presence/absence estimated from logistic regression models based on presence/absence data. * p < 0.05; ** p < 0.01; *** p < 0.001.
Biosphere 02 00007 g005
Table 1. Selected species for key biodiversity monitoring in the PLWS, their IUCN status, ecological roles, and previous records in the PLWS.
Common NameScientific NameIUCN StatusEcological RolesPrevious Records
Asian elephantElephas maximusENSeed dispersal, habitat creation, and vegetation modification [18][8,18,19]
BantengBos javanicusENSeed dispersal [20][8,9,19]
GaurBos gaurusVUPlant population control and main prey for large carnivores [21][9,19]
DholeCuon alpinusENPrey regulation [16][9,19]
Sambar deerRusa unicolorVUSeed dispersal and keystone herbivore [22][8,9,19]
Northern pig-tailed macaqueMacaca leoninaVUSeed dispersal and forest regeneration [23][9,19]
Pileated gibbonHylobates pileatusENSeed dispersal [15][9,19]
Indochinese silvered langurTrachypithecus germainiENRegulation of vegetation growth and forest structure [24][9,19]
Long-tailed macaqueMacaca fascicularisVUSeed dispersal and insect control through predation [25][8,9,19]
Northern red muntjacMuntiacus vaginalisLCHerbivory, seed dispersal, and serving as prey species [26][8,9,19]
Wild pigSus scrofaLCSoil disturbance, seed dispersal, and maintaining ecological balance [27][8,9,19]
Great hornbillBuceros bicornisVUSeed dispersal, forest regeneration, and ecological balance [28][9,19]
Green peafowlPavo muticusENFeeding on plants and dispersing seeds [29][8,9,19]
Malayan sun bearHelarctos malayanusVUSeed dispersal and maintenance of forest understory structure [30][8,9,19]
Asiatic black bearUrsus thibetanusVUSeed dispersal and insect control [31][8,9,19]
Table 2. The detected species and their numbers of sightings, average cluster sizes, and encounter rates.
NoCommon
Name
Scientific
Name
Detections/
Sightings
Average Cluster Size
(Individuals)
Encounter
Rate (per km)
1Great hornbillB. bicornis762.340.826
2Pileated gibbonH. pileatus312.230.337
3Wild pigS. scrofa252.880.272
4Long-tailed macaqueM. fascicularis235.960.250
5Green peafowlP. muticus131.620.141
6Northern red muntjacM.vaginalis1010.109
7Indochinese silvered langurT. germaini88.130.087
8GaurB. gaurus110.011
9Sambar deerR. unicolor110.011
Table 3. Species–habitat associations based on logistic regression results. The important variables associated with the statistical occurrence of wildlife species are based on results of multiple logistic regression analysis and are retained (from most to least important) in the two models based on the minimum AIC value.
Wildlife SpeciesRegression Coefficient (β) of the Important Variables Selected for the Final ModelAIC
EVEDDFOTPCRLRIFDNVFull ModelFinal Model
Great hornbill1.54-----92.9885.89
Pileated gibbon0.69-----96.7487.64
Indochinese silvered langur----−506.7-1103.349.62
Northern red muntjac−2.67-5.23--−3.62220.94
Green peafowl-−798.56-30.22--48.4134.66
Long-tailed macaque-−1.010.46---91.4280.32
Wild pig------107.7-
Note: EVE = Evergreen Forest; DDF = Dry Dipterocarp Forest; OTP = Other Plantations; CRL = Cropland; RIF = Rice Field; DNV = Distance to Nearest Village; and (-) indicates a negative association.
Disclaimer/Publisher’s Note: The statements, opinions and data contained in all publications are solely those of the individual author(s) and contributor(s) and not of MDPI and/or the editor(s). MDPI and/or the editor(s) disclaim responsibility for any injury to people or property resulting from any ideas, methods, instructions or products referred to in the content.