Article

Development of an Exploratory Simulation Tool: Using Predictive Decision Trees to Model Chemical Exposure Risks and Asthma-like Symptoms in Professional Cleaning Staff in Laboratory Environments

School of Computer Science, Georgia Institute of Technology, Atlanta, GA 30332, USA
Laboratories 2026, 3(1), 2; https://doi.org/10.3390/laboratories3010002
Submission received: 22 November 2025 / Revised: 13 December 2025 / Accepted: 4 January 2026 / Published: 9 January 2026

Abstract

Exposure to chemical irritants in laboratory and medical environments poses significant health risks to workers, particularly in relation to asthma-like symptoms. Routine cleaning practices, which often involve the use of strong chemical agents to maintain hygienic settings, have been shown to contribute to respiratory issues. Laboratories, where chemicals such as hydrochloric acid and ammonia are frequently used, represent an underexplored context in the study of occupational asthma. While much of the research on chemical exposure has focused on industrial and high-risk occupations or large cohort populations, less attention has been given to the risks in laboratory and medical environments, particularly for professional cleaning staff. Given the growing reliance on cleaning agents to maintain sterile and safe workspaces in scientific research and healthcare facilities, this gap is concerning. This study developed an exploratory simulation tool, using a simulated cohort based on key demographic and exposure patterns from foundational research, to assess the impact of chemical exposure from cleaning products in laboratory environments. Four supervised machine learning models were applied to evaluate the relationship between chemical exposures and asthma-like symptoms: (1) Decision Trees, (2) Random Forest, (3) Gradient Boosting, and (4) XGBoost. High exposures to hydrochloric acid and ammonia were found to be significantly associated with asthma-like symptoms, and workplace type also played a critical role in determining asthma risk. This research provides a data-driven framework for assessing and predicting asthma-like symptoms in professional cleaning workers exposed to cleaning agents and highlights the potential for integrating predictive modeling into occupational health and safety monitoring. Future work should explore dose–response relationships and the temporal dynamics of chemical exposure to further refine these models and improve understanding of long-term health risks.

1. Introduction

Exposure to chemical irritants in occupational settings, especially in laboratory and medical environments [1,2], poses substantial health risks to workers. Routine cleaning practices, which often involve the use of strong chemical agents to maintain hygienic settings [3], have been shown to contribute to respiratory issues such as asthma-like symptoms [4,5,6,7]. Laboratories are settings where chemicals (e.g., hydrochloric acid and ammonia) that are widely documented airway irritants are used [8], yet most research on occupational asthma focuses on industrial settings or large, high-risk cohorts [9,10]; less attention has been given to the risks in laboratory and medical environments, particularly for professional cleaning staff. For professional cleaning staff in laboratory environments who engage in frequent cleaning activities or work in close proximity to these agents, this gap is concerning. Conditions such as work-related asthma are multifactorial and rare [1,11], making subtle risks harder to detect without systematic analysis.
To address this gap, the present study examines how routine exposure to commonly used cleaning agents may contribute to asthma-like symptoms among professional cleaning workers. Specifically, this study uses an exploratory simulation tool developed to model the effects of chemical exposure on asthma-like symptoms in a laboratory setting, focusing specifically on cleaning staff who frequently work with hazardous chemicals. Because real-world data on these exposures are limited for laboratory settings, I developed a simulated workforce cohort based on established occupational-exposure findings [4], reflecting realistic demographic and exposure patterns. This approach enables a structured evaluation of respiratory risk in a setting where direct surveillance data are scarce. The simulation tool is not intended for inferential analysis, but instead aims to provide an exploratory framework for understanding the potential relationship between chemical exposures and respiratory symptoms.
Simulation-based exposure modeling combined with tree-based machine learning methods has been widely applied in occupational and environmental health research to evaluate risk patterns under data-scarce conditions, particularly where real-world dose and outcome data are limited [12,13,14,15]. Finally, this work uses a predictive modeling framework to explore how chemical exposures relate to respiratory symptoms and how such approaches might support future occupational health monitoring in laboratory environments. In particular, predictive decision trees are applied within the simulation tool to model potential asthma-like outcomes, with the goal of evaluating various machine learning approaches in this context The primary aims are to: (1) estimate the relationship between chemical exposures from routine cleaning agents and asthma-like symptoms, (2) compare predictive performance across several modeling approaches, and (3) provide a framework for integrating data-driven tools into laboratory health and safety practices.

2. Materials and Methods

2.1. Overview of the Original Study

The original study [4] involved 917 employees from 37 cleaning companies in Barcelona, Spain. It provided key demographic data, including smoking status, sex, and age distributions, as well as chemical exposure metrics for a variety of cleaning agents (see Table 1 for details). These metrics, along with asthma-like symptom prevalence estimates, formed the baseline for the simulation design.

2.2. Data Adaptation for Simulation

To model asthma-like symptoms, a logistic risk function was used, integrating exposure variables along with smoking and foreign-born status [16,17], calibrating the model to produce a symptom prevalence of approximately 11%, consistent with the original study [4]. While not all variables from the original study [4] could be directly mapped due to data constraints, the simulation captured the essential demographic, occupational, and chemical-exposure patterns necessary to reflect realistic environmental conditions and worker characteristics most relevant to assessing respiratory risk in cleaning and laboratory support environments. The cohort was modeled to match the predominance of female cleaners (82%) [4], with age simulated based on the study’s central tendency (mean = 45 years; SD = 10). Smoking status followed reported frequencies (30% current smokers, 10% former smokers, 60% never smokers). The foreign-born proportion (30%) [4] was retained for completeness, though it contributed minimally to the modeled risk structure. Python (version 3.11.9) was used for all simulations and data processing.

2.3. Simulated Data Generation and Exposure Modeling

A synthetic dataset was generated in Python (version 3.11.9) using NumPy and pandas to replicate the demographic, workplace, and chemical-exposure patterns from the original study [4] (Table 1). All variable distributions, including sex, smoking status, workplace type, and chemical exposures, were parameterized based on the proportions reported in the study, with no additional assumptions beyond those outlined in Section 2.1. The study ran 20,000 simulated observations to ensure sufficient sample size for downstream modeling. Categorical variables were generated using multinomial or binomial sampling, while continuous variables (e.g., age) were simulated using truncated normal distributions.
Asthma-like symptoms were modeled using a logistic regression function calibrated to the symptom prevalence target (~11%) from the source study. Feature associations were assessed using Chi-square tests for categorical variables and Cohen’s d for continuous variables, as described in Section 3.1.

2.4. Classification Modeling for Predicting Asthma-like Symptoms

In the third stage of the analysis, a supervised classification pipeline was developed in Python to predict asthma-like symptoms using the simulated cohort adapted from the original study [4]. Four tree-based model types commonly used in applied classification research [18,19]: (1) Decision Trees (DTs), which classify individuals through a sequence of simple, rule-based splits and offer high interpretability [20]; (2) Random Forests (RFs), which aggregate predictions across multiple decision trees to improve stability and reduce overfitting [21]; (3) Gradient Boosting (GB), which builds trees sequentially so that each tree corrects errors made by prior trees [22]; and (4) XGBoost (Extreme Gradient Boosting) [23], an efficient gradient-boosting implementation widely used when predictor–outcome relationships are nonlinear or involve interacting risk factors [24,25]. To support model interpretability, SHAP (SHapley Additive exPlanations) was used to compute global feature importance for the Random Forest model, consistent with prior applications of SHAP in tree-based surrogate modeling frameworks [26].
To better represent occupational and chemical risk patterns, several domain-informed features were constructed prior to model training (Table 2). These included (1) a cumulative chemical-exposure score (total number of high-exposure products), (2) a binary indicator for workers exposed to multiple high-frequency irritants, (3) an interaction term between smoking status and workplace type to capture combined behavioral and occupational risk, and (4) an indicator for potentially vulnerable workers (foreign-born individuals with elevated chemical exposure). Categorical variables (sex, smoking category, workplace) were one-hot-encoded, continuous variables (age and cumulative exposure) were standardized, and binary chemical-exposure indicators were retained without transformation.
Due to the relative rarity of asthma-like symptoms in the simulated cohort (5.1%), substantial class imbalance was observed during exploratory analysis. To address this, SMOTE (Synthetic Minority Oversampling Technique) [27] was used to balance the class distribution to the training sets for the DT, RF, and GB models. SMOTE generated additional synthetic examples of symptomatic workers, improving the models’ ability to learn patterns associated with respiratory irritation. For XGBoost, oversampling was not required; instead, the internal class-imbalance weighting parameter (scale_pos_weight) [28] was used, which upweighted symptomatic cases during training without altering the data structure.
For model development, the dataset was partitioned into 70% training, 15% validation, and 15% testing, using stratified sampling to maintain the underlying outcome proportion. This approach minimized overfitting and provided an unbiased assessment of each model’s ability to identify symptomatic workers using data not observed during training. Model performance was evaluated using several standard metrics: accuracy, precision, recall (sensitivity), F1 score, AUC-ROC, and AUC-PR, with emphasis on AUC-PR given the imbalanced outcome distribution. Because false negatives were the primary concern from a laboratory and workplace-safety perspective [1,29], threshold tuning [30] was applied on the validation set to select a decision threshold that achieved ≥70% recall, prioritizing the detection of symptomatic workers. Probability-based threshold selection follows the broader approach used in occupational exposure modeling studies [31], where probabilistic predictions support risk-based decision-making. For model development, the dataset was partitioned into 70% training, 15% validation, and 15% testing, using stratified sampling to maintain the underlying outcome proportion. This approach minimized overfitting and provided an unbiased assessment of each model’s ability to identify symptomatic workers using data not observed during training. Model performance was evaluated using several standard metrics: accuracy, precision, recall (sensitivity), F1 score, AUC-ROC, and AUC-PR, with emphasis on AUC-PR given the imbalanced outcome distribution. Because false negatives were the primary concern from a laboratory and workplace-safety perspective [1,24], threshold tuning [25] was applied on the validation set to select a decision threshold that achieved ≥70% recall, prioritizing the detection of symptomatic workers. Probability-based threshold selection follows the broader approach used in occupational exposure modeling studies [26], where probabilistic predictions support risk-based decision-making. Instead, the internal class-imbalance weighting parameter (scale_pos_weight) [23] was used.

2.5. Reproducibility and Documentation

The full documentation and code used to generate the simulated dataset and to implement the classification models are provided in the Supplementary Material (SM S1). The simulation incorporated all relevant data reported from the original study [4], reflecting the key demographic, exposure, and risk factors critical to investigating asthma-like symptoms in occupational cleaning workers.

2.6. Generative AI Statement

For this project, generative AI tools [32] were used for coding support, troubleshooting, and initial brainstorming. All outputs were carefully reviewed.

3. Results

3.1. Overview and Descriptive Statistics

Overall, the simulated dataset contained 20,000 observations and 10 predictor variables, with no missing data. Given the highly imbalanced nature of the dataset (5.12% positive cases), model performance was evaluated using multiple metrics, including ROC AUC and PR AUC, to assess how well each model handled the imbalance (1024 observations; imbalance ratio ≈ 18.5:1). This proportion is consistent with previous studies demonstrating that asthma-like respiratory symptoms occur in a minority of adults in occupational settings [5] and within general population prevalence ranges reported in large epidemiologic surveys [33]. The class distribution remained stable across the train, validation, and test sets (5.12%, 5.13%, and 5.10%, respectively). The feature set included one continuous variable (age), six binary variables (e.g., smoking status, chemical exposure), and three categorical variables (e.g., sex, workplace exposure).
Additionally, feature associations were examined, revealing significant differences between the classes for several binary predictors. High chemical exposures (e.g., HCl, ammonia, degreasers) were significantly more common among symptomatic cases (Chi-square test, p < 0.05). For continuous predictors, age showed a negligible difference between groups (Cohen’s d = 0.015), indicating minimal variation in age between symptomatic and non-symptomatic workers.

3.2. Model Performance Across Decision Trees

3.2.1. Overall Model Comparison

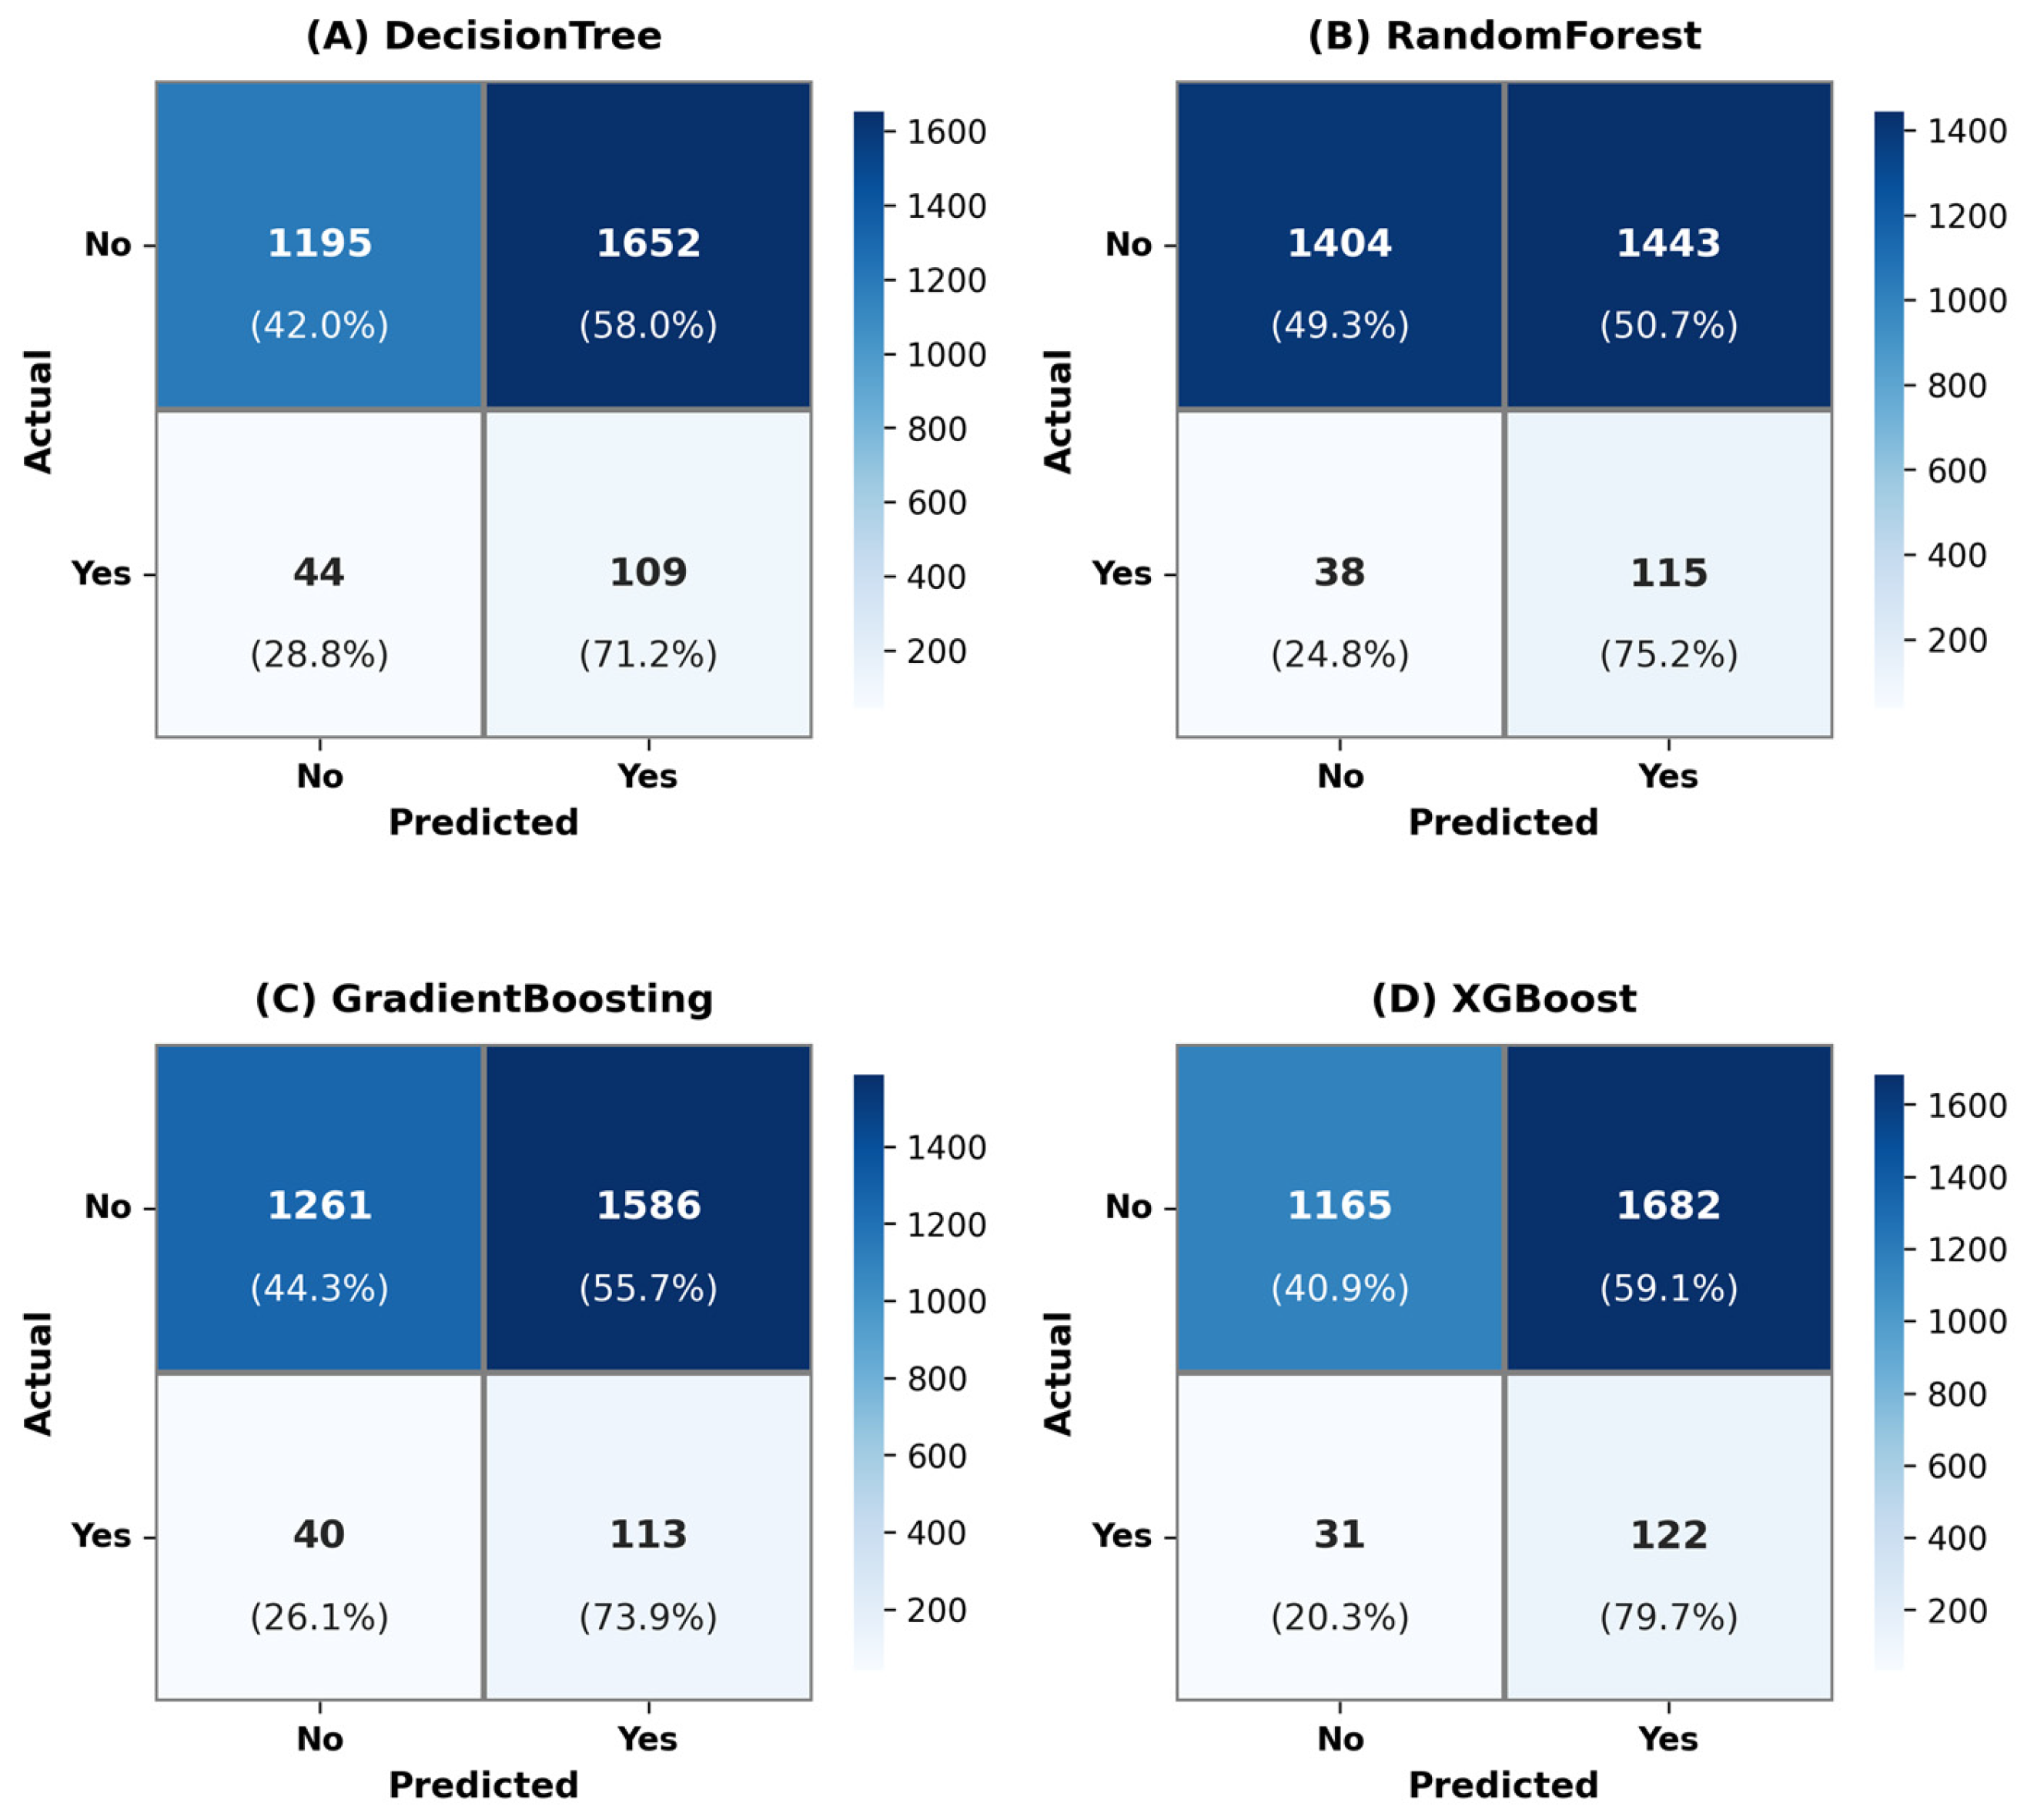
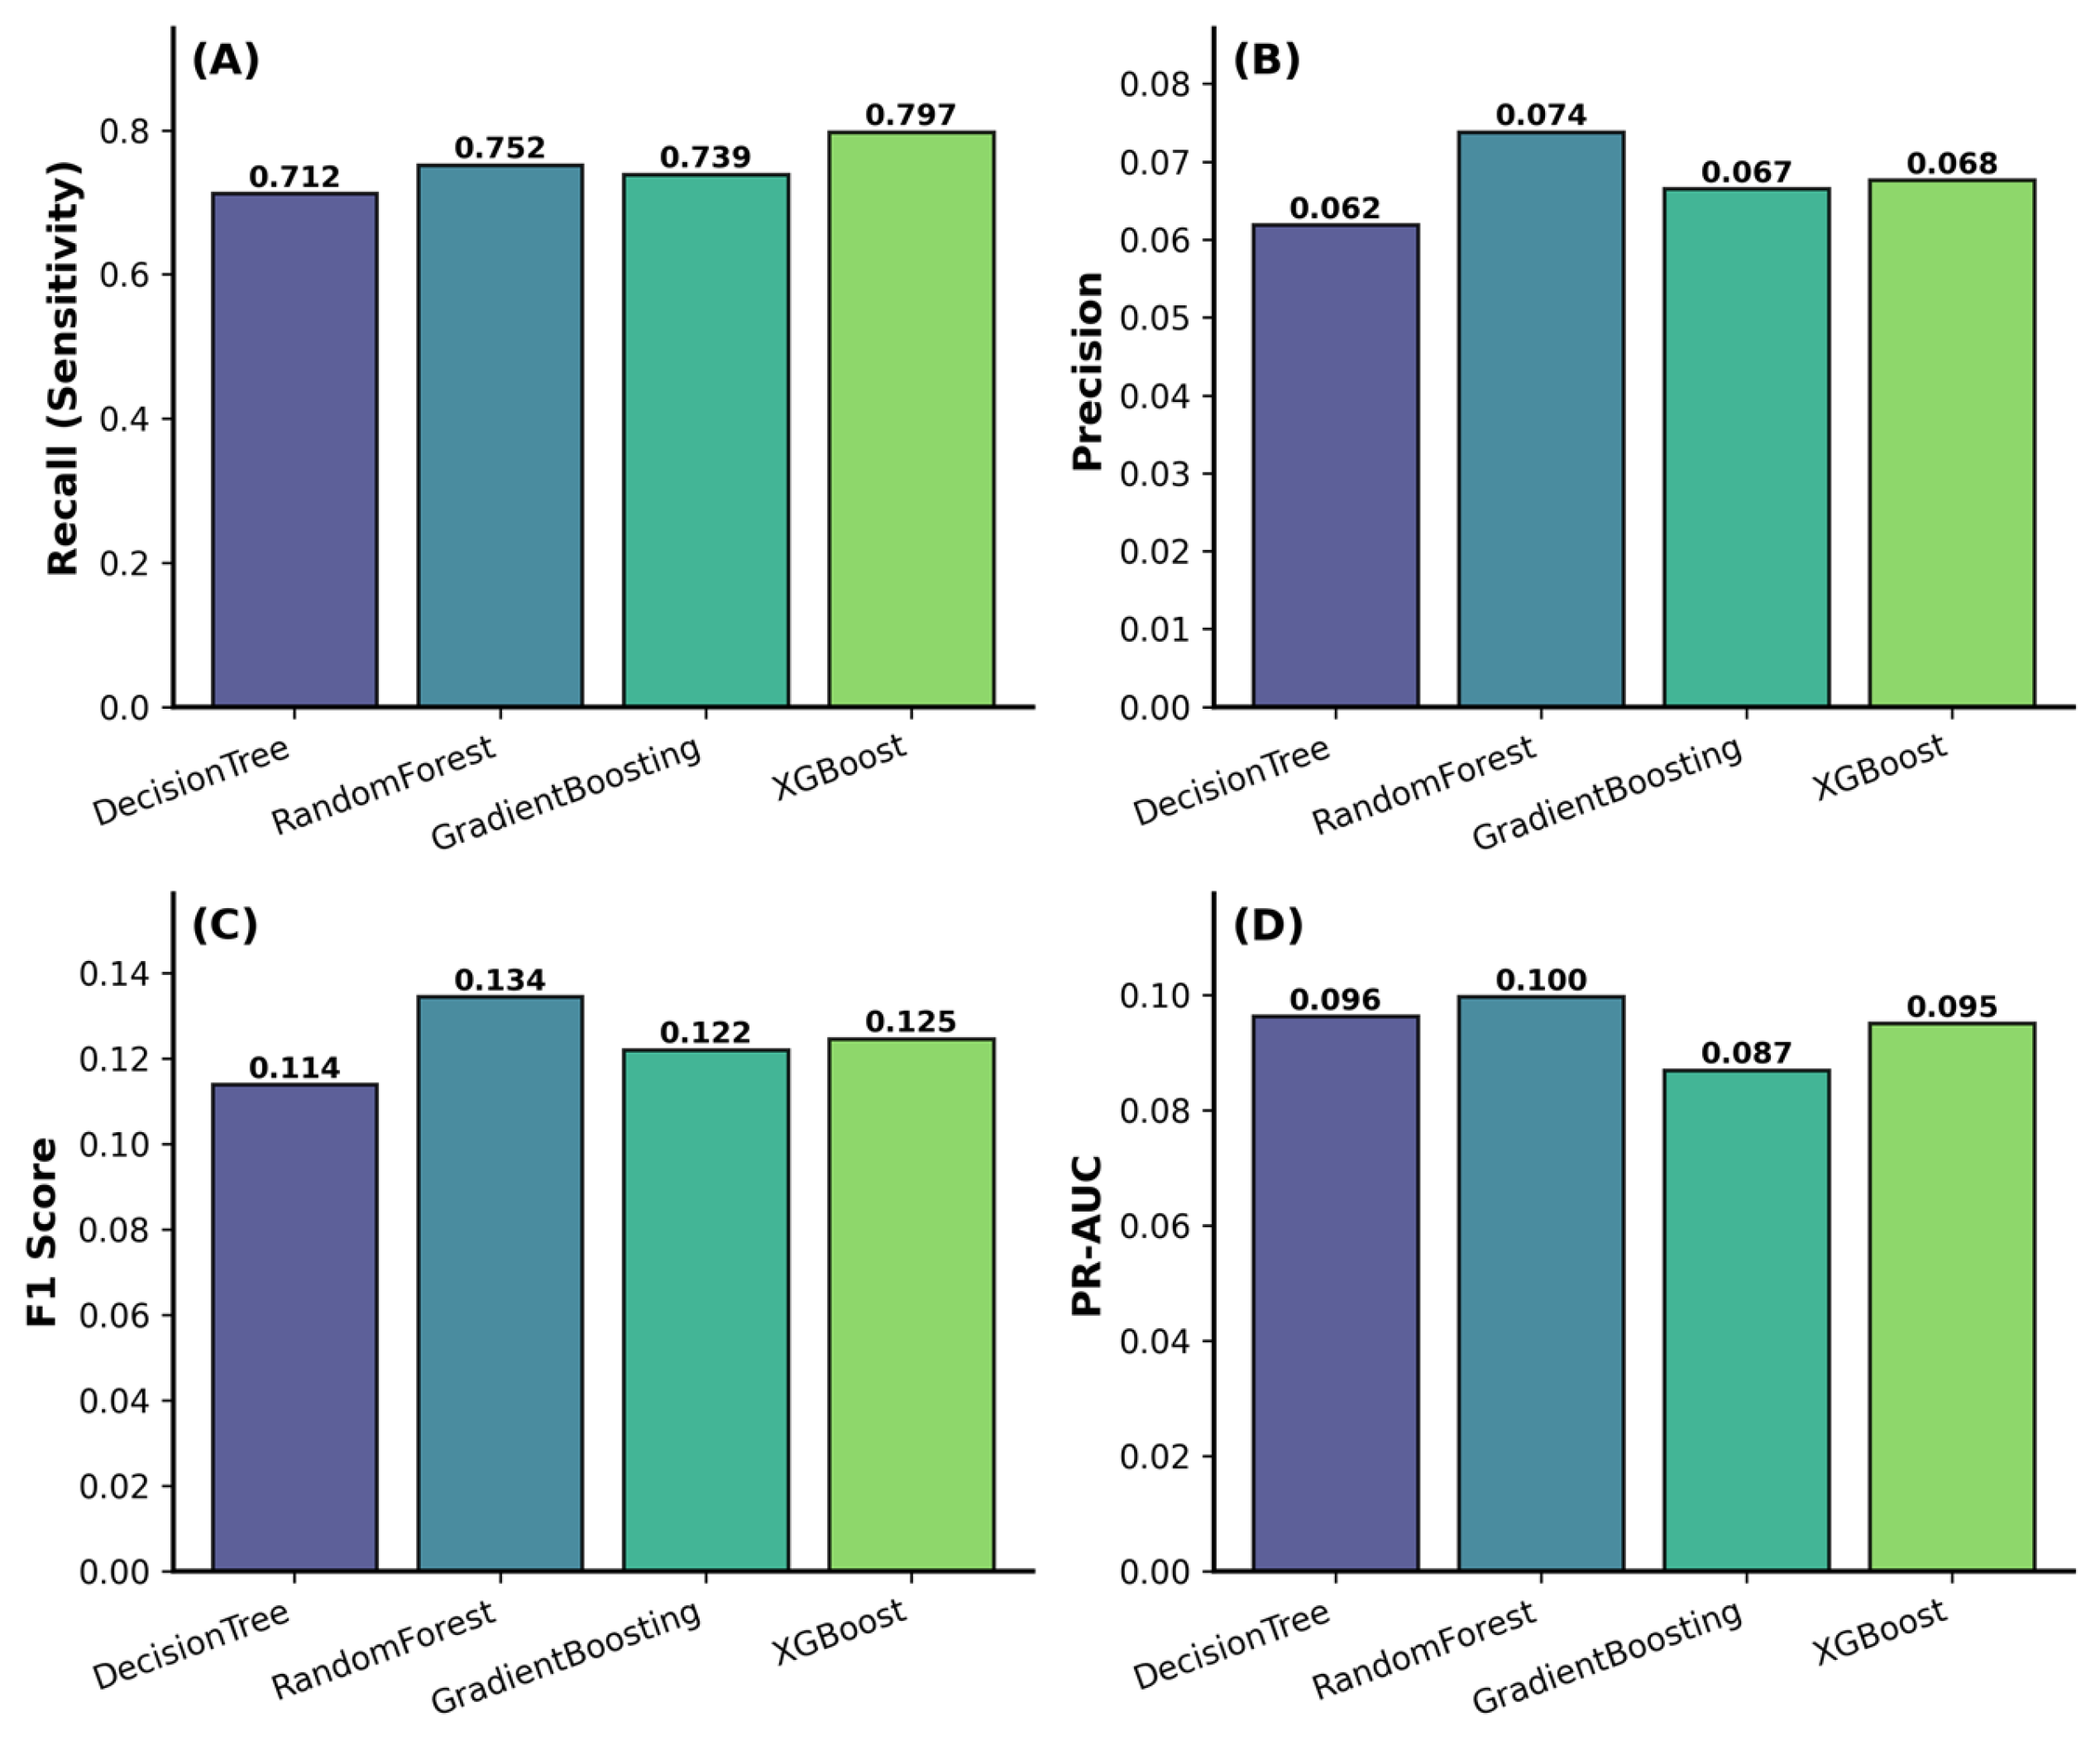
The performance of four classifiers was compared—Decision Tree (DT), Random Forest (RF), Gradient Boosting (GB), and XGBoost (XGB)—using sensitivity, specificity, ROC AUC, and PR AUC as evaluation metrics (Table 3; Figure 1). RF achieved the highest sensitivity (75.2%) with moderate specificity (49.3%). XGB showed the highest specificity (94.2%) but slightly lower sensitivity (71.3%). For overall discrimination, RF had the highest ROC AUC (0.673), followed closely by XGB (0.672). DT had the weakest performance across all metrics (ROC AUC: 0.631; PR AUC: 0.096), indicating limited ability to separate symptomatic and non-symptomatic workers compared with the ensemble models.

3.2.2. Confusion Matrices

The confusion matrices further clarified the error patterns of each model, particularly the balance between true positives and false positives (Figure 1; Supplementary Materials SM S2 and S3). RF correctly identified 115 positive cases out of 154 (sensitivity: 75.2%). DT identified 109 true positives out of 153 (sensitivity: 71.2%). XGB achieved the highest sensitivity (79.7%) but with lower specificity compared with RF (40.9% vs. 49.3%). These patterns highlight the tradeoff between sensitivity and specificity across models, with DT and GB producing higher false positive counts relative to RF and XGB (Supplementary Materials SM S2 and S3).

3.2.3. ROC Curves

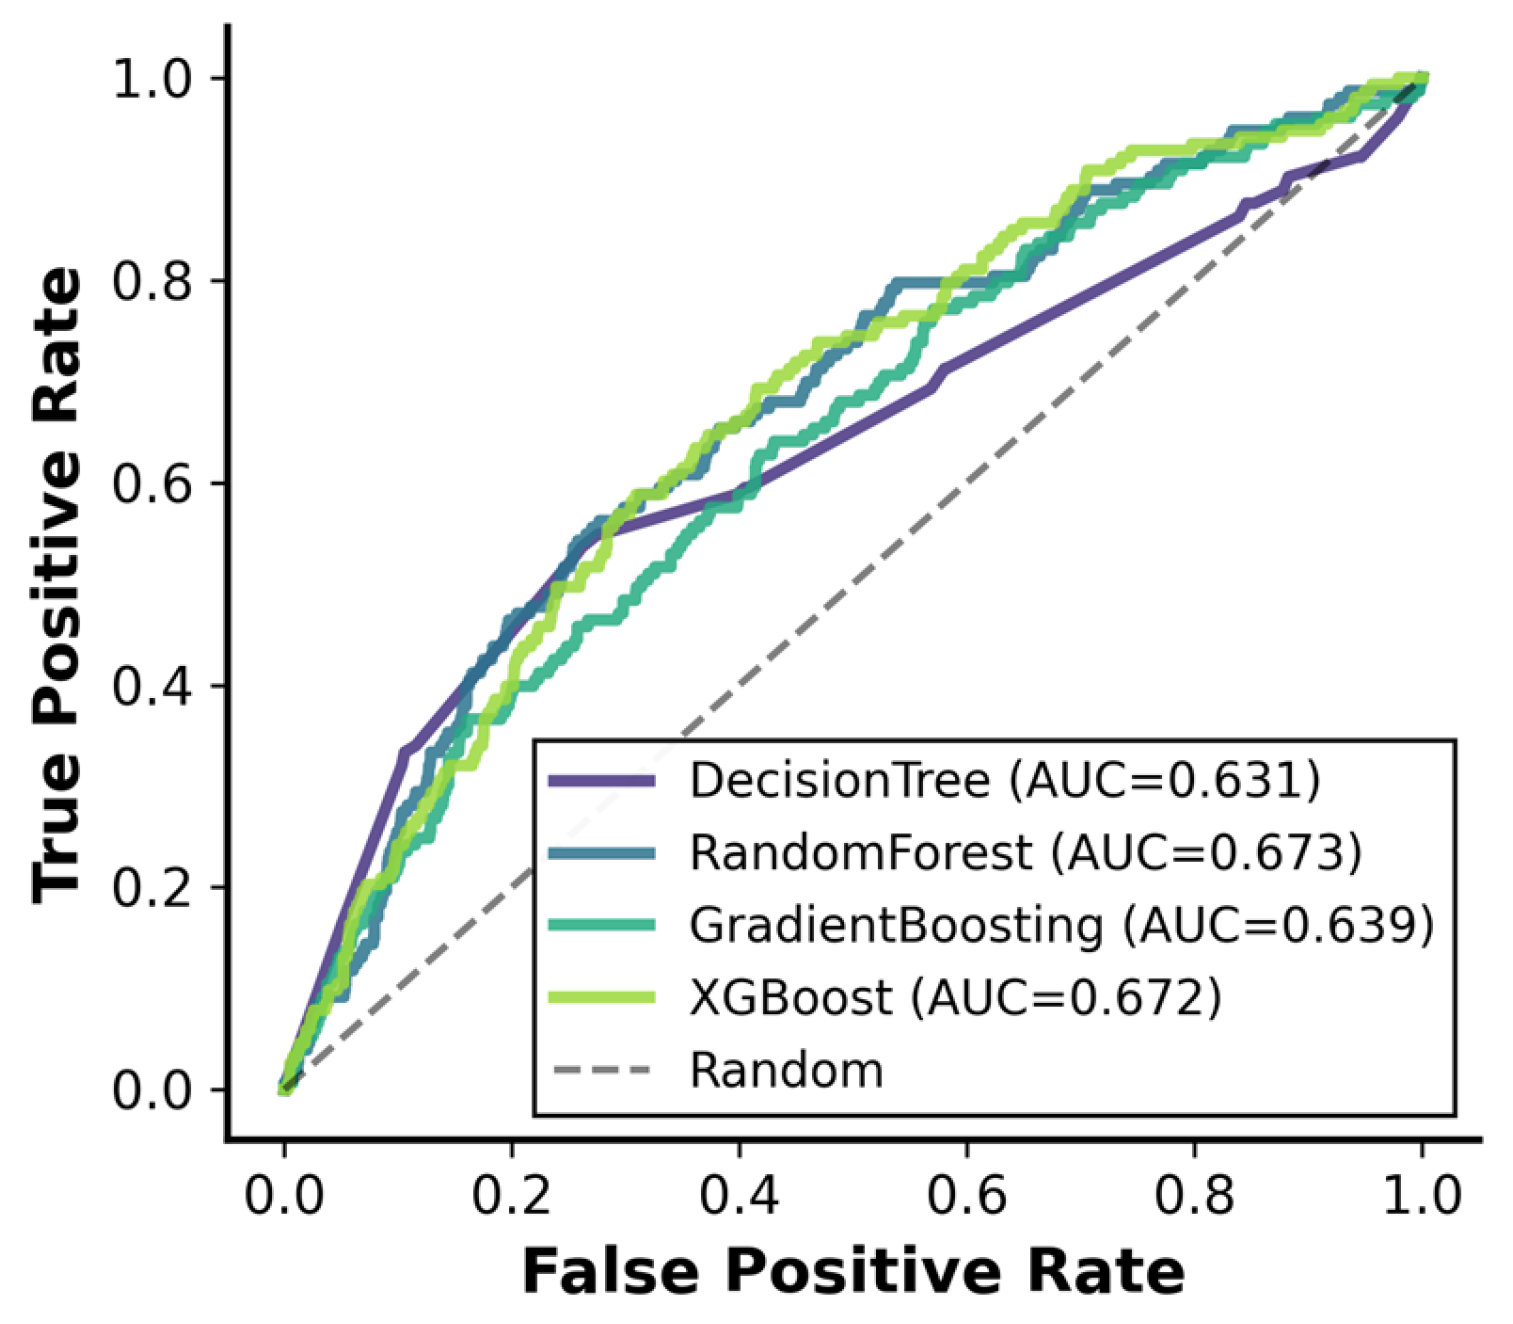
Figure 2 compares the ROC curves for all models. RF achieved the highest ROC AUC (0.673), with XGB showing a nearly identical value (0.672). Although the AUC values were similar, RF maintained higher sensitivity across most thresholds. GB displayed moderate discrimination (ROC AUC: 0.639), and DT had the weakest performance (ROC AUC: 0.631). Overall, the ROC curves suggest that RF and XGB provided the strongest separation between positive and negative cases.

3.2.4. PR Curves

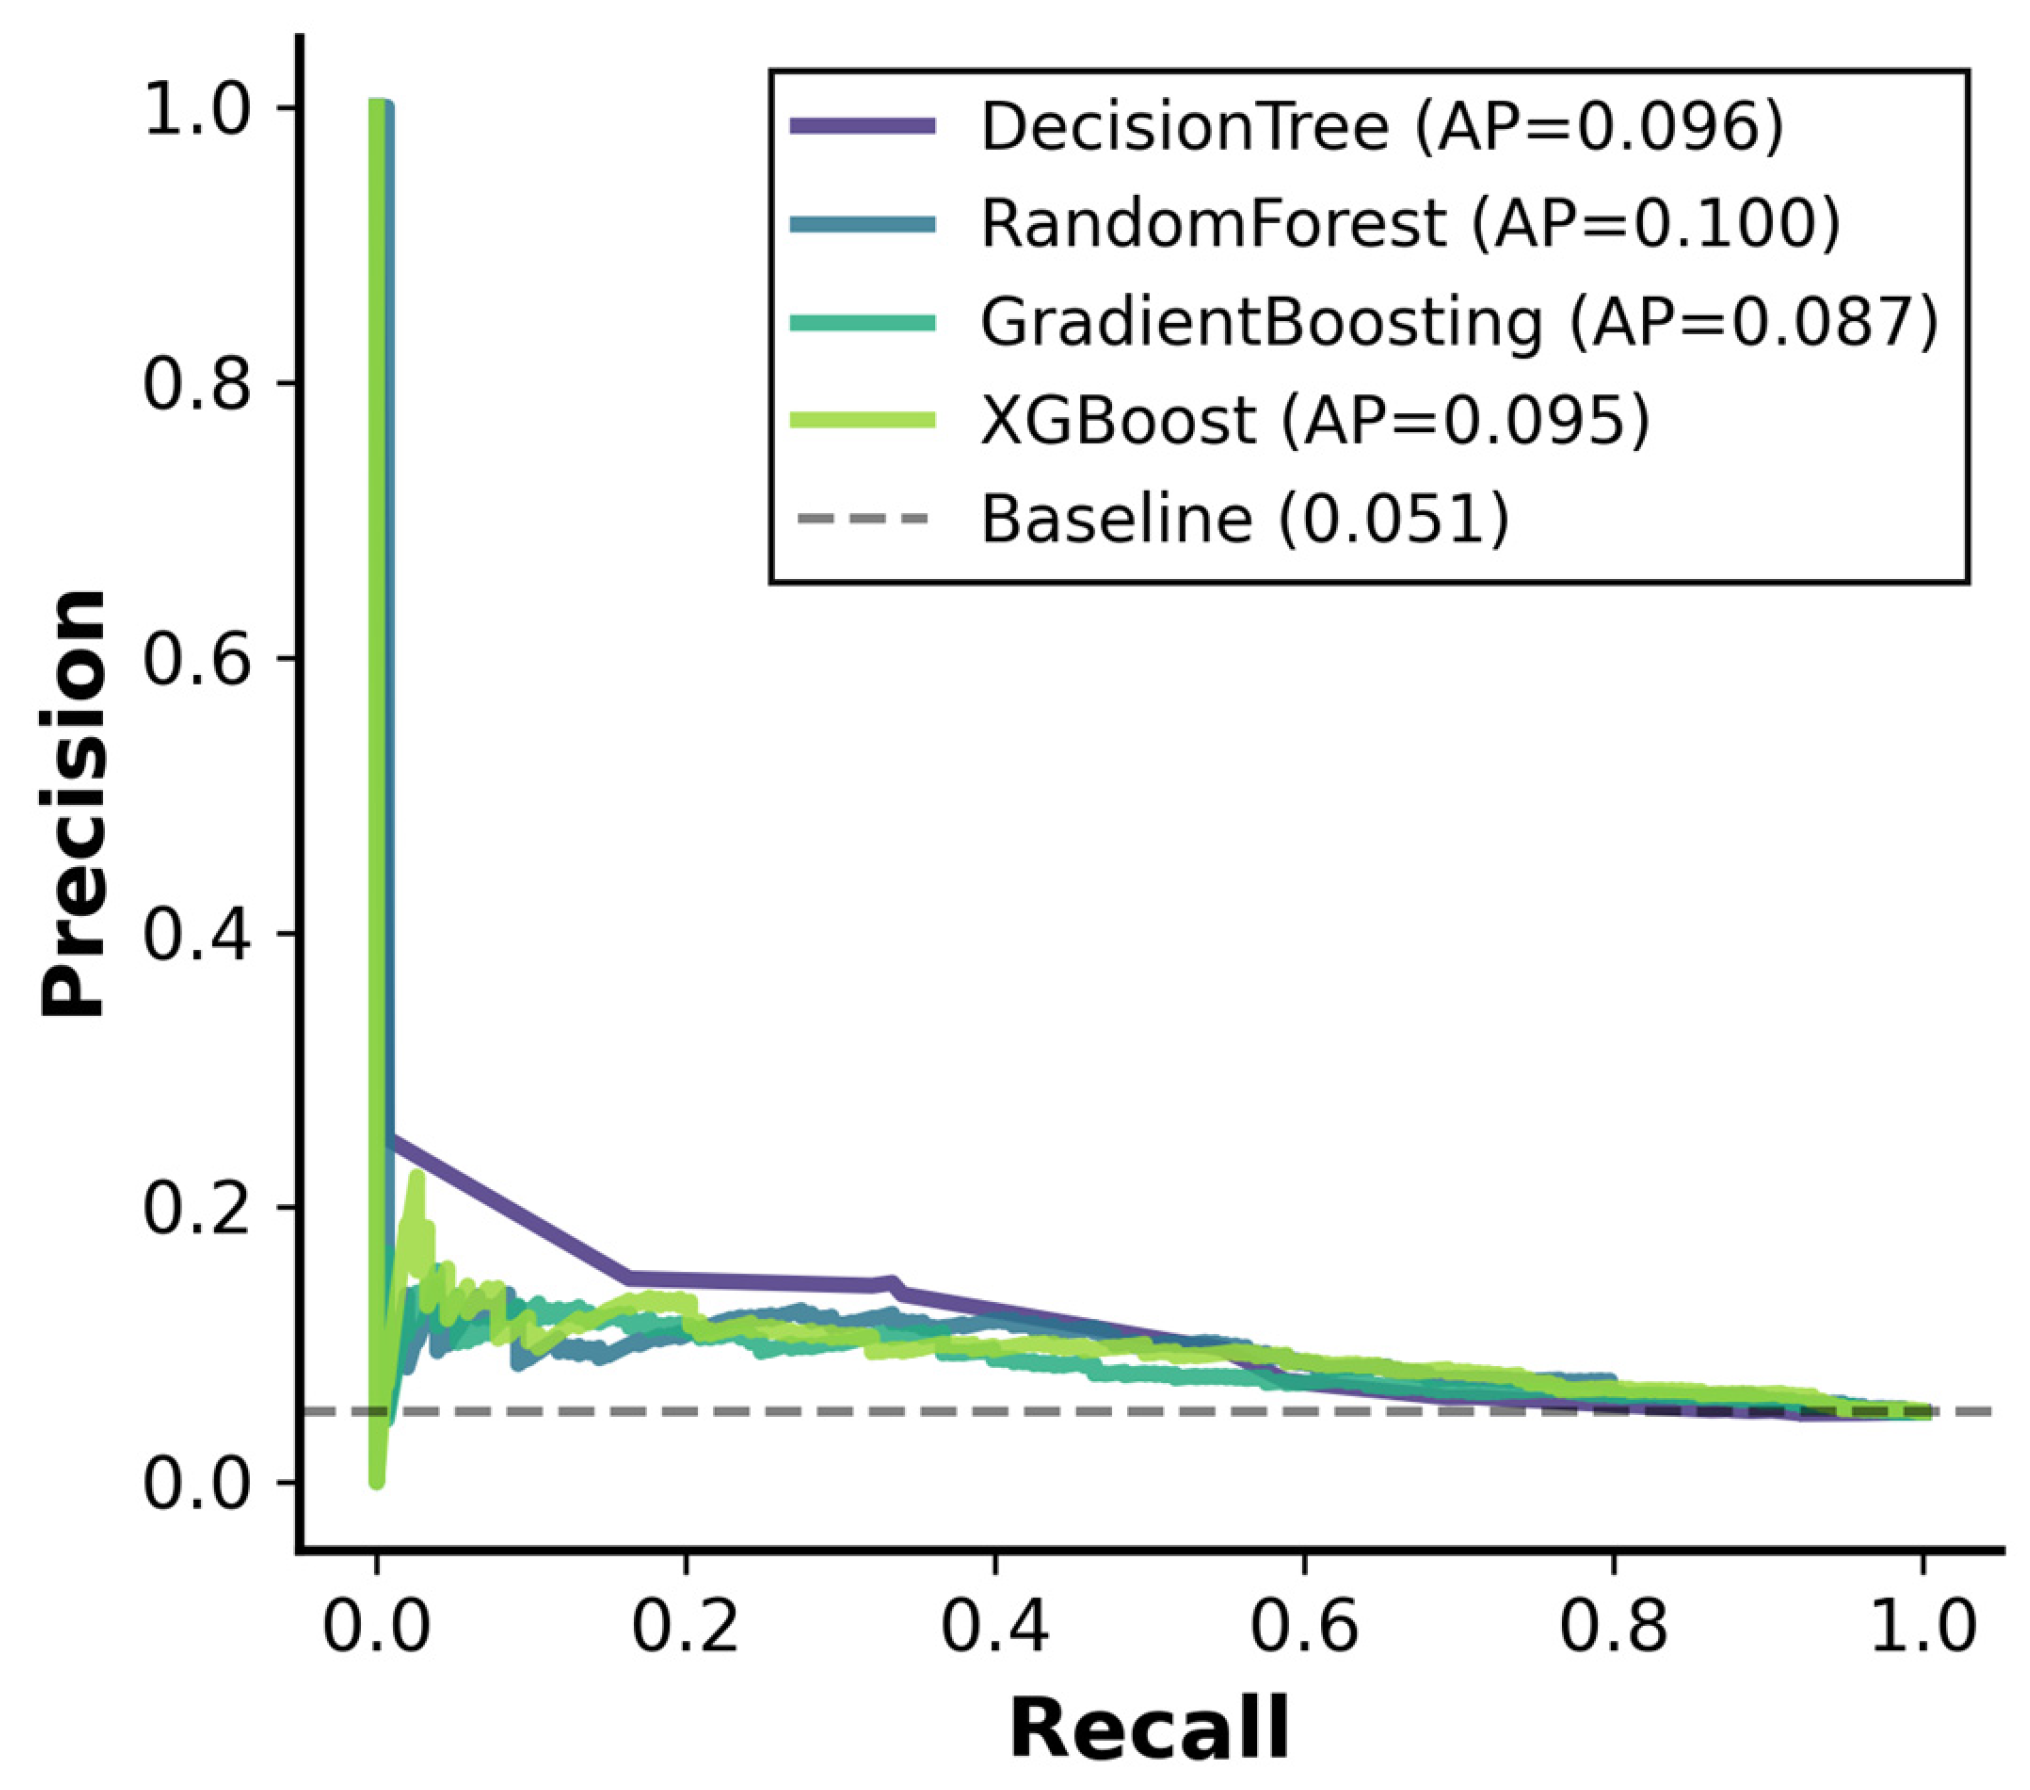
The precision–recall curves summarize how well each model identified positive cases under the high class imbalance (Figure 3). RF had the highest PR AUC (0.100), followed closely by XGB (0.095). Both scores indicate limited precision in this setting. GB and DT showed lower PR AUC values, consistent with their weaker performance in other metrics. Overall, the curves illustrate the difficulty of detecting positive cases and the low precision observed across all models. To aid interpretability, SHAP-based global feature importance was computed for the Random Forest model and is provided in the Supplementary Material SM S4.

3.3. Model Reliability and Cross-Validation

In the cross-validation analysis, clear differences in stability were observed across the four models (Table 3; Figure 4). RF showed consistent performance, with a mean ROC AUC of 0.603 and a mean PR AUC of 0.090. XGB demonstrated similar stability, with a mean ROC AUC of 0.610 and a mean PR AUC of 0.093. DT, in contrast, had lower and more variable performance (mean ROC AUC: 0.567; mean PR AUC: 0.071). GB was the least stable model, with a mean ROC AUC of 0.574. Overall, RF and XGB provided the most consistent results across folds (Figure 5).
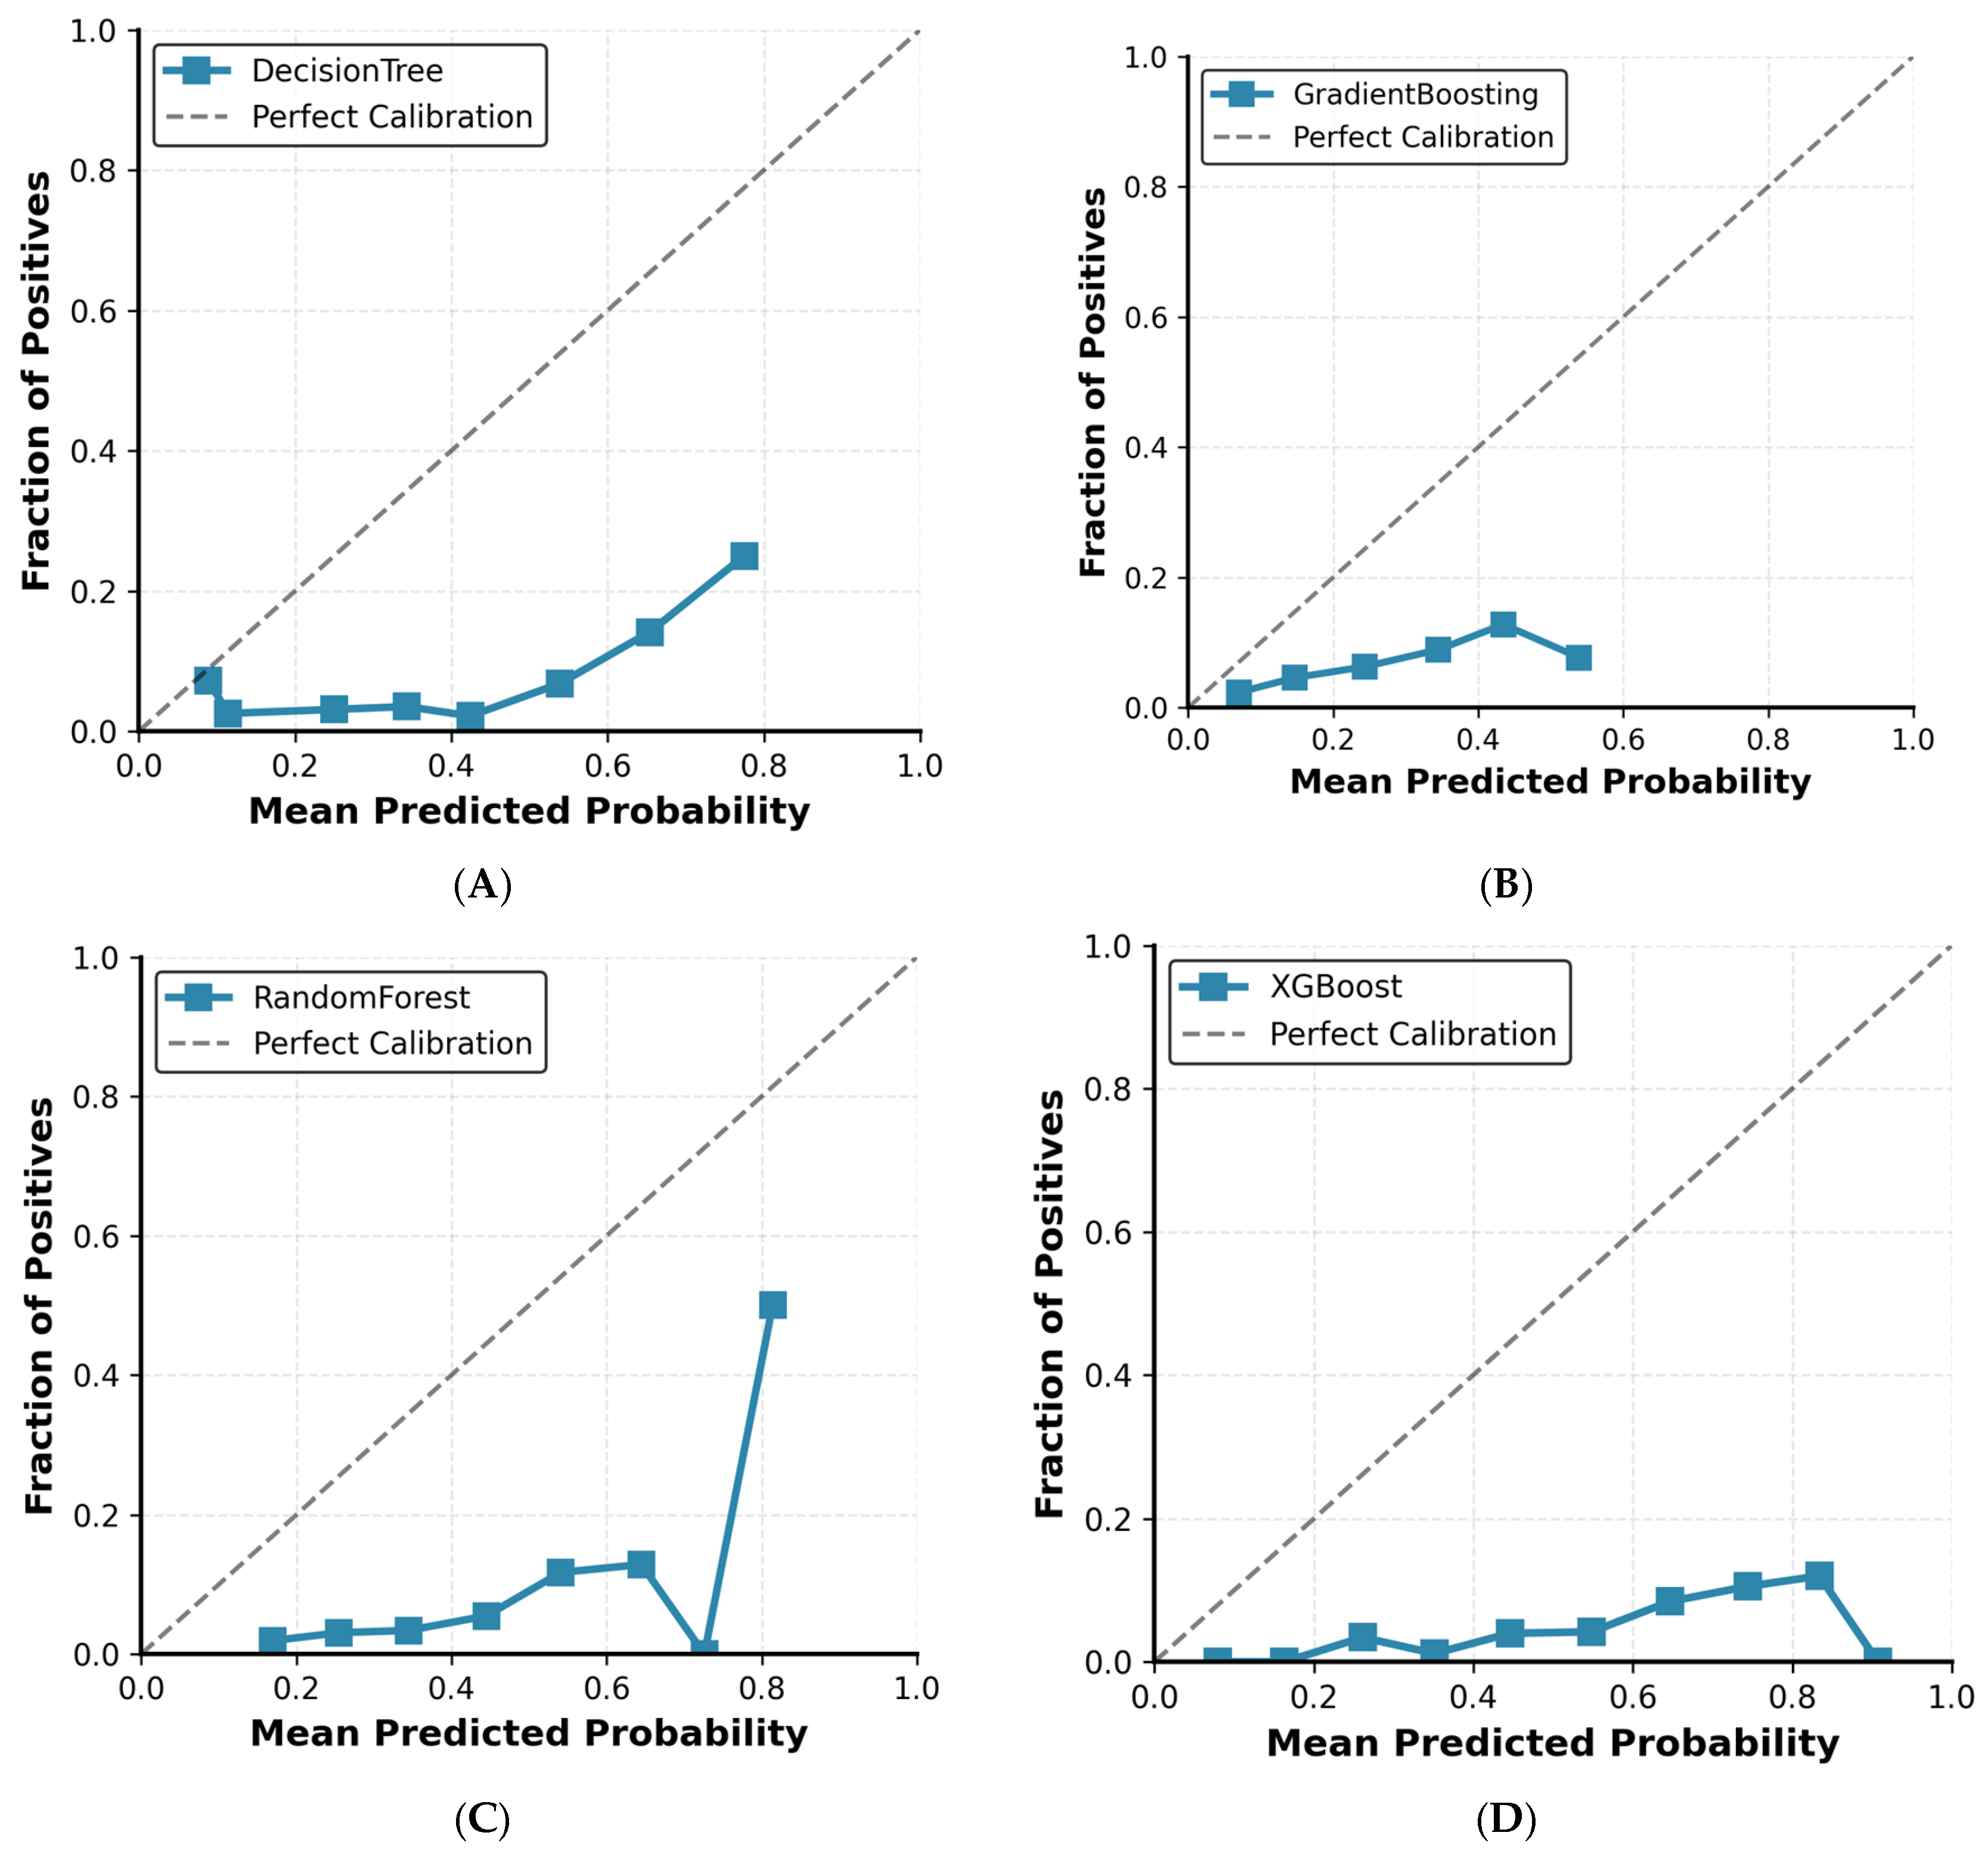
When calibration was examined, substantial differences in the accuracy of predicted probabilities across models were evaluated. GB showed the best calibration with the lowest error (0.226). DT followed with a calibration error of 0.318. RF demonstrated moderate calibration accuracy (0.382), while XGB had the highest error (0.454), indicating poorer alignment between predicted and observed probabilities despite its stronger discrimination performance. These results suggest that GB produced the most well-calibrated probability estimates.
The performance tradeoffs among the four models were also assessed. XGB reached the highest ROC AUC (0.672) and PR AUC (0.095), but this came with lower specificity compared to RF. RF showed a more balanced profile overall, with higher sensitivity (75.2%), moderate specificity (49.3%), and the highest ROC AUC value (0.673). GB and DT produced lower sensitivity, precision, and PR AUC values, consistent with their weaker performance in earlier analyses. Taken together, RF offered the best balance of sensitivity, specificity, and discrimination in identifying asthma-like symptoms. Model performance rankings remained consistent across alternative class-imbalance handling strategies, indicating robustness to the choice of resampling or weighting method (see Supplementary Material SM S5).

4. Discussion

This study simulated the impact of common cleaning products in laboratory and medical environments on the development of asthma-like symptoms. By applying machine learning models, notably Random Forest (RF), significant associations were identified between exposure to chemicals such as hydrochloric acid and ammonia and the presence of respiratory symptoms in workers in the simulated dataset. Among the models tested, RF outperformed the other models, achieving the highest sensitivity and the strongest relative performance in identifying symptomatic cases. Consistent with prior occupational and environmental health studies, tree-based machine learning approaches have been shown to perform well for exposure-related risk modeling and worker response prediction, particularly in settings where complex, nonlinear relationships and limited real-world data constrain traditional analytic methods [12,13,14,15]. RF has been widely used in occupational health studies to evaluate outcomes related to noise, dust, and chemical irritants [12,31,34]. The strong performance observed in this study supports its feasibility for predicting health outcomes related to chemical exposures. This aligns with previous research, reinforcing RF’s potential for use in occupational health risk modeling, particularly in laboratory environments with chemical irritants. In addition to identifying high-risk chemicals, the study found that workplace types (e.g., hospital vs. common areas) also played a critical role in determining asthma risk. These findings contribute to a deeper understanding of how routine cleaning practices in laboratories and medical facilities could inadvertently facilitate the development of asthma-like symptoms, particularly among vulnerable workers exposed to high levels of irritants.
Despite these key findings, the design of this simulated experiment presents several limitations that suggest avenues for future research. The heavily imbalanced data, reflecting the rare prevalence of occupational asthma [33,35], constrained model techniques to fully disentangle more complex behavioral and environmental risk factors [1,2,32]. This highlights the need for further research using real-world data, which could better account for these interactions and improve model generalizability. Future studies could also explore more nuanced exposure data, including dose–response relationships or self-reported survey data [7,36], to better capture gradations of risk and enhance model sensitivity [34]. Moreover, chemical exposures were modeled as binary indicators, which simplifies real-world variation in dose, frequency, and duration and may limit occupational specificity in applied settings. Additionally, the low precision observed in this study highlights the potential cost of false positives, suggesting that use of such models for safety monitoring could result in unnecessary interventions or inefficient allocation of resources if applied without further calibration or supporting data.
This study presents an exploratory tool for evaluating chemical exposure risks in laboratory environments, emphasizing its potential as a framework for future research and the integration of machine learning models into occupational health and safety monitoring. This framework could be used to implement predictive models that identify high-risk workers in real-time, guiding safety interventions such as ventilation improvements or adjusted cleaning protocols. By identifying key chemical irritants, the research offers actionable insights that can directly inform lab safety protocols, particularly in areas where cleaning products are widely used. The findings underscore the need for regular monitoring of chemical exposures and suggest that predictive models could be incorporated into safety programs to better assess and mitigate health risks for laboratory workers. Extending this approach to other environmental health concerns, such as hazardous material handling, spills, or exposure to toxic substances, could further strengthen laboratory safety practices. Ultimately, integrating these insights into laboratory management could lead to improved occupational health standards and safer working conditions for researchers and staff.

Supplementary Materials

The following supporting information can be downloaded at: https://www.mdpi.com/article/10.3390/laboratories3010002/s1. Code S1: Python Code for Reproducibility of Asthma Risk Model. Figure S1: FP vs Recall Curve for the RandomForest Model across Various Thresholds. Table S1: Representative Threshold Operating Points for the RandomForest Model. Table S2: SHAP-Based Global Feature Importance for the Random Forest Model. Table S3: Model Performance Metrics Under Class Weighting and Oversampling Approaches.

Funding

This research received no external funding.

Institutional Review Board Statement

Not applicable.

Informed Consent Statement

Not applicable.

Data Availability Statement

No new data were created or analyzed during the study. The Python code used for the analysis is publicly available in the GitHub repository at https://github.com/h-hedman/healthcare-data-science/tree/main/rf_asthma_lab, accessed on 30 November 2025.

Conflicts of Interest

The author declares no conflicts of interest.

Abbreviations

The following abbreviations are used in this manuscript:
DTDecision tree
GBGradient Boosting
RFRandom Forest
XGBXGBoost

References

  1. Pralong, J.A.; Cartier, A. Review of Diagnostic Challenges in Occupational Asthma. Curr. Allergy Asthma Rep. 2017, 17, 1. [Google Scholar] [CrossRef] [PubMed]
  2. Vincent, M.J.; Parker, A.; Maier, A. Cleaning and asthma: A systematic review and approach for effective safety assessment. Regul. Toxicol. Pharmacol. 2017, 90, 231–243. [Google Scholar] [CrossRef]
  3. Walusiak-Skorupa, J.M.; Bernstein, J.A.; de Blay, F.; Dumas, O.; Ederlé, C.; Folletti, I.; Tarlo, S.M. Cleaning Agents. In Asthma in the Workplace; CRC Press: Boca Raton, FL, USA, 2021. [Google Scholar]
  4. Vizcaya, D.; Mirabelli, M.C.; Antó, J.-M.; Orriols, R.; Burgos, F.; Arjona, L.; Zock, J.-P. A workforce-based study of occupational exposures and asthma symptoms in cleaning workers. Occup. Environ. Med. 2011, 68, 914–919. [Google Scholar] [CrossRef] [PubMed]
  5. Simoneti, C.S.; Ferraz, E.; de Menezes, M.B.; Bagatin, E.; Arruda, L.K.; Vianna, E.O. Allergic sensitization to laboratory animals is more associated with asthma, rhinitis, and skin symptoms than sensitization to common allergens. Clin. Exp. Allergy 2017, 47, 1436–1444. [Google Scholar] [CrossRef] [PubMed]
  6. Arif, A.A.; Delclos, G.L.; Whitehead, L.W.; Tortolero, S.R.; Lee, E.S. Occupational exposures associated with work-related asthma and work-related wheezing among U.S. workers. Am. J. Ind. Med. 2003, 44, 368–376. [Google Scholar] [CrossRef]
  7. Cormier, M.; Lemière, C. Occupational asthma. Int. J. Tuberc. Lung Dis. 2020, 24, 8–21. [Google Scholar] [CrossRef]
  8. Fedoruk, M.J.; Bronstein, R.; Kerger, B.D. Ammonia exposure and hazard assessment for selected household cleaning product uses. J. Expo. Sci. Environ. Epidemiol. 2005, 15, 534–544. [Google Scholar] [CrossRef]
  9. Mattila, T.; Santonen, T.; Andersen, H.R.; Katsonouri, A.; Szigeti, T.; Uhl, M.; Wąsowicz, W.; Lange, R.; Bocca, B.; Ruggieri, F.; et al. Scoping Review—The Association between Asthma and Environmental Chemicals. Int. J. Environ. Res. Public Health 2021, 18, 1323. [Google Scholar] [CrossRef]
  10. Park, H.-J.; Lee, C.H.; Lee, J.-K.; Kim, D.K.; Lee, H.-W. Clinical remission at two years post-diagnosis of asthma and its association with clinical outcomes: A retrospective cohort study in asthma patients with maintenance inhaler therapy. Pulm. Pharmacol. Ther. 2025, 90, 102381. [Google Scholar] [CrossRef]
  11. Yeatts, K.; Sly, P.; Shore, S.; Weiss, S.; Martinez, F.; Geller, A.; Bromberg, P.; Enright, P.; Koren, H.; Weissman, D.; et al. A Brief Targeted Review of Susceptibility Factors, Environmental Exposures, Asthma Incidence, and Recommendations for Future Asthma Incidence Research. Environ. Health Perspect. 2006, 114, 634–640. [Google Scholar] [CrossRef]
  12. Rahmiani Iranshahi, M.; Aliabadi, M.; Golmohammadi, R.; Soltanian, A.; Babamiri, M. Empirical prediction model of psychophysiological responses of workers with respect to noise exposure based on random forest. Noise Vib. Worldw. 2022, 53, 290–299. [Google Scholar] [CrossRef]
  13. Stoia, M.; Kurtanjek, Z.; Oancea, S. Reliability of a decision-tree model in predicting occupational lead poisoning in a group of highly exposed workers. Am. J. Ind. Med. 2016, 59, 575–582. [Google Scholar] [CrossRef] [PubMed]
  14. Friesen, M.C.; Wheeler, D.C.; Vermeulen, R.; Locke, S.J.; Zaebst, D.D.; Koutros, S.; Pronk, A.; Colt, J.S.; Baris, D.; Karagas, M.R.; et al. Combining Decision Rules from Classification Tree Models and Expert Assessment to Estimate Occupational Exposure to Diesel Exhaust for a Case-Control Study. Ann. Occup. Hyg. 2016, 60, 467–478. [Google Scholar] [CrossRef] [PubMed][Green Version]
  15. Wheeler, D.C.; Archer, K.J.; Burstyn, I.; Yu, K.; Stewart, P.A.; Colt, J.S.; Baris, D.; Karagas, M.R.; Schwenn, M.; Johnson, A.; et al. Comparison of Ordinal and Nominal Classification Trees to Predict Ordinal Expert-Based Occupational Exposure Estimates in a Case–Control Study. Ann. Occup. Hyg. 2015, 59, 324–335. [Google Scholar] [CrossRef]
  16. Eggerth, D.E.; Ortiz, B.; Keller, B.M.; Flynn, M.A. Work experiences of Latino building cleaners: An exploratory study. Am. J. Ind. Med. 2019, 62, 600–608. [Google Scholar] [CrossRef]
  17. Speiser, E.; Pinto Zipp, G.; DeLuca, D.A.; Paula Cupertino, A.; Arana-Chicas, E.; Gourna Paleoudis, E.; Bethea, T.N.; Kligler, B.; Cartujano-Barrera, F. Environmental Health Needs Among Latinas in Cleaning Occupations: A Mixed Methods Approach. Environ. Health Insights 2022, 16, 11786302221100045. [Google Scholar] [CrossRef]
  18. Hu, L.; Li, L. Using Tree-Based Machine Learning for Health Studies: Literature Review and Case Series. Int. J. Environ. Res. Public Health 2022, 19, 16080. [Google Scholar] [CrossRef]
  19. Kern, C.; Klausch, T.; Kreuter, F. Tree-based Machine Learning Methods for Survey Research. Surv. Res. Methods 2019, 13, 73–93. [Google Scholar]
  20. de Ville, B. Decision trees. WIREs Comput. Stat. 2013, 5, 448–455. [Google Scholar] [CrossRef]
  21. Tyralis, H.; Papacharalampous, G.; Langousis, A. A Brief Review of Random Forests for Water Scientists and Practitioners and Their Recent History in Water Resources. Water 2019, 11, 910. [Google Scholar] [CrossRef]
  22. Bentéjac, C.; Csörgő, A.; Martínez-Muñoz, G. A comparative analysis of gradient boosting algorithms|Artificial Intelligence Review. Artif. Intell. Rev. 2021, 54, 1937–1967. [Google Scholar] [CrossRef]
  23. Chen, T.; Guestrin, C. XGBoost: A Scalable Tree Boosting System. In Proceedings of the 22nd ACM SIGKDD International Conference on Knowledge Discovery and Data Mining, San Francisco, CA, USA, 13–17 August 2016; Association for Computing Machinery: New York, NY, USA, 2016; pp. 785–794. [Google Scholar]
  24. Cai, F.; Xue, S.; Si, G.; Liu, Y.; Chen, X.; He, J.; Zhang, M. Prediction and validation of mild cognitive impairment in occupational dust exposure population based on machine learning. Ecotoxicol. Environ. Saf. 2024, 285, 117111. [Google Scholar] [CrossRef] [PubMed]
  25. Zheng, Z.; Si, Z.; Wang, X.; Meng, R.; Wang, H.; Zhao, Z.; Lu, H.; Wang, H.; Zheng, Y.; Hu, J.; et al. Risk Prediction for the Development of Hyperuricemia: Model Development Using an Occupational Health Examination Dataset. Int. J. Environ. Res. Public Health 2023, 20, 3411. [Google Scholar] [CrossRef] [PubMed]
  26. Takakura, Y.; Ravutla, S.; Kim, J.; Ikeda, K.; Kajiro, H.; Yajima, T.; Fujiki, J.; Boukouvala, F.; Realff, M.; Kawajiri, Y. Surrogate model optimization of vacuum pressure swing adsorption using a flexible metal organic framework with hysteretic sigmoidal isotherms. Int. J. Greenh. Gas Control 2024, 138, 104260. [Google Scholar] [CrossRef]
  27. Chawla, N.V.; Bowyer, K.W.; Hall, L.O.; Kegelmeyer, W.P. SMOTE: Synthetic Minority Over-sampling Technique. J. Artif. Intell. Res. 2002, 16, 321–357. [Google Scholar] [CrossRef]
  28. Wang, C.; Deng, C.; Wang, S. Imbalance-XGBoost: Leveraging weighted and focal losses for binary label-imbalanced classification with XGBoost. Pattern Recognit. Lett. 2020, 136, 190–197. [Google Scholar] [CrossRef]
  29. Vandenplas, O. Occupational Asthma: Etiologies and Risk Factors. Allergy Asthma Immunol. Res. 2011, 3, 157. [Google Scholar] [CrossRef]
  30. Burzykowski, T.; Geubbelmans, M.; Rousseau, A.-J.; Valkenborg, D. Validation of machine learning algorithms. Am. J. Orthod. Dentofac. Orthop. 2023, 164, 295–297. [Google Scholar] [CrossRef]
  31. Patton, A.N.; Medvedovsky, K.; Zuidema, C.; Peters, T.M.; Koehler, K. Probabilistic Machine Learning with Low-Cost Sensor Networks for Occupational Exposure Assessment and Industrial Hygiene Decision Making. Ann. Work Expo. Health 2022, 66, 580–590. [Google Scholar] [CrossRef]
  32. Anthropic. Claude (AI Language Model), version Sonnet 4.5; Anthropic PBC: San Francisco, CA, USA, 2025. Available online: https://claude.ai (accessed on 30 November 2025).
  33. Enilari, O.; Sinha, S. The Global Impact of Asthma in Adult Populations. Ann. Glob. Health 2019, 85, 2. [Google Scholar] [CrossRef]
  34. Koutsoukas, A.; St. Amand, J.; Mishra, M.; Huan, J. Predictive Toxicology: Modeling Chemical Induced Toxicological Response Combining Circular Fingerprints with Random Forest and Support Vector Machine. Front. Environ. Sci. 2016, 4, 11. [Google Scholar] [CrossRef]
  35. Song, P.; Adeloye, D.; Salim, H.; Dos Santos, J.P.; Campbell, H.; Sheikh, A.; Rudan, I. Global, regional, and national prevalence of asthma in 2019: A systematic analysis and modelling study. J. Glob. Health 2022, 12, 04052. [Google Scholar] [CrossRef]
  36. Mwanga, H.H.; Baatjies, R.; Jeebhay, M.F. Occupational risk factors and exposure–response relationships for airway disease among health workers exposed to cleaning agents in tertiary hospitals. Occup. Environ. Med. 2023, 80, 361–371. [Google Scholar] [CrossRef]
Figure 1. Calibration curves for each model: (A) Decision Tree, (B) Gradient Boosting, (C) Random Forest, and (D) XGBoost.
Laboratories 03 00002 g001
Figure 2. Confusion matrices for each model: (A) Decision Tree, (B) Random Forest, (C) Gradient Boosting, and (D) XGBoost.
Laboratories 03 00002 g002
Figure 3. ROC curves for Decision Tree, Random Forest, Gradient Boosting, and XGBoost, with AUC values displayed for each model. The dashed line represents random performance (AUC = 0.5).
Laboratories 03 00002 g003
Figure 4. Precision–Recall curves for Decision Tree, Random Forest, Gradient Boosting, and XGBoost, with Average Precision (AP) values displayed for each model. The dashed line represents the baseline performance.
Laboratories 03 00002 g004
Figure 5. Comparison of model performance across multiple metrics: (A) Recall (Sensitivity), (B) Precision, (C) F1-Score, and (D) PR-AUC. The values for each model (Decision Tree, Random Forest, Gradient Boosting, and XGBoost) are displayed above the respective bars.
Laboratories 03 00002 g005
Table 1. Comparison of key demographic, occupational, and exposure variables reported from the original study [4] and the corresponding values applied in the simulated cohort.
MetricOriginal Study [4]
Sex
 Female82%
 Male18%
Age
 Mean45
 SD10
Smoking Status
 Current30%
 Former10%
 Never60%
Chemical Exposure
 Bleach78%
 Degreasers76%
 Multipurpose cleaners75%
 Glass cleaners74%
 Perfumed products72%
 Air fresheners70%
 Hydrochloric acid67%
 Ammonia66%
 Wax57%
 Solvents49%
 Carpet cleaners45%
Prevalence of Asthma-Like Symptoms10–12%
Table 2. Demographic, workplace, and exposure characteristics of the simulated dataset, including the observed frequency of asthma-like symptoms.
MetricObserved Value
Sex
 Female82.25%
 Male17.75%
Age (years)
 Mean44.93
 SD9.95
Smoking status
 Never60.06%
 Former9.83%
 Current30.12%
Foreign-born30.16%
Workplace type
 Home28.18%
 Common areas24.93%
 Hospital23.78%
 School4.96%
 Other healthcare3.21%
Chemical Exposures
 Hydrochloric acid10.18%
 Ammonia15.46%
 Degreasers18.09%
 Multipurpose cleaners39.44%
 Wax10.36%
Asthma-like symptoms5.12%
Table 3. Performance comparison of four classifiers—Decision Tree (DT), Random Forest (RF), Gradient Boosting (GB), and XGBoost (XGB)—based on sensitivity, specificity, precision, F1-score, ROC AUC, and PR AUC.
ModelSensitivitySpecificityPrecisionF1-ScoreROC-AUCPR-AUC
Decision Tree71.2%42.0%6.2%11.4%0.6310.096
Random Forest75.2%49.3%7.4%13.4%0.6730.1
Gradient Boosting73.9%44.3%6.7%12.2%0.6390.087
XGBoost79.7%40.9%6.8%12.5%0.6720.095
Disclaimer/Publisher’s Note: The statements, opinions and data contained in all publications are solely those of the individual author(s) and contributor(s) and not of MDPI and/or the editor(s). MDPI and/or the editor(s) disclaim responsibility for any injury to people or property resulting from any ideas, methods, instructions or products referred to in the content.