Article

Continuous Improvement of an Exit Exam Tool for the Effective Assessment of Student Learning in Engineering Education

Department of Civil and Environmental Engineering, United Arab Emirates University, Al Ain P.O. Box 15551, United Arab Emirates
*
Author to whom correspondence should be addressed.
Trends High. Educ. 2024, 3(3), 560-577; https://doi.org/10.3390/higheredu3030033
Submission received: 3 May 2024 / Revised: 24 June 2024 / Accepted: 28 June 2024 / Published: 12 July 2024

Abstract

:
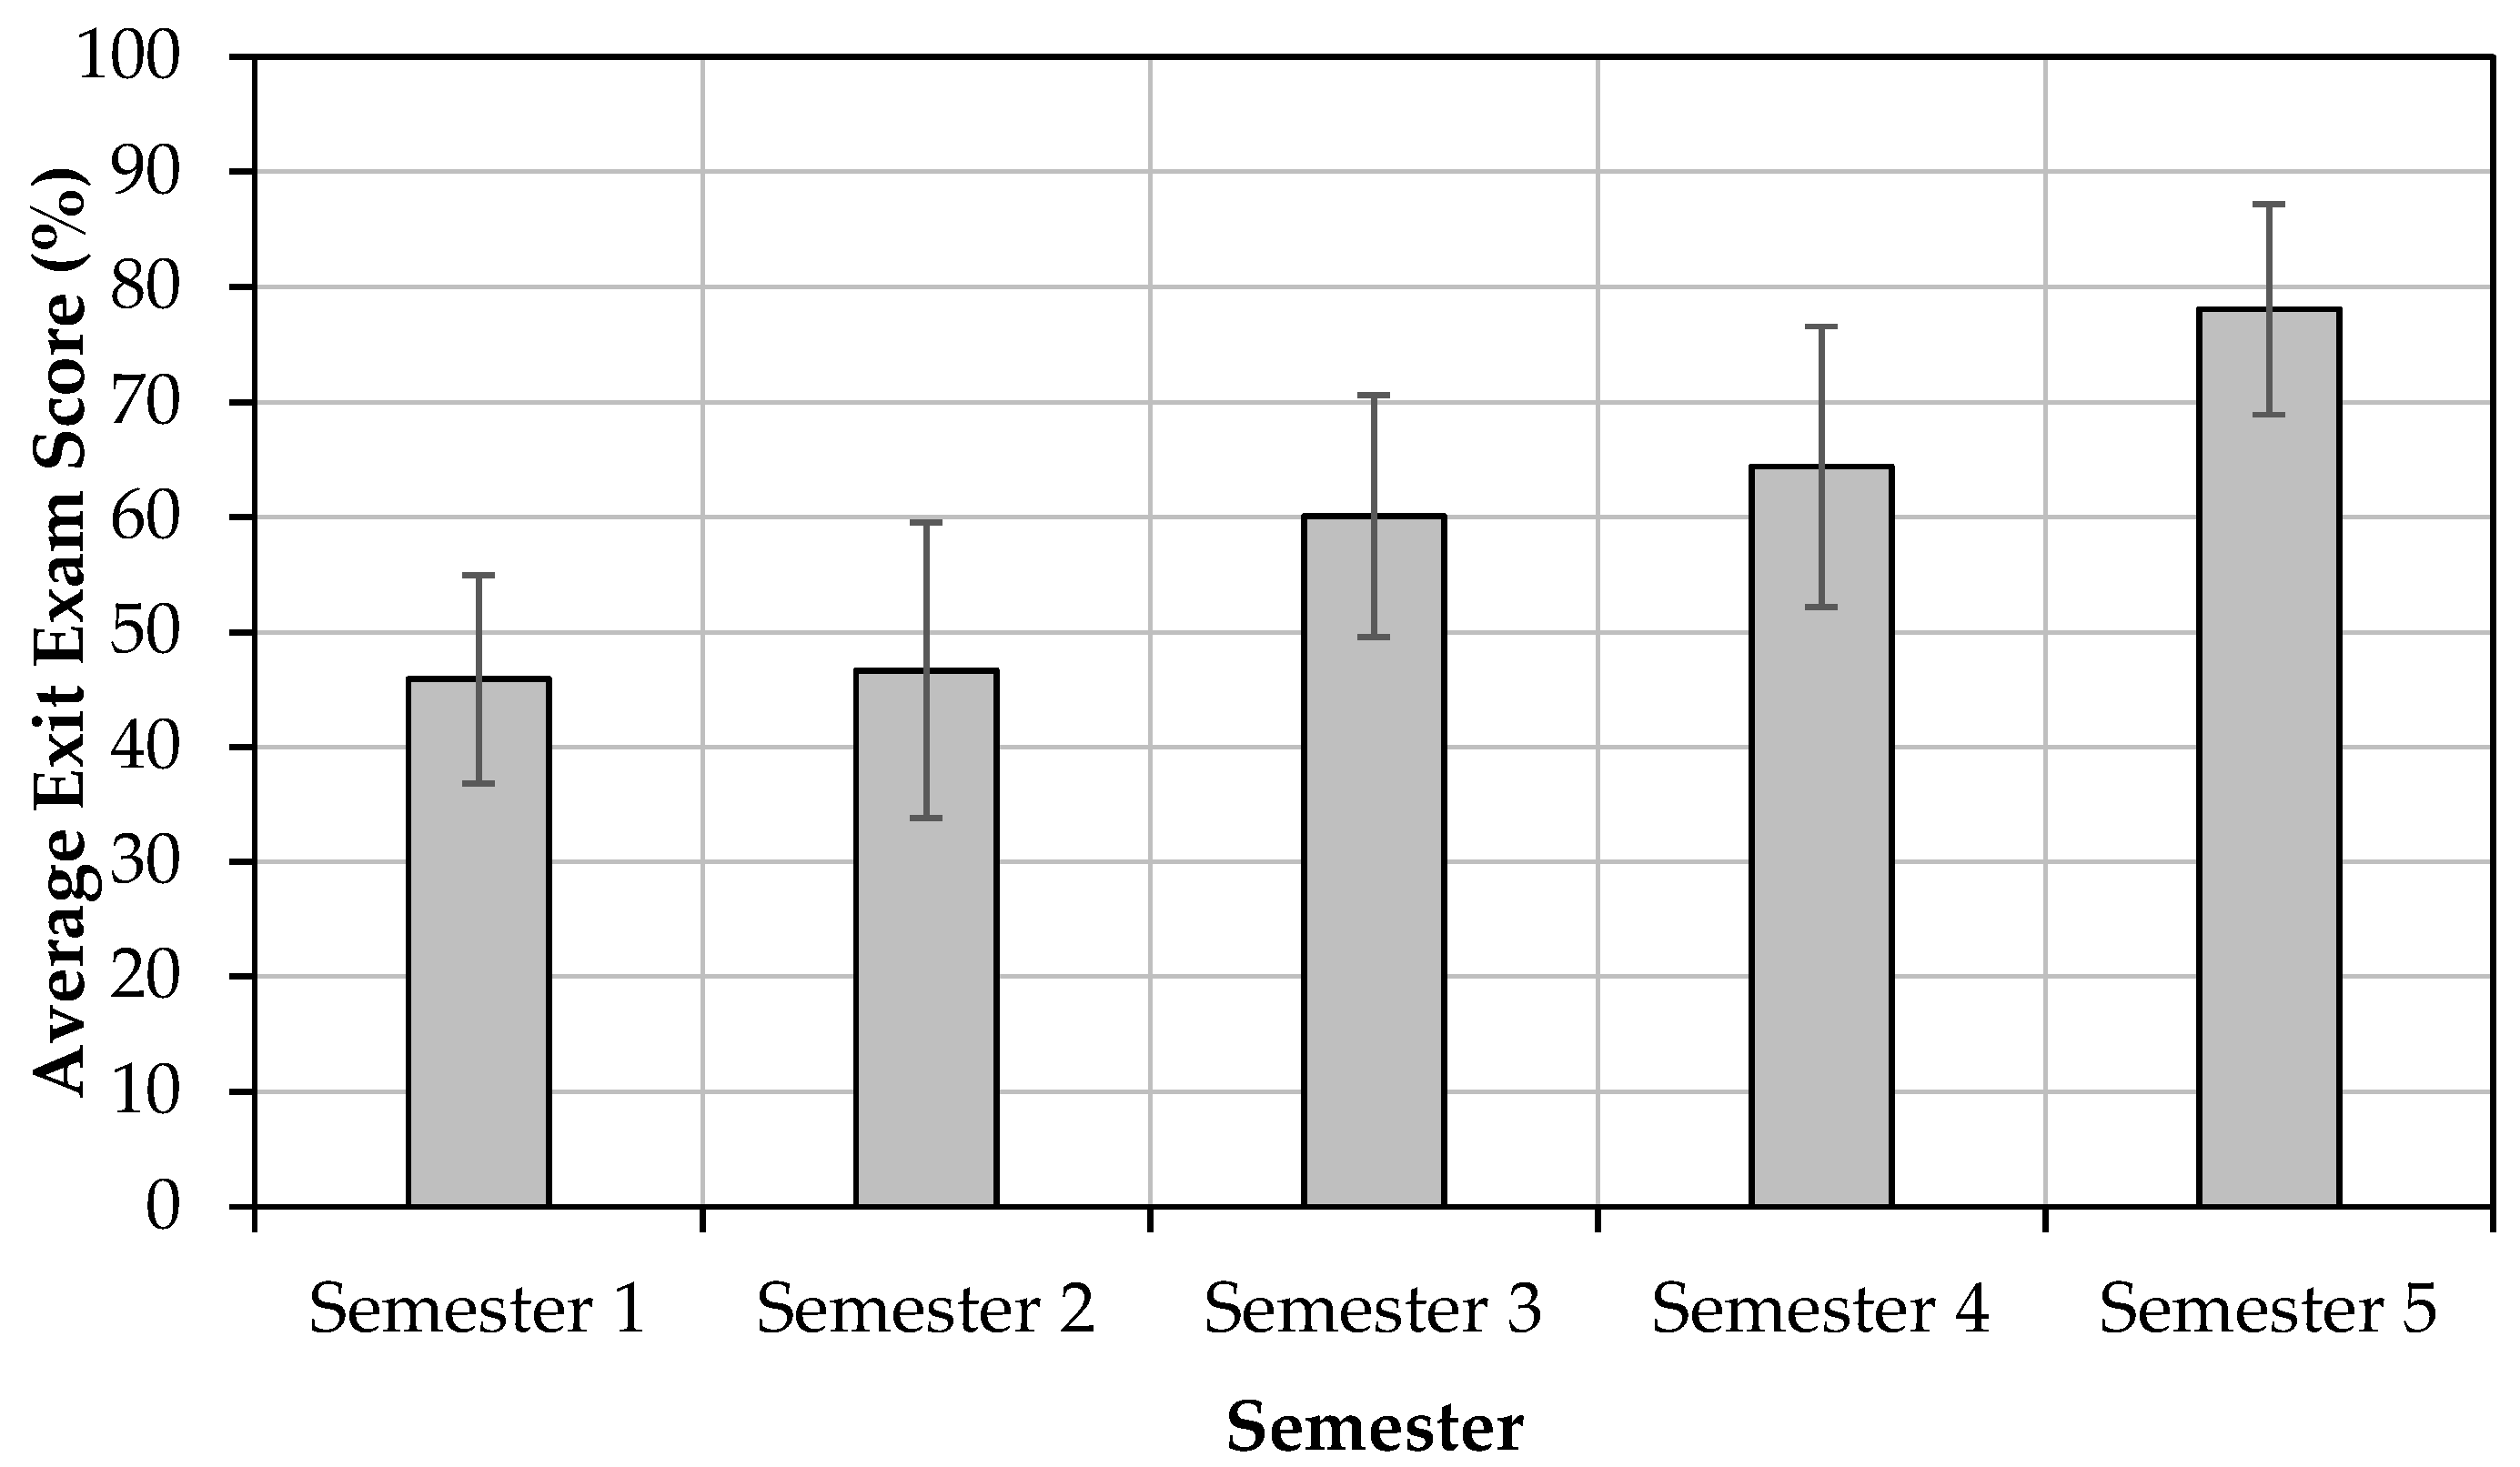
The exit exam is a comprehensive assessment tool that provides direct evidence of student learning and the level of achievement of program learning outcomes (PLOs). Initial offerings of exit exams showed poor student performance and little correlation to their coursework grades. Accordingly, a continuous improvement process was prompted, including planning, implementing, monitoring, responding, and reporting. In this context, four remedial actions were applied to the exit exam over five semesters, including distributing practice questions, followed by rescheduling exams, simplifying and distributing questions, and increasing the exit exam’s weight contribution. This study explores the effectiveness of these remedial actions to assess and improve student learning and the attainment of PLOs. The performance data indicated significant improvements in exit exam scores, with the average exit exam score increasing from 47% to 78%. Students’ exit exam performances aligned with their grade point averages (GPAs, %), evidenced by a reduction in the variation between the two parameters from 39.2% to 0.6%. Furthermore, the study confirmed that the exit exam, through continuous improvement and targeted remedial strategies, improved the attainment level of PLOs to achieve the target of 70%. The study highlights how strategic interventions can lead to significant enhancements in individual and cohort performances, providing a model for other engineering programs aiming to boost student outcomes and align with accreditation standards and student needs.

1. Introduction

1.1. Background

At the turn of the century, innovative teaching methods and pedagogical approaches in engineering education have expanded, driven by higher education institutions and accrediting organizations like the Accreditation Board for Engineering and Technology (ABET), adopting the Engineering Criteria 2000 (EC 2000) [1,2]. The evolving landscape has emphasized aspects like innovation and entrepreneurship skills. These pose challenges for institutions in meeting accreditation standards and industry needs. In response, higher education institutions face two main challenges: designing learning approaches for measurable student outcomes and creating assessment tools for student achievements [3,4,5]. Various pedagogical methods, including cooperative learning and competency-based learning, have been implemented successfully, particularly in engineering education [6,7]. However, the development of systematic and valid outcome-based assessment tools, especially for transferable skills like communication and teamwork, remains a complex task [7,8].
The paradigm shift to outcome-based assessments (OBAs) required a substantial cultural and mindset transformation among engineering faculty and students [9,10]. Outcome-based assessments (OBAs) are now widely accepted in engineering education and have expanded into other fields, such as entrepreneurship [11]. To adopt OBAs, higher education institutions must first unify all intended learning outcomes and align them with assessment tools and teaching methods [12]. Traditional tools, while aligned with quantitative reasoning, meet less than half of the ABET’s criteria [13]. Recent research has focused on creating valid tools for assessing intangible outcomes like effective communication, ethical responsibility, teamwork, and independent learning [8,11]. However, many existing tools evaluate course-level outcomes, needing further alignment with program learning outcomes (PLOs) for a thorough student evaluation. This challenge has led to the development, validation, and standardization of assessment instruments to directly measure students’ attainment of PLOs at higher education institutions and other organizations.
The exit exam stands out as the main tool for directly assessing student learning and outcomes (PLOs) [14,15,16,17,18,19]. Whether externally administered by institutions like the National Council of Examiners for Engineers and Surveyors (NCEES) or internally developed by higher education institutions and program coordinators, these exams play a crucial role in validating graduates’ discipline competence [20,21,22,23,24]. While external exit exams are standardized and cover broad disciplines, their misalignment with specific program learning outcomes may lead to lower student performance compared to internal exams, which may significantly influence the practice of program instructors, leading to a narrowing of planning and assessment practices [24,25]. Internal exit exams focus on learning outcomes rather than approaches and offer a valuable summative evaluation at the program’s conclusion, thereby highlighting areas in the curriculum where students may need improvement [16,26,27].
Exit exams play a vital role in program assessment and are essential for preparing graduates for their career paths. However, concerns about their validity as direct measures of program learning outcomes have been voiced [14,18,25,28]. Even when internally administered, exit exams often assess specific skills rather than transferable ones [17,19,28]. A crucial factor is designing outcome-based exams with multiple clusters and levels to ensure a valid assessment of students’ program learning outcomes. The internal exit exam at the concerned institution is designed to gauge students’ attainment of the civil engineering program learning outcomes. The exam is administered by the Department of Civil and Environmental Engineering, and the exam’s results are critical in assessing the abilities of students to retain and use fundamental information related to the civil engineering discipline. Initially, civil engineering students performed poorly on the internal exit exam, showing little correlation with their coursework grades. This prompted the start of a continuous improvement process, including planning, implementing, monitoring, responding, and reporting.
The objectives of this study are twofold: Firstly, the study evaluates the impact of implementing four structural and administrative remedial actions across five semesters on students’ performance in the exit exam. This is conducted through an analysis of student and discipline scores, with a calculation of the normalized score (NS) to gauge the deviation in student performances within the same cohort. Secondly, the study assesses the improvement of the exit exam as a direct measure of student attainment of PLOs in a Civil Engineering program. Such an assessment involved comparing and correlating the exit exam scores with students’ performances in related courses and their overall grade point averages (GPAs). In addition, a performance score (PS) was calculated to limit the influence of variability in the instruction of courses and randomization in exit exam questions.

1.2. Research Significance

This self-assessment aims to identify the utility of exit exam results in continually improving the program and effectively representing and advancing student learning through the implementation of remedial actions. The role of the exit exam in the broader context of OBA is also explored, focusing on how specific changes can enhance its utility as a learning tool to demonstrate and advance student learning, thus meeting the benchmark of innovation and performance standards. Additionally, the findings of the present study demonstrate how the exit exam can demonstrate and improve student learning to meet performance standards. This study underscores the importance of integrating a comprehensive research component into assessment initiatives to facilitate effective planning, analysis, and response. This investigation elucidates successful continuous improvement processes. Such insights are crucial for strategically positioning assessment innovations within the broader framework of quality assurance (QA) and quality enhancement (QE).

2. Materials and Methods

2.1. Exit Exam Description

The exit examination is an essential assessment tool administered to graduating undergraduate students in their final semester of the Civil Engineering (CE) program within the College of Engineering (COE). It serves as a mechanism for the department and college to provide evidence of adherence to the ABET’s accountability standards. Additionally, the exit exam is a comprehensive evaluation tool that measures the students’ performances, competencies, and degrees of accomplishment of specific PLOs upon graduation. While such information could be inferred from students’ course grades, the exit exam offers insights into students’ aptitudes and proficiencies at the program level instead of the course level. Due to its importance, all undergraduate students must take the exit exam, which counts for 5% of the final capstone graduation project course grade.
The first exit exam was introduced in the Fall 2008 semester, as shown in the timeline of events related to the exit exam in Figure 1. It has been typically organized during the Fall and Spring semesters of each academic year. Initially administered in a paper-based format, the exit exam transitioned to a computer-based assessment delivered through an online Learning Management System (LMS) starting in the Fall 2014 semester. However, in the Fall 2018 semester, a redesigned structure and format for the exit exam were introduced to improve the overall exit exam experience and more accurately represent the performance and achievements of graduating students.
The new exit exam structure (i.e., starting Fall 2018) was designed in line with the mandatory courses within the CE program. It consisted of 50 multiple-choice or true/false questions to be completed within 60 min. The questions were extracted from a pool of over 500 questions, randomized, and presented to students one question at a time. They mainly highlighted the key concepts and fundamental knowledge attained by students throughout their undergraduate studies. Furthermore, the exit exam questions were categorized into seven disciplines reflecting the Civil Engineering program’s courses. These disciplines are structures and materials (SM), geotechnical engineering (GE), highway and transportation (HT), construction management (CM), environmental engineering (EE), surveying and geomatics (SG), and water resources (WR).
Despite limited chances for dishonest behaviors due to question randomization, additional measures were implemented to prevent it. For instance, the exam was only allowed to be taken once, in one sitting, and there was no possibility of changing the answer after submission. Additionally, no books, class notes, smart devices, pens, papers, calculators, or access to webpages were permitted during the exam. Nevertheless, an on-screen calculator was allowed to aid students with the calculations. Additionally, a proctoring committee, not including the authors, enforced strict measures to prevent cheating during the examination. It is also worth noting that exit exam was administered online from Spring 2020 to Fall 2021 due to the COVID-19 pandemic. Still, a strict online proctoring tool that utilized the camera and microphone was employed in these semesters. Further details on the exit exam structure and design can be found in earlier research [15].

2.2. Remedial Actions

In the first part of this comprehensive study [15], it was reported that the students’ exit exam grades diverged from their GPAs and did not accurately represent their performance and achievements. Poor exit exam results stemmed from various factors: student preparedness, exam timing, lack of motivation and incentives, and the exam setting. Accordingly, the study suggested adopting different remedial actions to improve students’ performances in the exit exam, including periodical updating and increasing the number of exit exam questions, increasing the exit exam’s contribution to students’ GPAs, enforcing a passing grade in the exit exam to graduate, adding results to students’ manuscripts, offering tutorial sessions, and providing sample questions to students [15]. After deliberate discussion among the department faculty members and exit exam committee members, it was decided to implement several remedial actions sequentially and compoundedly over four semesters, starting from the Spring 2020 semester. In this context, the Fall 2019 semester served as a benchmark.
As shown in Figure 1, the first remedial action was applied in the Spring 2020 semester. It comprised three components: (i) the distribution of specific questions from the exit exam pool to students to familiarize them with the format and types of questions; (ii) rescheduling the exit exam to be 4 weeks prior to the final exam period to avoid pressure and stress buildup during this period; and (iii) removing questions pertaining to course materials that were not covered by the time of administering the exit exam.
In Fall 2020, the second remedial action replaced lengthy and unclear questions with shorter, clearer ones. This was carried out through a rigorous and extensive revision of the entire pool of questions by the exit exam committee, including faculty members in the different civil engineering disciplines.
The third remedial action was applied in Spring 2021. It involved increasing the contribution of the exit exam to the final grade of the capstone graduation project course from 5% to 10%. Such a change in the weight of the exit exam was based on students’ responses to a survey on how to motivate them to prepare better for the exit exam.
As the fourth and final remedial action, the entire pool of 500+ questions for the exit exam was distributed to the students in Fall 2021. This ensured that students would familiarize themselves with the multiple-choice and true/false questions comprising the exit exam. Indeed, typical questions in regular courses are essay type or problem solving, for which students may receive partial credit for correct steps. Contrarily, the questions in the exit exam received either full credit or no credit at all (i.e., correct or not). Nevertheless, it should be noted that the remedial actions were compounded over the consecutive semesters. This means that once introduced and applied, remedial actions were not reversed in subsequent semesters. Accordingly, the last semester implemented all four remedial actions.

2.3. Participants

The study was carried out over five semesters, spanning three academic years: 2019/2020, 2020/2021, and 2021/2022. These five semesters (i.e., Fall 2019, Spring 2020, Fall 2020, Spring 2021, and Fall 2021) were designated as Semesters 1 to 5, respectively. A total of 175 students took the exit exam during this period. Their distribution by semester is shown in Table 1. It is worth noting that the students’ ages ranged between 22 and 24 years, with 73% being female. Yet, categorization in the students’ results based on gender, age, ethnic origin, or nationality was not performed.
Furthermore, Table 1 presents the GPAs of students for each semester. This value (out of 100, i.e., %) is the average of all course grades at the time of graduation. To simplify the analysis, the GPA values were grouped into four ranges: <70%, 70–79%, 80–89%, and >90%. The average GPA ranged between 75.5% and 77.5%, with 66% to 83% of students having a GPA in the 70–79% range. Meanwhile, no student had a GPA below 70%, as graduation was contingent on having a GPA above 70%. Also, no student attained a GPA above 90%.

2.4. Statistical Data Analysis

The exit exam score, calculated as the percentage of correct answers out of 50 questions, was used to assess student performance. In addition to the score of every student, the semester average score (%) was recorded, starting in Fall 2019 (benchmark semester or Semester 1) until Fall 2021 (Semester 5).
To examine the impact of the remedial actions, the variation (i.e., improvement or decline) in the average exit exam score and its deviation from one semester to the other was calculated. Indeed, calculations either compared two consecutive semesters or referenced the benchmark semester (Fall 2019) before any remedial actions were implemented. In this regard, it is worth noting that the average exit exam score improvement could have been attributed to having students with higher GPAs and not with remedial action(s). As such, the exit exam score of each student was normalized against the GPA, as per Equation (1). The ratio was denoted as the consistency index, CI. The closer this ratio was to a value of “1.0”, the more representative the student’s performance in the exit exam was to that of the coursework. The CI was analyzed similarly to the average exit exam score mentioned earlier.
Furthermore, each student’s performance in the exit exam may have diverged from others within the same cohort (i.e., peers in the same semester). To evaluate this deviation, the exit exam score of each student was normalized against that of the cohort for each semester following Equation (2). The normalized score per semester was designated as NS.
An additional examination of each student’s performance was carried out using the performance score (PS), as per Equation (3). This index was calculated based on the average scores and GPAs per semester to evaluate each student’s performance compared to their GPA while reducing the effect of randomized questions in the exit exam and having different course instructors. This tool was adopted in past work to compare the grades of students in a computer- and paper-based exam [29]. It should be noted that the PS was calculated based on the average exit exam scores and GPAs of students per semester.
CI = Student   Exit   Exam   Score Student   GPA
NS = Student   Exit   Exam   Score     Average   Exit   Exam   Score Maximum   Exit   Exam   Score     Minimum   Exit   Exam   Score  
PS   ( % ) = ( Student   Exit   Exam   Score Average   Exit   Exam   Score Student   GPA Average GPA   ) × 100 %

3. Results

3.1. Exit Exam Grades

Figure 2 shows the average exit exam grades across the study semesters, with a benchmark score of 46% in the Fall 2019 semester. As remedial actions were implemented sequentially, the average increased over the five semesters. Nevertheless, it is worth noting that the remedial actions were compounded from one semester to the other. By Semester 5, all four remedial actions, shown in Figure 1, had been implemented.
To determine whether the difference in the average exit exam score was statistically significant or not, a t-test was carried out at a confidence of 95%. The null hypothesis was that the average exit exam scores of Semesters 2–5 were not different than that of the benchmark semester (Semester 1). In the analysis, the confidence interval and t-value were determined to confirm the variation. If the difference between the two average exit exam scores falls within the confidence interval, or if the t-value is between −2.201 and 2.201 (i.e., t0.025 from the t-distribution table), then the null hypothesis cannot be rejected (i.e., the two average exit exam scores are similar). Otherwise, the null hypothesis can be rejected, signifying that the two average exit exam scores are different.
The results show that there was no improvement in the average exit exam score after the first remedial action, i.e., giving practice questions to students, rescheduling the exit exam, and removing questions from uncovered course content, with the average being 47%. This is evidenced by the t-value of −0.29 and inability to reject the null hypothesis (i.e., average exit exam scores of Semesters 1 and 2 are similar), as shown in Table 2. In fact, the first major increase in the average was after applying the second remedial action, i.e., revising the questions for ambiguity and length. The average of Semester 3 reached 60%. In the following semester, the contribution of the exit exam to the graduation project course was increased from 5 to 10%. This remedial action had a limited impact on the average compared to Semester 3, with a slight increase to 64%. The last remedial action—giving students access to all exam questions—raised the average score in Semester 5 to 78%, confirming the effectiveness of these measures. Indeed, it is less likely that this improvement in the exit exam scores is a function of students’ quality of learning, as their GPAs across all semesters were less varied and ranged between 75.5% and 77.5%. These findings are confirmed by the t-values of Semesters 3, 4, and 5 (Table 2), which lead to rejection of the null hypothesis (i.e., average exit exam scores of Semesters 3, 4, and 5 are different from that of the benchmark semester).
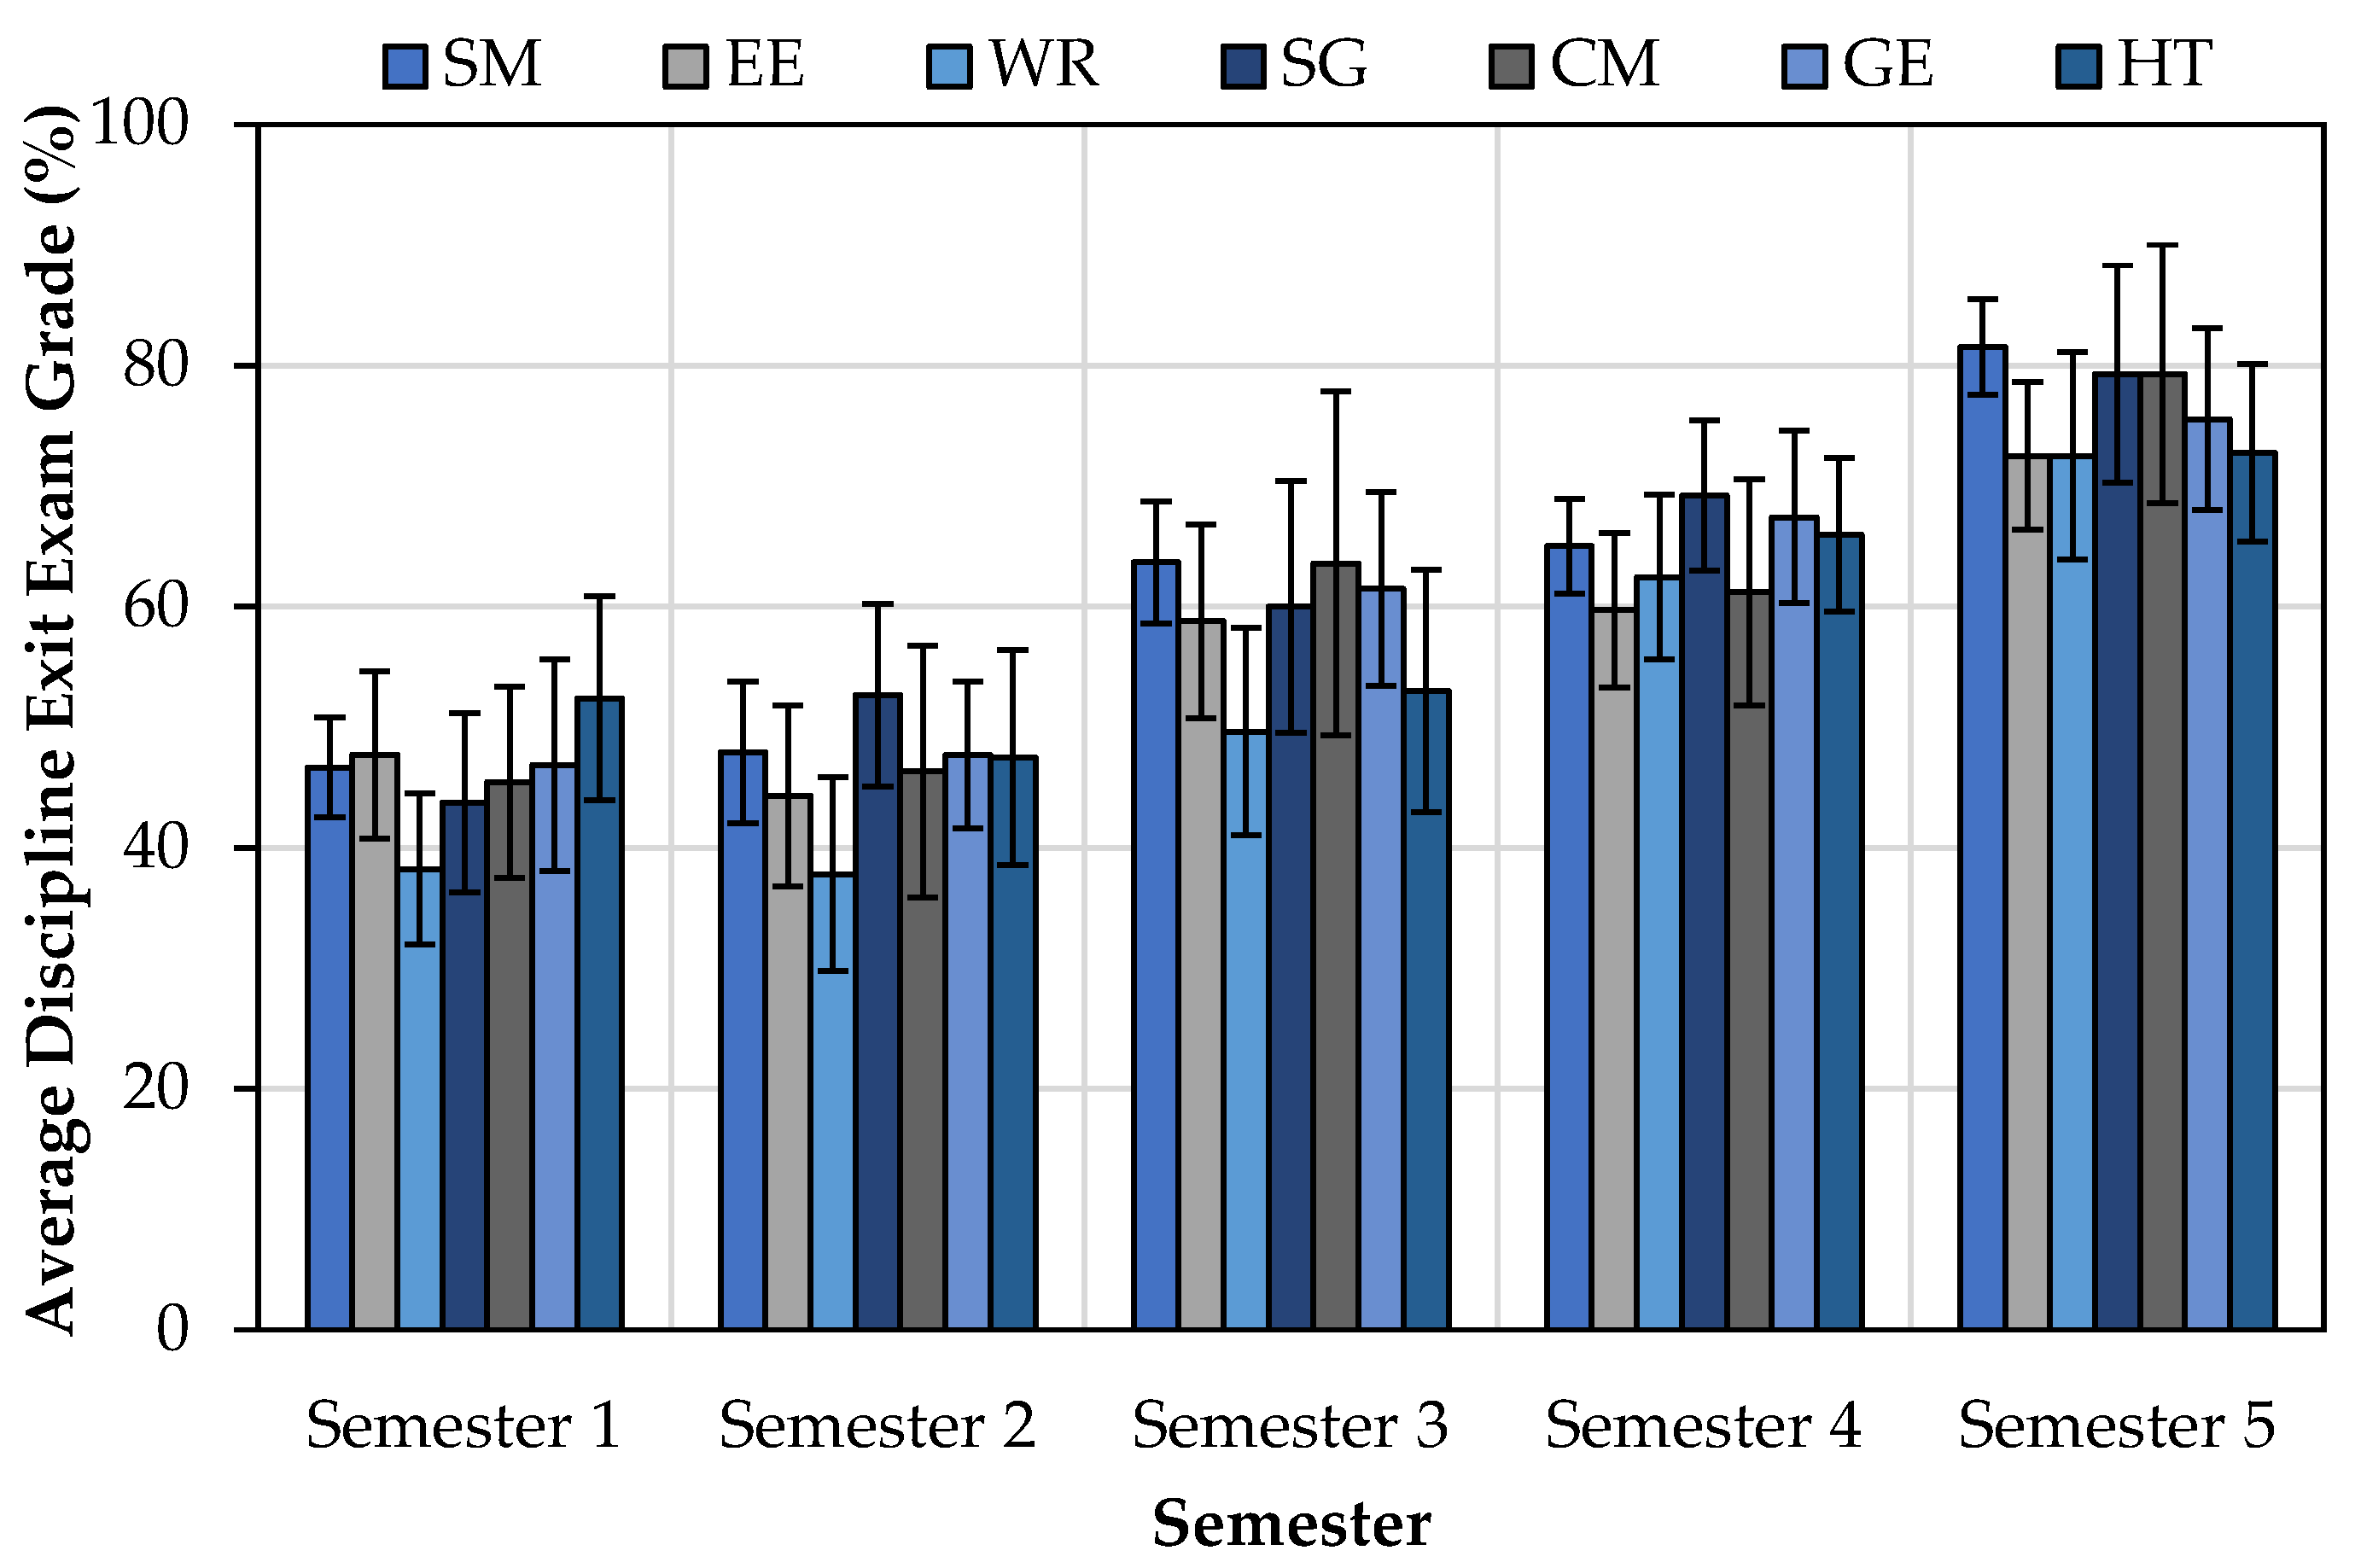
In a previous publication [15], the poor performance of students in the exit exam was associated with low scores in the WR discipline. Meanwhile, the SM-related courses had relatively high scores. As such, it would be valuable to explore how the students performed in the different disciplines subjected to the implemented remedial actions. Accordingly, Figure 3 shows the average students’ grades in each discipline over the studied semesters. Generally, students’ performances across all disciplines did not improve in Semester 2 after the implementation of the first remedial action. However, a significant improvement relative to the benchmark semester (Semester 1) was noticed in Semester 3 for almost all disciplines after the first two remedial actions were in place. This improvement ranged from 23% for EE to 40% for CM, while no improvement was observed in the HT area. On the other hand, the average performance of the students in the WR-related questions was the lowest in the first three semesters. Still, it improved significantly in Semesters 4 and 5. In Semester 4, the improvement in the students’ performances relative to the benchmark semester was obvious in all disciplines. It ranged from 25% for EE to 63% for WR, owing to the application of three remedial actions. In Semester 5, student performance improved across all disciplines after they were given access to the entire question pool, along with the previous three remedial actions. Thus, it is evident that the successive improvements in the students’ performances in the exit exam were in favor of all disciplines.
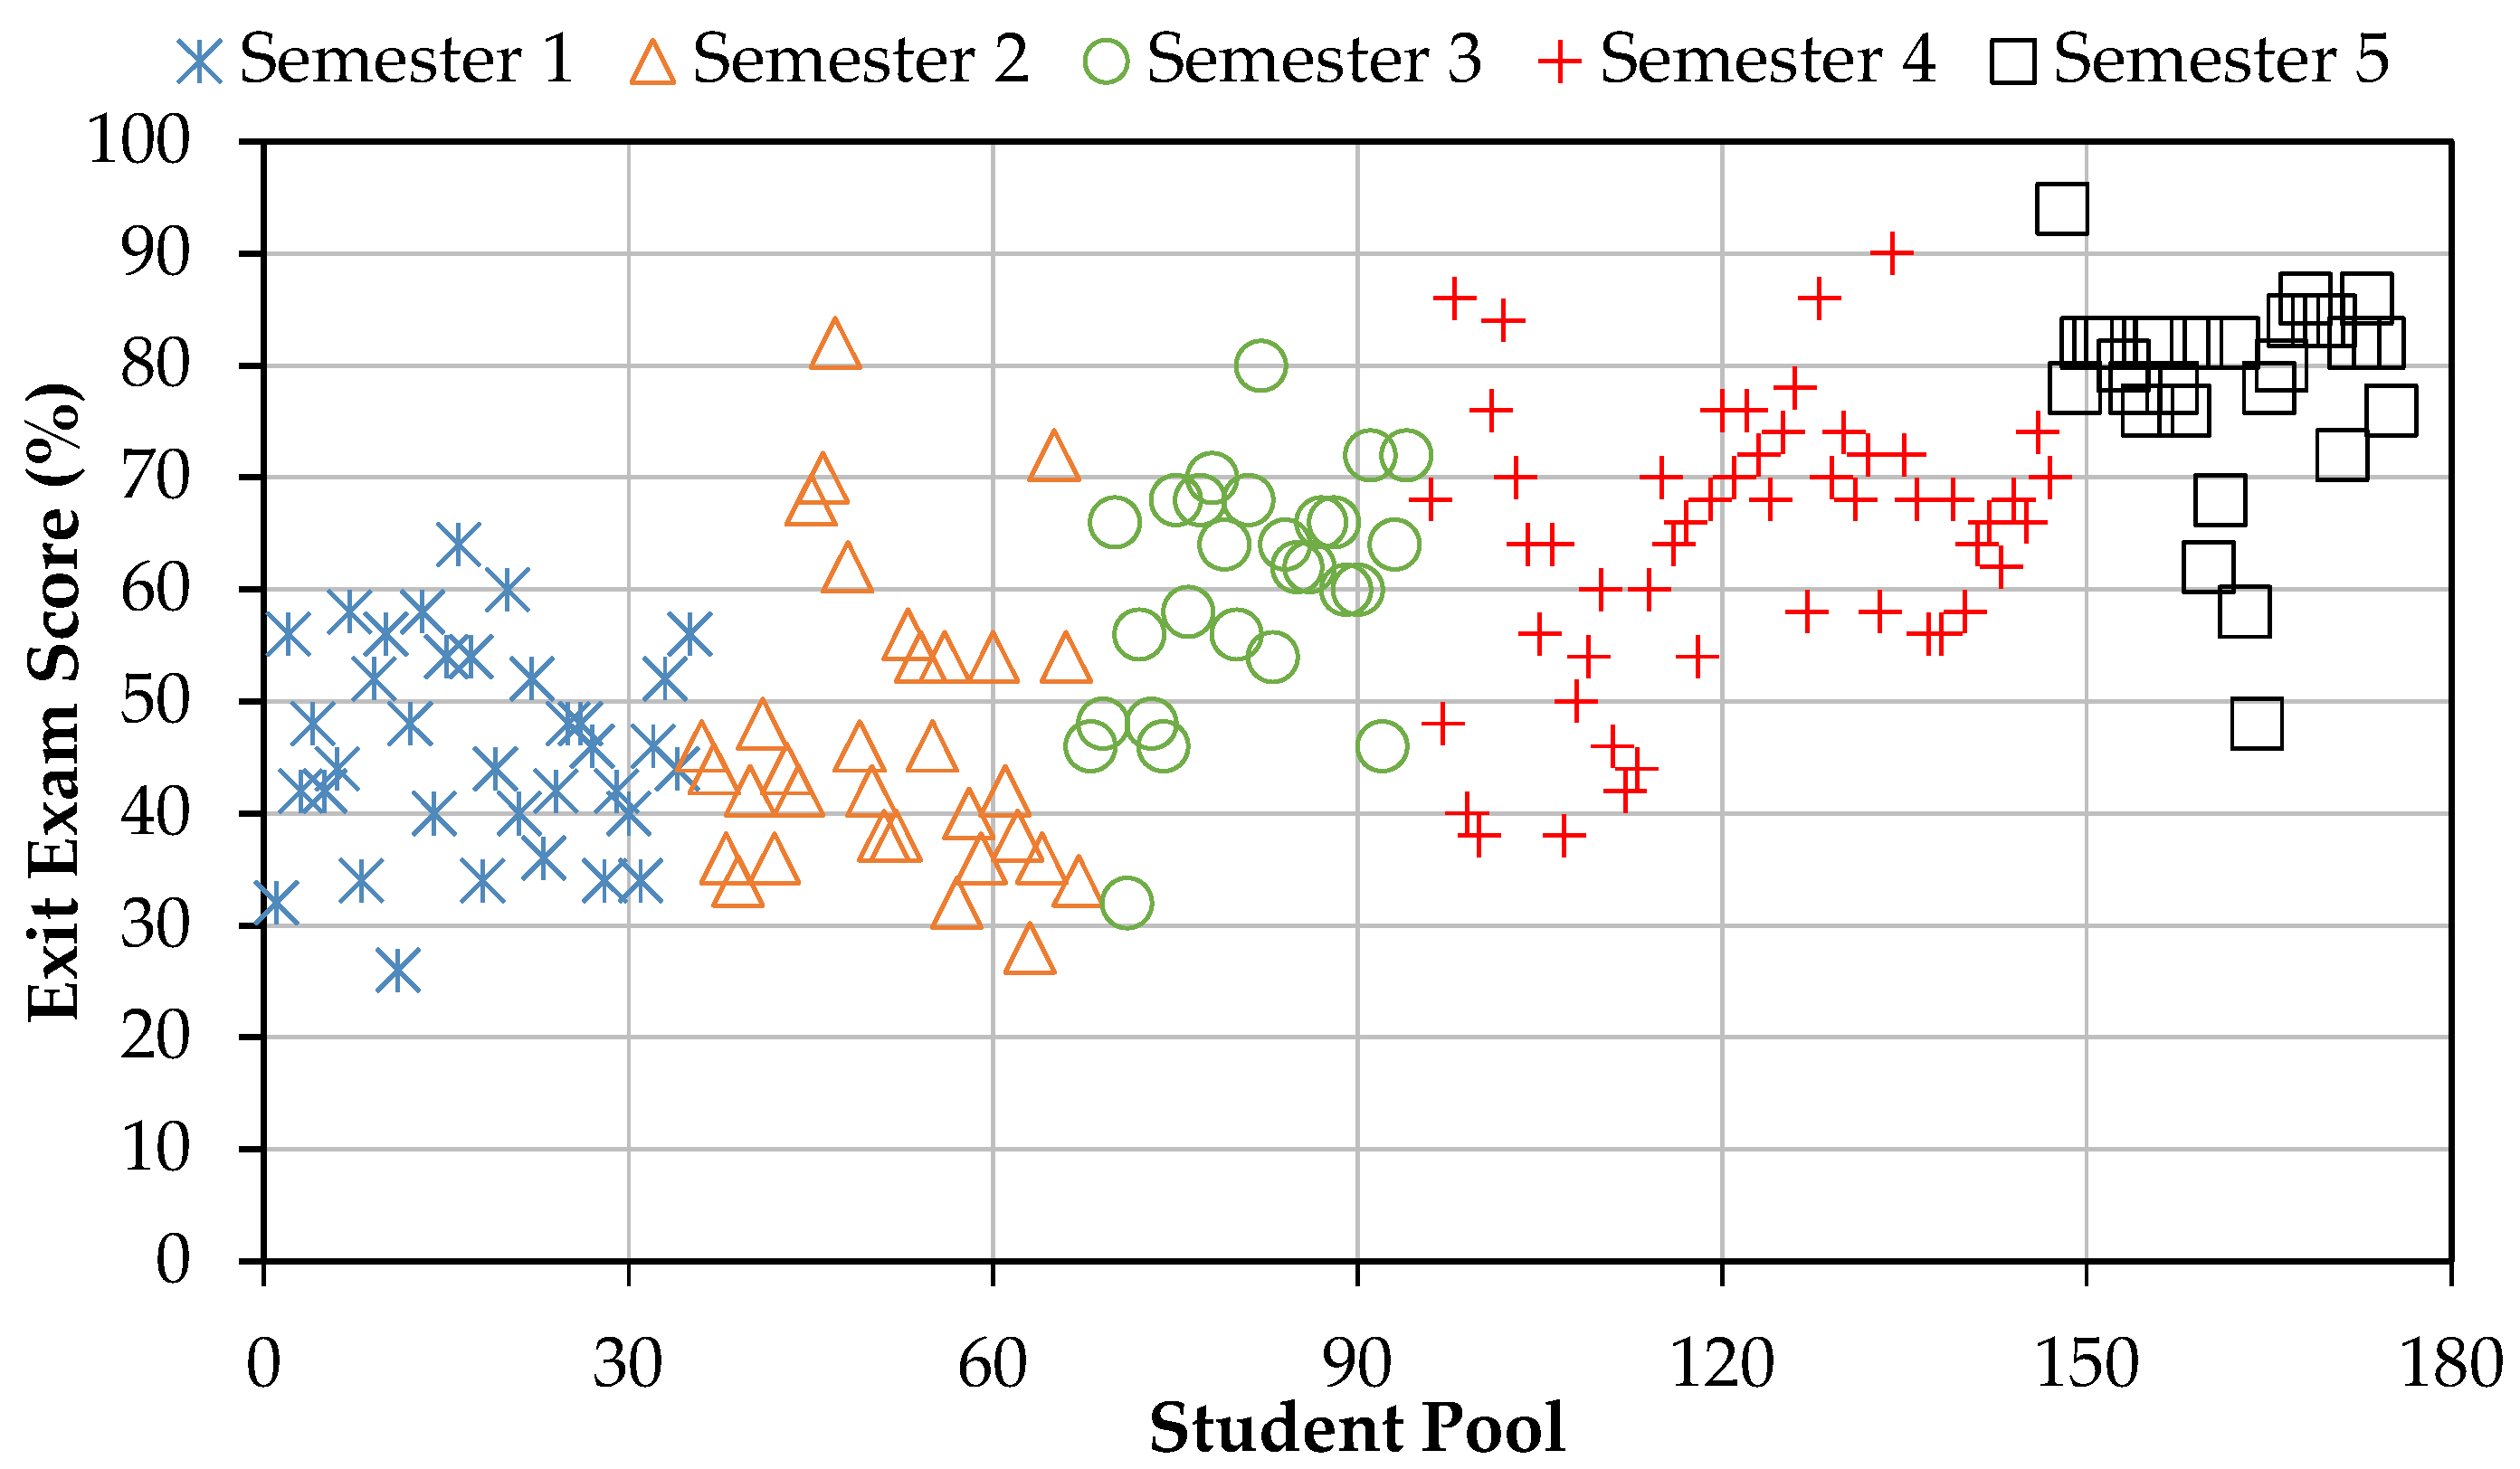
The distribution of the student exit exam scores over the five-semester period is presented in Figure 4. The dataset offers comprehensive insights into students’ exit exam scores across multiple semesters, revealing dynamic patterns in their performances. While the average increased every semester, the deviation of the exit exam scores decreased. For instance, in Semester 1, the students exhibited fluctuating performances, with scores ranging from 26% to 64% (average of 46%). This trend continued in Semester 2, with some students achieving higher scores of up to 82%, and a more diverse overall score range (28–82%). Similarly, Semester 3 displays a score range of 32–80% and a slightly less dispersed scatter compared to the first two semesters. Comparatively, Semester 4 shows a significant increase in the highest exit exam score (90%), leading to a higher average of 64% and a larger scatter of the data points. In fact, this deviation in students’ exit exam scores is in line with their high GPA deviation compared to other semesters (5.2%, as per Table 1). As for Semester 5, the scores were the least diverse among semesters, with scores ranging between 48% and 94%. Despite the variability in students’ exit exam scores, the cohort average increased to 78%, indicating a substantial improvement in the students’ overall performance. This highlights that the remedial actions and their compounded implementation improved the students’ performance individually and as a cohort by converging towards a higher average (i.e., less scatter).
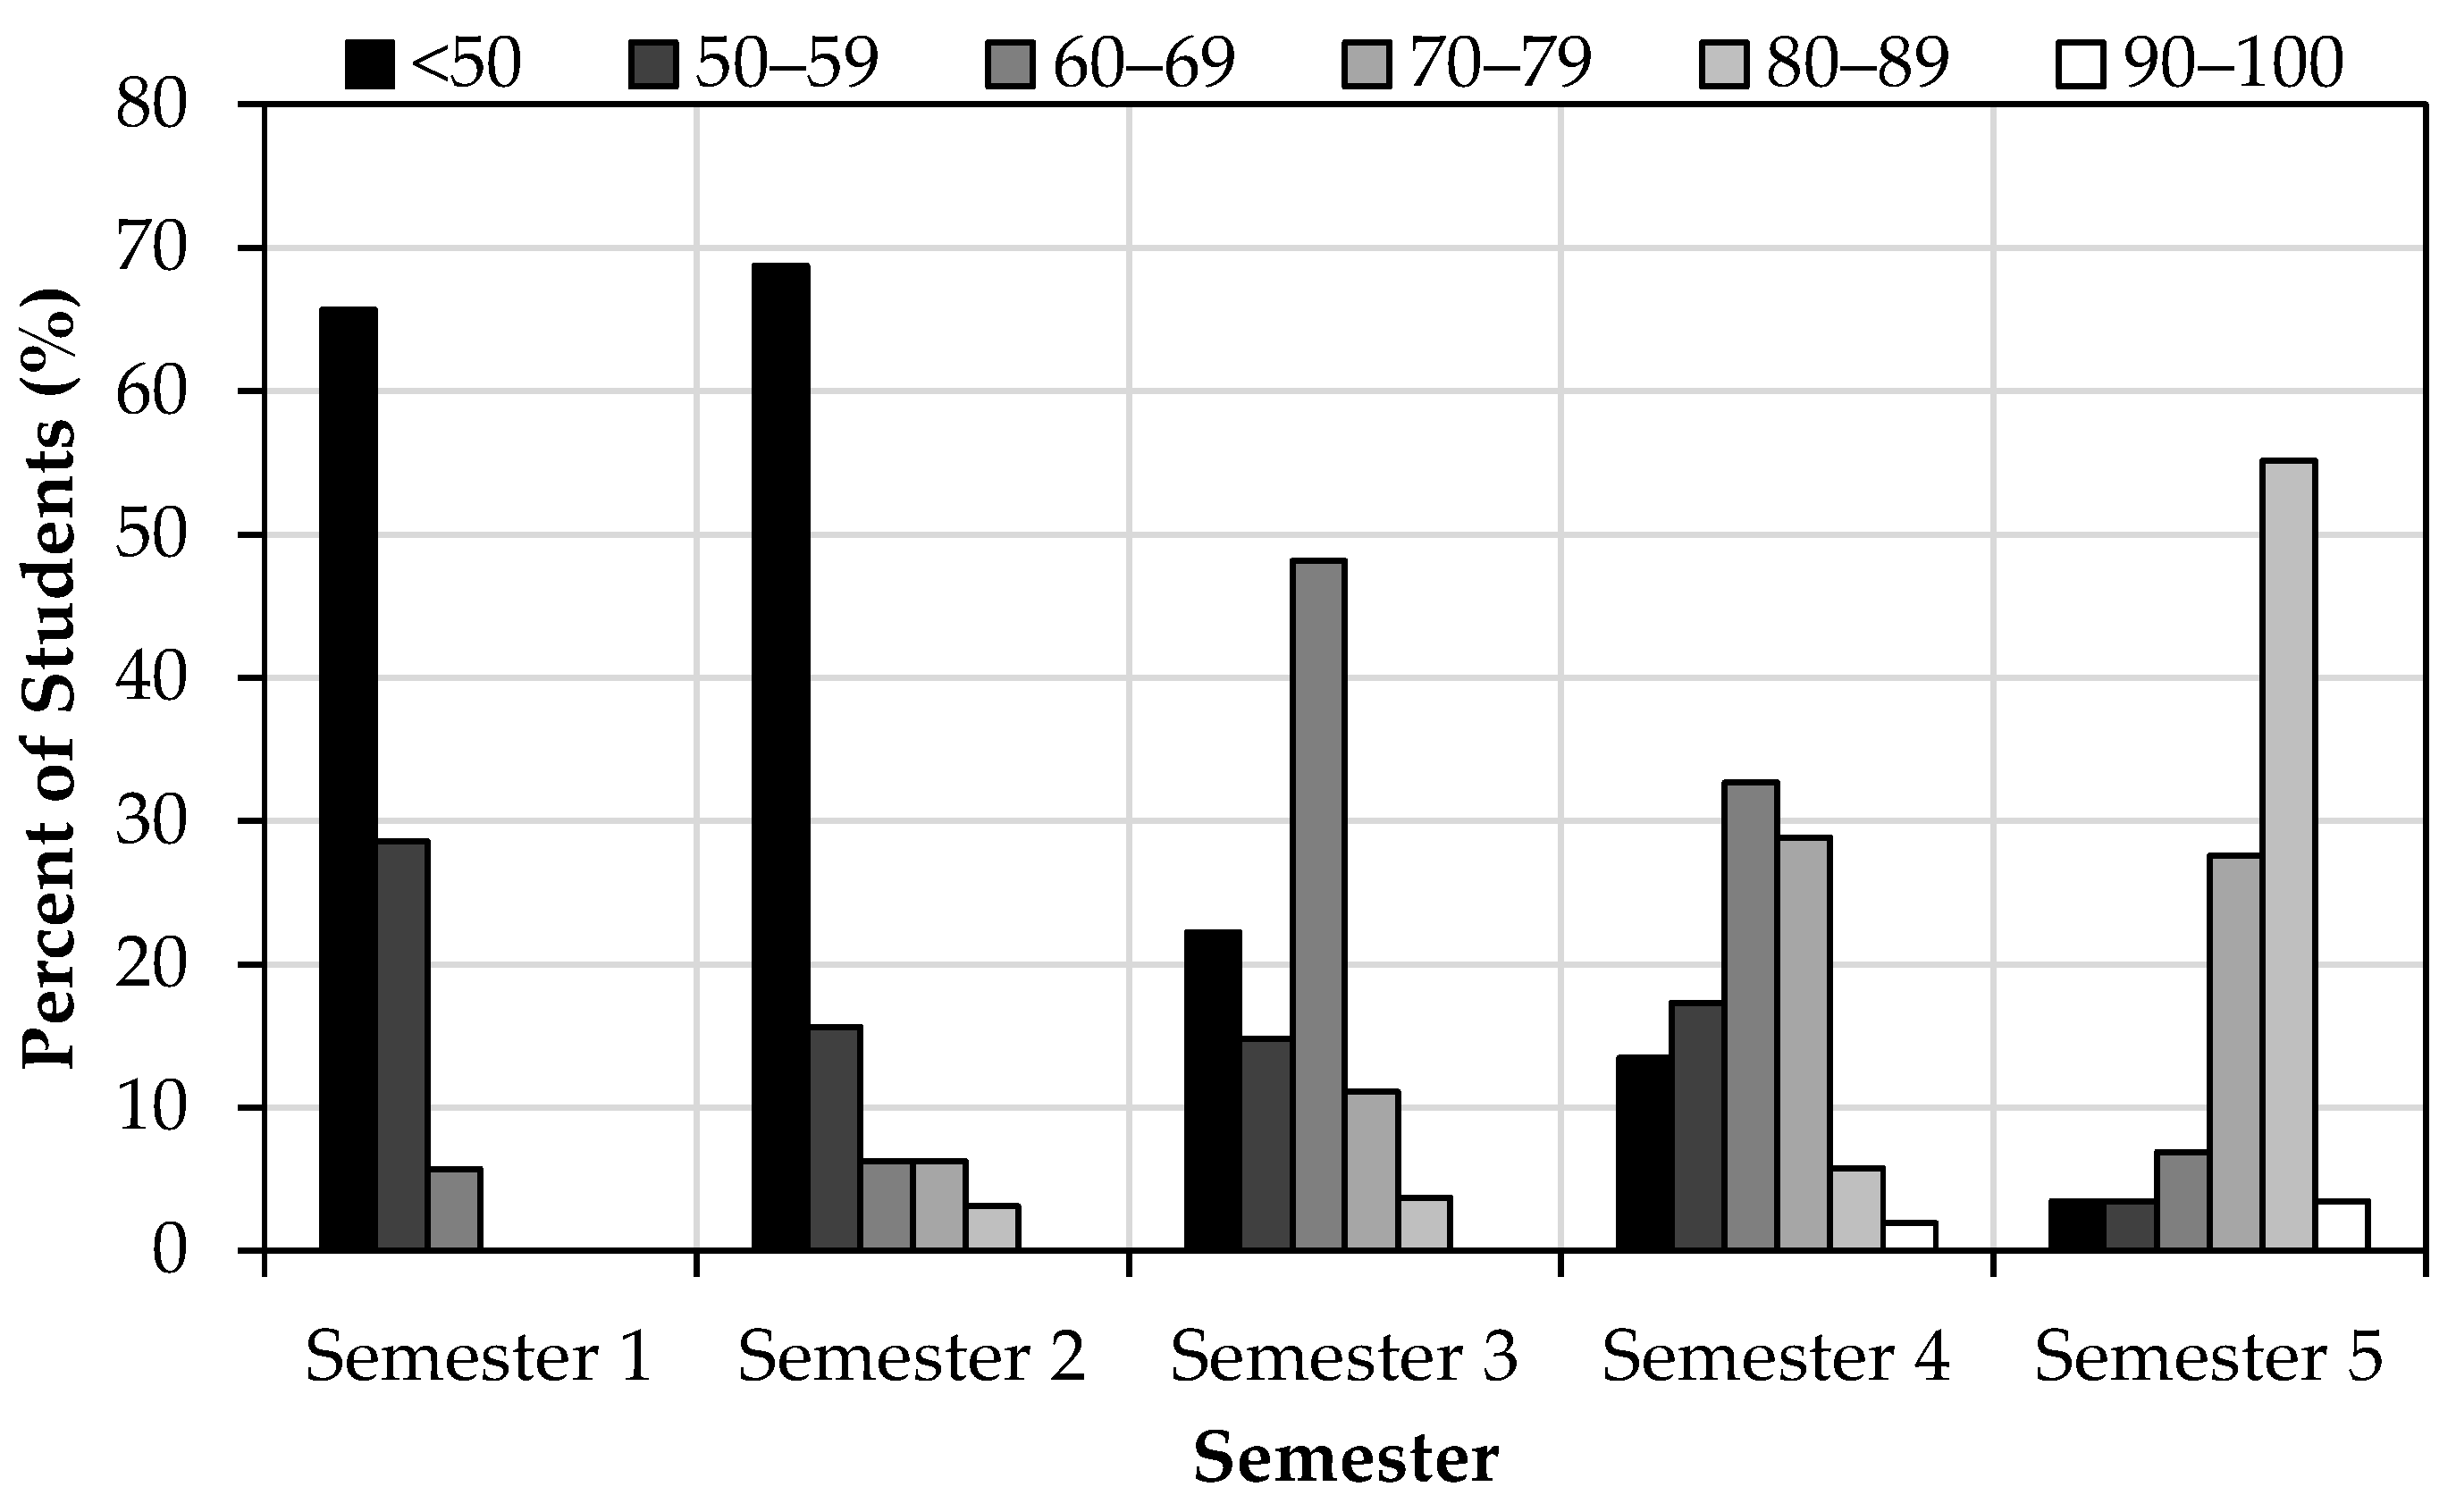
In addition to the overall increase in the cohort exit exam scores, a more detailed analysis of students’ exit exam scores shows that more students passed the exit exam (i.e., score > 60%) each semester. Figure 5 depicts the percentage of students based on the exit exam scores for the five semesters. A distinct trend is revealed in each analyzed period. In Semester 1, most students (94%) scored below 60%, with no representation in the grade ranges exceeding 70%. In fact, 66% of students had an exit exam score below 50%. As for Semester 2, a slight decrease in the percentage of students scoring below 60% was noted (85%). An improved distribution across the various grade ranges was also observed, particularly an increase in the 70–79% and 80–89% categories. Meanwhile, Semester 3 exhibited a significant shift in the scores, with a notable 37% and 22% of students scoring below 60% and 50%, respectively. In turn, 48% of students received a score in the range of 60–69%. Subsequently, Semester 4 showed a more balanced distribution, with 29%, 6%, and 2% of students scoring in the 70–79%, 80–89%, and 90–100% ranges, respectively. This increase in the number of students in score ranges exceeding 70% indicates an improvement in their performance compared to that of the previous semester, albeit their GPAs were similar. In Semester 5, only 7% of students did not pass the exit exam (i.e., <60%). In fact, the majority (55%) scored in the 80–89% range, signifying a remarkable improvement in the overall performance. These results clearly demonstrate the effectiveness of sequential remedial actions, offering valuable insights for future academic planning and targeted interventions to enhance the attainment of student outcomes.
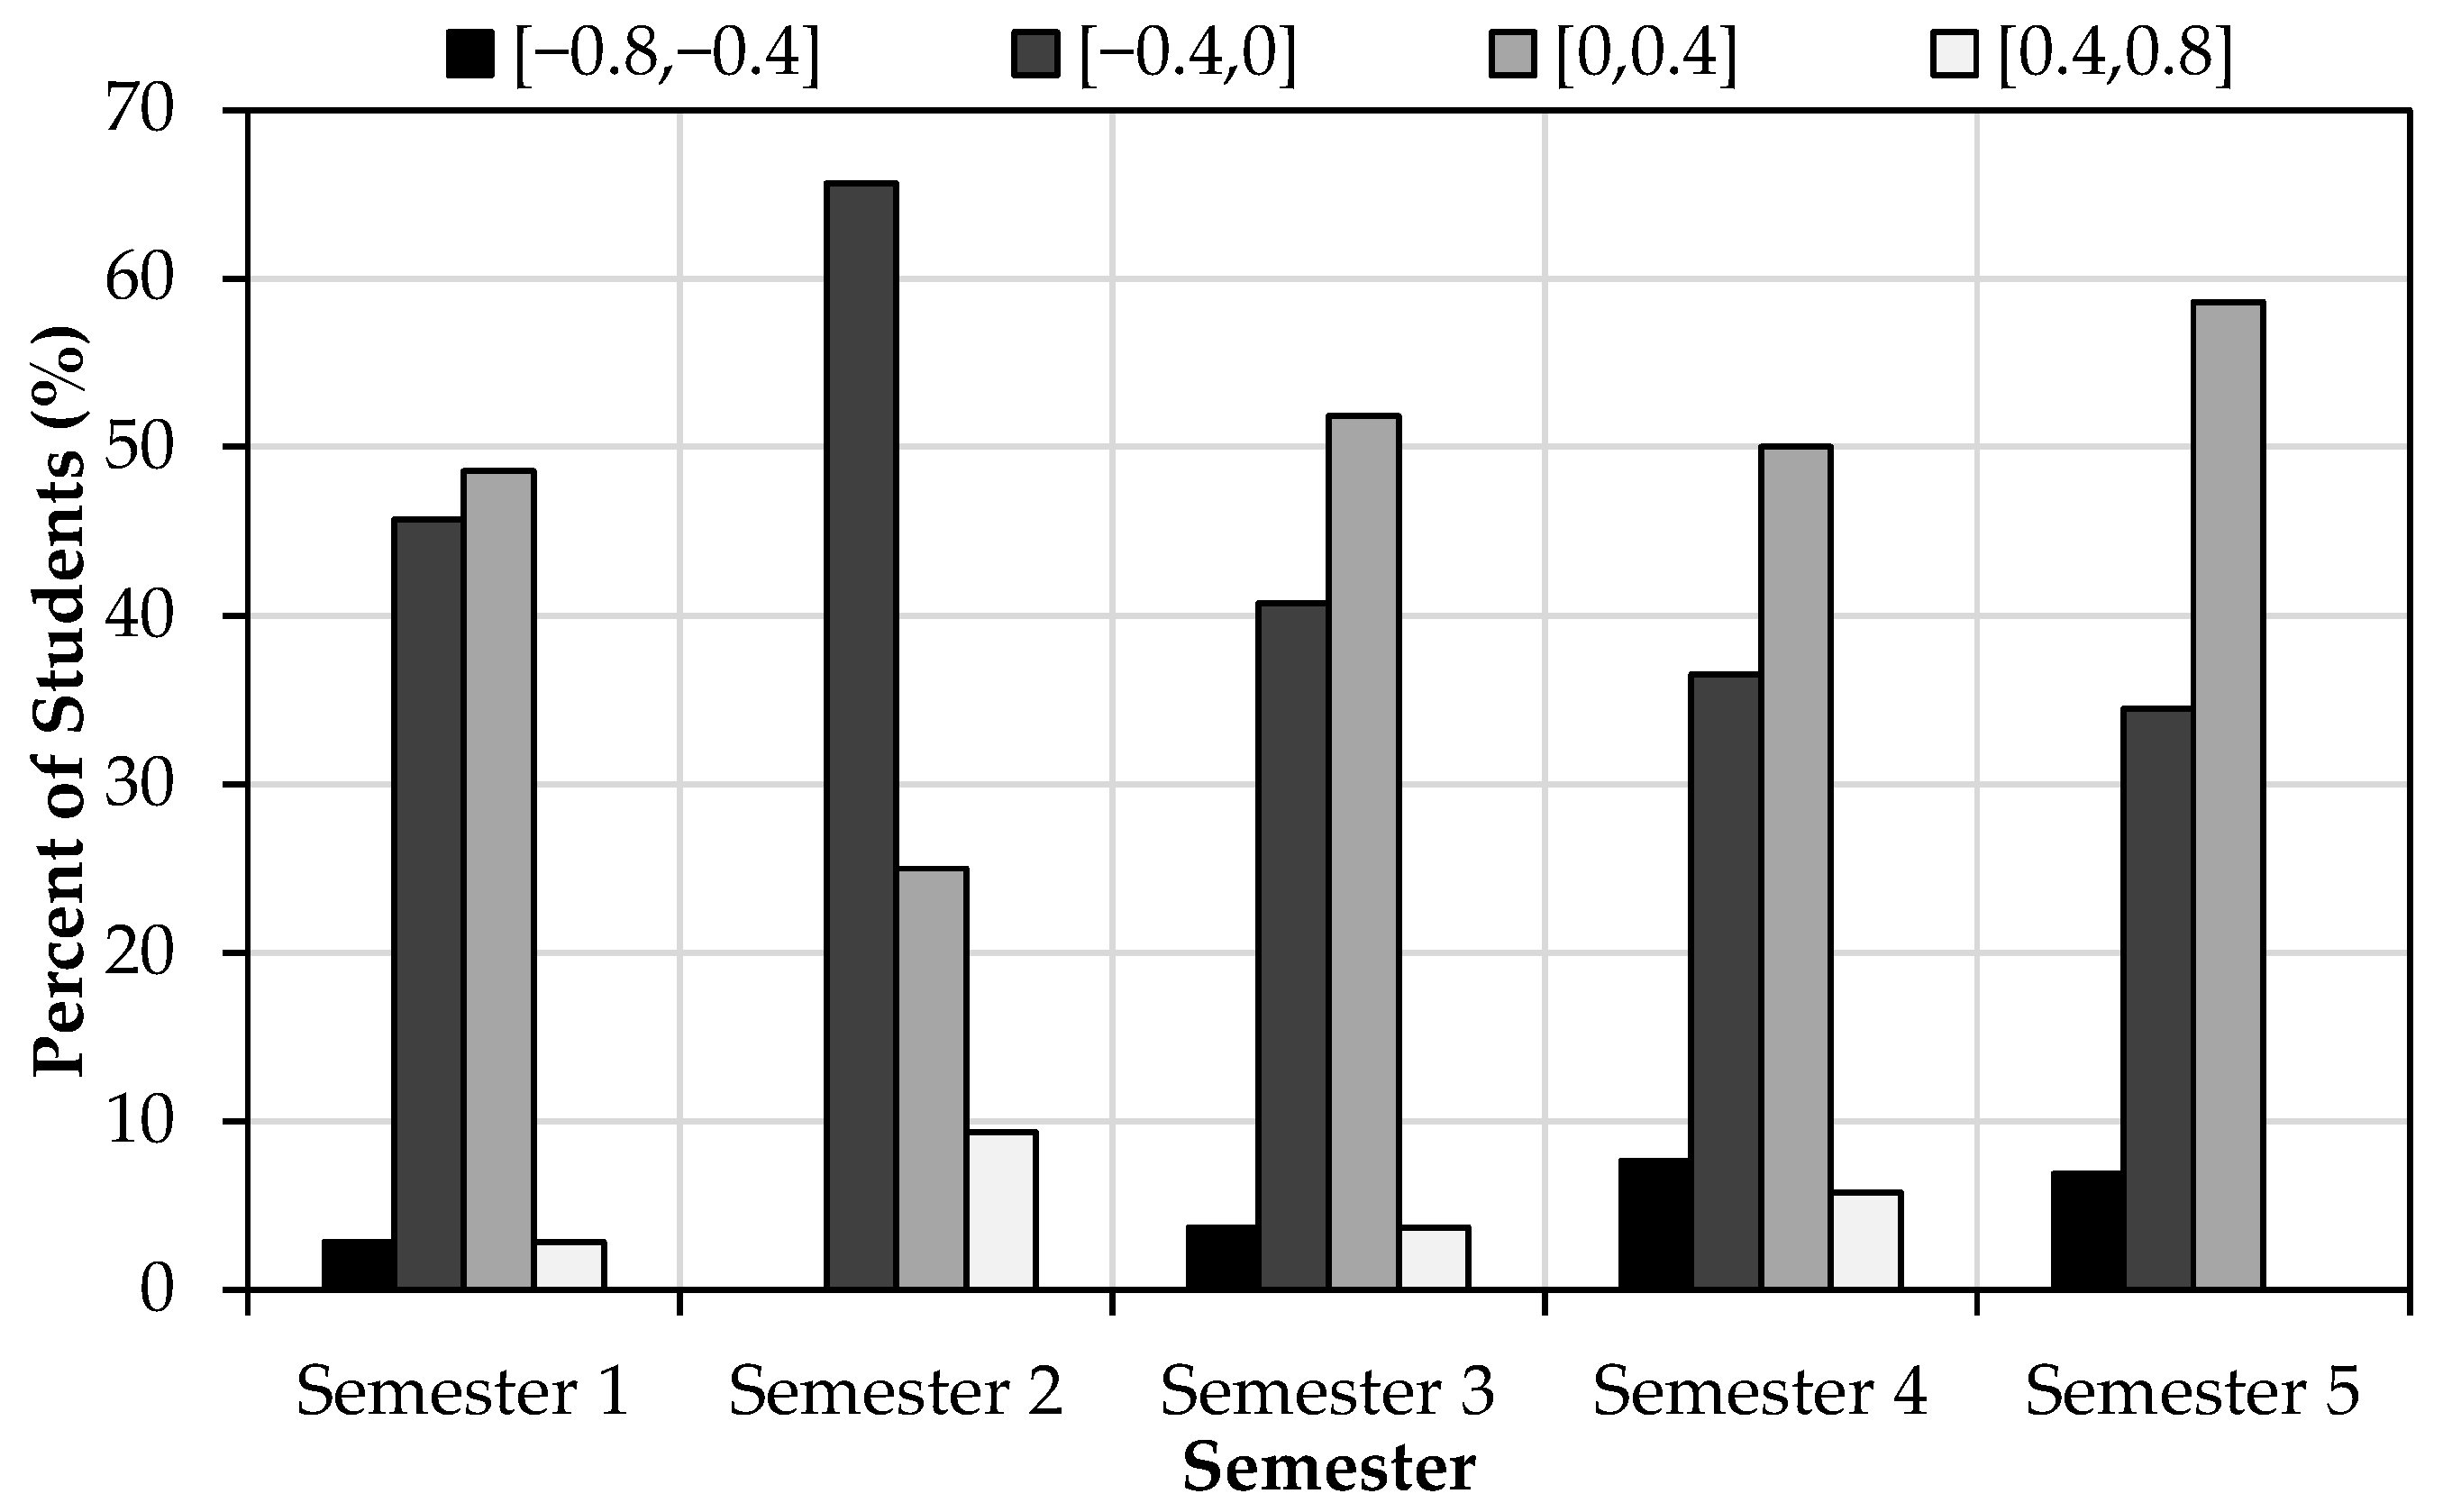
The normalized exit exam scores were calculated to understand each student’s performance compared to the class cohort within the same semester. Normalization was carried out using Equation (2). Figure 6 shows that the scores of the students are generally normally distributed. The majority of students’ grades fell within a normalized score of ± 0.4 for the five semesters. This indicates that students’ performances were similar to those of their classmates within the same cohort. For example, in Semester 5, 94% of students were in the range of −0.4 to +0.4. Such a high student percentage in this narrow range is aligned with the low deviation shown in Figure 4.

3.2. Relationship between GPA and Exit Exam Score

3.2.1. Overview

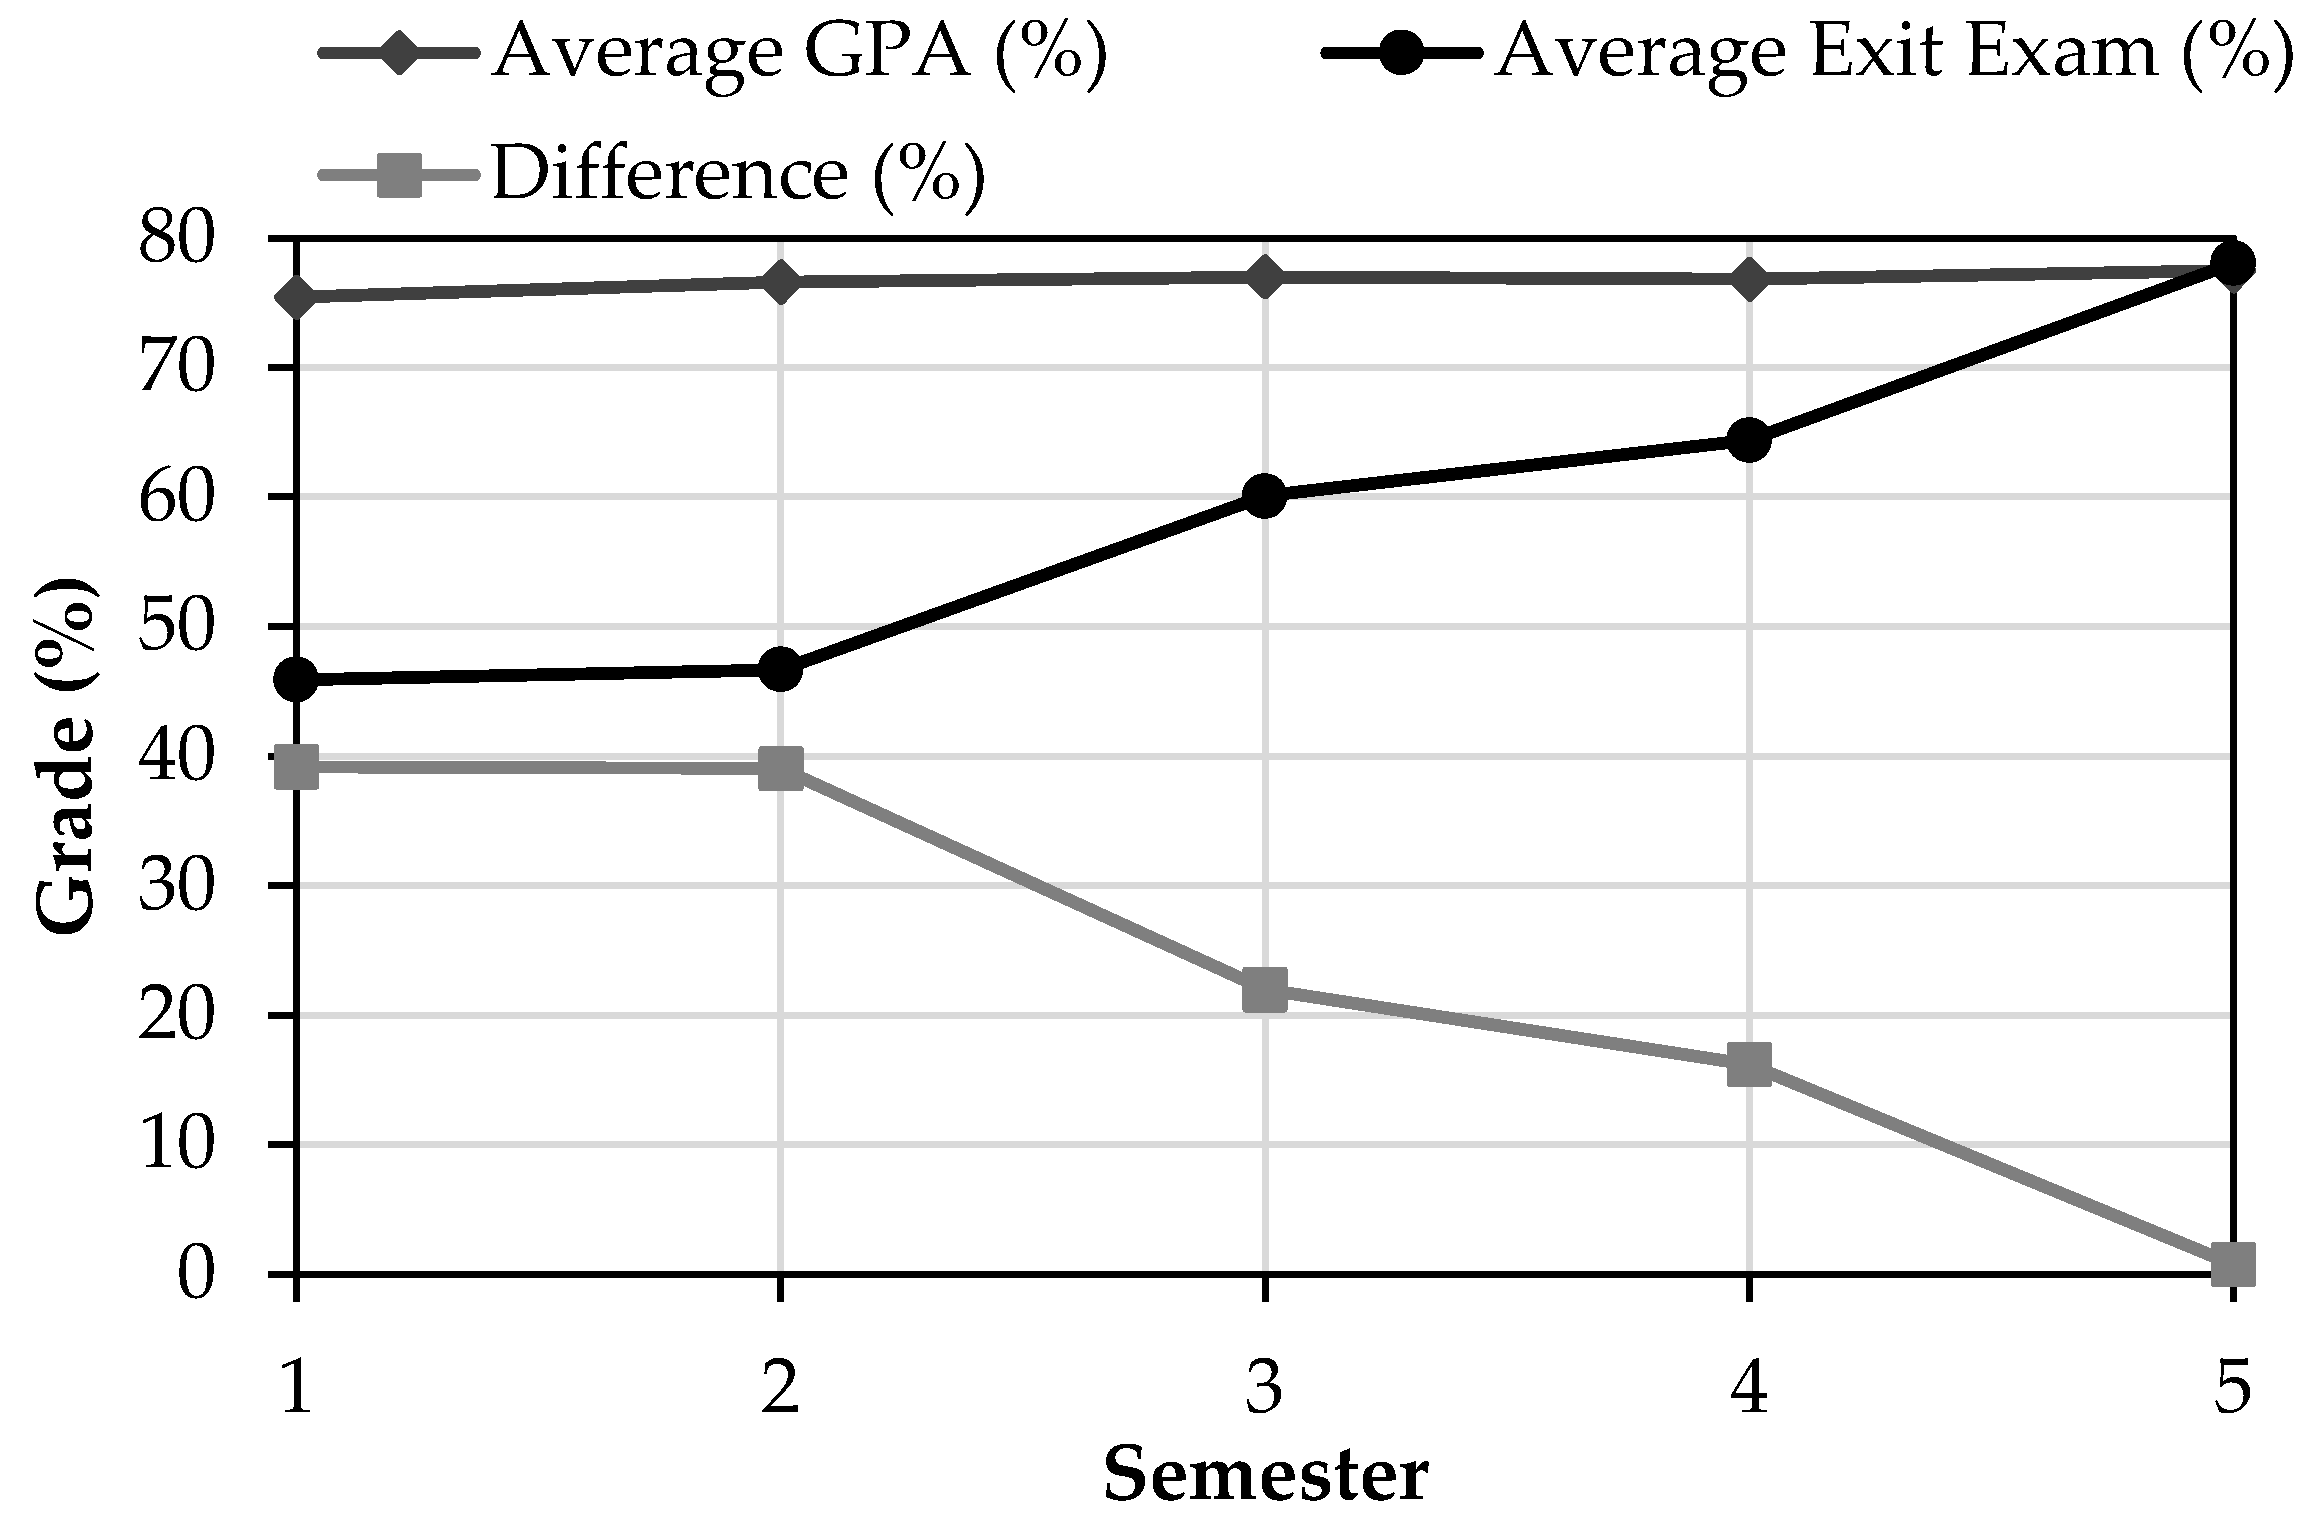
Students’ exit exam performances improved over time, even though their GPAs remained fairly constant between 75.5% and 77.5%. A more in-depth analysis of the GPAs and exit exam scores is thus conducted. Figure 7 depicts a discernible upward trend in the average exit exam scores over five semesters. Meanwhile, the students’ average GPAs did not vary significantly. In the first semester, students achieved average exit exam scores and GPAs of 45.9% and 75.5%, respectively. Subsequent semesters saw incremental improvements, with Semester 5 achieving the highest average GPA and average exit score of 77.5% and 78.1%, respectively. In fact, the difference between the two measures decreased from 39.2% in the benchmark semester to 39.0%, 22.0%, 16.2%, and 0.6%, respectively, in the subsequent four semesters. This convergence between the two measures signifies that the exit exam has become a more reliable and valid instrument to assess students’ performances and their attainment of learning outcomes. In conclusion, the findings offer valuable insights for educators and administrators to investigate further and leverage successful practices for a sustained improvement in subsequent academic terms.
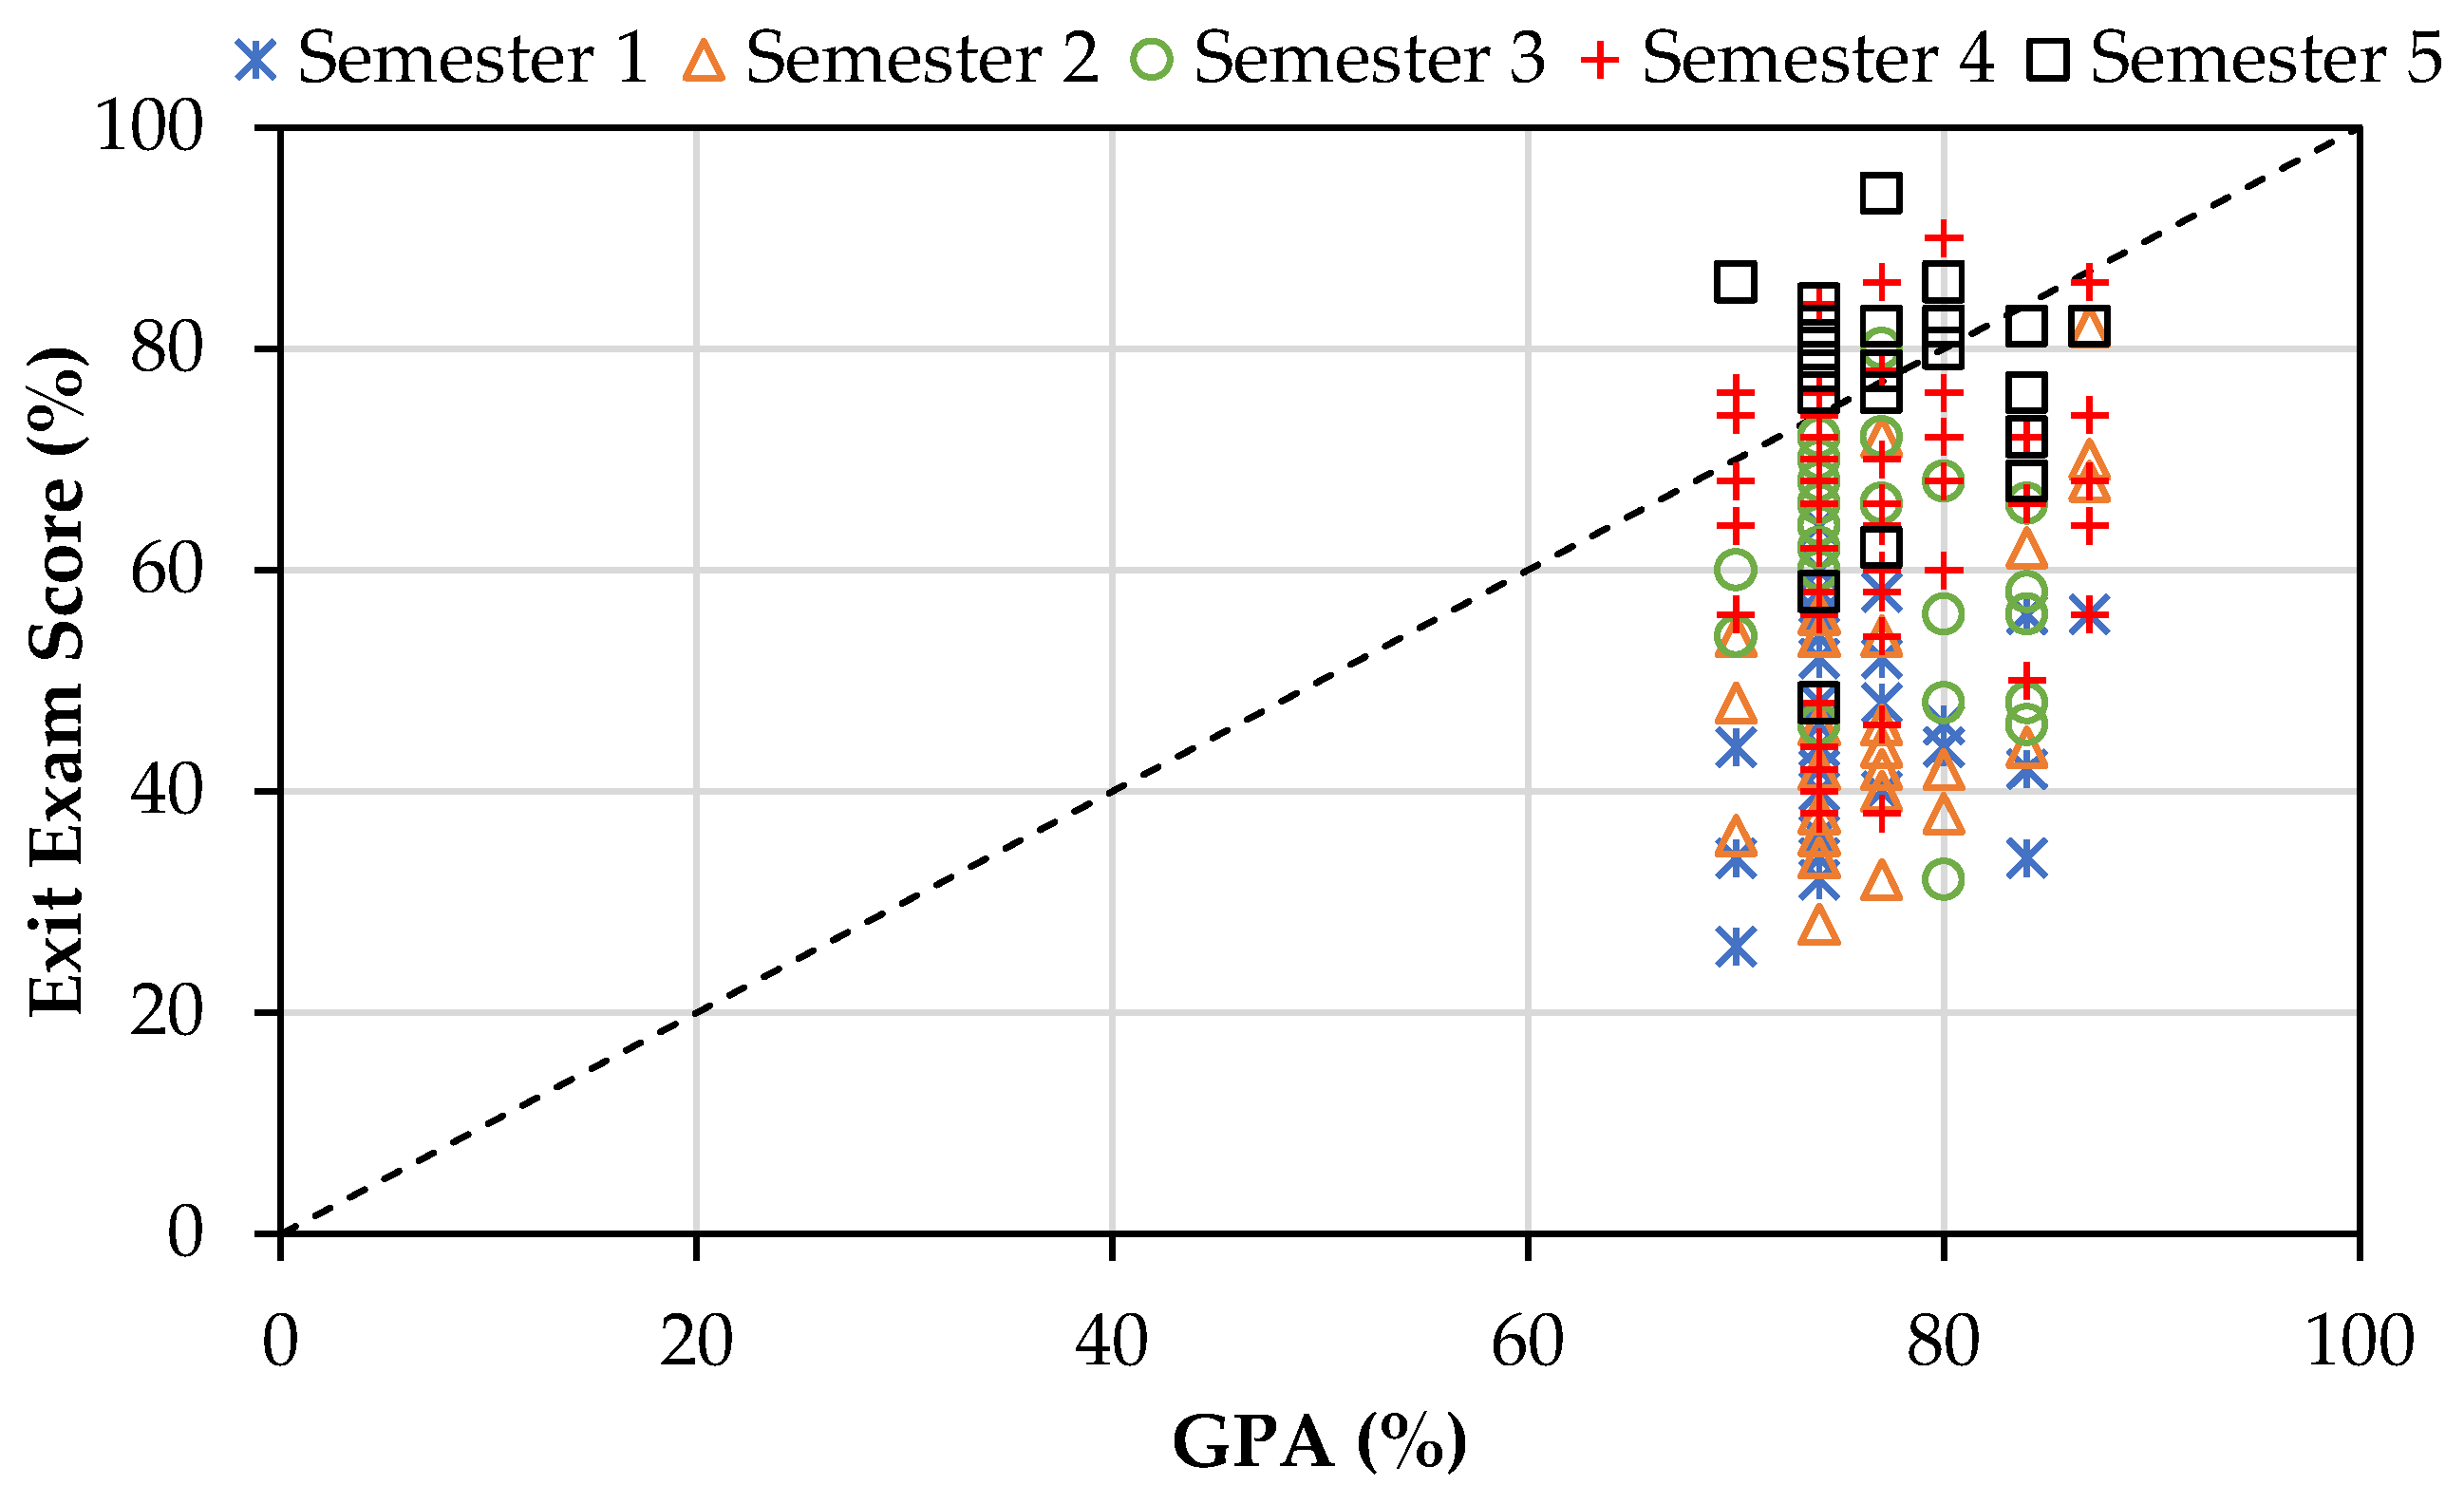
A more in-depth assessment of students’ performances in the exit exam and coursework (i.e., GPA) is conducted. Figure 8 presents students’ performances in the exit exam (i.e., score) against their GPAs across the five semesters. By examining Semester 1, the discrepancy between the exit exam score and GPA is apparent. In fact, the former measure was lower than the latter, evidenced by the majority of the points being below the 1:1 line. Actually, students’ exit exam scores and GPAs were in the respective range of 26–64% and 70–87%. While a similar trend was noticed in Semester 2, the subsequent semester (i.e., Semester 3) noted an overlap of the two measures. The exit exam scores ranged between 32% and 80%, while the GPAs varied between 70% and 84%. In the fourth semester, the students’ performances were significantly better, with exit exam scores reaching 90% and 94%, respectively, while their GPAs were in the range of 70–87%. While the students’ performance in the exit exam generally improved, a more detailed inspection of the results showed that 15% of students in Semester 4 performed better in the exit exam than in their coursework (i.e., GPA). In comparison, 62% of students in Semester 5 had a better exit exam score than their GPA. This highlights the effectiveness of the four compounded remedial actions in improving the students’ performance in the exit exam. In conclusion, the analysis provides insights into the variability in students’ performances over five semesters, which will aid in forming a basis for informed educational interventions and support systems tailored to diverse student needs.

3.2.2. Consistency Index

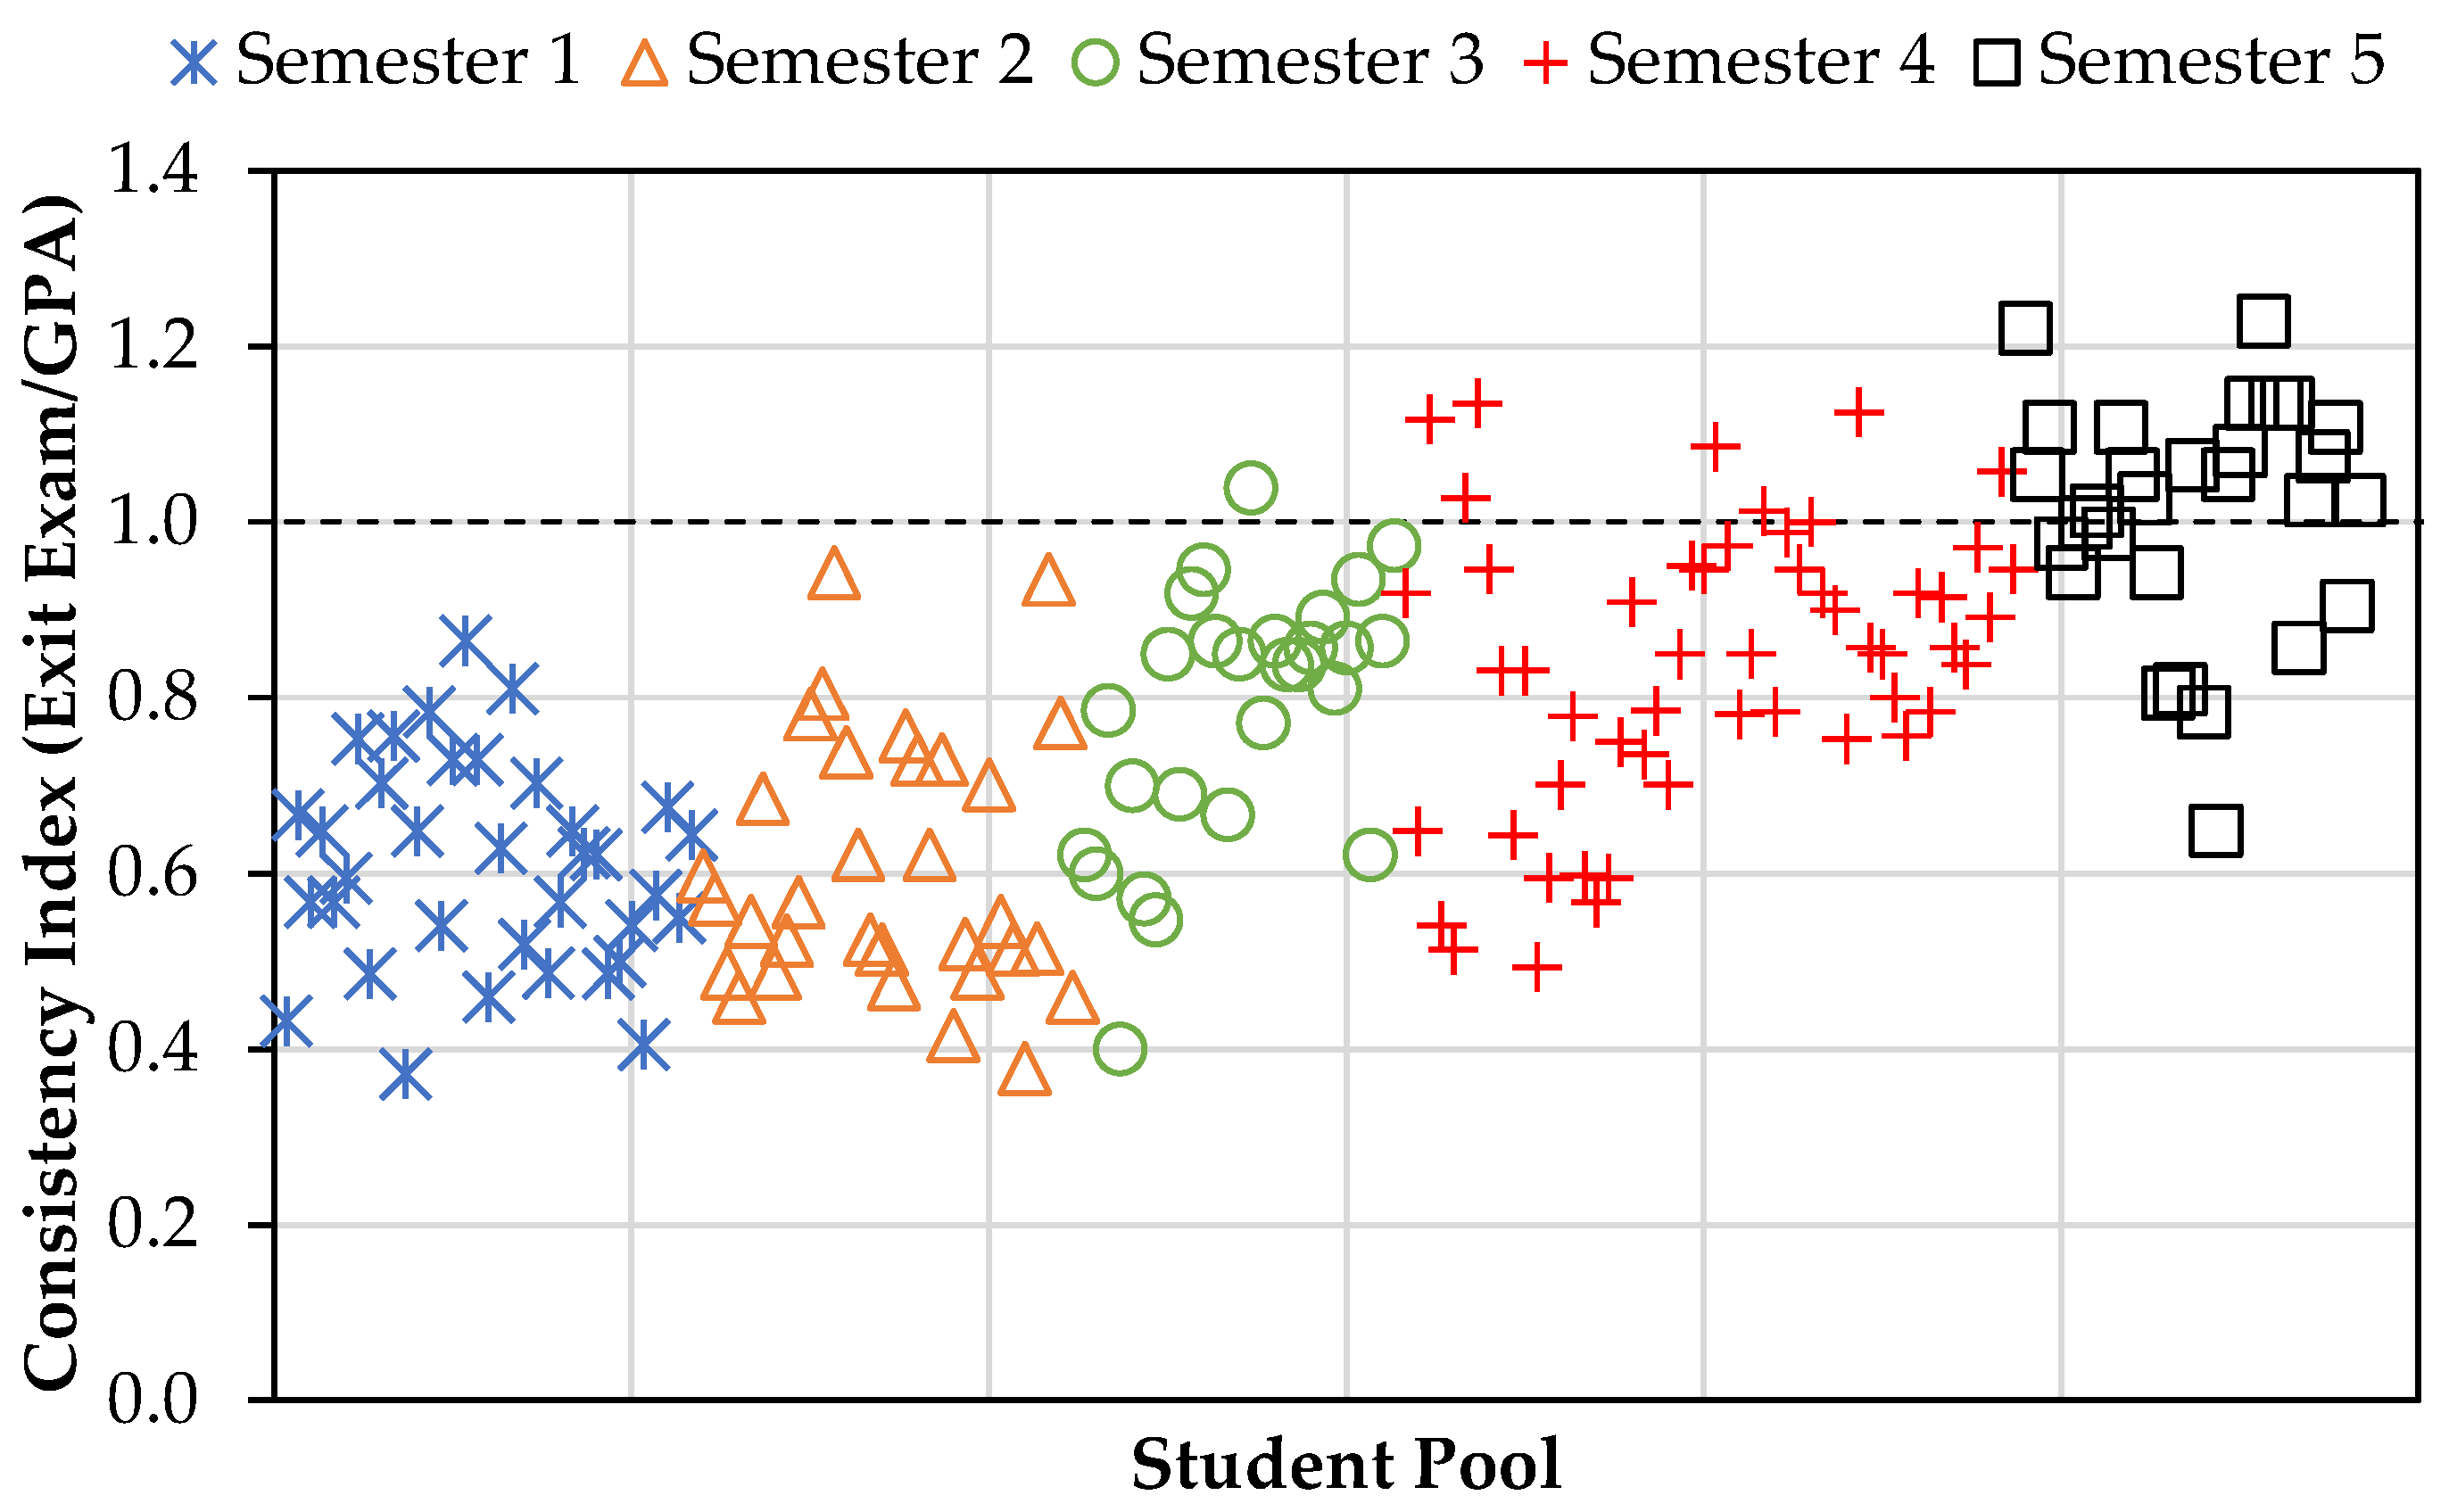
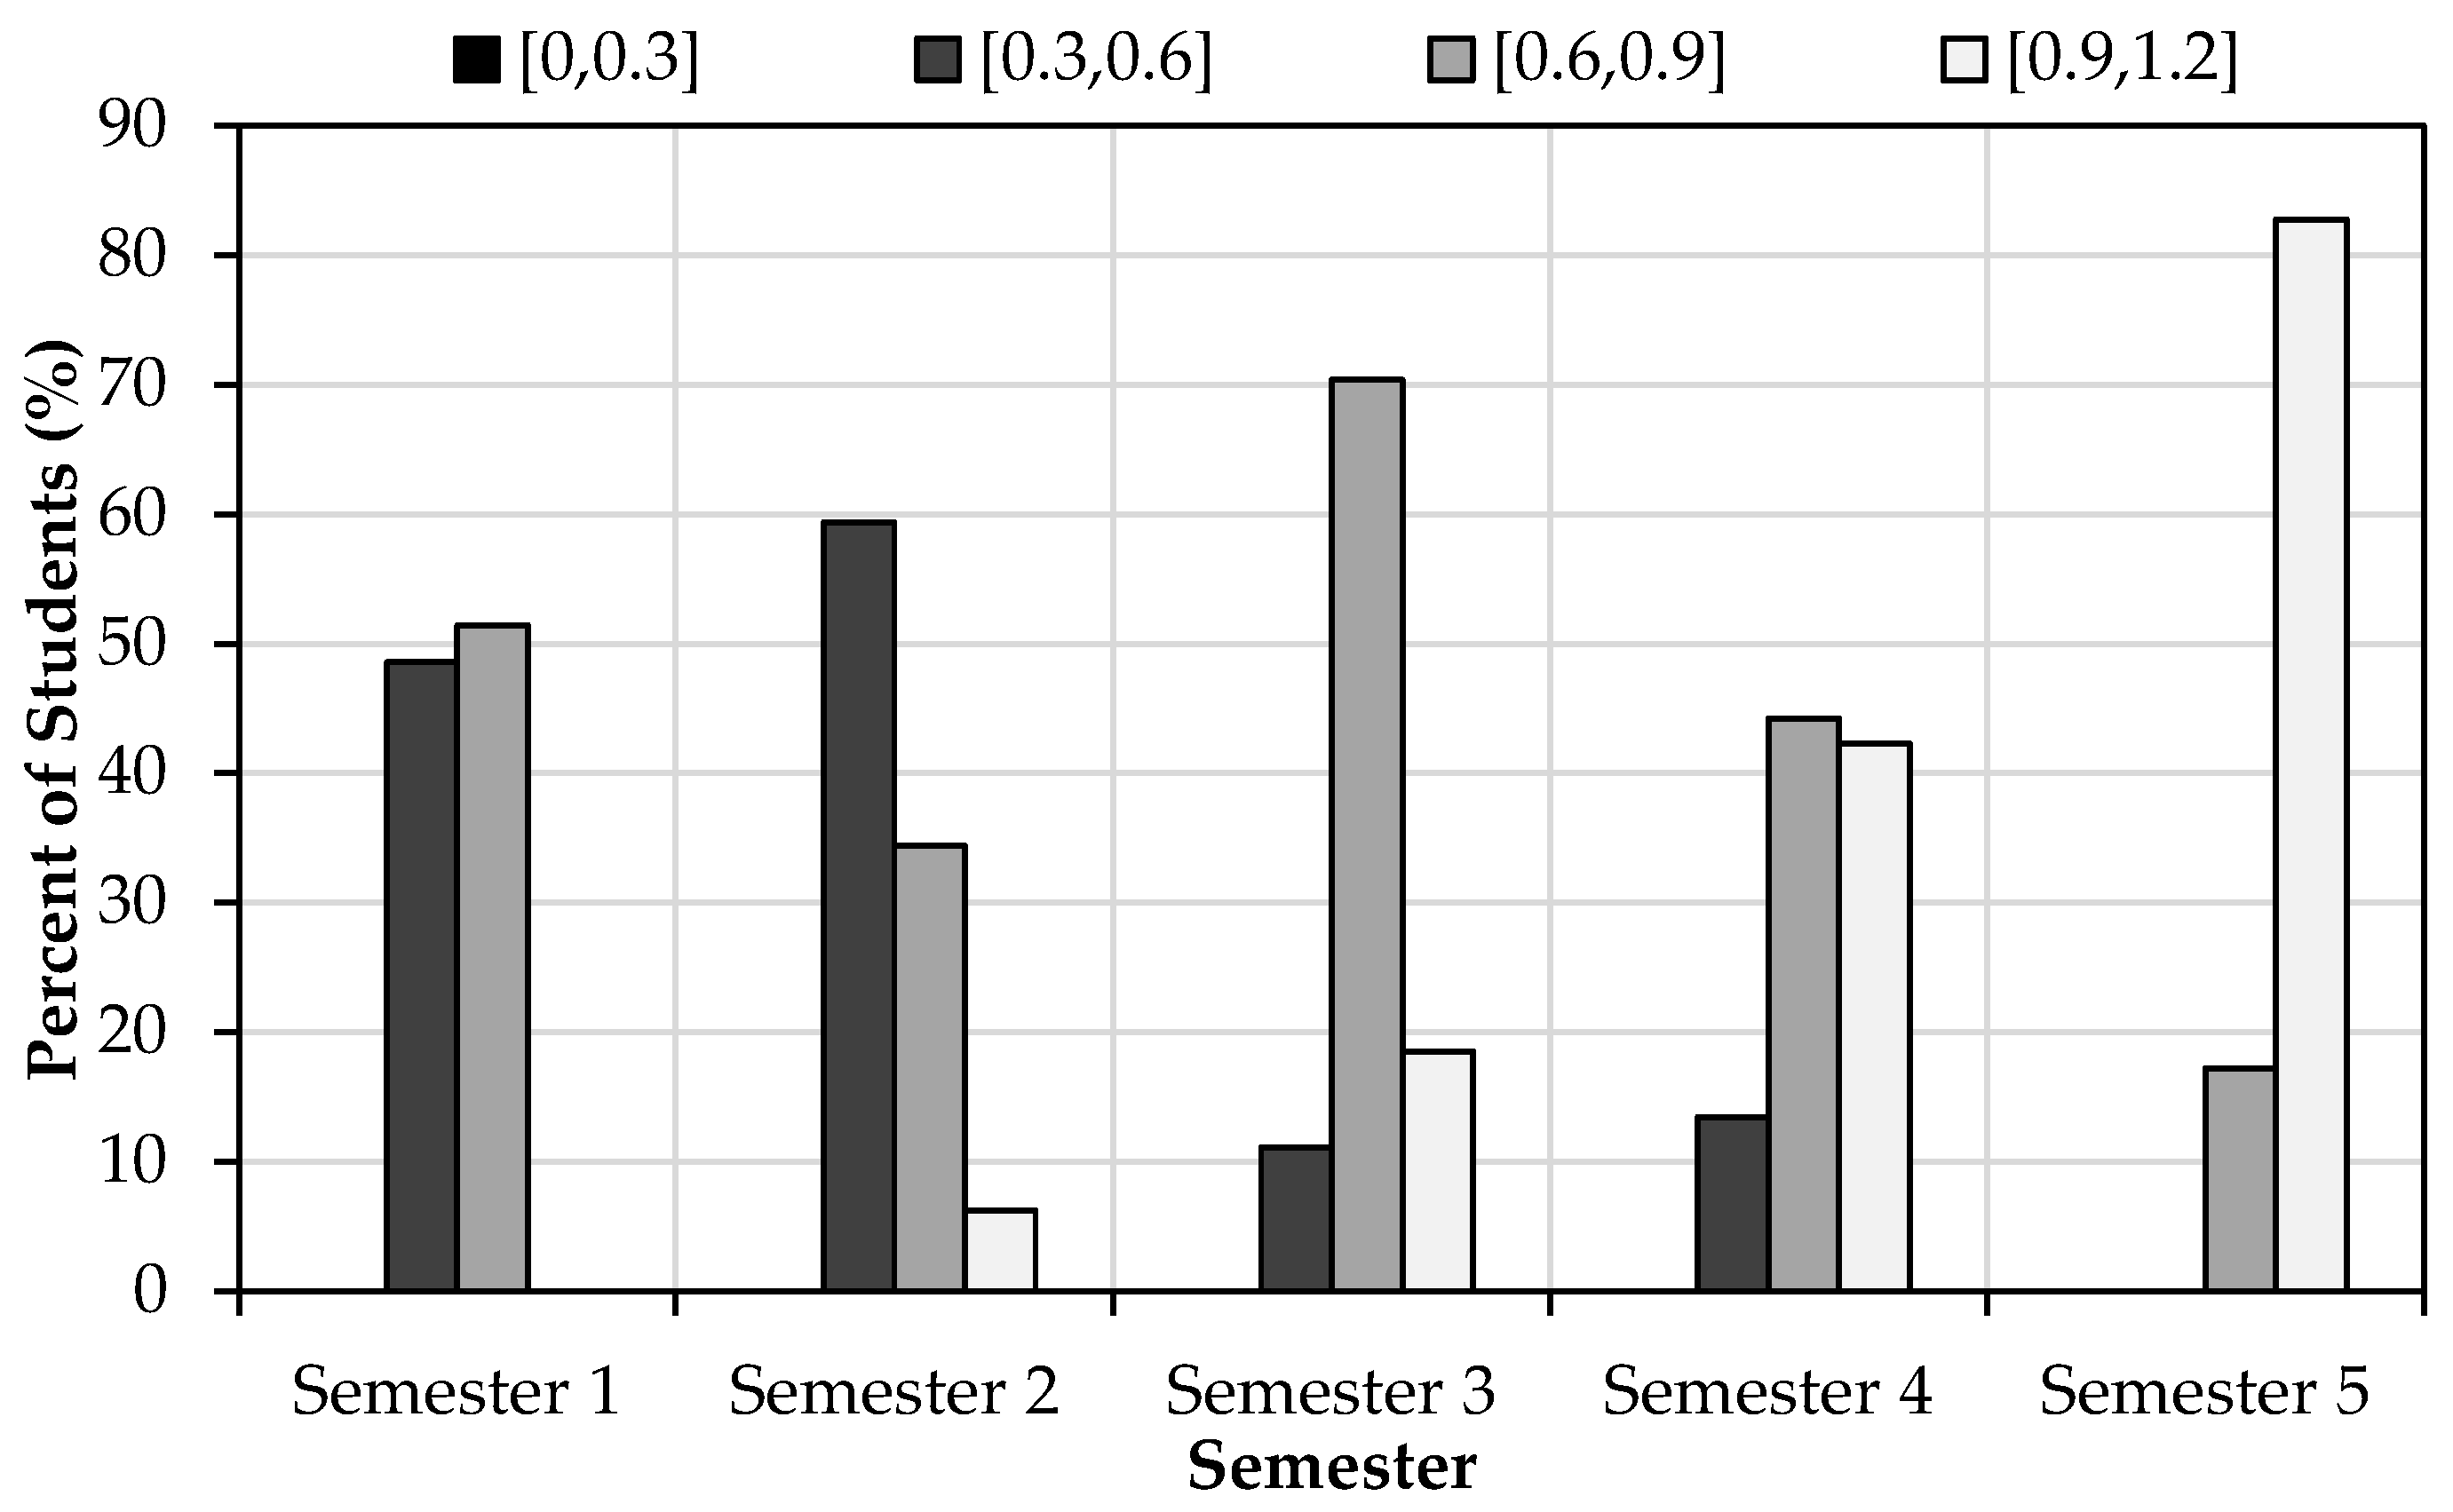
Based on individual students’ GPAs and exit exam scores, a clear variation between the two measures is present. In fact, the consistency of each student’s performance in the exit exam against their GPA is evaluated using the CI, i.e., exit exam score-to-GPA ratio, as illustrated in Figure 9. Values below the 1.0 line indicate that the students performed better in their coursework than in the exit exam and vice versa. Students’ CIs in Semester 1 varied between 0.37 and 0.86, showcasing that all students underperformed in the exit exam. In fact, nearly 50% of students had a CI value below 0.6, as shown in Figure 10. Furthermore, the CI broadened in Semester 2, with values spanning from 0.42 to 0.94; still, nearly 60% of students attained a CI below 0.6. Meanwhile, in Semester 3, the CIs ranged from 0.38 to 1.04, reflecting an enhancement and further disparity in the relationship between exit exam performance and GPA. Indeed, 89% of students had a CI value above 0.6, with 19% exceeding 0.9. Such an improvement in the correlation between the two measures continued and surged to higher levels in Semesters 4 and 5. The exit exam-to-GPA ratios (i.e., CIs) reached 1.14 and 1.20, respectively, with 42% and 83% of students attaining the highest CI range of 0.9–1.2, respectively. In an overarching assessment, the “EE/GPA” ratios showcase the variability across all semesters, implying individual disparities in the correlation between exit exam scores and GPAs. The data highlight a dynamic relationship between exit exam performance and GPA, with fluctuations in the “EE/GPA” ratios across different semesters. This analysis offers insights into student performance trends, showing an increased consistency over five semesters. The observed distribution shifts further signify better student performances over time.

3.2.3. Performance Score

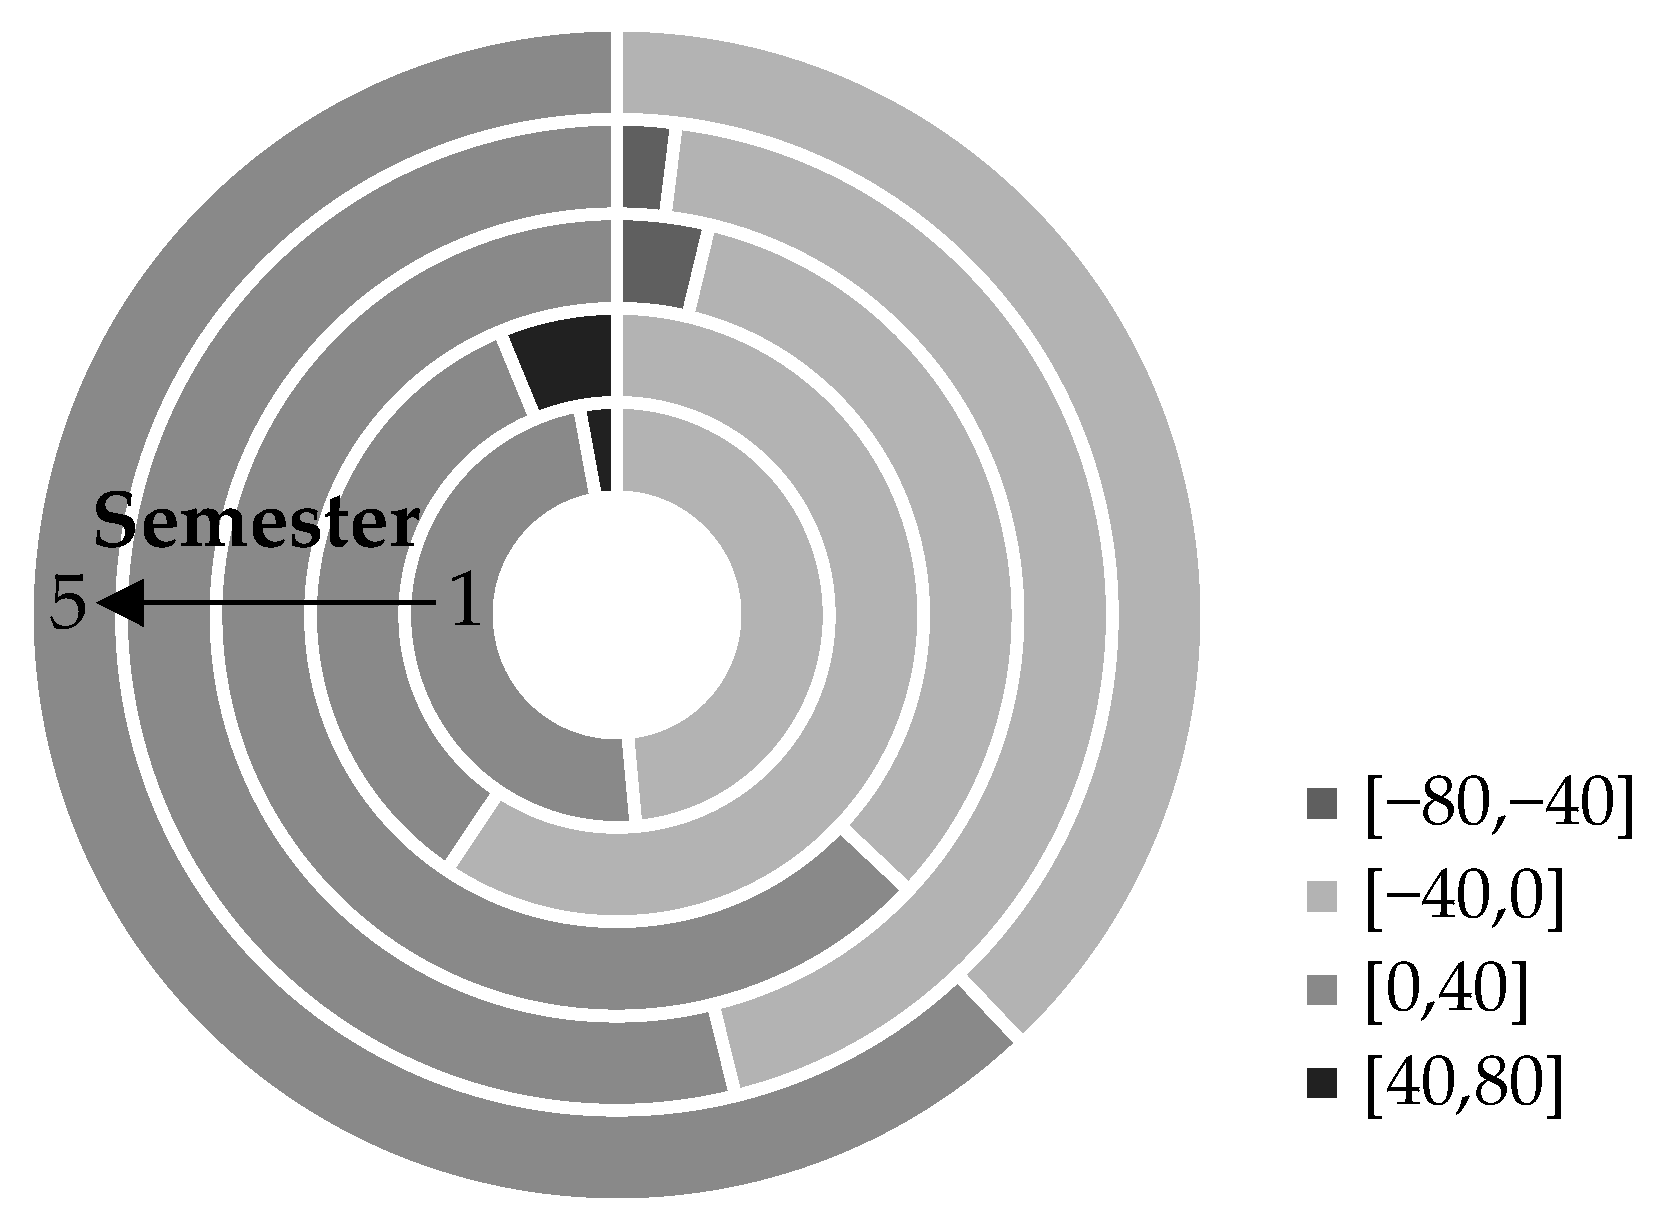
The PS evaluates each student’s performance compared to their GPA while reducing the effect of randomized questions in the exit exam and having different course instructors. Figure 11 presents the distribution of students among different ranges of PSs across the five semesters. A positive value signifies that the individual student’s exit exam score outperformed their coursework (i.e., GPA) and vice versa. In Semester 1, the majority of students (97%) fell in the [−40, 40] range. Similarly, in Semesters 2, 3, 4, and 5, 94%, 96%, 98%, and 100% of students were in the PS of the range ±40%. This indicates that students performed better over the five semesters and remained consistently comparable to their cohort. Such a performance enhancement is attributed to the overall improved students’ exit exam scores and is evidenced by the increase in the CIs with time.

3.3. Exit Exam–GPA Correlation Testing

The exit exam–GPA correlation testing is a statistical evaluation to understand the relationship between a student’s performance on an exit exam and their GPA. This assessment aims to determine whether a strong correlation exists between these two academic metrics, providing valuable insights into the education system’s effectiveness and individual study habits. For this purpose, a t-test was conducted at a confidence of 95%. The null hypothesis was that the average exit exam score and average GPA of a student were equal (i.e., the difference between the two measures is zero). In the analysis, the confidence interval and t-value were calculated to verify the correlation. If the difference between the two variables (i.e., the difference is zero) falls within the confidence interval, or if the t-value is between −2.201 and 2.201 (i.e., t0.025 from the t-distribution table), then the null hypothesis cannot be rejected (i.e., the two variables are similar). Otherwise, the null hypothesis can be rejected, signifying that the two measures are different.
Table 3 presents the results of the correlation analysis between students’ average GPAs (%) and average exit exam scores (%). In the first four semesters, the t-values are above the value of 2.201 (i.e., t0.025 from the t-distribution table). Consequently, the null hypothesis is rejected in these semesters, indicating a statistically insignificant correlation between the average GPA and average exit exam score. This suggests that students who perform well in their coursework (i.e., GPA) do not necessarily perform well in the exit exams and vice versa. However, in the fifth semester, the t-value was −0.30, and the confidence interval was [−4.4, 3.2]. In this case, the null hypothesis cannot be rejected, implying a statistically significant correlation between the average GPA and average exit exam score. This means that the students’ exit exam scores of Semester 5 are representative of their coursework grades, i.e., GPAs. These results are similar to the CI values, which averaged 1.01 in Semester 5.

4. Discussion

4.1. Impact of Remedial Actions

The poor performance of students in the exit exam during the benchmark semester (Semester 1) is consistent with the findings reported in the literature for other programs. For example, Al Ahmad et al. [21] reported an exit exam grade of 40–60% in an electrical engineering program. Elnajjar et al. [30] reported an exit exam grade of about 50% in a mechanical engineering program. Shafi et al. [31] concluded that PLO attainment in their computer science and computer information systems programs was negatively affected by the low scores in the exit exam.
The first remedial action in Semester 2 did not cause any impact on the students’ performance in the exit exam despite the fact that the undertaken actions in terms of the provision of sample questions, changing the timing of the exam, and removing questions of uncovered course materials were expected to improve the students’ performance. The lack of improvement upon implementing the first remedial measure is probably because of the time of its implementation, which took place during the early period of the COVID-19 pandemic. During this period, major disturbances in the educational process and normal life activities occurred, which increased the pressure on the students, making them unable to prepare or devote the least required effort to prepare for the exit exam. Nevertheless, a significant improvement of 30% in the average students’ exit exam scores occurred following the implementation of the second remedial action (Semester 3), whereby lengthy and ambiguous questions were replaced with short and clear ones. This boost in students’ exit exam performances likely resulted from the combined effect of the first two remedial actions.
The first three remedial actions collectively raised the average exit exam grade by 39% compared to the benchmark in Semester 1. Thus, the third remedial action, in which the weight of the exit exam to the final grade of the graduation project was increased from 5% to 10%, resulted in a 7% overall improvement in the students’ performance compared to the previous semester (Semester 3). While the change in the weight of the exit exam could have motivated the students to prepare better for the exam, the timing of the exam, clarity/simplicity of the questions, and availability of sample questions seemed to be more effective in improving their exam performance. This is in line with the observed second surge in the exit exam grades following the implementation of the fourth remedial action (Semester 5), where the entire pool of exam questions was made available to the students. The combined effect of the four remedial actions resulted in a 70% increase in the average exit exam score relative to the benchmark semester. The fourth remedial action itself resulted in an increase of about 22% in the average student score. Apparently, the availability of the exit exam material, compiled in a concise way, made it more appealing to students to better prepare for the exam. Overall, the adopted remedial measures seem to be effective in improving the performances of the students in the exit exam. Given that some of the applied remedial measures were based on previous students’ feedback [32], it is recommended that programs seeking better students’ achievements in the exit exam should seek the opinions of the students in the design and implementation of their remedial actions.

4.2. Quality Assurance and Quality Enhancement

Quality assurance (QA) and quality enhancement (QE) represent local and global priorities in higher education. QA necessitates reporting evidence that demonstrates student learning for accreditation and accountability, whereas QE aims to develop the QA processes and the corresponding data through formative means [33,34]. QE would include a host of activities, including the implementation of remedial actions and training techniques that support and improve student learning and achievement [35,36,37]. As shown in Table 4, only 6% of the students achieved a passing score of 60% or higher in the exit exam in the benchmark semester of Fall 2019. Furthermore, only 6, 22, 25, and 19% of the students scored 60% or higher in the specific questions aligned with PLO1, PLO2, PLO4, and PLO6, respectively (hereafter referred to as the level of attainment of PLO). These results indicated poor student performance in the exit exam, which necessitated the planning and implementation of remedial actions, as shown herein.
The continuous improvement process adopted in the present study included planning, implementing, monitoring, responding, and reporting. The exit exam in this study comprehensively assesses student learning and achievement of four distinct PLOs at graduation. The questions adopted in the exit exam were constructively aligned with the intended PLOs so that the student score in the exit exam questions could be used to determine the level of attainment of each learning outcome. A target exit exam performance standard of at least 70% of students scoring 60% or higher was set to demonstrate the achievement of the outcome [34].
An initial set of remedial actions (remedial actions #1 to #3) was then decided based on student feedback and discussions between concerned faculty members and at the level of the department council. These remedial actions required arrangements and approvals at the administrative level. As such, the initial set of remedial actions was implemented in sequence and compounded over three semesters. The implementation of the first set of remedial actions in Semester 2 insignificantly improved the student performance in the exit exam, where only 15% of the students scored 60% or higher in the exit exam questions. Similarly, the levels of attainment of PLO1, PLO2, PLO4, and PLO6 were in the range of 16–18%. The ineffectiveness of the remedial actions implemented in Semester 2, as manifested by the insignificant improvement in student performance, could be attributed to the COVID-19 pandemic that started in the same semester. Also, it seems that the sample of five practice questions given to the students per discipline was not adequate to grasp the proper techniques for solving the exit exam questions. Conversely, the implementation of the second remedial action in Semester 3, which included the replacement of lengthy and ambiguous questions with short and clear ones, combined with the first set of remedial actions significantly improved the student performance in the exit exam and their level of attainment of PLOs. The percentage of students who scored 60% or higher in the exit exam questions in Semester 3 increased significantly to 63%, which corresponded to 90% of the target (i.e., 70%). Similarly, the level of attainment of PLOs witnessed a significant improvement, where attainment levels in the range of 33 to 56% (i.e., 47 to 80% of the target) were recorded. Increasing the contribution of the exit exam to the final grade of the capstone graduation project (i.e., remedial action #3 in Semester 4) resulted in a minor additional improvement in the percentage of students who scored 60% or higher in the exit exam (69%) compared with that recorded in the preceding semester (63%). The level of attainment of PLOs ranged from 46 to 73%.
Student performance was continuously monitored and analyzed before and after the implementation of each remedial action for the first three semesters following the benchmark semester. Based on the analysis, it was decided to provide the students with the entire set of the exit exam questions for training and practicing purposes (a total of 523 questions with 247 questions in SM, 40 questions in GE, 40 questions in HT, 26 questions in CM, 43 questions in EE, 82 questions in SG, and 45 questions in WR). The implementation of this final remedial action in Semester 5 substantially improved the students’ performance in the exit exam, where 93% of students scored 60% or higher, thus demonstrating the achievement of the target performance. Also, the target for the attainment of PLOs was achieved for all PLOs, except for PLO6, having an attainment level of 66%, which was insignificantly lower than the target of 70%. The fourth remedial action represents a reflection upon the results of the analysis, which led to a considerable improvement in the students’ performance in the exit exam and helped them achieve the target performance standard.
The findings of the present study demonstrate how a critical assessment tool, such as the exit exam, can synergically demonstrate and advance student learning, thus meeting the benchmark of innovation and performance standards. The outcomes of the study verified that undertaking an assessment initiative should be accompanied by a thorough research component to ensure proper planning, analysis, and response [34,35,38,39]. Insights into successful continuous improvement processes are the key finding of this work. It could critically help position assessment innovations within the broader context of QA and QE.

4.3. Limitations and Future Studies

While this study adopted certain actions to enhance students’ motivation in preparing and undertaking the exit exam, other approaches could be adopted, such as providing certificates of performance for the examinees [40], listing the exam score on the student’s transcript, mandating that students pass the exam with a minimum score [21], increasing students’ awareness of the importance of the exam [40], and providing a training session [15] or a review session [19] to students before the exam. Feedback from students after the exam on their preparation method, aspects of motivation, and ways to improve their performance could provide insights for further improvements in the students’ performance on the exam.
Another limitation of this study is that it assessed the effect of applied remedial actions on the exit exam in a civil engineering program. It is anticipated that applying the same measures would improve the attainment of the exit exam for other engineering programs. However, additional studies should be carried out to confirm if such findings could be generalized to other programs. A third limitation is that the study did not investigate variations in the performances of students based on gender, ethnicity, family background, and country of origin. Although outcomes of the study at the current scope were deemed useful and appropriate, given the complexity of assessment change, future studies should consider expanding the scope of work to include other disciplines, various remedial actions, and expanded statistical data of participants.

5. Conclusions

This study highlights the significant positive impact of four systematic remedial actions on the performance of Civil Engineering students in exit exams. These carefully designed and implemented remedial actions led to a significant improvement in students’ exit exam scores over five semesters, with a more effective alignment with their GPAs. The findings highlight how targeted interventions can improve an assessment tool’s accuracy and relevance in engineering education, ensuring it truly reflects student competence and learning outcomes. The results of the study emphasize the importance of incorporating feedback mechanisms into the curriculum and assessment design. This allows for the timely identification of issues and enables the implementation of effective remedial actions. Assessment tools, particularly the exit exams, should be reviewed periodically and adjusted to ensure that they remain aligned with the learning outcomes and the current needs of the industry. This includes revising the weighting of exams, timing of assessments, and clarity of exam questions. The analysis conducted in this study also highlights the importance of leveraging data from assessments to make informed decisions about curricular and instructional changes. This approach should be integrated into a continuous improvement framework that seeks to enhance both student learning and program learning outcomes. Expanding this work in future studies to include other disciplines in addition to utilizing more detailed statistical data of students might generate more varied and segregated evidence for QA/QE in a higher education context. The implementation of other remedial actions focusing on motivating and rewarding students in future studies, including offering them certificates of performance and listing the exam score on the student’s transcript, could further improve the student performance and achievement in the exit exam. From a QA/QE viewpoint, both attainment and development are important.

Author Contributions

Conceptualization, H.E.-H., A.I., M.A.H., M.A.M. and T.E.-M.; Methodology, H.E.-H. and A.I.; Software, H.E.-H. and A.I.; Formal analysis, H.E.-H., A.I., M.A.M. and T.E.-M.; Investigation, H.E.-H., A.I., M.A.M. and T.E.-M.; Data curation, H.E.-H. and A.I.; Writing—original draft preparation, H.E.-H., A.I., M.A.H., M.A.M. and T.E.-M.; Visualization, H.E.-H., A.I. and M.A.H.; Project administration, H.E.-H. and A.I. All authors have read and agreed to the published version of the manuscript.

Funding

This research received no external funding.

Institutional Review Board Statement

Ethical review and approval were waived for this study, as the data used in this manuscript were not collected from students. The data represent their grades at the time of graduation and were collected from the department records. Still, these data were used in the manuscript anonymously, without including any student names or ID numbers. Additionally, students were not surveyed for the purpose of this study. The approval to collect and use student data (i.e., grades) for the purpose of this manuscript was obtained from the Department of Civil and Environmental Engineering at the United Arab Emirates University.

Informed Consent Statement

Not applicable.

Data Availability Statement

Data will be made available upon request.

Acknowledgments

The authors would like to acknowledge the support of the Civil and Environmental Engineering Department staff for their assistance in compiling the data for this work.

Conflicts of Interest

The authors have no conflicts of interest to report.

References

  1. Awoniyi, S.A. A Template for Organizing Efforts to Satisfy ABET EC 2000 Requirements. J. Eng. Educ. 1999, 88, 449–453. [Google Scholar] [CrossRef]
  2. Soundarajan, N. Preparing for Accreditation Under EC 2000: An Experience Report. J. Eng. Educ. 2002, 91, 117–123. [Google Scholar] [CrossRef]
  3. Henri, M.; Johnson, M.D.; Nepal, B. A Review of Competency-Based Learning: Tools, Assessments, and Recommendations. J. Eng. Educ. 2017, 106, 607–638. [Google Scholar] [CrossRef]
  4. Shaeiwitz, J.A. Outcomes Assessment in Engineering Education. J. Eng. Educ. 1996, 85, 239–246. [Google Scholar] [CrossRef]
  5. Violante, M.G.; Moos, S.; Vezzetti, E. A methodology for supporting the design of a learning outcomes-based formative assessment: The engineering drawing case study. Eur. J. Eng. Educ. 2020, 45, 305–327. [Google Scholar] [CrossRef]
  6. Kadiyala, M.; Crynes, B.L. A Review of Literature on Effectiveness of Use of Information Technology in Education. J. Eng. Educ. 2000, 89, 177–189. [Google Scholar] [CrossRef]
  7. Dodridge, M.; Kassinopoulos, M. Assessment of student learning: The experience of two European institutions where outcomes-based assessment has been implemented. Eur. J. Eng. Educ. 2003, 28, 549–565. [Google Scholar] [CrossRef]
  8. Chan, C.K.Y.; Zhao, Y.; Luk, L.Y.Y. A Validated and Reliable Instrument Investigating Engineering Students’ Perceptions of Competency in Generic Skills. J. Eng. Educ. 2017, 106, 299–325. [Google Scholar] [CrossRef]
  9. Tener, R.K. Outcomes Assessment and the Faculty Culture: Conflict or Congruence? J. Eng. Educ. 1999, 88, 65–71. [Google Scholar] [CrossRef]
  10. Huang-Saad, A.Y.; Morton, C.S.; Libarkin, J.C. Entrepreneurship Assessment in Higher Education: A Research Review for Engineering Education Researchers. J. Eng. Educ. 2018, 107, 263–290. [Google Scholar] [CrossRef]
  11. Woolston, D.C. Outcomes-based assessment in engineering education: A critique of its foundations and practice. In Proceedings of the 2008 38th Annual Frontiers in Education Conference, Saratoga, CA, USA, 22–25 October 2008; pp. S4G-1–S4G-5. [Google Scholar]
  12. Crespo, R.M.; Najjar, J.; Derntl, M.; Leony, D.; Neumann, S.; Oberhuemer, P.; Totschnig, M.; Simon, B.; Gutiérrez, I.; Kloos, C.D. Aligning assessment with learning outcomes in outcome-based education. In Proceedings of the IEEE EDUCON 2010 Conference, Madrid, Spain, 14–16 April 2010; pp. 1239–1246. [Google Scholar]
  13. ABET. Criteria for Accrediting Engineering Programs, 2020–2021. 2019. Available online: https://www.abet.org/accreditation/accreditation-criteria/criteria-for-accrediting-engineering-programs-2022-2023/ (accessed on 20 March 2024).
  14. Bishop, J.H. The Effect of Curriculum-Based External Exit Exam Systems on Student Achievement. J. Econ. Educ. 1998, 29, 171–182. [Google Scholar] [CrossRef]
  15. El-Hassan, H.; Hamouda, M.; El-Maaddawy, T.; Maraqa, M. Curriculum-based exit exam for assessment of student learning. Eur. J. Eng. Educ. 2021, 46, 849–873. [Google Scholar] [CrossRef]
  16. Kamoun, F.; Selim, S. On the Design and Development of WEBSEE: A Webbased Senior Exit Exam for Value-added Assessment of a CIS Program. J. Inf. Syst. Educ. 2008, 19, 209. [Google Scholar]
  17. Naghedolfeizi, M.; Garcia, S.; Yousif, N.A. Analysis of Student Performance in Programming Subjects of an In-house Exit Exam. In Proceedings of the ASEE Southeastern Section Conference, Louisville, KY, USA, 1–3 April 2007. [Google Scholar]
  18. Schlemer, L.; Waldorf, D. Testing The Test: Validity And Reliability Of Senior Exit Exam. In Proceedings of the 2010 Annual Conference & Exposition, San Diego, CA, USA, 27–30 June 2010; pp. 15.1202.1–15.1202.14. [Google Scholar]
  19. Thomas, G.; Darayan, S. Electronic Engineering Technology Program Exit Examination as an ABET and Self-Assessment Tool. J. STEM Educ. 2018, 18, 32–35. [Google Scholar]
  20. Watson, J.L. An Analysis of the Value of the FE Examination for the Assessment of Student Learning in Engineering and Science Topics. J. Eng. Educ. 1998, 87, 305–311. [Google Scholar] [CrossRef]
  21. Al Ahmad, M.; Al Marzouqi, A.H.; Hussien, M. Exit Exam as Academic Performance Indicator. Turk. Online J. Educ. Technol. 2014, 13, 58–67. [Google Scholar]
  22. Cowart, K.; Dell, K.; Rodriguez-Snapp, N.; Petrelli, H.M.W. An Examination of Correlations between MMI scores and Pharmacy School GPA. Am. J. Pharm. Educ. 2016, 80, 98. [Google Scholar] [CrossRef]
  23. Young, A.; Rose, G.; Willson, P. Online Case Studies: HESI Exit Exam Scores and NCLEX-RN Outcomes. J. Prof. Nurs. 2013, 29, S17–S21. [Google Scholar] [CrossRef] [PubMed]
  24. Slomp, D.; Marynowski, R.; Holec, V.; Ratcliffe, B. Consequences and outcomes of policies governing medium-stakes large-scale exit exams. Educ. Asse. Eval. Acc. 2020, 32, 431–460. [Google Scholar] [CrossRef]
  25. Varma, V. Internally Developed Departmental Exit Exams V/S Externally Normed Assessment Tests: What We Found. In Proceedings of the 2006 Annual Conference & Exposition, Chicago, IL, USA, 18–21 June 2006; pp. 11.817.1–11.817.6. [Google Scholar]
  26. Alolaywi, Y.; Alkhalaf, S.; Almuhilib, B. Analyzing the efficacy of comprehensive testing: A comprehensive evaluation. Front. Educ. 2024, 9, 1338818. [Google Scholar] [CrossRef]
  27. Sula, G.; Haxhihyseni, S.; Noti, K. Wikis as a tool for co-constructed learning in higher education—An exploratory study in an Albanian higher education. Int. J. Emerg. Technol. Learn. 2021, 16, 191–204. [Google Scholar] [CrossRef]
  28. Parent, D.W. Improvements to an Electrical Engineering Skill Audit Exam to Improve Student Mastery of Core EE Concepts. IEEE Trans. Educ. 2011, 54, 184–187. [Google Scholar] [CrossRef]
  29. Elnajjar, E.; Al Omari, S.-A.B.; Omar, F.; Selim, M.Y.; Mourad, A.H.I. An example of ABET accreditation practice of mechanical engineering program at UAE University. Int. J. Innov. Educ. Res. 2019, 7, 387–401. [Google Scholar] [CrossRef]
  30. Shafi, A.; Saeed, S.; Bamarouf, Y.A.; Iqbal, S.Z.; Min-Allah, N.; Alqahtani, M.A. Student outcomes assessment methodology for ABET accreditation: A case study of computer science and computer information systems programs. IEEE Access 2019, 7, 13653–13667. [Google Scholar] [CrossRef]
  31. El-Hassan, H.; Hamouda, M.; El-Maaddawy, T.; Maraqa, M. Student Perceptions of Curriculum-Based Exit Exams in Civil Engineering Education. In Proceedings of the IEEE EDUCON 2021 Conference, Online, 21–23 April 2021; pp. 214–218. [Google Scholar]
  32. Carless, D. Excellence in University Assessment: Learning from Award-Winning Practice; Routledge: London, UK, 2015. [Google Scholar]
  33. Barkley, E.; Major, C. Learning Assessment Techniques: A Handbook for College Faculty; Jossey-Bass: San Francisco, CA, USA, 1999. [Google Scholar]
  34. Deneen, C.; Boud, D. Patterns of Resistance in Managing Assessment Change. Assess. Eval. Higher Educ. 2014, 39, 577–591. [Google Scholar] [CrossRef]
  35. El-Maaddawy, T.; Deneen, C. Outcomes-based assessment and learning: Trialling change in a postgraduate civil engineering course. J. Univ. Teach. Learn. Prac. 2017, 14, 10. [Google Scholar] [CrossRef]
  36. El-Maaddawy, T. Innovative assessment paradigm to enhance student learning in engineering education. Eur. J. Eng. Educ. 2017, 42, 1439–1454. [Google Scholar] [CrossRef]
  37. Deneen, C.; Brown, G.; Bond, T.; Shroff, R. Understanding Outcome-Based Education Changes in Teacher Education: Valuation of a New Instrument with Preliminary Findings. Asia-Pac. J. Teach. Educ. 2013, 41, 441–456. [Google Scholar] [CrossRef]
  38. El-Maaddawy, T.; El-Hassan, H.; Al Jassmi, H.; Kamareddine, L. Applying Outcomes-Based Learning in Civil Engineering Education. In Proceedings of the 2019 IEEE Global Engineering Education Conference (EDUCON), Dubai, United Arab Emirates, 8–11 April 2019; pp. 986–989. [Google Scholar]
  39. Liu, O.L.; Rios, J.A.; Borden, V. The effects of motivational instruction on college students’ performance on low-stakes assessment. Educ. Assess. 2015, 20, 79–94. [Google Scholar] [CrossRef]
  40. Wise, S.L.; DeMars, C.D. Low examinee effort in low-stakes assessment: Problems and potential solutions. Educ. Assess. 2005, 10, 1–17. [Google Scholar] [CrossRef]
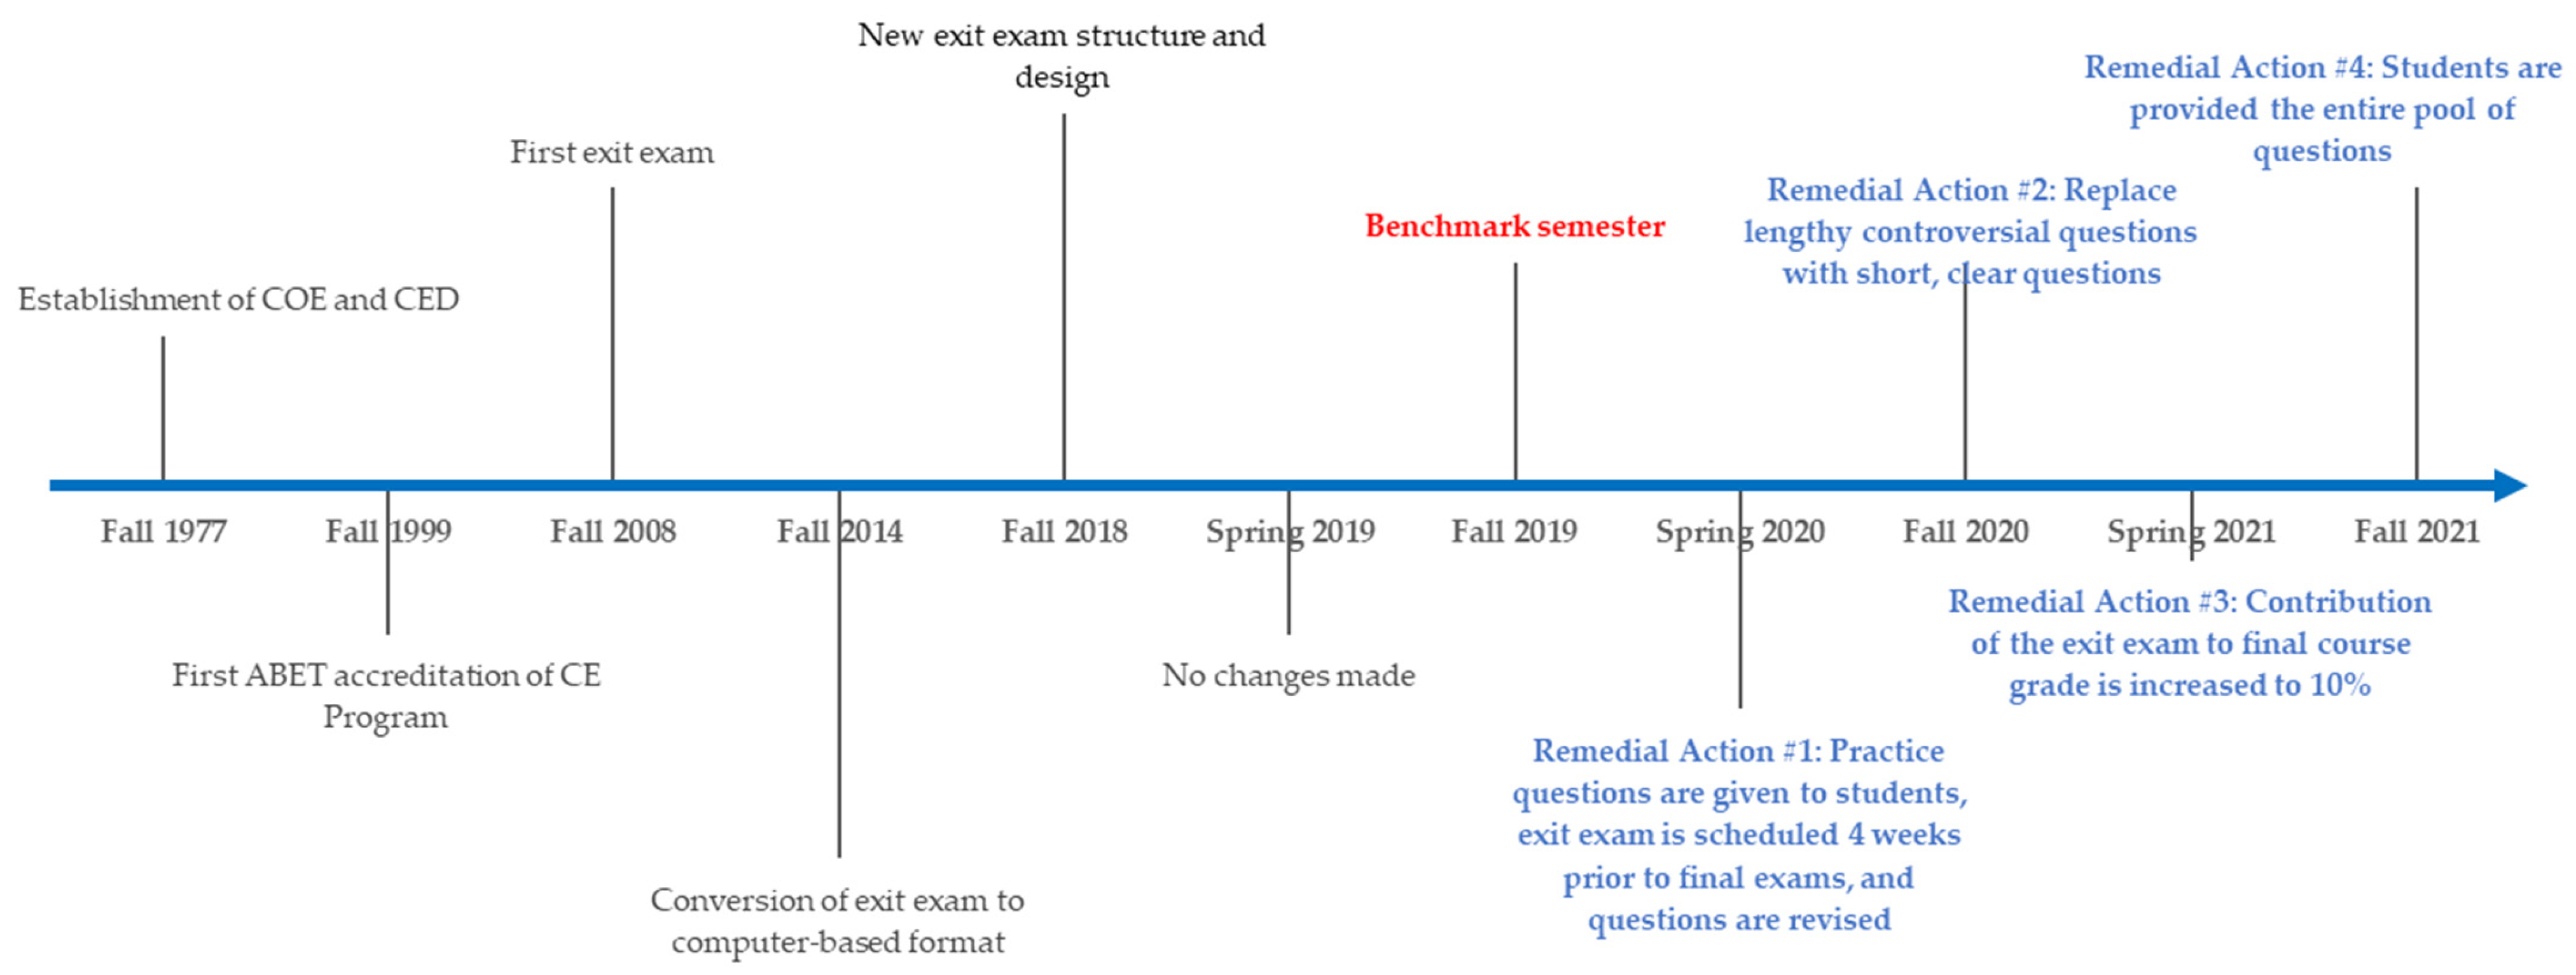
Figure 1. Timeline of events related to the exit exam.
Higheredu 03 00033 g001
Figure 2. Average exit exam grades in the five semesters under consideration.
Higheredu 03 00033 g002
Figure 3. Average discipline grade over the five semesters (error bar indicates the 95% confidence interval).
Higheredu 03 00033 g003
Figure 4. Exit exam scores for all students per semester.
Higheredu 03 00033 g004
Figure 5. Categorization of students’ exit exam scores per semester.
Higheredu 03 00033 g005
Figure 6. Normalized student exit exam scores over the five semesters.
Higheredu 03 00033 g006
Figure 7. Average exit exam scores and GPAs over the five semesters. The difference is between the average exit exam score and the GPA.
Higheredu 03 00033 g007
Figure 8. Relationship between student’s exit exam grade and GPA.
Higheredu 03 00033 g008
Figure 9. Consistency index for each student over time.
Higheredu 03 00033 g009
Figure 10. Student performance score over the five semesters.
Higheredu 03 00033 g010
Figure 11. Students with ranges for performance scores over time.
Higheredu 03 00033 g011
Table 1. Demographics and GPAs of participants.
Semester No.Semester DesignationTotal Number of StudentsNumber of Students Based on GPAAverage GPA (%)
<70%70–79%80–89%>90%
1Fall 2019350296075.5 ± 4.1
2Spring 2020320257076.6 ± 4.5
3Fall 20202701710077.0 ± 4.9
4Spring 20215203814076.8 ± 5.2
5Fall 20212901910077.5 ± 4.1
Table 2. Hypothesis testing for the differences in the average exit exam scores.
SemesterNumber of StudentsBenchmark
Score * (%)
Average Exit Exam (%)Confidence
Interval
t-ValueNull
Hypothesis
23245.946.7[−6.19, 4.58]−0.29Cannot be Rejected
32745.960.1[−19.17, −9.21]−5.58Rejected
45245.964.4[−22.98, −14.02]−8.09Rejected
52945.978.1[−36.68, −27.69]−14.04Rejected
* Benchmark score is for Semester 1.
Table 3. Correlation between the average GPA and average exit exam score.
SemesterNumber of StudentsAverage GPA (%)Average Exit Exam (%)Confidence
Interval
t-ValueNull Hypothesis
13575.545.9[26.3, 32.9]17.54Rejected
23276.646.7[25.2, 34.6]12.40Rejected
32777.060.1[12.6, 21.2]7.70Rejected
45276.864.4[8.9, 16.0]6.83Rejected
52977.578.1[−4.4, 3.2]−0.30Cannot be rejected
Table 4. Percentage of students who scored 60% or higher.
Semester
No.
Semester
Designation
Exit ExamPLO1PLO2PLO4PLO6
1Fall 20196%6%22%25%19%
2Spring 202015%16%16%16%18%
3Fall 202063%56%56%56%33%
4Spring 202169%73%52%65%46%
5Fall 202193%93%93%69%66%
Disclaimer/Publisher’s Note: The statements, opinions and data contained in all publications are solely those of the individual author(s) and contributor(s) and not of MDPI and/or the editor(s). MDPI and/or the editor(s) disclaim responsibility for any injury to people or property resulting from any ideas, methods, instructions or products referred to in the content.