1. Background of the Study
In higher education programs, the development of research competency is a major milestone in the students’ curriculum due to its potential to instill critical thinking and transition students into the professional workforce [
1,
2]. A pivotal aspect of research competency development lies in statistics, given its fundamental role in analyzing data to support research findings [
3]. For example, researchers need descriptive statistics to summarize characteristics of the data, while inferential statistics makes inferences of the population from the sample at hand to test hypotheses and answer research questions [
3,
4]. At a more advanced level, structural equation modeling (SEM), a multivariate statistical technique, is often utilized to examine relationships between variables of interest [
5]. These examples show that statistics is essential in developing research skills in undergraduate students [
2]. Despite its significance, statistics components are often perceived as challenging by students [
6]. This difficulty is attributed to the mathematical components inherent in statistics, which might pose comprehension challenges compared to content that focuses on facts and ideas [
7,
8].
In fact, a considerable number of students who learn statistics belong to majors outside mathematics or statistics, such as political science or psychology [
9]. The challenges faced by these students in statistics courses could induce subject-related anxiety, highlighting the struggle in grasping statistical concepts [
6,
10]. It is established that students’ proficiency in statistics, as represented by their formative assessment scores, can determine their overall performance in the statistics course [
10,
11]. However, whether students’ statistical proficiency can predict their research competency, as reflected by their final scores in a research methods course, has yet to be examined. In response to this gap, we perform an investigation to identify specific statistical topics that can predict students’ final course grades in a research methods course. This investigation seeks to identify areas of importance, providing a foundation for a strategic approach to emphasize and refine relevant topics in the statistics course.
To fulfill the aim of our research, we employ a supervised machine learning model to identify influential predictors of students’ performance in a research method class. The overarching research question is as follows: “
How is the predictability of skills in statistics to students’ research competency?” The predictor variables are students’ formative scores in each topic from a statistics course, as well as their learning behavior in the statistics course as auxiliary variables. The outcome variable is students’ learning performance in the research method class. Results from the analysis include a predictive regression model for students’ final course score in a research method course, a predictive classification model for students’ success in the research method course, and lists of important predictors to the targeted variable as well as their influence on the prediction. While predicting students’ statistical competency is more directly related to the predictors, predicting students’ research competency may allow us to extrapolate the results to examine how well students can practically apply statistical concepts to real-world research scenarios, especially in research-oriented professions [
12].
Instead of relying on traditional statistical analysis for retrospective inference, we employ a machine learning approach to predict students’ research competency. This approach offers an algorithm and predictors as a guideline to inform instructors in developing their course designs on the research methods topics [
13]. Machine learning technology has been extensively employed in educational settings, particularly in the field of learning analytics. In this context, data on students’ learning performance, interactions with course materials, and behaviors such as assignment submission times are leveraged to inform decision-making for both students and instructors [
14]. Furthermore, this study contributes to the body of knowledge by identifying topics in statistics that are crucial in determining students’ research competency. Ideally, instructors should ensure that students understand every topic of the course material. However, it is impractical to deliver the entire course content at a detailed yet slow pace, considering the time limit of a standard program. Such a program typically allows a maximum of three teaching hours per day over a 16-week semester [
15]. This research could highlight the topics in statistics that need more emphasis to increase efficiency in developing students’ research competency. By investing time and resources into enhancing the accessibility of these topics, instructors could enhance students’ background knowledge in statistics and consequently their competency in the research methods course.
4. Methods
4.1. Dataset
The dataset utilized in this study encompasses undergraduate students’ profiles from both a statistics course and a research methods course at a Thai university, totaling N = 385 participants. All students enrolled in the research method course during the semester following their completion of the statistics course. The statistics course serves as a prerequisite for enrollment in the research methods course. Both courses are instructed by various faculty members, all of whom are affiliated with the Department of Research and Psychology. Approximately half of the instructors teach both courses.
Both the statistics and research methods courses incorporate traditional lectures along with lab or tutorial sessions. Students are required to submit their assignments electronically via a learning management system. In the statistics course, assignments include both individual and group work. However, only individual assignments are considered in calculating the variable for cheating behavior. Both statistics and research methods courses are taught with both traditional lecture and lab/tutorial. Students were instructed to submit their assignments electronically through a learning management system. Data preprocessing and predictive model development primarily relied on the R programming language [
30]. Data on the variables of interest were collected as part of their learning performance and behavior during the two courses. Assessments were conducted in Thai, the official language and medium of instruction at the university.
Table 1 describes a list of variables utilized in this study and their code. The dataset utilized in this study is classified as secondary data due to its its anonymity to the primary researchers. This ensures minimal ethical concerns, as there exists no feasible method for re-identifying the participants.
4.2. Feature Selection
For feature selection, statistics topics were categorized into three main categories: 1. The interpretation category includes topics involved in translating and summarizing the analysis results from data (i.e., describing the data distribution, analyzing the relationship between variables using statistical measures and data visualizations, and interpreting results from hypothesis testing such as t-test or ANOVA. 2. The concept category comprises topics involving essential theories and principles of statistical methods such as sampling distributions, estimation, and hypothesis testing. This category also covers the understanding of statistical assumptions for statistical tests, the rationale behind different types of data scales (nominal, ordinal, interval, and ratio), and the conceptual framework for choosing appropriate statistical tests based on research questions and data characteristics. 3. The method selection category involves the practical application of statistical techniques and decision-making processes to choose the most suitable methods for data analysis based on the nature of data and research objective. Specifically, this category includes selecting the correct types of t-tests (one-sample, independent, or paired-sample), choosing between parametric and non-parametric tests based on data distribution and sample size, deciding on the appropriate correlation coefficients (Pearson, Spearman, or Cramer’s V) to examine the strength and direction of relationships between variables, and selecting the appropriate regression model for predicting outcomes or explaining the relationship between multiple variables. These three main variables were calculated based on students’ final exam scores as outlined in the test blueprint. The final exam weights 30% of the overall course grade.
Predictors that account for students’ background comprised three variablesas follows: first, the students’ time taken to complete the assignment, represented by their average time of submission collected through a learning management system; second, the students’ submission rate (whether students submitted the assignment); and third, the students’ post-lecture quiz performance, represented by the average score of the post-class exercise in each lecture. These exercises were administered electronically via an online learning platform. They were designed to assess students’ understanding of the lecture, providing a measure of the students’ attention to the concepts taught in class. The content of the quizzes are questions that mirror the content taught earlier in the class such as statistical concepts or analysis results interpretation. Since this course is taught in the Faculty of Education, the students’ technical knowledge, such as mathematical formulas or equations, is not assessed unless necessary. The accuracy of the students’ responses does not contribute to their overall class grade. However, the completion of the quiz within the specified time frame is considered part of their class participation score, which accounts for 10% of the overall class grade. Data on these three variables were collected and extracted through a learning management system.
Finally, students’ cheating behavior is indicated by the median cosine similarity among their open-ended homework responses. A value close to 1.00 means a student’s work is very similar to others’, hinting at possible plagiarism. While assignments in the statistics course include both individual and group components, only individual work is used in computing the cheating behavior variable. These individual assignments typically comprise open-ended tasks that prompt students to express their opinions or respond to questions based on analysis results or given scenarios. Given the open-ended nature of these tasks, variations in students’ responses are expected. To detect potential cheating behavior, the researcher calculated cheating behavior scores by evaluating assignment similarity using cosine similarity between students’ responses. A high cosine similarity between responses may imply cheating behavior in their open-ended assignments. In total, seven variables served as predictors in this study. All of these variables were continuous.
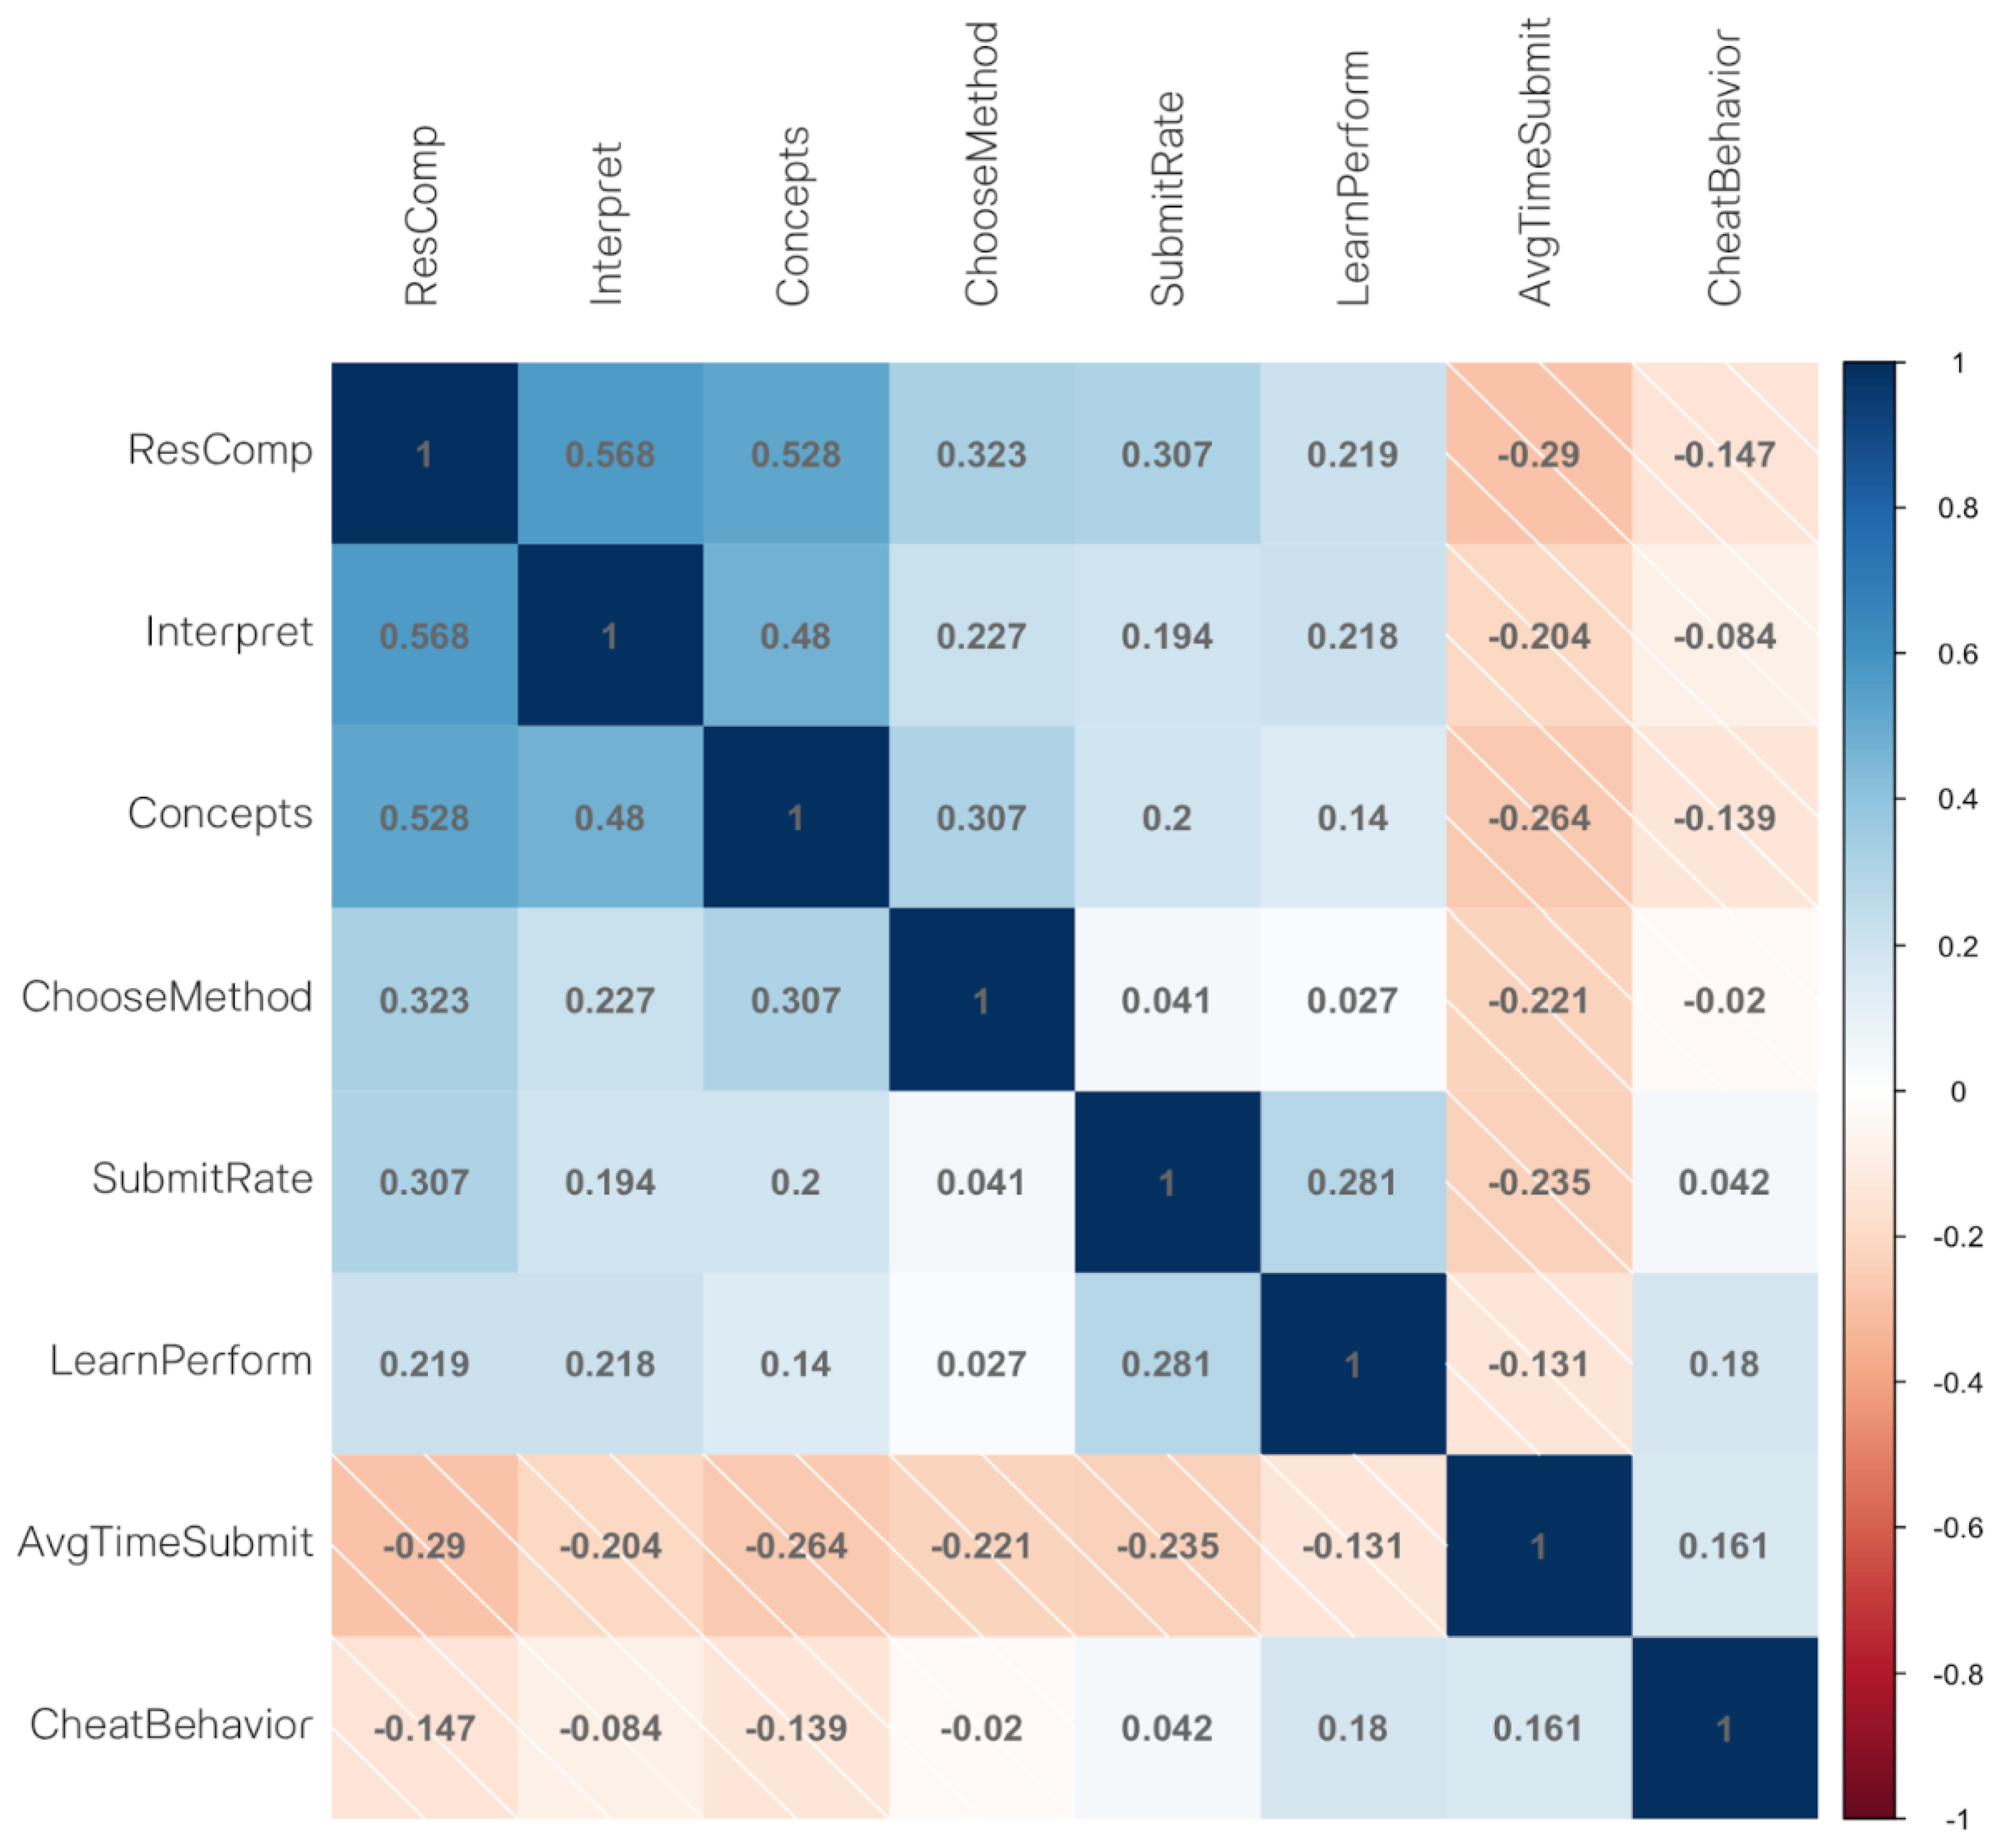
All predictors were chosen for their relevance to students’ performance in statistics. The three categories of statistical skills were chosen because they represent the fundamental skills taught in the statistics course and align with the RSD framework. Additionally, predictors regarding students’ background were included to provide context for their statistical skills. These auxiliary variables reflect students’ effort in tasks, which can impact their learning of statistical skills. The outcome variable is the students’ final course score in the research method course for the regression task. For the classification task, the score was categorized into two classes, with class 1 representing students who achieve 80% and above in the final research method course grade and class 0 representing students who achieve below 80% in the final research method course grade. All predictors were examined with a correlational analysis to ensure their relationships among each other and relationships to the outcome variable.
4.3. Illustrative Tasks and Questions for Measured Variables
The task example and question example of the measured variables (i.e., Interpret, Concepts, Choosemethod, Learnperform, and Rescomp) are as follows.
4.3.1. Interpret
Tasks and questions under this variable focus on students’ ability to understand and explain statistical results. A task example of this component is “Interpret the output of a correlation analysis. Describe what the coefficients indicate about the relationship between two variables”. A question example would be ”Data analysts have found that insufficient rest is correlated with students’ exam performance, with a correlation coefficient of r = −0.886. Please interpret the result of this analysis appropriately.” Finally, this component accounts for approximately 33% of the tasks and questions in the statistics course.
4.3.2. Concepts
This variable assesses students’ understanding of fundamental statistical concepts. A task example of this component is “Explain the concept of multicollinearity problems in regression analysis.” A question example can be seen in
Figure 1.
This component also accounts for approximately 33% of the tasks and questions in the statistics course.
4.3.3. Choosemethod
This variable evaluates students’ ability to select appropriate statistical methods for various research scenarios. A task example of this component is “Given a research scenario where you need to compare the means of two dependent groups, which statistical test would you choose and why?” A question example can be seen in
Figure 2.
Similarly to the other two components, this component also accounts for approximately 33% of the tasks and questions in the statistics course.
4.3.4. LearnPerform
As an auxiliary variable from the statistics course, the LearnPerform variable was assessed through post-lecture quizzes designed to evaluate students’ immediate understanding and retention of the lecture material. Each quiz consisted of a mix of multiple choice, true/false, and short answer questions. However, the students’ response correctness does not contribute to the overall course grade; only their participation in the quiz does. Therefore, students who participate in all quizzes will receive a full 10% toward their final grade in the statistics course regardless of their response correctness. Students who partially complete the quiz will receive a prorated quiz score. See
Figure 3 for an example of a short answer question. See
Figure 4 for an example of a true/false question. See
Figure 5 for an example of a multiple choice question.
4.3.5. ResComp
Aside from the three categories of students’ statistical proficiency, the dependent variable of students’ research competency was assessed through a combination of practical assignments, mid-term exams, and the final project. The final grade for the research methods course was determined by a weighted average of these components.
Assignments: Practical assignments required students to apply statistical methods to analyze datasets, interpret results, and write reports. An example of the assignment task is “Analyze the provided dataset using an appropriate statistical test to determine if there is a significant difference in test scores between two teaching methods. Submit a report detailing your analysis, results, and conclusions.”
Midterm Exam: The mid-term exam consisted of theoretical questions and practical problems requiring statistical analysis and interpretation. An example of a midterm exam question is “Describe the assumptions of ANOVA and perform an ANOVA test on the given dataset. Interpret the results.”
Final Project: The final project involved a comprehensive research study, where students formulated a research question, collected and analyzed data, and presented their findings. The overall direction of the final project in the research method course is “Conduct a research study on a topic of your choice, using appropriate statistical methods to analyze the data. Prepare a report that includes your research question, methodology, analysis, results, and conclusions.”
The students’ final grade in the research method course was determined as follows: assignments, 30%; midterm exam, 30%; and final project, 40%.
4.4. Data Preprocessing
In terms of data preprocessing, one case exhibited missing values, which were addressed using the bootstrap aggregating trees imputation technique via the recipe package [
31]. We conducted the train–test split procedure using the "initial split" function from the rsample package [
31], with a split ratio of 80% for training data and 20% for testing data. For the classification task, there was a 60:248 discrepancy between the number of instances in class 1 and class 0, respectively, indicating a moderate class imbalance issue. To mitigate this, we employed the Synthetic Minority Oversampling Technique (SMOTE) from the themis package [
32]. SMOTE synthesized additional instances of the minority class (class 1), resulting in a balanced class proportion of N = 248 for each class in the final dataset used for classification. The final dataset for the classification task comprised 419 instances for training and 77 for testing datasets. For the regression task, the final dataset consisted of 308 instances for training and 77 instances for testing datasets.
4.5. Predictive Algorithm
For predicting the outcome variable, we employed the Elastic-net regularized generalized linear model (GLM) as our predictive algorithm [
33,
34]. The Elastic-net GLM model is similar to the commonly used ordinary regression procedure but incorporates additional features such as a penalty term. This term effectively reduces the coefficients of unimportant predictors (i.e., predictors that contribute minimally to the prediction), thereby preventing overly complex models and mitigating potential multicollinearity issues [
34].
The Lasso method can shrink predictive coefficients of influential variables to exactly zero, effectively performing variable selection by retaining only the most important predictors for model simplification [
35]. The ridge method, unlike lasso, does not set any coefficients to zero but rather reduces their coefficient to minimize the impact of less important features while keeping all variables in the model [
35]. Elastic-net regularization introduces two penalty parameters: lambda (
) and alpha (
). The
parameter controls the overall strength of the penalty, while the
parameter determines the mix between ridge (
= 0) and lasso (
= 1) regularization [
34]. This flexibility allows Elastic-net to perform well in various situations, balancing the benefits of both types of regularization.
This choice was made after comparing various predictive algorithms for both regression and classification tasks, including random forest, k-nearest neighbor, support vector machine, and extreme gradient boosting trees. These algorithms yielded comparable results. However, the Elastic-net GLM possesses an advantage of interpretability. Given its linear nature, this model allows for clear interpretation of how predictors influence the outcome variable directionally [
33]. Additionally, linear models, like the Elastic-net GLM, have been shown to perform well with small sample sizes compared to ensemble models such as random forest [
36]. This advantage was further enhanced by the quality of the data, as variables were meticulously selected based on their pairwise relationships [
37]. By employing the Elastic-net GLM, our aim was to leverage its interpretability and effectiveness in modeling the relationship between predictors and the outcome variable.
4.6. Hyperparameter Tuning and Evaluating Metrics
To optimize both the regression and classification algorithms, the Latin Hypercube grid search method was utilized for its efficiency, offering comparable results to other approaches but at a lower computational cost [
38,
39]. The tuned hyperparameters were Elastic-net penalty terms and mixing parameters, both possessing the range of 0 to 1. Both algorithms had 50 sets of random hyperparameter values, through 10-fold cross validation with the 5 repetitions method (5 × 10-fold CV), totaling 2500 number of trials. Following the identification of the optimal hyperparameter combination, both the regressor and classifier models underwent further training, testing, and validation using 5 × 10-fold CV to ensure optimal performance.
The evaluation of the regression algorithm’s effectiveness was based on regression metrics such as root mean squared error (RMSE) and R-squared. For the classification algorithm, classification metrics such as area under curve (AUC), precision, recall, F1 score, and accuracy were consulted. The regression metrics of RMSE and R-Squared are detailed as follows: RMSE is a measure of the differences between predicted and observed values. It is calculated as the square root of the average of the squared differences between the predicted and actual values [
40]. RMSE is particularly useful for understanding the magnitude of errors in the predictions, with lower values indicating better model performance. R-squared is a statistical measure that represents the proportion of the variance in the dependent variable that is predictable from the independent variables. It ranges from 0 to 1, with higher values indicating a better fit of the model to the data [
40].
The classification metrics of AUC, precision, recall, F1 score, and accuracy are detailed as follows [
40]: AUC is the area under the Receiver Operating Characteristic curve, which plots the true positive rate (sensitivity) against the false positive rate (1-specificity). AUC provides a single value to evaluate the performance of a classifier across all threshold values. A higher AUC indicates better model performance, with a value of 1 representing a perfect classifier, and a value of 0.5 representing a model with no discriminative ability. Precision, also known as the positive predictive value, is the ratio of true positive predictions to the total number of positive predictions (both true positives and false positives). It reflects the accuracy of the positive predictions made by the model. Recall, also known as sensitivity or true positive rate, is the ratio of true positive predictions to the total number of actual positive instances (both true positives and false negatives). It measures the model’s ability to correctly identify positive instances (i.e., students who achieve a grade of B or above). The F1 score is the harmonic mean of precision and recall, providing a single metric that balances both concerns. Finally, accuracy is the ratio of the number of correct predictions (both true positives and true negatives) to the total number of predictions. It is a straightforward measure of how often the model is correct.
6. Discussion
This study aims to identify key predictors among undergraduate students’ statistical skills and learning behavior within a statistics course, with the goal of predicting their research competency as represented by their performance in a research methods course. The findings of this study align with various learning theories. Specifically, the statistics interpretation skills are positioned on the evaluating and analyzing levels on Bloom’s revised taxonomy because they involve the critical process of making sense of statistical outputs by analyzing results and assessing their quality [
41]. These two levels on Bloom’s taxonomy require higher comprehension in the subject matter, and therefore it could be inferred that students who have mastered the statistics interpretation skills can apply their statistical knowledge more effectively in developing their research competency.
Conversely, students’ grasp of statistical concepts resides at the understanding level within Bloom’s framework, which involves the ability to describe the relationship between principles of statistical methods and their underlying assumptions [
21]. Similarly, proficiency in selecting appropriate statistical methods operates primarily at the understanding and remembering levels, as students must match suitable data analysis techniques with the characteristics of their data. This skill may entail a lower level of comprehension compared to the understanding of statistical concepts, given its focus on the practical matching of data and methods rather than abstract conceptualization [
21,
41]. As a result, it is reasonable to infer that these latter two skills may exhibit comparatively less predictive power regarding students’ research competency, as they require a lower level of comprehension in the subject matter compared to statistics interpretation skills.
From the methodological perspective, our study’s use of a supervised machine learning model to predict research competency from statistical proficiency is consistent with existing research that highlights the potential of machine learning in educational contexts. Prior studies have demonstrated that machine learning can provide actionable insights into student learning behaviors and outcomes, which can help educators tailor their instructional strategies [
11,
42]. Our findings, which identify key statistical skills that predict research competency, add to this growing field by highlighting the importance of targeted instruction in statistics to enhance research skills through the application of machine learning technique.
From the theoretical perspective, the findings of this study also align with the framework of feedback levels proposed by Hattie and Timperley [
43], which distinguishes between task-level feedback (i.e., how tasks are performed) and process-level feedback (i.e., the cognitive processes necessary to execute tasks effectively). When instructing students on the selection of statistical analysis methods, the majority of the feedback may concentrate on the task level, emphasizing correct and incorrect answers based on factual knowledge [
43]. For instance, instructors might guide students to choose ANOVA for comparing continuous variables across multiple categorical groups, citing its formula and applicability [
21]. This task-oriented instruction pertains to concrete and surface-level knowledge, demanding primarily task-level feedback.
In contrast, teaching students about statistical principles and the interpretation of statistical results involves a more analytical approach. Here, students must connect underlying statistical principles with the context of their study to derive meaningful interpretations. For example, understanding the nature of an intervention is crucial for interpreting statistical significance between pretreatment and post-treatment data [
21]. Such tasks necessitate process-level instruction and feedback due to the abstract nature of statistical principles and contextual variables involved. Consequently, skills related to understanding statistical concepts and interpreting statistical results may wield greater influence on students’ research competency, as they engage learners in deeper levels of understanding and cognitive processing [
43].
In a broader context, the findings of this study, which indicate that statistical proficiency can predict students’ research competency, are consistent with similar studies conducted in different educational contexts. For instance, Marsan et al. [
44] found that fostering students’ understanding of basic statistical concepts, such as hypothesis testing, experimental design, and interpretation of research findings, led to an increased confidence in their grasp of these concepts. Additionally, students began to appreciate the benefits of learning statistics by reporting that learning statistics is helpful. Similarly, Lateh [
45] identified statistics as a crucial component in developing students’ research skills, which can subsequently be transferred into essential 21st-century skills such as creativity, innovation, critical thinking, and problem-solving. These skills are vital for enabling students to become competent professionals after graduation. Furthermore, Pudjiastuti [
46] demonstrated that students’ statistical literacy enhances their critical thinking skills, which has broader applications in research. For example, students who engaged extensively with statistical coursework were better equipped to critically analyze research methodologies and data interpretation in various academic and professional settings. This ability to critically assess and apply statistical knowledge highlights the importance of statistical education in fostering overall research competency. This cross-study comparison highlights the significant role of statistical education in preparing students for the demands of the modern workforce and underscores its relevance in academic curricula.
The inclusion of behavioral aspects such as submission rates and cheating behavior as predictors of students’ research competency, even though auxiliary within the scope of this study, offers valuable insights into students’ learning behaviors and motivations as learning process data. Process data, which represent students’ problem-solving processes such as the time taken to complete assignments, not only predict the final learning outcomes but also indicate actionable steps students can take to improve their performance [
47]. For example, in an online learning platform, detailed process data—including time spent on assignments, submission rates, clickstream data, resource access frequency, and revision patterns—can be analyzed to identify key predictors of student success. Educators might find that timely submissions and frequent engagement with supplementary resources correlate with better research competency. This information can guide targeted interventions, such as time management workshops, submission reminders, and resource utilization tips, thereby supporting each student’s journey towards achieving competency.
Findings regarding these learning process data align with previous literature in a sense that formative learning activities can be used to predict students’ learning performance [
11]. In fact, the negative relationship of cheating behavior and time taken to complete assignments to students’ research competency can be attributed to the concept of self-efficacy, which plays a crucial role in shaping students’ academic outcomes [
48,
49]. Individuals with low self-efficacy may exhibit reduced effort in their learning endeavors due to diminished motivation and a sense of lack of control over their academic success [
48,
50]. Consequently, they may perceive themselves as incapable of achieving high scores, leading to behaviors such as procrastination or resorting to academic dishonesty. Conversely, the positive association between students’ submission rates and post-lecture quiz performance reflects their intrinsic motivation and attention to learning [
50]. Students with high self-efficacy levels are more likely to be driven by internal motivations to excel academically, resulting in greater engagement and ultimately enhanced proficiency in statistics that contribute to their research competency [
50].
7. Conclusions
This study advances our understanding of the crucial role that statistical proficiency plays in the development of research competency among higher education students. Employing supervised machine learning techniques, the research performed both regression and classification tasks to predict students’ final course scores and likelihood of achieving a letter grade of B or higher, respectively. The guiding research question is, “
How is the predictability of skills in statistics to students’ research competency?” To answer the research question, our findings indicate that three primary categories of statistical skills—namely, understanding of statistical concepts, proficiency in selecting appropriate statistical methods, and statistics interpretation skills—can be used to predict students’ research competency as demonstrated by their final course scores and letter grades. Additionally, factors related to students’ learning behavior, such as assignment submission rates, post-lecture quiz performance, and academic dishonesty, serve as supplementary predictors. Our analyses reveal that statistics interpretation skills emerge as the most influential predictor, followed by the understanding of statistical concepts and method selection proficiency, respectively. The results are consistent with the existing literature, as statistical interpretation is a key aspect that contributes to students’ statistics anxiety as measured by the Statistical Anxiety Rating Scale [
51,
52]. These insights hold implications for instructors seeking to enhance the design of research methods courses within higher education contexts.
The implication of this study highlights the importance for instructors of statistics courses to prioritize lessons and tasks aimed at cultivating students’ foundational understanding of statistical principles and their skills in interpreting statistical results. This implication aligns with Zaffar et al.’s [
53] finding that highlights the role of machine learning in identifying influential predictors among a large number of variables to inform decisions made in the educational context. In the context of research methods courses, instructors could incorporate review lectures focusing on these areas to reinforce students’ proficiency and readiness for applying statistical concepts to research formulation. This approach has the potential to bolster students’ research competency by equipping them with a robust statistical foundation. In fact, recent studies indicate that employing a strategic teaching approach, which involves demonstrating the practical application of statistical theories to undergraduate students, effectively reduces anxiety levels in statistics [
2,
54]. This approach can enhance students’ performance in statistics courses and their subsequent research methodology skills.
To enhance the practical implications of statistical education, instructors may allocate a significant portion of class time to reinforce students’ understanding of statistical concepts through real-world examples. These examples could include applying sampling distribution in market research surveys, utilizing hypothesis testing for quality control purposes, or exploring scales of measurement in psychological constructs. To effectively implement this strategy, guest lecturers or workshops could be invited to illustrate the practical applications of these concepts, thus motivating students to engage with foundational statistical principles. Moreover, instructors can foster students’ ability to interpret statistical data by integrating data visualization tools such as Tableau Public [
55], RAWgraphs [
56], or OpenRefine [
57] into the curriculum. By incorporating these tools, students can gain hands-on experience in interpreting patterns and relationships within datasets. For instance, they could analyze relationships between variables using scatter plots or compare distributions using box plots. Additionally, the incorporation of data visualization tools could be used to facilitate case study discussions to provide students with opportunities to apply their statistical interpretation skills in real-world scenarios, further solidifying their understanding of these concepts.
Moreover, the implications of this study can be viewed through the lens of learning analytics, as it leverages the capability of machine learning alongside students’ learning data encompassing both performance metrics and learning activities [
42]. Researchers and instructors can leverage these findings to develop predictive systems that inform teaching and feedback strategies. For instance, instructors could utilize such systems to monitor the students’ progress in statistical skills across the three categories of statistical skills and intervene proactively when students show signs of falling behind, thereby ensuring that students maintain a solid grasp of statistics essential for effective learning in research methods courses. Researchers could additionally create a live platform capable of predicting students’ final scores based on their current scores in three key categories. This platform would empower students to visualize their potential future performance, thereby fostering self-regulated learning behaviors and ultimately improving their academic outcomes through informed decision-making [
58]. By integrating the mentioned strategies, instructors can foster a learning environment conducive to enhancing students’ research competency and overall academic success.
This study has limitations to be aware of. Firstly, the small sample size, while common in undergraduate-level courses like statistics and research methods due to the nature of supervision-based learning, may limit the generalizability of the findings, particularly in the context of machine learning studies. To address this limitation, future research should consider incorporating longitudinal data to track students’ progress over time. This approach would allow for a larger and more diverse sample size, thereby enhancing the robustness and generalizability of the predictive algorithms used in this study. Longitudinal data would provide long-term insights into how statistical skills develop and influence research abilities throughout students’ academic careers and beyond. Secondly, the constrained sample size also restricts the selection of predictive algorithms, precluding the use of more complex models such as neural networks or random forest ensembles in their most effective form. With a larger dataset, researchers could explore the application of these advanced algorithms, potentially yielding more reliable prediction outcomes suitable for developing predictive systems in educational settings. Lastly, future investigations could expand upon the variables considered, including factors like the implementation of problem-based learning approach. Such an approach could promote knowledge retention and the practical application of skills acquired in higher education, such as statistics and research, within real-world scenarios [
59]. By incorporating these additional variables, future studies can provide a more thorough understanding of the factors influencing students’ research competency to inform the design of more effective educational interventions.


