Article

Multiple Enrollment Policy: Survival Analyses and Odds of Graduating in at Least One University Degree Program

by
Alexander Karl Ferdinand Loder
Performance and Quality Management, University of Graz, 8010 Graz, Austria
Trends High. Educ. 2024, 3(3), 578-601; https://doi.org/10.3390/higheredu3030034
Submission received: 5 June 2024 / Revised: 30 June 2024 / Accepted: 9 July 2024 / Published: 12 July 2024

Abstract

:
Austria (Europe)’s university system does not allocate tuition fees to its students and allows for multiple simultaneous enrollments. This leads to students having different constellations between earlier enrollments, i.e., “pre-studies”, and their current ones. This study aimed at gathering explorative insights into the relationship of these constellations with students’ outcomes (graduation/dropout). The sample consisted of 61,098 unique students in 108,915 programs between the academic years 2010/11 and 2022/23, with 24% of students having multiple enrollments and 26% having pre-studies. Survival analyses showed higher probabilities of graduating in each semester when students had pre-studies. Odds ratio tests revealed that the odds of graduation in at least one program are lower when having pre-studies in bachelor’s programs, but higher in master’s programs. This can be explained by the transferability of exam results, a possible knowledge transfer and academic readiness as well as a higher workload with an increasing number of enrollments.

1. Introduction

Austria (Europe)’s university system reported constant graduation numbers for the last ten years from 2011/12 to 2021/22 ranging from 34,238 and 37,359 graduations. On average, these are 35,494 (SD = 1155.11) graduations per academic year. Following the peak during the COVID-19 pandemic in 2020/21 (37,359), graduation numbers now show a decline since 2021/22 [1], tending to stay below the mean established in the last decade. What is more, there is also a constant decrease in beginners, i.e., new enrollments, as official numbers showed 57,600 beginners in 2016/17, 55,071 in 2018/19, a COVID-19 peak of 56,492 in 2020/21 and a low of 53,291 in 2022/23 [1]. According to OECD data for 2022, Austria lies in the middle of all OECD countries with 43% of 22–34-years-olds having tertiary education, near the OECD average of 47%. The range goes from 13% for Indonesia to 67% for Canada, with European countries having diverse outcomes, e.g., Italy (29%), Bulgaria (34%), Czechia (35%), Germany (37%), Slovak Republic (39%), Poland (41%), Finland (41%), Iceland (41%), Estonia (44%), Portugal (44%), Greece (45%), Latvia (46%), Slovenia (47%), Denmark (49%), France (50%), Spain (51%), Switzerland (51%), Belgium (51%), Sweden (52%), Netherlands (56%) and Norway (56%). In the United States, the percentage is at 51% [2]. In line with this, the national strategy until 2030 is to increase yearly graduation numbers on the program level by +13% [3,4]. In view of a possibly oversaturated labor market for university graduates in Europe [5], this means not necessarily raising the number of students that graduate per se, but the number of completed programs, which can be more than one per person. Research on dropout and graduation behavior is needed to be able to create future measures to fulfill this goal, although the current trends go against it. The Austrian university system allocates no tuition fees to students and allows them to enroll in an unlimited number of degree programs in a parallel or consecutive fashion [6]. Gaining a deeper understanding of the outcomes of the Austrian multiple enrollment policy can both promote the development of appropriate strategies and measures and as well aid other university systems. In other countries, increasing costs of college education, unwillingness to travel long distances and unwillingness to incur long-term debts, among other things, lead to a decline in university beginners [7,8]. A decline in beginners is a known problem in other countries as well [9,10]. Research in the Austrian university system may be able to support policy decisions worldwide.

1.1. Austria’s University System

Regulative measures have been set up by law to ensure fast and efficient studying. From a university perspective, the major regulation affecting university governance revolves around the workload students accomplish in their studies per academic year measured by ECTS credits, i.e., the European Credit Transfer System, with one ECTS credit being the equivalent of 25 real-time working hours [11,12]. Crossing a threshold of 16 ECTS credits in an academic year in a given program is considered “active”. Only active programs are eligible for funding by the public funding system of Austrian universities. Together with graduation numbers, student activity is responsible for a large part of the potential budget of public universities [6]. From a governance perspective, it is therefore important to ensure fast and efficient studying to program completion.
For students, three performance-based measures have been defined by law to facilitate graduation: (1) a minimum ECTS requirement, (2) the beginning and orientation phase and (3) so-called “tolerance semesters” until fees are allocated to students. The first two measures apply to the program level, not to the student level, meaning that students with multiple enrollments need to fulfill these goals in every program. The minimum requirement is defined as reaching 16 ECTS credits or more until the end of the second academic year after enrolling into a program or enrollment expires and students are banned from re-enrolling [13]. The beginning and orientation phase is most undergraduate programs, consisting of a list of first-semester courses between 8 and 20 ECTS credits total. Completion is mandatory to be allowed to progress with the rest of curriculum beyond a buffer of 22 ECTS credits that can come from other courses [6]. The third regulation is concerned with allocating tuition fees to students not graduating from their programs in a number of so-called “tolerance semesters”. For most degree program types, this tolerance timeframe is defined as two semesters above the minimum required time of a program and tuition fees must be paid after one program of a student crosses this time limit [6].

1.2. Higher Education Student Retention

Students pursue higher education for reasons of extending their student life, continuing their studies and obtaining a university degree; it can be because of expectations from family and friends, wanting to increase their social status or for higher chances of better earnings, getting their dream jobs and career growth prospects [14]. However, not all students manage to graduate from a degree program. Longer-lasting multidimensional processes can create an accumulating load for students, leading to a set of complex problems until dropping out seems inevitable [15,16,17,18]. Other influences on dropping out and retention can be the demographic background of students as well as financial aspects and academic readiness [19]. Due to the regulations of the Austrian university system, student workload is crucial to avoid negative consequences. Courses with continuous assessment or difficult parts of a curriculum not corresponding with students’ abilities can produce negative outcomes [20]. In this context, a high workload can lead to academic pressure [21], which can entail anxiety, stress, mental exhaustion or burnout, and affect student performance [22]. This may further increase the load on them and their dropout risk. Previous research showed that students with multiple enrollments accomplish more workload that their single-enrollment peers, even after dropping out [23]. However, workload is inversely related to time to graduation in that students with better grades tend to complete a higher workload during a semester compared to others [24]. It was also shown that high workloads as incentive can decrease the overall study duration to graduation [25]. This makes this time dimension an important component for research. With study duration also being part of the regulations of the Austrian university system for students that can lead to negative consequences, longitudinal data should be one focus of research on multiple enrollments. In line with this, analyses are needed that can account for data on multiple years and constellations of multiple enrollments. One method that has been used in the past for studying longer timeframes is survival analysis, e.g., for user retention of mobile apps [26]. It has also been transferred to higher education research and was used on large datasets in the context of dropout and student retention [27,28].

1.3. Multiple Enrollments

There were around 31,000 more enrolled programs at public universities than students during the winter semester 2023/24 [1]. However, these numbers do not show historic changes in enrollment, meaning that only current enrollments are counted. Usually requiring the general university entrance qualification at the end of high school, an admission age between 18 and 21 years can be considered a regular entrance age into the university system. As indicated by 40% of women and almost 50% of men being in the age group above 26 years (observed in February 2023), students spend more time in the university system than the minimum required time to complete a program [1]. This makes a high prevalence of multiple enrollments over the course of students’ lifecycles in the university system stand to reason.
For the investigation of students’ graduation outcomes, it is important to incorporate the different historic constellations of program enrollments students can have, since research shows that prior knowledge is an important performance predictor of college students [29]. Although not every student may be able to transfer specific declarative knowledge from one field of study to another, e.g., when switching from psychology to chemistry, deeper level procedural knowledge is also associated with better performance [30,31]. Declarative knowledge refers to details and facts, not representing a whole [32], while procedural knowledge means the ability to integrate or apply knowledge, to understand relations between concepts and apply them to problem solving [33]. A third dimension, metacognition, refers to the ability to plan strategies for problem solving and is also linked to academic success [34]. Since both procedural knowledge and metacognition can be acquired and learned in the university setting [35,36], a knowledge transfer in these dimensions from one study program to another is likely. This implies that students who were previously enrolled in a program may have advantages over first timers and that having multiple studies at once may also result in knowledge transfer.
On the one hand, being enrolled in more than one program and taking them in a parallel fashion also means a higher workload and therefore possibly prolonged times to graduation. On the other hand, it needs to be taken into consideration that high workload is associated with higher dropout rates [37]. This may mean that the odds of graduating increase the lower the workload. Lastly, one’s commitment to the university is a factor influencing students’ decisions to leave university [38,39]. By enrolling in more than one program, a higher commitment among students gravitating towards thoughts of dropping out, compared to those staying in one single program, may be assumed. Although commitment and the odds of graduating may be higher in students with more than one program, the high workload may counteract students’ efforts and still lead to lower odds of completing a program in the end, depending on the degree level. Little is known about this tradeoff between the workload of multiple programs and the odds of graduating. Previous research on multiple enrollments in Austria has only been conducted in smaller settings, focusing on student satisfaction and performance, showing different effects for those in one and those in more enrollments [40]. What is needed is research on larger databases that concentrates on student outcomes in multiple enrollments, incorporating the different possible enrollment constellations over time.

1.4. Research Aim and Expectations

The aim of this study is to gather insights into student outcomes in a university system with a multiple enrollment policy on all degree levels (bachelor’s, master’s and diploma). The twofold research question is as follows: How do students in one and multiple enrollments differ in their graduation and dropout behavior when they leave the university system considering earlier programs and what are their odds of graduating from these groups? This is carried out in two blocks, focusing on (1) the time students stay in the university system based on their degree program and their past as well as currently enrolled programs and (2) their odds of graduation with respect to the possible constellations of multiple-program studying. Following the existing research and assumptions of this study, the first hypothesis is that graduates with multiple enrollments have lower chances of leaving the university system in every semester than those with one program. Having earlier enrollments increases the chances of staying in the system compared to single enrollment students, but also increases time to graduation. Those who drop out with a single program show a lower chance of staying in the system in every semester compared to those with multiple programs. Earlier enrollments also facilitate the chance to leave in every semester. The second hypothesis states that students with one enrollment have the highest odds of graduation when there are earlier (non-overlapping) enrollments. The odds of graduation in multiple programs are highest for those with previous enrollments.

2. Materials and Methods

2.1. Data Background and Sample Characteristics

Data were queried from the administrative student database of the University of Graz at the end of September 2023. This is among Austria (Europe)’s largest universities with around 30,000 enrolled students per academic year. The initial sample consisted of all degree programs with a valid enrollment from students in the academic years between 2010/11 and 2022/23. Currently enrolled programs of students were excluded. Only students with the outcomes “dropout” or “graduation” were used in the dataset. Censoring of enrolled students was not considered, as only finished programs were of interest in this study. Doctoral programs and other non-traditional program types were also excluded, leaving 61,098 unique students in 108,915 programs in the final dataset. Due to being based on the administrative database, there were no missing data and the sampling method included all students meeting these inclusion criteria. This means the sample is the population of all students in bachelor’s, master’s and diploma degree programs of the last decade at the University of Graz with either “dropout” or “graduation” as outcome. A very high representativeness of the sample for other Austrian universities can be assumed, which may lower with increasing distance outside of the German-speaking and mid-European area, depending on the design of other university systems.
The Austrian degree system consists of bachelor’s, master’s and diploma degree programs. While bachelor’s and master’s programs usually have a minimum required time of six and four semesters, respectively, diploma programs have a minimum required time of eight semesters [6,41]. Diploma programs are divided into two or three segments, similar to the bachelor-master segmentation, but a degree (“magister”/“Mag.”) is only achieved upon completing the entire program. While bachelor’s programs can be designed not to allow students to take exams from their consecutive master’s programs, the segmentation in diploma programs is less strict. This means that students can take exams from the second or third segment even if they have not finished the first one, with some restrictions for certain course sequences that require specific exams to be passed. Due to being one program instead of two separate degrees, there is more freedom in course taking for students. However, compared to bachelor’s programs, there is also potential for students to delay difficult exams to the very end of their curriculum due to the free structure, possibly leading to late dropouts. Both bachelor’s and diploma degrees can be enrolled in after obtaining a university entrance qualification, while master’s degrees are limited to having completed one of these degrees [6]. There are no consecutive master’s programs for diploma programs, as for bachelor’s programs, e.g., bachelor’s and master’s degree in psychology. However, some master’s programs are open to enrollment after either a bachelor’s or diploma degree has been successfully finished, e.g., Ethics, Global Studies or specialized law programs. In the dataset, the diploma degree programs were pharmacy, teacher training and law, with pharmacy and teacher training being replaced with bachelor’s–master’s degree programs over the years [6].

2.2. Definition: Earlier Degree Programs, Pre-Studies

Earlier degree programs were entitled “pre-studies” and defined as programs on the same degree level students enrolled into prior to an observed one. There could be a time overlap between the programs or the pre-studies could already be finished as either dropout or graduate. Dropping out and enrolling again is treated as switched programs. Overlap means that each one of two programs has a valid enrollment at the same time. The criterion was that a pre-study had to be started at least one semester prior to an observed program. Around 26% of all students (15,758) had previous programs on a same degree level at the University of Graz; as graduate, dropout or overlapping enrollment. Multiple enrollments were defined as all enrollments students had simultaneously or in short succession from one program to another. To be counted as a pre-study or parallel program, students must have registered a new enrollment after leaving a program no longer than one academic year earlier. Strictly counting programs of students either enrolled simultaneously or adjacent to the next academic year or semester, 57,524 (76%) students in the dataset had no enrollments meeting the criteria of parallel or consecutive enrollments. Among the 24% of students with multiple programs (18,535 students), a double enrollment was most common (21% of all students) and more than three enrolled studies accounted for less than 1% of all students. The maximum number of parallel study programs was 14 (one case). The relative and observed frequencies can be found in Table 1. The total may differ for the one-program and multiple-program groups, since there are students with follow-up programs on equal degree levels more than one semester or academic year apart, therefore not qualifying for the abovementioned criteria.

2.3. Data Structure and Grouping Procedure

The final data structure was made up of three columns—(1) pre-study, (2) observed program and (3) parallel program—which led to different non-exclusive groups of studies. In the raw data format, each observed program represented one row. A student who was enrolled in five programs during the target timeframe would have five rows, one for each program. If they had multiple programs, the parallel column contained the second program. The other way round, a second row with this exact parallel program as observed program contained the former observed program in the first row as a parallel program. This led to row duplication, depending on the point of view. The same grouping method was applied to students’ pre-studies, with pre-studies and parallel programs only being visible in their respective columns if their formation criteria were met for the observed program as described above. The major implication of this structure is that an observed program row can show a pre-study program without a second row containing the same pre-study in its observed column, that is, unless there is a time overlap between the two programs, making them parallel programs from the second point of view, having an entry in the parallel column. Having more than one pre-study fulfilling the inclusion criteria, one observed program is multiplied, showing each of the pre-study programs in a different row. Compared to parallel programs, each row is distinct from each other for pre-studies.
To get rid of row duplication for parallel and multiple programs and to make each row unique, the observed program was set to a neutral value, to ensure that multiplied rows affected by multiple programs in the parallel column were kept to a minimum after applying a distinct function to the data. Still, some programs were multiplied in the dataset for cases with more than one pre-study or parallel program related to one single observed program. This results in 93,259 programs without pre-studies, 11,075 programs that were switched and 7821 programs of students beginning a new program in addition to an existing one without switching. Comparing the unique counts of programs and the sum of these values, it can be inferred that the multiplication generated 3240 more rows, affecting less than 3% of all programs in the dataset. This small number of cases in relation to the size of the dataset is not likely to influence the results to a great degree, which is why they were not removed. By deleting students who were affected by the multiplication effect, more data would have been lost than leaving them in the dataset due to a need to remove all programs of those students, not just one row per student.

2.4. Variables

The major time variable for survival analyses was the time students spent in the university system, dependent on the outcome (dropout or graduation). This means the number of semesters per program was extended from the timeframe of the beginning of the observed program to the end of the parallel program, if the column was not empty. This represents the overall overlapping time between the two. Pre-studies have not been considered in this time variable, since the observed program was treated as the base for the calculations. Pre-studies were also included in the rows of the dataset as observed programs. However, the threefold constellation of the columns could be different for each observed study program of a student, given the criteria for overlapping or consecutive programs that need to be fulfilled in order to have an entry in the pre-study or parallel columns.
Depending on the pre-study column and the characteristics of the programs linked to the column’s entries, a grouping variable was created for the pre-studies. This could have the labels “no previous enrollment”, “previous enrollment with switch” or “previous enrollment without switch”. Switching was defined as a consecutive sequence of two studies in short succession. The timeframe was set to a maximum of one academic year. Without switch means that two enrollments were kept valid at the same time (parallel), while a true switch means ending one enrollment and starting another program. The grouping variable for multiple programs was calculated using the characteristics of the programs referenced in the parallel column: programs of students with only an entry in the observed program were labeled “one program” and if there was an entry in the parallel program the label “two or more programs“ was registered.

2.5. Apparatus

A PC with an installation of Windows® 11 was used for the execution of the calculations and data queries. It had a 16-core processor with 64 GB RAM. The university’s database is run on an Oracle® SQL-server with the Oracle Instant Client 19®. Analyses as well as data curation were performed with R [42] and the raw data were queried from the databased using the RODBC package [43] Survival analyses, their plots and the odds ratios were calculated with the survival [44], ggsurvfit [45] and epitools [46] packages.

2.6. Statistical Analyses

Survival analyses with Kaplan–Meier curves and Cox-regression models were calculated for each degree type and student status outcome (dropout, graduation). These methods have been used in previous studies on college student dropout [47,48,49]. In the Kaplan–Meier curves, the 95% confidence interval was included. Significant differences in survival times between the groups of the pre-study group variable were determined using Chi-square tests. The Cox-regression models with hazard-ratio estimations were used as effect sizes for the models. The hazard ratio indicates the instantaneous rate of an event’s occurrence, based on the students in the data still at risk for the event [50]. For instance, using the outcome leaving the university, a hazard ratio of 0.50 for students without pre-studies compared to students with pre-studies, who switched their program, would mean that 0.50 times as many students without pre-studies are leaving the system than students who switched programs. A positive hazard ratio means a worse prognosis, while a negative hazard ratio means a protective effect of the variable involved.
Odds ratio tests have been conducted using “graduation at least in one study program” as the outcome, either in the observed or the parallel column. Graduation from pre-studies was not included. The method was median-unbiased estimation with confidence intervals [46]. While keeping one event in a target group at 1, the odds ratio represents the odds of an event occurring in another group. Comparing the odds ratio for students without pre-studies and only being enrolled in one program to students without pre-studies and being enrolled in two or more programs, the value 0.50 for the second group would mean that these students (in two or more programs) have 0.50 the odds of graduation in at least one program compared to the other group (students in one program).
The analyses were conducted on degree level to account for predefined differences in the minimum required time to finish a program. Survival analyses were selected over simpler tests, e.g., linear regression, as they allow for a more accurate representation of the whole timeframe students spend in the university system. In this study, each potential semester students stay in the system is considered relevant. Odds ratio tests were chosen as not merely the difference between two program types in an outcome variable was of interest. They give a measure to compare different outcomes within their own rate of occurrence.

3. Results

3.1. Survival Analyses

Separately for each degree level, student outcome and for students in one and multiple programs, survival analyses were conducted to compare students’ probability of staying in the university system grouped by their pre-studies. Kaplan–Meier curves are depicted in Figure 1, Figure 2, Figure 3, Figure 4, Figure 5, Figure 6, Figure 7, Figure 8, Figure 9, Figure 10, Figure 11 and Figure 12 and the results of Chi-square and Cox-regression models for all curves are shown in Table 2. Risk tables are included in the plots, showing values for every other semester (0, 2, 4 …).

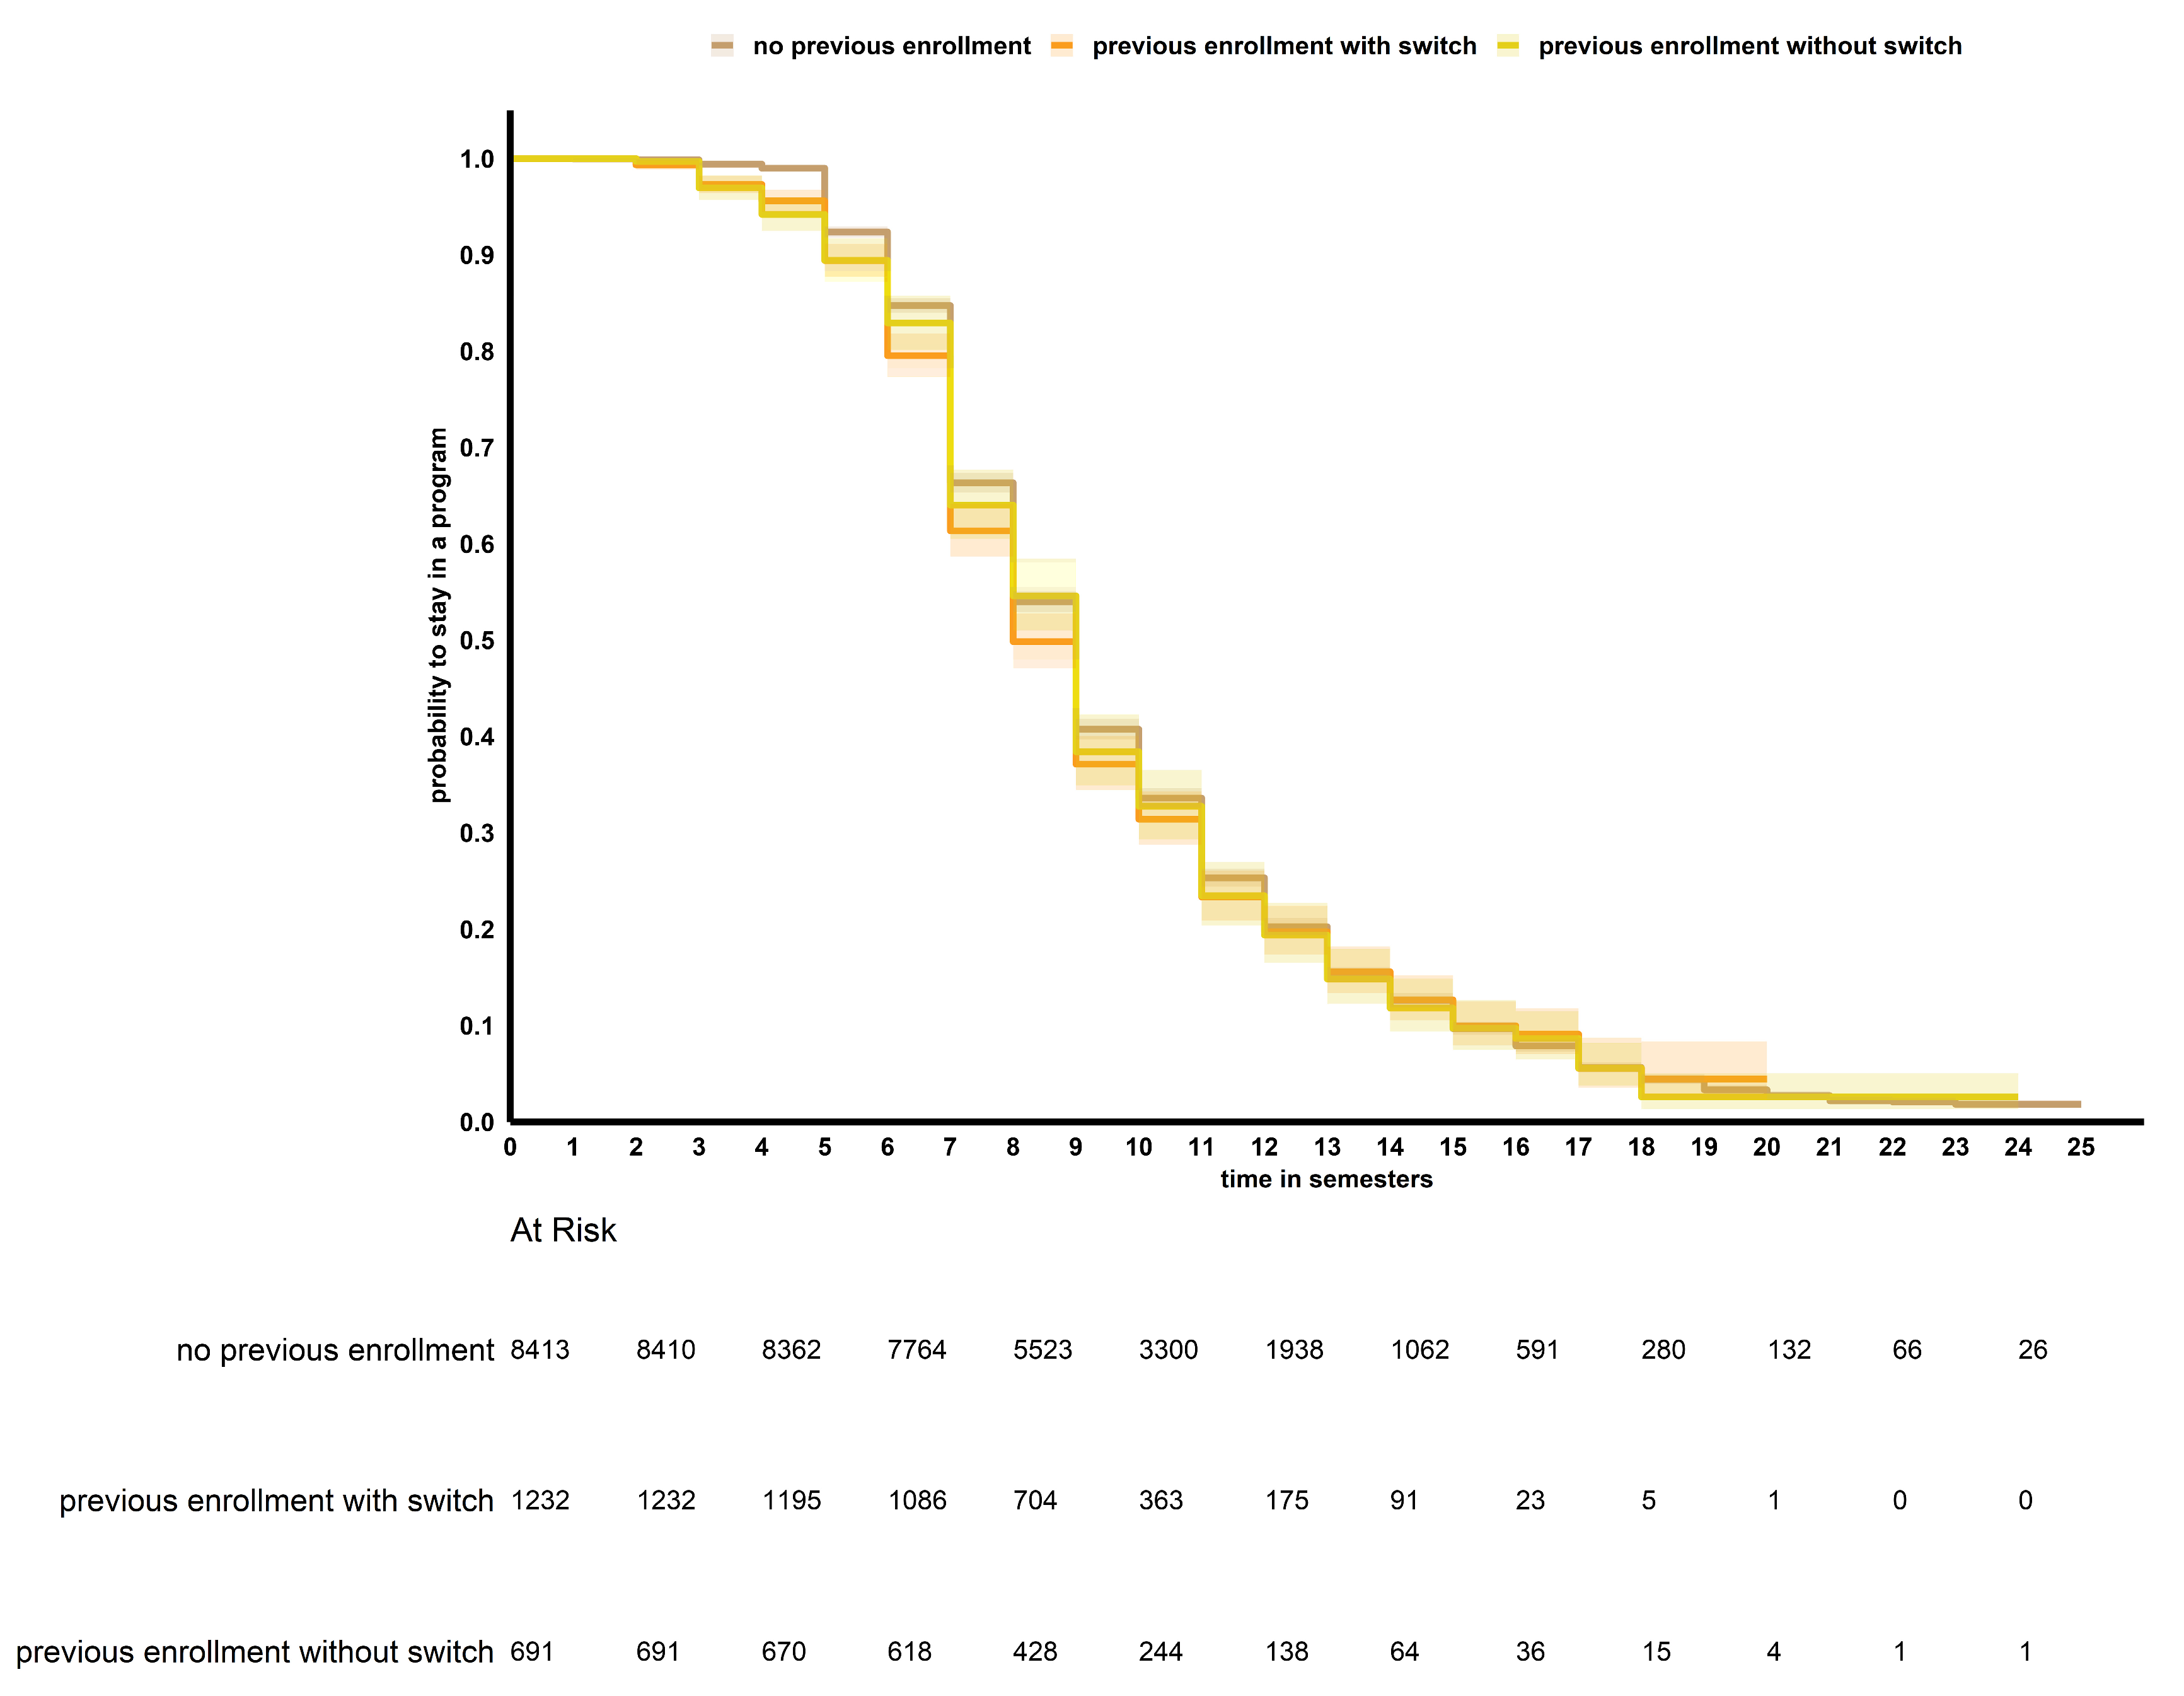
3.1.1. Bachelor’s Programs

The following Figure 1, Figure 2, Figure 3 and Figure 4 show Kaplan-Meier curves for bachelor’s programs. Figure 1 and Figure 2 focus on dropouts, while Figure 3 and Figure 4 depict graduates. Figure 1 and Figure 3 show students with one enrollment, while Figure 2 and Figure 4 show students with multiple enrollments.
Figure 1. Kaplan–Meier survival curves of bachelor’s degree programs from students with one enrollment and the outcome dropout, comparing the number of semesters students spend at the university until leaving, grouped by their pre-studies on the same degree level.
Higheredu 03 00034 g001
Figure 2. Kaplan–Meier survival curves of bachelor’s degree programs from students with multiple enrollments and the outcome dropout, comparing the number of semesters students spend at the university until leaving, grouped by their pre-studies on the same degree level.
Higheredu 03 00034 g002
Figure 3. Kaplan–Meier survival curves of bachelor’s degree programs from students with one enrollment and the outcome graduation, comparing the number of semesters students spend at the university until leaving, grouped by their pre-studies on the same degree level.
Higheredu 03 00034 g003
Figure 4. Kaplan–Meier survival curves of bachelor’s degree programs from students with multiple enrollments and the outcome graduation, comparing the number of semesters students spend at the university until leaving, grouped by their pre-studies on the same degree level.
Higheredu 03 00034 g004

3.1.2. Master’s Programs

The following Figure 5, Figure 6, Figure 7 and Figure 8 show Kaplan-Meier curves for master’s programs. Figure 5 and Figure 6 focus on dropouts, while Figure 7 and Figure 8 depict graduates. Figure 5 and Figure 7 show students with one enrollment, while Figure 6 and Figure 8 show students with multiple enrollments.
Figure 5. Kaplan–Meier survival curves of master’s degree programs from students with one enrollment and the outcome dropout, comparing the number of semesters students spend at the university until leaving, grouped by their pre-studies on the same degree level.
Higheredu 03 00034 g005
Figure 6. Kaplan–Meier survival curves of master’s degree programs from students with multiple enrollments and the outcome dropout, comparing the number of semesters students spend at the university until leaving, grouped by their pre-studies on the same degree level.
Higheredu 03 00034 g006
Figure 7. Kaplan–Meier survival curves of master’s degree programs from students with one enrollment and the outcome graduation, comparing the number of semesters students spend at the university until leaving, grouped by their pre-studies on the same degree level.
Higheredu 03 00034 g007
Figure 8. Kaplan–Meier survival curves of master’s degree programs from students with multiple enrollments and the outcome graduation, comparing the number of semesters students spend at the university until leaving, grouped by their pre-studies on the same degree level.
Higheredu 03 00034 g008

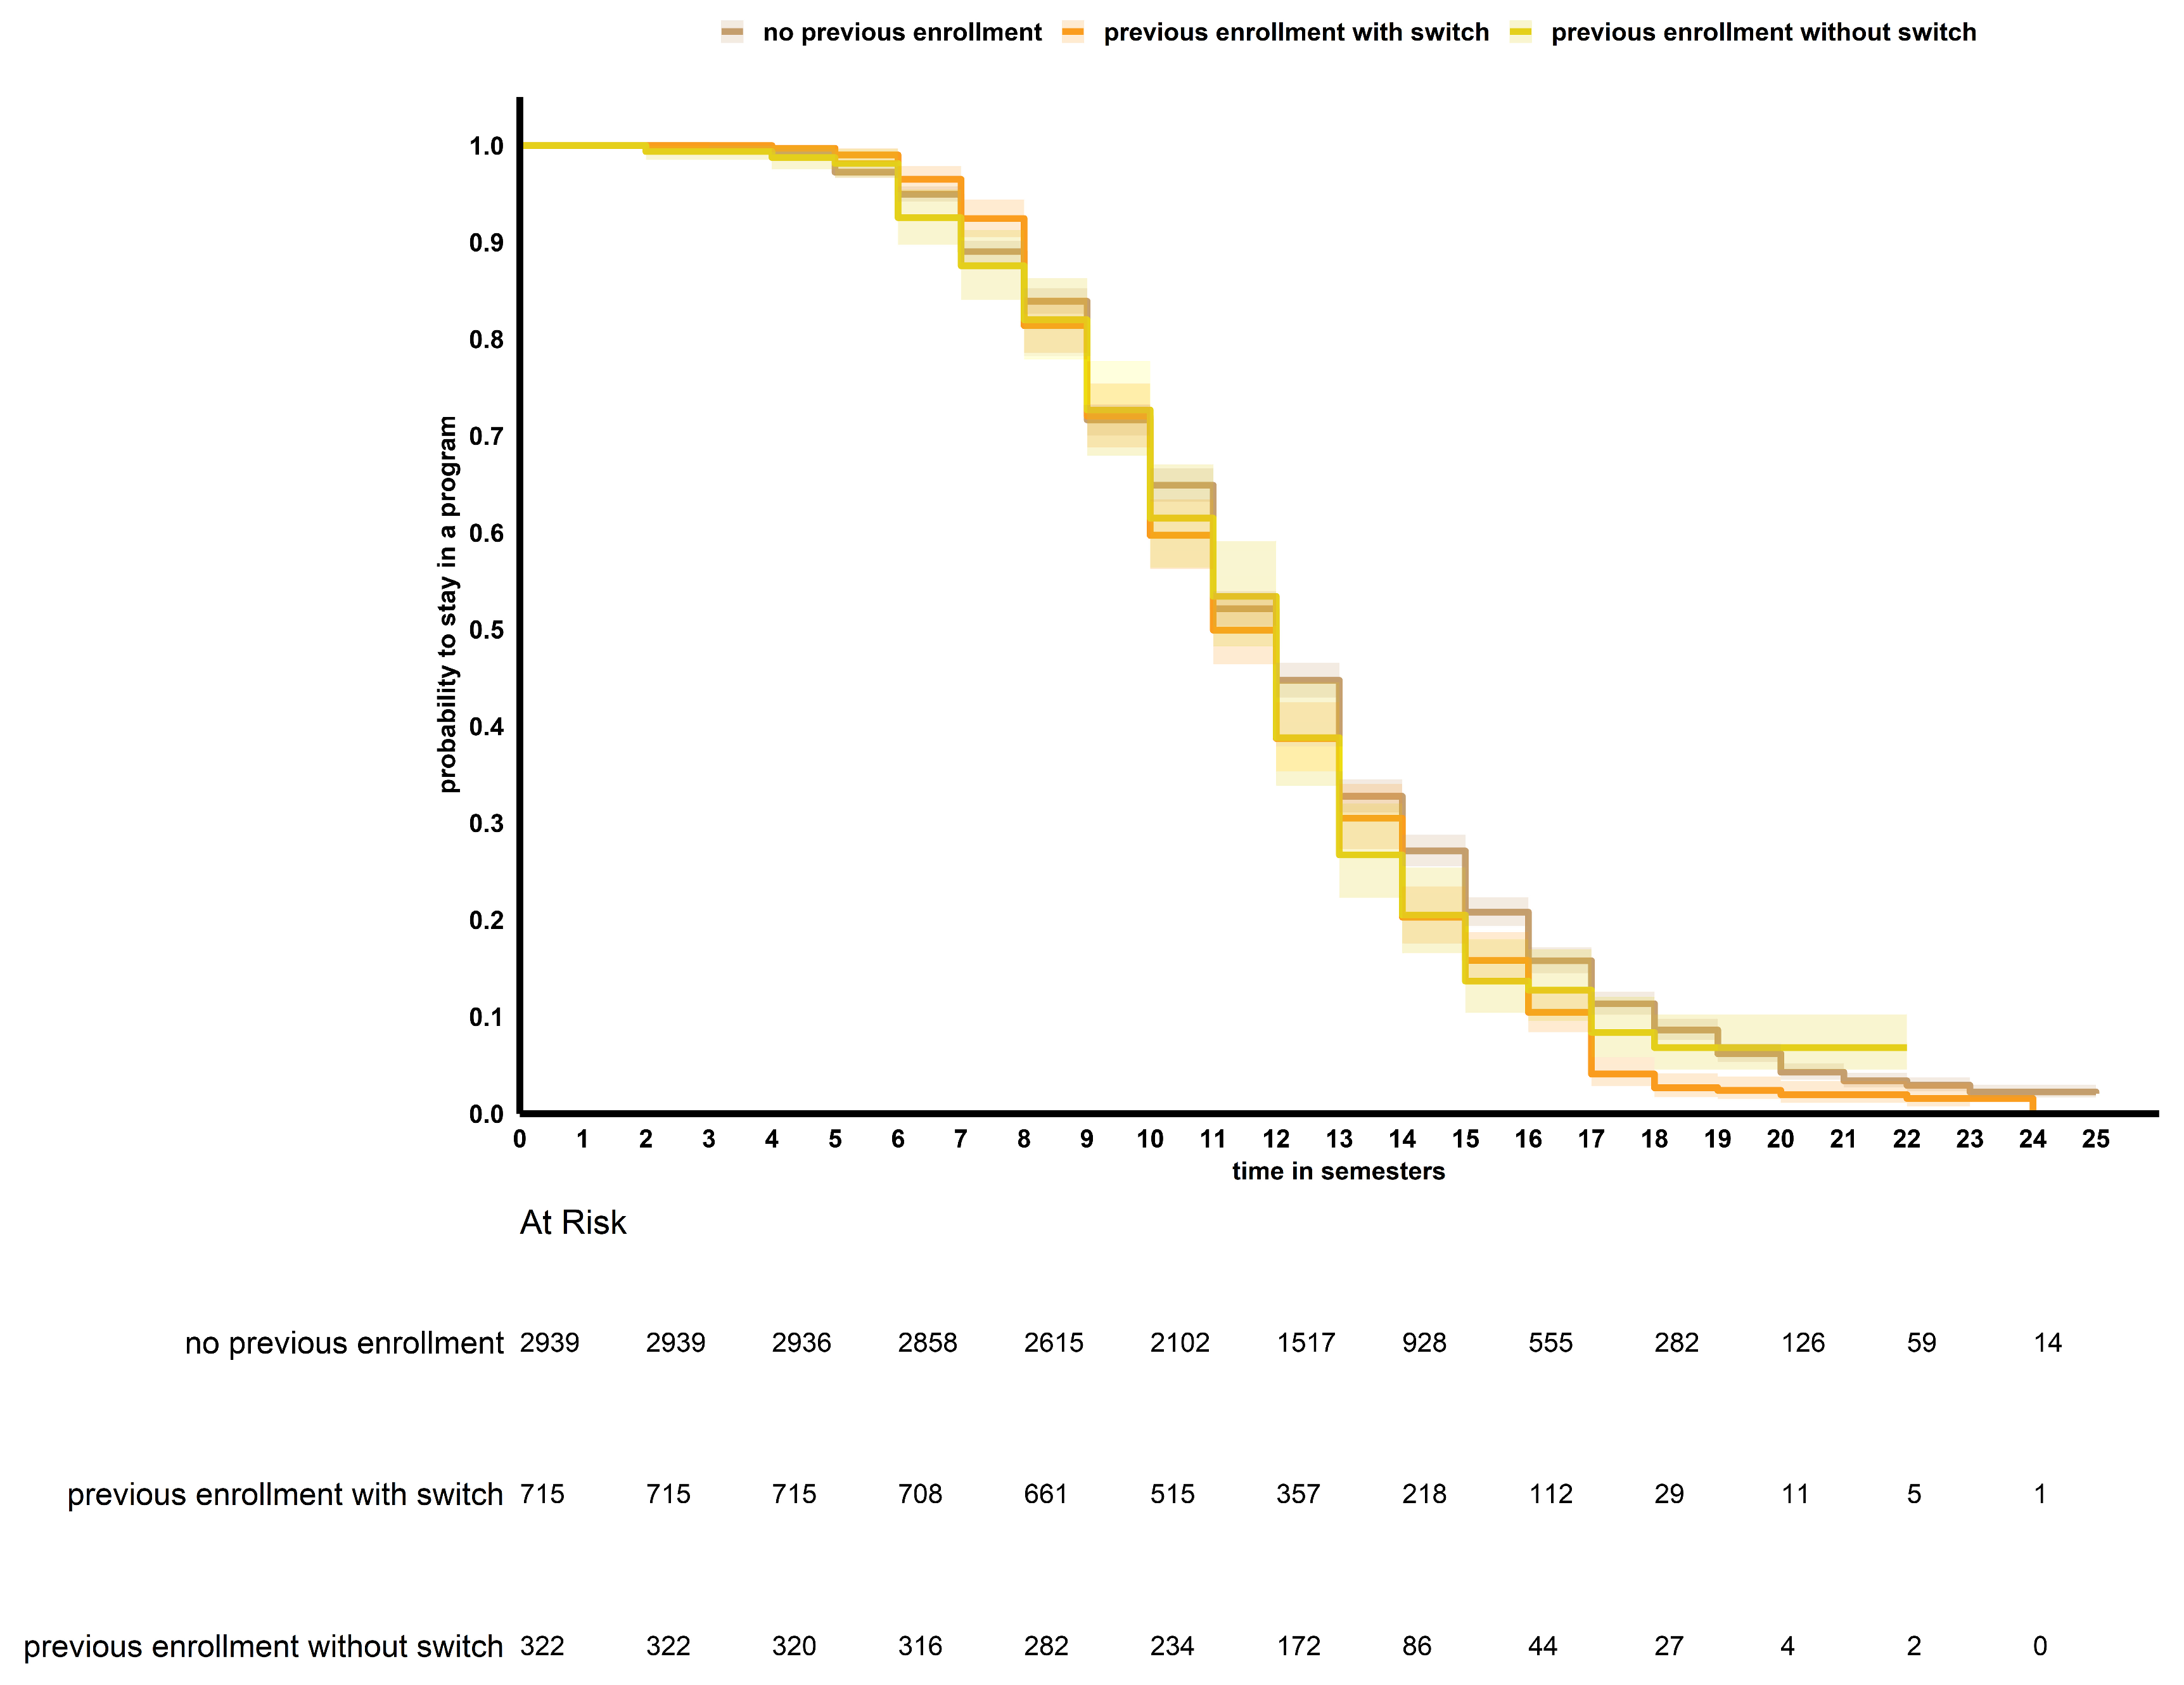
3.1.3. Diploma Programs

The following Figure 9, Figure 10, Figure 11 and Figure 12 show Kaplan-Meier curves for diploma programs. Figure 9 and Figure 10 focus on dropouts, while Figure 11 and Figure 12 depict graduates. Figure 9 and Figure 11 show students with one enrollment, while Figure 10 and Figure 12 show students with multiple enrollments.
Figure 9. Kaplan–Meier survival curves of diploma degree programs from students with one enrollment and the outcome dropout, comparing the number of semesters students spend at the university until leaving, grouped by their pre-studies on the same degree level.
Higheredu 03 00034 g009
Figure 10. Kaplan–Meier survival curves of diploma degree programs from students with multiple enrollments and the outcome dropout, comparing the number of semesters students spend at the university until leaving, grouped by their pre-studies on the same degree level.
Higheredu 03 00034 g010
Figure 11. Kaplan–Meier survival curves of diploma degree programs from students with one enrollment and the outcome graduation, comparing the number of semesters students spend at the university until leaving, grouped by their pre-studies on the same degree level.
Higheredu 03 00034 g011
Figure 12. Kaplan–Meier survival curves of diploma degree programs from students with multiple enrollments and the outcome graduation, comparing the number of semesters students spend at the university until leaving, grouped by their pre-studies on the same degree level.
Higheredu 03 00034 g012
Table 2. Chi-square and Cox-regression model results for the Kaplan–Meier survival curves.
OutcomeGroupComparisonHazard RatioSEzpUpper CILower CIχ2dfχ2p
Bachelor’s degree
dropoutone programprevious enrollment with switchno pre-studies0.060.023.240.0011.101.0220.612<0.001
pre-studies with switch
pre-studies without switch
previous enrollment without switchno pre-studies0.260.0213.55<0.0011.351.2520.612<0.001
pre-studies with switch
pre-studies without switch
two or more programsprevious enrollment with switchno pre-studies−0.190.03−6.40<0.0010.880.7853.912<0.001
pre-studies with switch
pre-studies without switch
previous enrollment without switchno pre-studies−0.110.02−4.32<0.0010.940.8553.912<0.001
pre-studies with switch
pre-studies without switch
graduationone programprevious enrollment with switchno pre-studies0.610.0226.89<0.0011.921.7674.572<0.001
pre-studies with switch
pre-studies without switch
previous enrollment without switchno pre-studies0.410.0218.09<0.0011.571.4474.572<0.001
pre-studies with switch
pre-studies without switch
two or more programsprevious enrollment with switchno pre-studies0.070.032.130.0331.151.015.7320.057
pre-studies with switch
pre-studies without switch
previous enrollment without switchno pre-studies0.040.040.850.3951.130.955.7320.057
pre-studies with switch
pre-studies without switch
OutcomeGroupComparisonHazard RatioSEzpUpper CILower CIχ2dfχ2p
Master’s degree
dropoutone programprevious enrollment with switchno pre-studies0.350.066.07<0.0011.591.27152.402<0.001
pre-studies with switch
pre-studies without switch
previous enrollment without switchno pre-studies0.670.0611.72<0.0012.191.75152.402<0.001
pre-studies with switch
pre-studies without switch
two or more programsprevious enrollment with switchno pre-studies0.050.120.430.6701.340.8321.912<0.001
pre-studies with switch
pre-studies without switch
previous enrollment without switchno pre-studies−0.470.10−4.53<0.0010.770.5121.912<0.001
pre-studies with switch
pre-studies without switch
graduationone programprevious enrollment with switchno pre-studies0.940.0422.06<0.0012.792.36140.422<0.001
pre-studies with switch
pre-studies without switch
previous enrollment without switchno pre-studies0.920.033.00<0.0012.662.36140.422<0.001
pre-studies with switch
pre-studies without switch
two or more programsprevious enrollment with switchno pre-studies0.120.140.830.4051.480.8518.952<0.001
pre-studies with switch
pre-studies without switch
previous enrollment without switchno pre-studies−0.390.09−4.15<0.0010.810.5618.952<0.001
pre-studies with switch
pre-studies without switch
OutcomeGroupComparisonHazard RatioSEzpUpper CILower CIχ2dfχ2 p
Diploma degree
dropoutone programprevious enrollment with switchno pre-studies−0.020.04−0.440.6591.060.924.4820.107
pre-studies with switch
pre-studies without switch
previous enrollment without switchno pre-studies−0.090.05−1.860.0621.000.844.4820.107
pre-studies with switch
pre-studies without switch
two or more programsprevious enrollment with switchno pre-studies−0.170.06−3.040.0020.940.7612.9920.002
pre-studies with switch
pre-studies without switch
previous enrollment without switchno pre-studies−0.130.06−2.220.0260.980.7812.9920.002
pre-studies with switch
pre-studies without switch
graduationone programprevious enrollment with switchno pre-studies−0.020.04−0.530.5941.060.904.2320.121
pre-studies with switch
pre-studies without switch
previous enrollment without switchno pre-studies−0.070.05−1.370.1701.030.844.2320.121
pre-studies with switch
pre-studies without switch
two or more programsprevious enrollment with switchno pre-studies0.170.044.10<0.0011.291.1017.632<0.001
pre-studies with switch
pre-studies without switch
previous enrollment without switchno pre-studies0.100.061.650.0981.250.9817.632<0.001
pre-studies with switch
pre-studies without switch
In bachelor’s programs and the outcome of dropping out, students with one enrollment and no pre-studies have the lowest chance of staying in the university system during the minimum required time of six semesters compared to those with previous enrollments. The curves switch places in later semesters. A low-to-moderate hazard ratio indicates that 0.26 times as many students with a previous enrollment without switch leave the university compared to students with no pre-studies or pre-studies with switch. Students with multiple programs show low negative hazard ratios of −0.19 for previous enrollment with switch and −0.11 for previous enrollment without switch as a weak protective effect against leaving the university compared to the other groups. In the outcome of graduation and students with one enrollment, having no previous enrollment has the highest chances of staying in the university system after seven semesters and above compared to students with pre-studies. Hazard ratios show that 0.61 times as many students with pre-studies with switch and 0.41 times as many students with pre-studies without switch leave the university in every single semester. Little and no significant differences were obtained for students in multiple enrollments with very small hazard ratios.
The results for master’s students with one enrollment that drop out of their studies show that 0.35 times as many students having previous enrollments with switch and 0.67 times as many students with previous enrollments without switch leave the university each semester compared to the other groups. The Kaplan–Meier curves show little to no differences during the first five to six semesters, with larger deviations the longer the timeframe. No significant differences were found for students in multiple enrollments, who have previous enrollments with a switch, and the other groups, but a protective hazard ratio of −0.47 was found for the group of students with previous enrollments with switch. The latter group is more likely to leave university in every semester than the other groups. The results for one enrollment with graduation in master’s programs shows that 0.94 times as many students with previous enrollment with switch and 0.92 times as many students leave the university compared to the respective other groups. Kaplan–Meier curves show that the group with no previous enrollment has higher chances of staying in each semester. No significant effect was found for students in multiple enrollments who have previous enrollments without switch. However, a protective hazard ratio of −0.39 was found for the group of students with previous enrollments without switch. They are more likely to stay longer in the university system in each semester.
In diploma degree programs, significant effects were obtained for students with multiple enrollments that dropped out. Protective hazard ratios of −0.17 for the group of students with previous enrollments with a switch and of −0.13 for students with previous enrollments without a switch were obtained. For those who graduate, 0.17 times as many students leave the university system having previous enrollments with a switch compared to the other groups. No other differences were found.

3.2. Odds of Graduation

Odds ratios using median-unbiased estimation were calculated for each degree level and outcome, depending on students’ pre-studies. The results are shown in Table 3.
In bachelor’s programs, students with one enrollment and no pre-studies have the highest odds of graduation. Pre-studies with switch and without switch showed lower odds. Having multiple programs, the odds of graduating in at least one program are lower for students in pre-studies that were switched. However, odds for graduation were highest for those with pre-studies without switch.
In master’s programs, both for students in one or multiple programs, the odds of graduation in at least one program were highest for students with pre-studies with switch, i.e., more than double the odds of students with no pre-studies. Pre-studies without switch showed around double the odds of graduation for students with multiple programs having pre-studies without switch. There were no differences for students in one program between the odds of graduation for no pre-studies and pre-studies without switch.
Diploma degree students with one enrollment have lower odds of graduating in at least one program when pre-studies are involved compared to no pre-studies. For students with multiple programs, there was no difference between the odds for no pre-studies and pre-studies without switch, but the odds were lower for programs having pre-studies with switch compared to no pre-studies.

4. Discussion

4.1. Time in the University System

The aim of this study was to gather exploratory insights into the effects of pre-studies and multiple enrollments on the outcome status of students when leaving the university. The first analysis block focused on the time students stay in the university system based on their degree program, the outcome, their pre-studies and the number of enrolled programs in regards to the research question how students in one and multiple enrollments with and without pre-studies differ in their graduation and dropout behavior when they leave the university system.
In all three degree types, having pre-studies showed a small protective effect against dropping out for students with multiple enrollments. Although indecisiveness can play a role in college student retention [51,52], the results stand in contrast to these findings. Master’s students can be at the brink of starting a career by entering the labor market, therefore possibly faced with career indecisiveness, which may affect the career decision-making process and the timing of the outcomes for students in multiple programs [53]. Conversely, the results of this study rather showed advantages in staying longer in the observed programs from having earlier enrollments. What also goes against an argument of indecisiveness having an influence is that, in bachelor’s and master’s programs, but not in diploma programs, students with one enrollment were more likely to drop out in every semester when previous enrollments were involved. Students who decide to take a lower number of parallel programs should have a lower level of indecisiveness and rather show those protective effects that were obtained for students in multiple enrollments. One possible component of the effects obtained could be a knowledge transfer of procedural knowledge and metacognition [35,36]. The more experience students have from pre-studies, the more protection from dropping out early. Factors promoting student retention can be social support [54]. Due to being enrolled in more programs, students are exposed to different and larger peer groups, which may act as multiplicators for social support, e.g., by performing extracurricular activities together. Such activities have been part of strategies proposed to increase students’ sense of belonging [55], which is known to increase student retention [56]. Therefore, the results may reflect the outcomes various dimensions have on student dropout and retention, which are increased by being enrolled in multiple programs.
For students with one enrollment in bachelor’s and master’s programs, but not in diploma programs, having pre-studies shows strong positive hazard ratios for graduation. This means students with pre-studies are more likely to graduate in each semester. Previous research suggests that students with the lower workload have higher chances of graduating [37]. Although only graduates were used in the statistical model, workload can be lower for those with pre-studies due to the transferability of exam results in the Austrian university system [6]. This means that equivalent exam results can be transferred from one curriculum to another, so that students do not have to take similar exams twice. For instance, enrolling in chemistry and passing the exam on general chemistry, the result can be transferred to other programs with the same or similar courses, e.g., molecular biology, pharmacy, geosciences. Curriculum research also shows that students are more likely to graduate from path-heterogeneous majors compared to path-homogeneous ones. The heterogeneity means that curriculum design is flexible, whereas homogeneous curricula show correlations with the percentage of locked requirements [57]. By introducing the transferability aspect, pre-studies are a prerequisite of being able to harness the flexibility of the university system and to decrease one’s workload in a given program via past exams.
Similar effects were found for some groups of students with multiple enrollments, however, with small hazard ratios. Students with multiple enrollments have higher chances of graduating in each semester in bachelor’s and diploma programs when having switched from previous enrollments to their current programs. Contrary to these findings, students in master’s programs are less likely to graduate in each semester when they had previous enrollments without switching. Since the analysis solely focused on students who graduated in the end, having multiple enrollments and having pre-studies that were not switched may lead to difficulties in self-management. This means that course and semester planning can be more challenging the more programs are involved. A study on master’s and doctoral students showed that self-management is a predictor of the motivation to graduate on time [58]. Another dimension possibly having more influence on master’s degrees students compared to bachelor’s and diploma students is employment. Under labor market circumstances not influenced by the COVID-19-pandemic, bachelor’s graduates may start working before enrolling in a master’s program [59] and carry their job over to later enrollments. Master’s students may also seek part-time jobs in their domain before graduation. A study on stop-outs, i.e., those that withdraw and re-enroll later, reports that conflicts between job and college can be a hindrance to entering the university system after leaving [60]. Employment and working during the time in the university system correlates with a prolonged time to degree [61] and can also increase the risk of dropping out [49]. Master’s students may therefore have unique risk factors, less prevalent in bachelor’s and diploma degree students.

4.2. Odds of Graduation

The second analysis block of this study focused on students’ odds of graduation with respect to the possible constellations of multiple-program studying, addressing the question of what the odds of graduation in one program of students in one or multiple programs are with and without pre-studies. In diploma programs, having pre-studies revealed lower odds of graduating in at least one program, independent of the number of current enrollments. In bachelor’s programs, the same trend was observed, with the exception of students in multiple programs that had pre-studies without a switch. Odds of graduation were higher for this group. Master’s students showed higher odds of graduation when having pre-studies, except for those with one enrollment that had pre-studies without switch. Following the results of a previous study that higher workload is related to higher dropout rates [36], the results for diploma and bachelor’s programs can be explained. However, bachelor’s students in multiple enrollments and with pre-studies that have not been switched and master’s programs show a reversed pattern with advantages to graduate. The results for bachelor’s students may be explained by both a knowledge transfer from pre-studies and a higher experience with studying in general, i.e., an increased academic readiness [35,36]. In both bachelor’s and master’s programs, the possibility to transfer passed exams [6] may also have an influence on the odds of graduating. Due to keeping a previous enrollment valid, i.e., not switching immediately, students that enroll in a new program can strategically complete courses from the previous curriculum and possibly skip more difficult equivalents in the second curriculum.

4.3. Limitations

The challenge in this study was to find a data structure correctly representing the complex mechanics of being able to enroll in an unlimited number of programs, no matter the timing. Overlap and consecutiveness of programs was a crucial aspect of defining parallel programs. However, by accounting for the variety of possible constellations of pre- and parallel studies focusing on an observed program as the main identifier, row multiplication and multiple entries for each program as pre-study, observed program and possibly parallel program could not be avoided. Potential bias cannot be ruled out, even though it can be expected to be non-systematic. Repeating the procedure on smaller datasets and replicating the results of this large-scale study, manually controlling for possible error, may aid in increased reliability. Other studies seeking to employ a similar design may want to improve the data by finding and testing different variants of data structures that are able to depict the relationship of pre-studies, observed and parallel programs in other ways. For instance, the data could be organized in multiple layers, creating a hierarchical tree with sub-datasets, using pre-study or parallel status as a layering dimension. This strategy could reduce the multiplication effect.
This study was meant to concentrate on a large-scale sample, investigating student status outcomes of the groups of students formed by their enrollment behavior. In particular, a sample of that dimension can hardly account for psychological dimensions on the same scale. However, these are important when it comes to student success. Self-efficacy, for instance, is linked to academic success and can predict college major and career choices [62,63]. Therefore, the different influences of such dimensions and other external factors on how the enrollment and outcome patterns in the results of this study form need to be taken into consideration when interpreting the results.
Due to the size of the dataset, differences between fields of study could not be controlled for. However, recent works on multiple enrollments in the Austrian university system show that there are differences in the outcome constellations (graduation, dropout) in student workload and overall study duration related to the selectiveness of a program. Psychology has an admission exam, is highly requested and is therefore very selective, whereas Sociology is not [64]. Sociology students’ most common outcomes were dropout–dropout, whereas psychology students’ outcomes were graduation–dropout [64]. What is more, those in multiple programs accomplish higher workloads upon graduation or dropping out, compared to those in one program [23]. The results of this study have a high generalizability on the institutional level, but such differences on the level of fields of study cannot be accounted for. This is another reason why future studies will have to use smaller and more restricted samples, e.g., from the point of view of individual disciplines.

4.4. Future Outlook and Implications

In this study new evidence about university students’ outcome patterns in a multiple enrollment policy could be obtained. However, with the methodology and the dataset used, no information on the reasons why certain outcome patterns form can be obtained. More research on multiple enrollments in Austria’s and in similar university systems is warranted [40]. Future research should especially focus on explaining the patterns found in this study, especially those of students with multiple enrollments that cannot be sufficiently explained by the existing literature on traditional university systems. Also, more research is needed to find out whether a possible knowledge transfer from pre-studies and across multiple enrollments exists and whether it gives students an advantage towards faster graduation and graduation in general.
Pre-studies in bachelor’s and master’s programs had a protective effect against dropping out of university for those with multiple enrollments with a higher likelihood for leaving for those with one enrollment. The probabilities of graduating in each semester were higher when students had pre-studies. Having pre-studies may therefore prolong one’s stay in the university system and facilitate graduation. However, those that do not graduate will need targeted support structures to not drop out in the end. Since those with one program may potentially drop out earlier than those with multiple enrollments, a targeted implementation of support structures is needed [65]. Older works indicate that a high relatedness of multiple programs can be related to increased success [66]. This means that university managers should make students, who wish to enroll in more than one program, aware of choosing similar fields of study, which also increases the transferability of exams. Policy decisions on possible combinations of disciplines, e.g., only allowing for faculty-wise enrollment, could help students to bring one of multiple enrollments to graduation. In line with this, odds of graduation in an undergraduate program were lower in groups with pre-studies for bachelor’s and diploma students. However, bachelor’s students in multiple programs with pre-studies without switch and all master’s student groups with pre-studies had higher odds of graduation compared to those with no pre-studies. Although it is yet to be studied, the results may be related to knowledge transfer from pre-studies and parallel programs. At the current state of the multiple enrollment policy in Austria, metacognition, which could be linked to academic success [34], on how to study and how university structures work, may be the main source of knowledge transfer benefit students can obtain from pre-studies and parallel enrollments. By aiding students in their decisions on which consecutive and parallel combinations they should enroll in, declarative knowledge transfer of facts may be more likely [32]. For instance, this means a combination of the fields Chemistry and Pharmacy has a lot more overlap in its declarative knowledge than Law and Mathematics. Procedural knowledge as well metacognition can be acquired in the university setting [35,36], but maximizing all three components by governance decisions may increase students’ odds of graduation. This recommendation could be applied to all university systems seeking to allow parallel enrollments and is not exclusive to the situation of Austria.

5. Conclusions

This study focused on students in a university system that allows for an unlimited number of enrollments without time limitations. Enrolled students can thus have pre-studies as well as parallel and consecutive programs. This study explored the relationships of pre-studies and multiple enrollments with the outcome status of students when leaving the university. Survival analyses showed differences in the probability of staying and leaving the university system as dropout or graduate. In bachelor’s and master’s programs, having pre-studies had a protective effect against leaving the university for those with multiple enrollments. For those with one enrollment, the likelihood of leaving was higher. The probabilities of graduating in each semester were higher when students had pre-studies. Hazard ratios were higher for those in one program, compared to those in multiple programs. Odds ratio tests showed that undergraduate programs have lower odds of graduation in groups with pre-studies for bachelor’s and diploma students. However, bachelor’s students in multiple programs with pre-studies without switch and all master’s student groups with pre-studies had higher odds of graduation compared to those with no pre-studies. Explanations can be found in the transferability of exam results from one program to another, a possible knowledge transfer and academic readiness as well as a higher workload the more enrollments are active. More research is needed to explain the reasons for the patterns found in this study.

Funding

Open Access Funding by the University of Graz.

Institutional Review Board Statement

Not applicable.

Informed Consent Statement

Not applicable.

Data Availability Statement

Data cannot be made available due to being a large size dataset of internal university administrative data.

Acknowledgments

The author acknowledges the financial support by the University of Graz.

Conflicts of Interest

The author declared no potential conflicts of interest with respect to the research, authorship and/or publication of this article.

References

  1. Federal Ministry of Education, Science and Research. Datawarehouse of the Federal Ministry of Education, Science and Research 2023. Available online: https://unidata.gv.at (accessed on 5 June 2024).
  2. OECD. OECD Data: Population with Tertiary Education 2024. Available online: https://data.oecd.org/eduatt/population-with-tertiary-education.htm (accessed on 30 June 2024).
  3. Federal Ministry of Education, Science and Research. The Austrian Plan for Higher Education 2030; Federal Ministry of Education, Science and Research: Vienna, Austria, 2022.
  4. Green, F.; Henseke, G. Europe’s evolving graduate labour markets: Supply, demand, underemployment and pay. J. Labour Mark. Res. 2021, 55, 2. [Google Scholar] [CrossRef]
  5. Federal Ministry of Education, Science and Research. Federal Act on the Organisation of Universities and their Studies (Universities Act 2002—UG, updated version 2022) 2022. Vienna: Federal Ministry of Education, Science and Research (Vic). Available online: https://www.ris.bka.gv.at/GeltendeFassung.wxe?Abfrage=Bundesnormen&Gesetzesnummer=20002128&FassungVom=2022-12-31 (accessed on 4 June 2024).
  6. Federal Ministry of Education, Science and Research. Federal Act on the Organisation of Universities and their Studies (Universities Act 2002—UG) 2002 (Vic). Available online: https://www.ris.bka.gv.at/Dokumente/BgblPdf/2002_120_1/2002_120_1.pdf (accessed on 4 June 2024).
  7. Hoover, E. Demographic changes as destiny in college admissions? It’s complicated. Chron. High. Educ. 2017, 14. Available online: https://www.chronicle.com/article/demographic-changes-as-destiny-in-college-admissions-its-complicated/ (accessed on 4 June 2024).
  8. Palvia, S.; Aeron, P.; Gupta, P.; Mahapatra, D.; Parida, R.; Rosner, R.; Sindhi, S. Online education: Worldwide status, challenges, trends, and implications. J. Glob. Inf. Technol. Manag. 2018, 21, 233–241. [Google Scholar] [CrossRef]
  9. Yonezawa, A. Challenges of the Japanese higher education amidst population decline and globalization. Glob. Soc. Educ. 2020, 18, 43–52. [Google Scholar] [CrossRef]
  10. Bransberger, P.; Falkenstern, C.; Lane, P. Knocking at the College Door. In Projections of High School Graduates; Western Interstate Commission for Higher Education: Boulder, CO, USA, 2020. [Google Scholar]
  11. Karran, T. Achieving Bologna Convergence: Is ECTS failing to make the grade? High. Educ. Eur. 2004, 29, 411–421. [Google Scholar] [CrossRef]
  12. European Union. European Credit Transfer System: ECTS Users’ Guide 2015; Publications Office of the European Union: Luxembourg, 2015. [Google Scholar] [CrossRef]
  13. Federal Ministry of Education, Science and Research, Federal Act on the Capacity Orientated, Student-Centered Financing of Universities (Universities’ Financing Act—UniFinV) 2018 (Vic). Available online: https://www.ris.bka.gv.at/geltendefassung.wxe?abfrage=bundesnormen&gesetzesnummer=20010276 (accessed on 4 June 2024).
  14. Fajčíková, A.; Urbancová, H. Factors influencing students’ motivation to seek higher education—A case study at a State University in the Czech Republic. Sustainability 2019, 11, 4699. [Google Scholar] [CrossRef]
  15. Heublein, U. Student drop-out from G erman higher education institutions. Eur. J. Educ. 2014, 49, 497–513. [Google Scholar] [CrossRef]
  16. Ozga, J.; Sukhnandan, L. Undergraduate non-completion: Developing an explanatory model. High. Educ. Q. 1998, 52, 316–333. [Google Scholar] [CrossRef]
  17. Wilcox, P.; Winn, S.; Fyvie-Gauld, M. ‘It was nothing to do with the university, it was just the people’: The role of social support in the first-year experience of higher education. Stud. High. Educ. 2005, 30, 707–722. [Google Scholar] [CrossRef]
  18. Bardach, L.; Lüftenegger, M.; Oczlon, S.; Spiel, C.; Schober, B. Context-related problems and university students’ dropout intentions—The buffering effect of personal best goals. Eur. J. Psychol. Educ. 2020, 35, 477–493. [Google Scholar] [CrossRef]
  19. Barbera, S.A.; Berkshire, S.D.; Boronat, C.B.; Kennedy, M.H. Review of undergraduate student retention and graduation since 2010: Patterns, predictions, and recommendations for 2020. J. Coll. Stud. Retent. Res. Theory Pract. 2020, 22, 227–250. [Google Scholar] [CrossRef]
  20. Yusof, R.; Harith, N.M.M.; Lokman, A.; Abd Batau, M.F.; Zain, Z.M.; Rahmat, N.H. A Study of Perception on Students’ Motivation, Burnout and Reasons for Dropout. Int. J. Acad. Res. Bus. Soc. Sci. 2023, 13, 403–432. [Google Scholar] [CrossRef] [PubMed]
  21. Maslach, C.; Leiter, M.P. Understanding burnout: Definitions, causes, and consequences. In Professional Burnout: Recent Developments in Theory and Research; Routledge: London, UK, 2016; pp. 9–16. [Google Scholar]
  22. Norez, D. Academic Burnout In College Students: The Impact of Personality Characteristics and Academic Term on Burnout. Master’s Thesis, Fort Hays State University, Hays, KS, USA, 2017; p. 502. [Google Scholar] [CrossRef]
  23. Loder, A.K.F. Comparing Student Performance in Multiple Enrollments and Single Enrollments: Possible Target Groups for University Management. J. Coll. Stud. Retent. Res. Theory Pract. 2024. [Google Scholar] [CrossRef]
  24. Cummings, M.; Knott, T. How Many Credit Hours Should First Semester Engineering Freshmen Take? In Proceedings of the 2001 Annual Conference, 2001, Albuquerque, New Mexico, 24.6.2001. Available online: https://peer.asee.org/how-many-credit-hours-should-first-semester-engineering-freshmen-take (accessed on 4 June 2024).
  25. Bound, J.; Lovenheim, M.; Turner, S. Understanding the decrease in college completion rates and the increased time to the baccalaureate degree. In University of Michigan Population Studies Center Research Report No. 07-626; University of Michigan: Ann Arbor, MI, USA, 2007. [Google Scholar]
  26. Lin, Y.H.; Chen, S.Y.; Lin, P.H.; Tai, A.S.; Pan, Y.C.; Hsieh, C.E.; Lin, S.H. Assessing user retention of a mobile app: Survival analysis. JMIR Mhealth Uhealth 2020, 8, e16309. [Google Scholar] [CrossRef] [PubMed]
  27. Villano, R.; Harrison, S.; Lynch, G.; Chen, G. Linking early alert systems and student retention: A survival analysis approach. High. Educ. 2018, 76, 903–920. [Google Scholar] [CrossRef]
  28. Ameri, S.; Fard, M.J.; Chinnam, R.B.; Reddy, C.K. Survival analysis based framework for early prediction of student dropouts. In Proceedings of the 25th ACM International on Conference on Information and Knowledge Management, Indianapolis, IN, USA, 24–28 October 2016. [Google Scholar]
  29. Seery, M.K. The role of prior knowledge and student aptitude in undergraduate performance in chemistry: A correlation-prediction study. Chem. Educ. Res. Pract. 2009, 10, 227–232. [Google Scholar] [CrossRef]
  30. Hailikari, T.; Katajavuori, N.; Lindblom-Ylanne, S. The relevance of prior knowledge in learning and instructional design. Am. J. Pharm. Educ. 2008, 72, 113. [Google Scholar] [CrossRef] [PubMed]
  31. Hailikari, T.; Nevgi, A.; Lindblom-Ylänne, S. Exploring alternative ways of assessing prior knowledge, its components and their relation to student achievement: A mathematics based case study. Stud. Educ. Eval. 2007, 33, 320–337. [Google Scholar] [CrossRef]
  32. Biggs, J. Teaching for Quality Learning at University; Society for Research into Higher Education: Buckingham, UK, 2003. [Google Scholar]
  33. Dochy, F.; De Rijdt, C.; Dyck, W. Cognitive prerequisites and learning: How far have we progressed since Bloom? Implications for educational practice and teaching. Act. Learn. High. Educ. 2002, 3, 265–284. [Google Scholar] [CrossRef]
  34. Abdelrahman, R.M. Metacognitive awareness and academic motivation and their impact on academic achievement of Ajman University students. Heliyon 2020, 6, e04192. [Google Scholar] [CrossRef]
  35. Rittle-Johnson, B.; Star, J.R. Does comparing solution methods facilitate conceptual and procedural knowledge? An experimental study on learning to solve equations. J. Educ. Psychol. 2007, 99, 561. [Google Scholar] [CrossRef]
  36. Howlett, M.A.; McWilliams, M.A.; Rademacher, K.; O’Neill, J.C.; Maitland, T.L.; Abels, K.; Demetriou, C.; Panter, A.T. Investigating the effects of academic coaching on college students’ metacognition. Innov. High. Educ. 2021, 46, 189–204. [Google Scholar] [CrossRef]
  37. Karimi-Haghighi, M.; Castillo, C.; Hernández-Leo, D. A causal inference study on the effects of first year workload on the dropout rate of undergraduates. In Proceedings of the International Conference on Artificial Intelligence in Education, Cham, Switzerland, 27–31 July 2022. [Google Scholar]
  38. Tinto, V. Dropout from higher education: A theoretical synthesis of recent research. Rev. Educ. Res. 1975, 45, 89–125. [Google Scholar] [CrossRef]
  39. Tinto, V. Leaving College: Rethinking the Causes and Cures of Student Attrition; University of Chicago Press: Chicago, IL, USA, 1993. [Google Scholar]
  40. Loder, A.K.F.; Brandweiner, A.C.; Maia de Oliveira Wood, G. Parallel Enrollments: Associations Between College Student Satisfaction and Performance. J. Coll. Stud. Retent. Res. Theory Pract. 2024, 15210251241232683. [Google Scholar] [CrossRef]
  41. Assefa, M.; Sedgwick, R. The Bologna bachelor’s degree: An overview. World Educ. News Rev. 2004, 17, 17–24. [Google Scholar]
  42. R Core Team. R: A Language an Environment for Statistical Computing; Publisher: Vienna, Austria, 2022. [Google Scholar]
  43. Ripley, B.; Lapsley, M. RODBC, 2022. Version 1.3-23. Available online: https://cran.r-project.org/web/packages/RODBC/index.html (accessed on 4 June 2024).
  44. Therneau, T.M.; Lumley, T.; Atkinson, E.; Crowson, C. Survival: Survival Analysis; R Package Version 3.5-7; 2023. Available online: https://cran.r-project.org/web/packages/survival/index.html (accessed on 4 June 2024).
  45. Sjoberg, D.D.; Baillie, M.; Fruechtenicht, C.; Haesendonckx, S.; Treis, T. Ggsurvfit: Flexible Time-to-Event Figures; R-Package Version 0.3.1; 2020. Available online: https://cran.r-project.org/web/packages/ggsurvfit/index.html (accessed on 4 June 2024).
  46. Aragon, T.J.; Fay, M.P.; Wollschlaeger, D.; Omidpanah, A. Epitools: Epidemiology Tools; R-Package Version 0.5-10.1; 2020. Available online: https://cran.r-project.org/web/packages/epitools/index.html (accessed on 4 June 2024).
  47. No, F.; Taniguchi, K.; Hirakawa, Y. School dropout at the basic education level in rural Cambodia: Identifying its causes through longitudinal survival analysis. Int. J. Educ. Dev. 2016, 49, 215–224. [Google Scholar] [CrossRef]
  48. Thaithanan, J.; Thinnukool, O.; Chaichana, M.; Wanishsakpong, W. Using Survival Analysis to Investigate Undergraduate Student Dropout Rates in theCollege of Arts, Media and Technology, Chiang Mai University. Multicult. Educ. 2021, 7, 403–410. [Google Scholar]
  49. Hovdhaugen, E. Working while studying: The impact of term-time employment on dropout rates. J. Educ. Work. 2015, 28, 631–651. [Google Scholar] [CrossRef]
  50. Andersen, P.; Gill, R. Cox’s regression model for counting processes, a large sample study. Ann. Stat. 1982, 10, 1100–1120. [Google Scholar] [CrossRef]
  51. Ishitani, T.T.; Snider, K.G. Longitudinal Effects of College Preparation Programs on College Retention. IR Appl. 2006, 9, ED504377. [Google Scholar]
  52. Germeijs, V.; Verschueren, K. Indecisiveness: Specificity and predictive validity. Eur. J. Personal. 2011, 25, 295–305. [Google Scholar] [CrossRef]
  53. Saunders, D.E.; Peterson, G.W.; Sampson, J.P., Jr.; Reardon, R.C. Relation of depression and dysfunctional career thinking to career indecision. J. Vocat. Behav. 2000, 56, 288–298. [Google Scholar] [CrossRef]
  54. Nieuwoudt, J.E.; Pedler, M.L. Student retention in higher education: Why students choose to remain at university. J. Coll. Stud. Retent. Res. Theory Pract. 2023, 25, 326–349. [Google Scholar] [CrossRef]
  55. Ribera, A.K.; Miller, A.L.; Dumford, A.D. Sense of peer belonging and institutional acceptance in the first year: The role of high-impact practices. J. Coll. Stud. Dev. 2017, 58, 545–563. [Google Scholar] [CrossRef]
  56. Pedler, M.L.; Willis, R.; Nieuwoudt, J.E. A sense of belonging at university: Student retention, motivation and enjoyment. J. Furth. High. Educ. 2022, 46, 397–408. [Google Scholar] [CrossRef]
  57. Jarratt, L.; Lynn, F.B.; Shi, Y.; Broton, K.M. Up-or-Out Systems? Quantifying Path Flexibility in the Lived Curriculum of College Majors. Res. High. Educ. 2024, 1–23. [Google Scholar] [CrossRef]
  58. Letkiewicz, J.; Lim, H.; Heckman, S.; Bartholomae, S.; Fox, J.J.; Montalto, C.P. The path to graduation: Factors predicting on-time graduation rates. J. Coll. Stud. Retent. Res. Theory Pract. 2014, 16, 351–371. [Google Scholar] [CrossRef]
  59. Ulvestad, M.E.; Skjelbred, S.E. Escaping into a master’s degree in times of crisis? Master’s degree applications and enrolment over the business cycle. Econ. Educ. Rev. 2023, 94, 102404. [Google Scholar] [CrossRef]
  60. Breier, M. Dropout or stop out at the University of the Western Cape. Student retention and graduate destination: Higher education and labour market access and success. J. Coll. Stud. Retent. 2004, 5, 293–303. [Google Scholar]
  61. Theune, K. The working status of students and time to degree at German universities. High. Educ. 2015, 70, 725–752. [Google Scholar] [CrossRef]
  62. Urdan, T.; Pajares, F. Self-Efficacy Beliefs of Adolescents; IAP: Greenwich, UK, 2006. [Google Scholar]
  63. Brown, S.D.; Lent, R.W. Preparing adolescents to make career decisions: A social cognitive perspective. Adolesc. Educ. 2006, 5, 201–223. [Google Scholar]
  64. Loder, A.K.F. Multiple Enrollment Policy: Clustering Dropout and Graduation Constellations in Psychology and Sociology Bachelor’s Programs. Trends High. Eudcation 2024, 3, 373–407. [Google Scholar] [CrossRef]
  65. Linden, K. Improving student retention by providing targeted support to university students who do not submit an early assessment item. A practice report. Stud. Success 2022, 13, 67–73. [Google Scholar]
  66. Peters, D.L.; Daly, S.R. Returning to graduate school: Expectations of success, values of the degree, and managing the costs. J. Eng. Educ. 2013, 102, 244–268. [Google Scholar] [CrossRef]
Table 1. Relative and observed frequencies of study programs in the sample.
Groupn Programsn%
one program
total number of programs of students during their lifecycle in the university system
144,83958.95
2916312.05
325473.35
46950.91
51860.24
6510.07
7230.03
≥8200.03
multiple programs
number of parallel or strictly consecutive studies of students
216,29121.42
316012.10
44630.61
51170.15
6400.05
7100.01
≥8130.02
Total 76,059100.00
Groupn Programsn%
pre-studies
earlier programs on the same degree level
045,33374.20
111,32118.53
232595.33
38741.43
42030.33
5600.10
6240.04
7110.02
≥8130.02
Total 61,098100.00
Table 3. Odds ratio tests for students in one and students in two or more programs to graduate at least in one program dependent on their pre-studies.
GroupPre-Studiesn Graduationn DropoutOdds RatioUpper CILower CIp
Bachelor’s degree
one programno pre-studies10,03932,3001
pre-studies with switch259868250.820.780.86<0.001
pre-studies without switch357836070.310.300.33<0.001
multiple programsno pre-studies711511,9341
pre-studies with switch7319670.790.710.87<0.001
pre-studies without switch45210871.431.281.61<0.001
Master’s degree
one programno pre-studies15,70561461
pre-studies with switch5244882.382.102.70<0.001
pre-studies without switch8913801.090.961.230.174
multiple programsno pre-studies350716781
pre-studies with switch46592.681.823.98<0.001
pre-studies without switch1021002.051.542.72<0.001
Diploma degree
one programno pre-studies259077571
pre-studies with switch4078840.730.640.82<0.001
pre-studies without switch2322390.340.290.41<0.001
multiple programsno pre-studies233328981
pre-studies with switch2751650.480.390.59<0.001
pre-studies without switch1121140.820.631.070.144
Disclaimer/Publisher’s Note: The statements, opinions and data contained in all publications are solely those of the individual author(s) and contributor(s) and not of MDPI and/or the editor(s). MDPI and/or the editor(s) disclaim responsibility for any injury to people or property resulting from any ideas, methods, instructions or products referred to in the content.

