Article

Pharmacological Reactivation of PP2A by SET/CIP2A Inhibition Attenuates Triple Negative Breast Cancer Progression


by
Gustavo Adolfo Barraza
1,†,
Joselina Magali Mondaca
1,†,
Juan Manuel Fernandez Muñoz
2,3,
Bruno Mariano Vinante
1,4,
Marina Inés Flamini
4,* and
Angel Matias Sanchez
1,*
1
Laboratorio de Transducción de Señales y Movimiento Celular, Instituto de Medicina y Biología Experimental de Cuyo (IMBECU), Consejo Nacional de Investigaciones Científicas y Técnicas (CONICET), Universidad Nacional de Cuyo, Mendoza CP 5500, Argentina
2
Laboratorio Núcleo, Ministerio de Salud y Deportes, Gobierno de Mendoza, Mendoza CP 5500, Argentina
3
Decanato de Ciencias Aplicadas, Universidad Siglo 21, Córdoba CP 5000, Argentina
4
Laboratorio de Biología Tumoral, Instituto de Medicina y Biología Experimental de Cuyo (IMBECU), Consejo Nacional de Investigaciones Científicas y Técnicas (CONICET), Universidad Nacional de Cuyo, Mendoza CP 5500, Argentina
*
Authors to whom correspondence should be addressed.
These authors contributed equally to this work.
Kinases Phosphatases 2026, 4(2), 12; https://doi.org/10.3390/kinasesphosphatases4020012
Submission received: 16 April 2026 / Revised: 13 May 2026 / Accepted: 20 May 2026 / Published: 22 May 2026

Abstract

The tumor suppressor protein phosphatase 2A (PP2A) plays a crucial role in regulating oncogenic signaling. Its inactivation, specifically through inhibitory phosphorylation at Tyr307 mediated by SET and CIP2A, contributes to breast cancer (BC) progression. Modulation of these interactions represents a promising pharmacological strategy to restore PP2A function. We integrated computational approaches with experimental validation to analyse SET/CIP2A mechanisms and explore how PP2A reactivation suppresses tumor progression. Molecular docking and dynamics simulations showed that the SET inhibitor/FTY-720 forms stable hydrogen bond networks with SET, disrupting its interaction with PP2A. In contrast, CIP2A suppressor/erlotinib interacts with CIP2A through weaker hydrophobic and π-interactions. Protein–protein interaction analyses indicate reduced SET/CIP2A binding to PP2A upon treatment, supporting a structural basis for PP2A reactivation. Gene expression analyses revealed upregulation of PP2A, SET, CIP2A, and cytoskeletal markers in tumor and metastatic tissues. Studies on Triple Negative Breast Cancer (TNBC) cells showed that FTY-720 and erlotinib significantly reduce PP2A-Tyr307 phosphorylation, restoring its activity. Additionally, both compounds decreased c-Myc levels and inhibited Src/FAK/paxillin/PAK1 and ERK signaling, attenuating migratory and proliferative pathways. Our findings identify the SET/CIP2A–PP2A axis as a pharmacological target for the design of next-generation PP2A activators, highlighting the potential of inhibition as a therapeutic strategy to counteract TNBC progression.

1. Introduction

Breast cancer (BC) represents the most frequently diagnosed cancer among women, and metastasis remains the leading cause of cancer-related mortality worldwide [1]. Despite significant advances in early detection and targeted therapies, BC remains a major global health concern due to its heterogeneity and the emergence of therapy resistance and metastasis.
The Triple-Negative Breast Cancer (TNBC) represents an especially aggressive BC subtype characterized by poor prognosis, high rates of recurrence, and an increased propensity for distant metastasis. The absence of receptor expression renders TNBC unresponsive to endocrine and targeted therapies, which are effective in other BC subtypes, leaving chemotherapy as the primary treatment option [2]. These limitations highlight the need to identify novel molecular targets and develop innovative pharmacological strategies.
In this context, protein phosphatase 2A (PP2A) has emerged as a promising tumor suppressor due to its ability to regulate signaling pathways that play significant roles in various cancers, including BC [3,4]. PP2A is a serine/threonine phosphatase that removes phosphate groups from proteins, counteracting the action of protein kinases, generally overexpressed in cancer cells, promoting tumor formation [5,6]. PP2A exerts its tumor-suppressive function by directly dephosphorylating and inactivating key oncogenic kinases, including c-Myc, Akt, Erk, and mTOR [7,8,9]. Through this regulatory mechanism, PP2A helps restrain proliferative and survival signals. When PP2A activity is impaired, persistent phosphorylation of these kinases can promote uncontrolled cell growth, resistance to apoptosis, and increased migration and invasion, hallmarks of metastatic progression [10].
Structurally, PP2A exists as a heterotrimer composed of three distinct subunits: a structural (A), a regulatory (B), and a catalytic (C). The A and C subunits constitute the enzyme’s core, housing the catalytic region responsible for dephosphorylation, while the B subunit regulates cellular localization and substrate specificity [11]. Phosphorylation at Tyr307 is the most prominent post-translational modification governing PP2A inactivation. Several mechanisms are known to regulate or inactivate PP2A, with one of the most prominent being post-translational modification, such as phosphorylation at Tyr307. Endogenous inhibitory proteins, such as the phosphatase 2A inhibitor (SET) oncoprotein and the cancerous inhibitor of PP2A (CIP2A), facilitate this inactivation [12]. These proteins interfere with PP2A’s capacity to dephosphorylate critical substrates, including c-Myc and Akt. In cancer cells, overexpression of these inhibitors keeps PP2A inactive, leading to persistent activation of oncogenic pathways that promote cell proliferation, survival, and migration. As a result, SET and CIP2A contribute to the stabilization and hyperactivation of c-Myc and Akt, enhancing tumor progression [13,14].
Consequently, several chemical agents have been reported to restore PP2A activity. Fingolimod (FTY-720) interacts with the SET oncoprotein and promotes phosphatase reactivation [10,15], while erlotinib indirectly downregulates CIP2A expression [16,17]. Preclinical studies have demonstrated the potential of these compounds to restore PP2A function and suppress tumor growth in various malignancies, including liver, lung, leukemia, and BC [12,18,19,20].
The coordinated mechanistic impact of these agents has not previously been investigated in TNBC, a subtype characterised by strong dependence on exacerbated kinase-driven signaling and the lack of effective targeted therapies. This observation reveals an unexplored pharmacological opportunity: the simultaneous modulation of SET and CIP2A as complementary regulators of the phosphatase complex. The absence of selective ligands designed to modulate these interactions highlights the need for mechanistic studies that can guide the rational development of new PP2A reactivating agents.
In this regard, PP2A acts as a tumor suppressor and is a crucial regulator of critical cellular processes, underscoring its value as a therapeutic target. The present study aims to identify the mechanism of PP2A reactivation through erlotinib and FTY-720, which function as inhibitors of SET and CIP2A, thereby counteracting key signaling pathways involved in breast cancer development and progression. Specifically, we investigate the Src/FAK/paxillin/PAK1 signaling pathway, as these proteins are critical controllers of BC cell migration [9,21]. Dysregulation of this axis promotes essential stages of the metastatic cascade, including primary tumor growth and detachment, tissue invasion, and distant dissemination.
We integrated computational, mechanistic, and biological studies to elucidate the molecular basis of PP2A reactivation, thereby revealing its central role in regulating oncogenic signaling networks. Our findings establish that targeting SET and CIP2A restores PP2A activity, which modulates key pathways associated with proliferation, survival, and cell motility. This work provides a mechanistic framework for understanding how PP2A reactivation counteracts breast cancer progression at the molecular level.

2. Results

2.1. Gene Expression Analysis of Genes Involved in Tumor Progression

PP2A acts as a tumor suppressor by regulating key oncogenic pathways, and its inhibition contributes to malignant progression. The expression of PPP2CA (PP2A catalytic subunit), along with its endogenous inhibitors CIP2A and SET, plays a crucial role in modulating PP2A function. In BC, dysregulation of these components has been demonstrated to be associated with aggressive tumor behaviour and unfavourable clinical outcomes [4]. Therefore, analysing their expression patterns may provide insights into PP2A-related mechanisms in tumor progression.
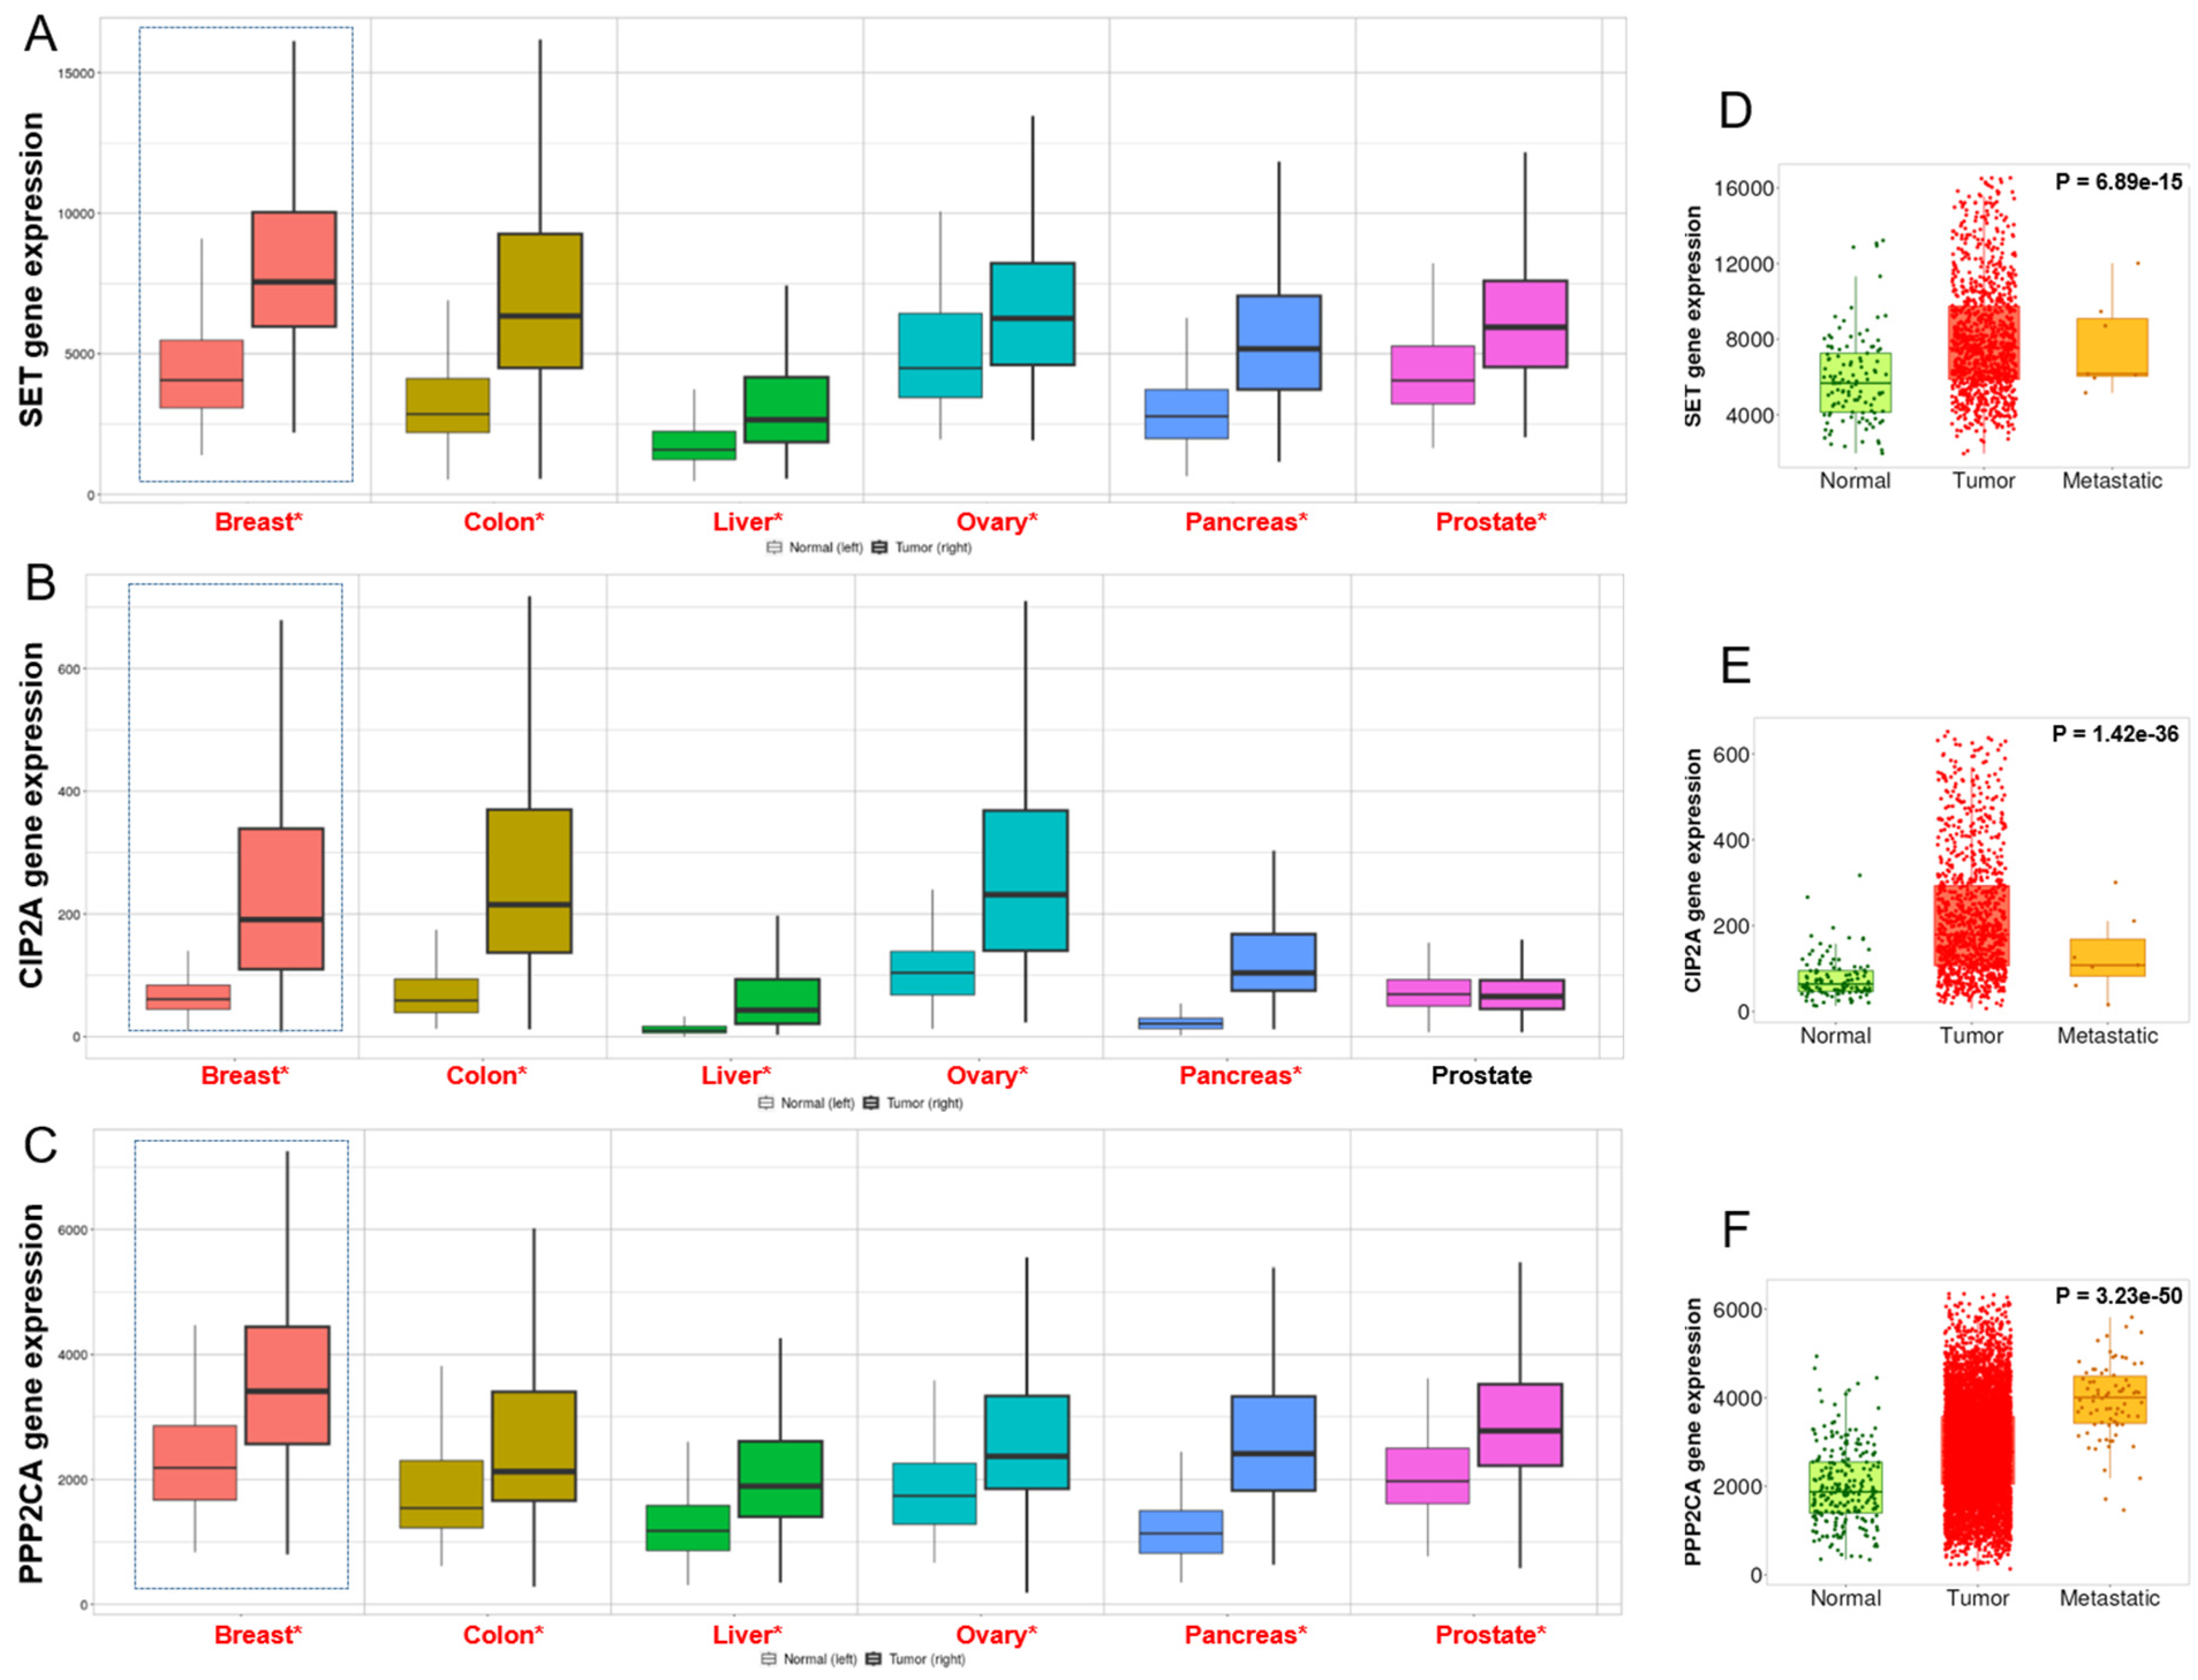
Herein, we explore the expression levels of PPP2CA, SET, and CIP2A in a wide range of normal and tumor tissues using RNA-seq data from the TNMplot platform. Elevated SET and CIP2A gene expression were observed in tumors compared with normal tissue across multiple tissue types (Figure 1A,B). Interestingly, PPP2CA, the gene encoding the catalytic subunit of PP2A, also showed increased expression in several tumor types (Figure 1C). Particularly in BC, we detected significantly higher gene expression levels of SET and CIP2A in tumor and metastatic tissues compared to the control (Figure 1D,E). For the PPP2CA subunit, we found a marked increase in tumor tissue compared with the control, with the highest expression levels observed in metastatic tissue (Figure 1F). These results highlight the altered expression of key PP2A components in cancer and underscore the relevance of the PP2A axis in tumorigenesis.
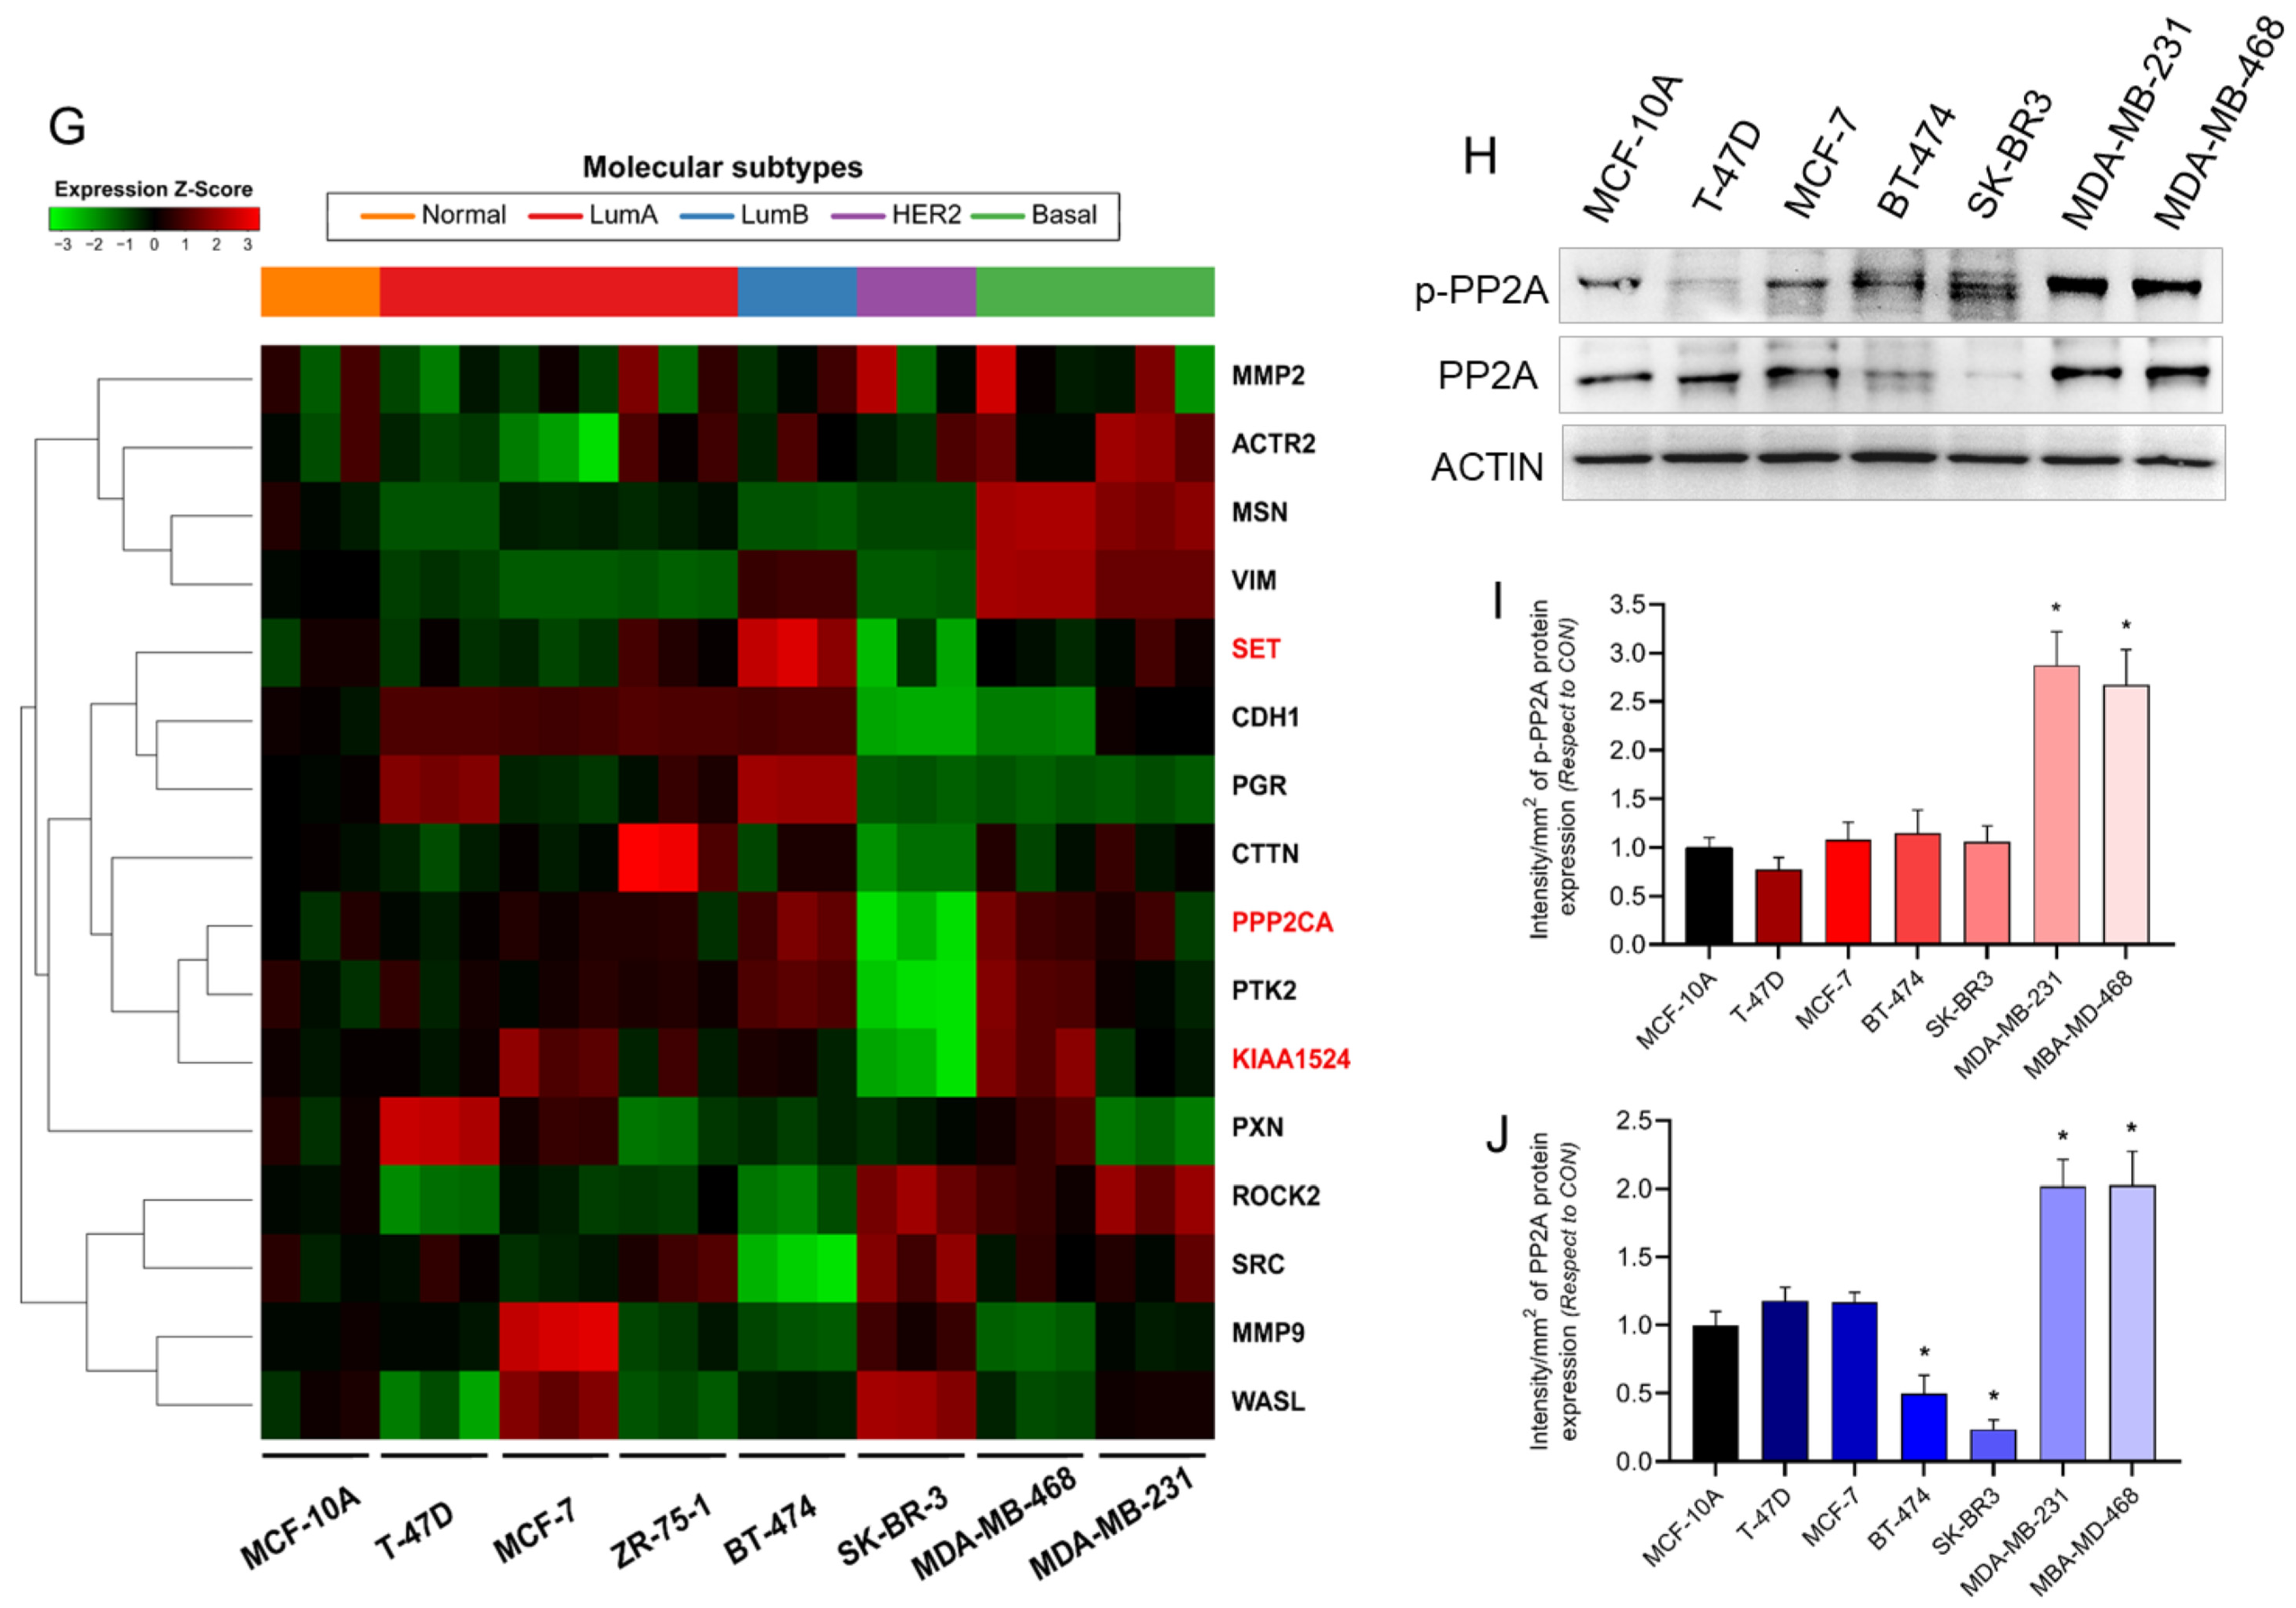
We next characterized and compared a panel of 16 genes associated with cell motility and key drivers of metastatic progression, along with the expression of genes encoding PP2A, SET, and CIP2A across different molecular subtypes of BC (Figure 1G). Gene expression levels were visualized using heatmaps, revealing distinct transcriptional signatures among subtypes. As a reference for basal gene expression, the non-tumorigenic mammary epithelial cell line MCF-10A consistently exhibited low expression levels for all genes analyzed. Luminal A (T-47D, MCF-7, ZR-75-1) and luminal B (BT-474) cell lines showed heterogeneous expression patterns, whereas HER2-enriched cells (SK-BR-3) showed generally low transcript levels across most genes (Figure 1G). Notably, basal-like triple-negative breast cancer (TNBC) cell lines (MDA-MB-231 and MDA-MB-468) exhibited a marked upregulation of several genes associated with tumor progression (Figure 1G), particularly those involved in cell migration, invasion, and metastasis, consistent with their highly aggressive phenotype.
In parallel, we analysed the expression of SET, KIAA1524 (also known as CIP2A), and PPP2CA. SET and KIAA1524 were upregulated in the most aggressive subtypes, including in TNBC BC cell lines. Interestingly, PPP2CA expression was also increased in these subtypes (Figure 1G). To validate these transcriptomic findings at the functional protein level, we performed Western blot analysis across representative BC cell lines. In accordance with the gene expression data, TNBC cells demonstrated significantly elevated levels of both total PP2A (active form) and its phosphorylated inactive form (Figure 1H–J). These results suggest that the overexpression of PP2A inhibitors leads to increased PP2A phosphorylation and subsequent inactivation. This, in turn, contributes to the enhanced aggressiveness and migratory behaviour that is characteristic of TNBC.

2.2. Identification of Phosphorylated Residues Associated with Loss of PP2A Function

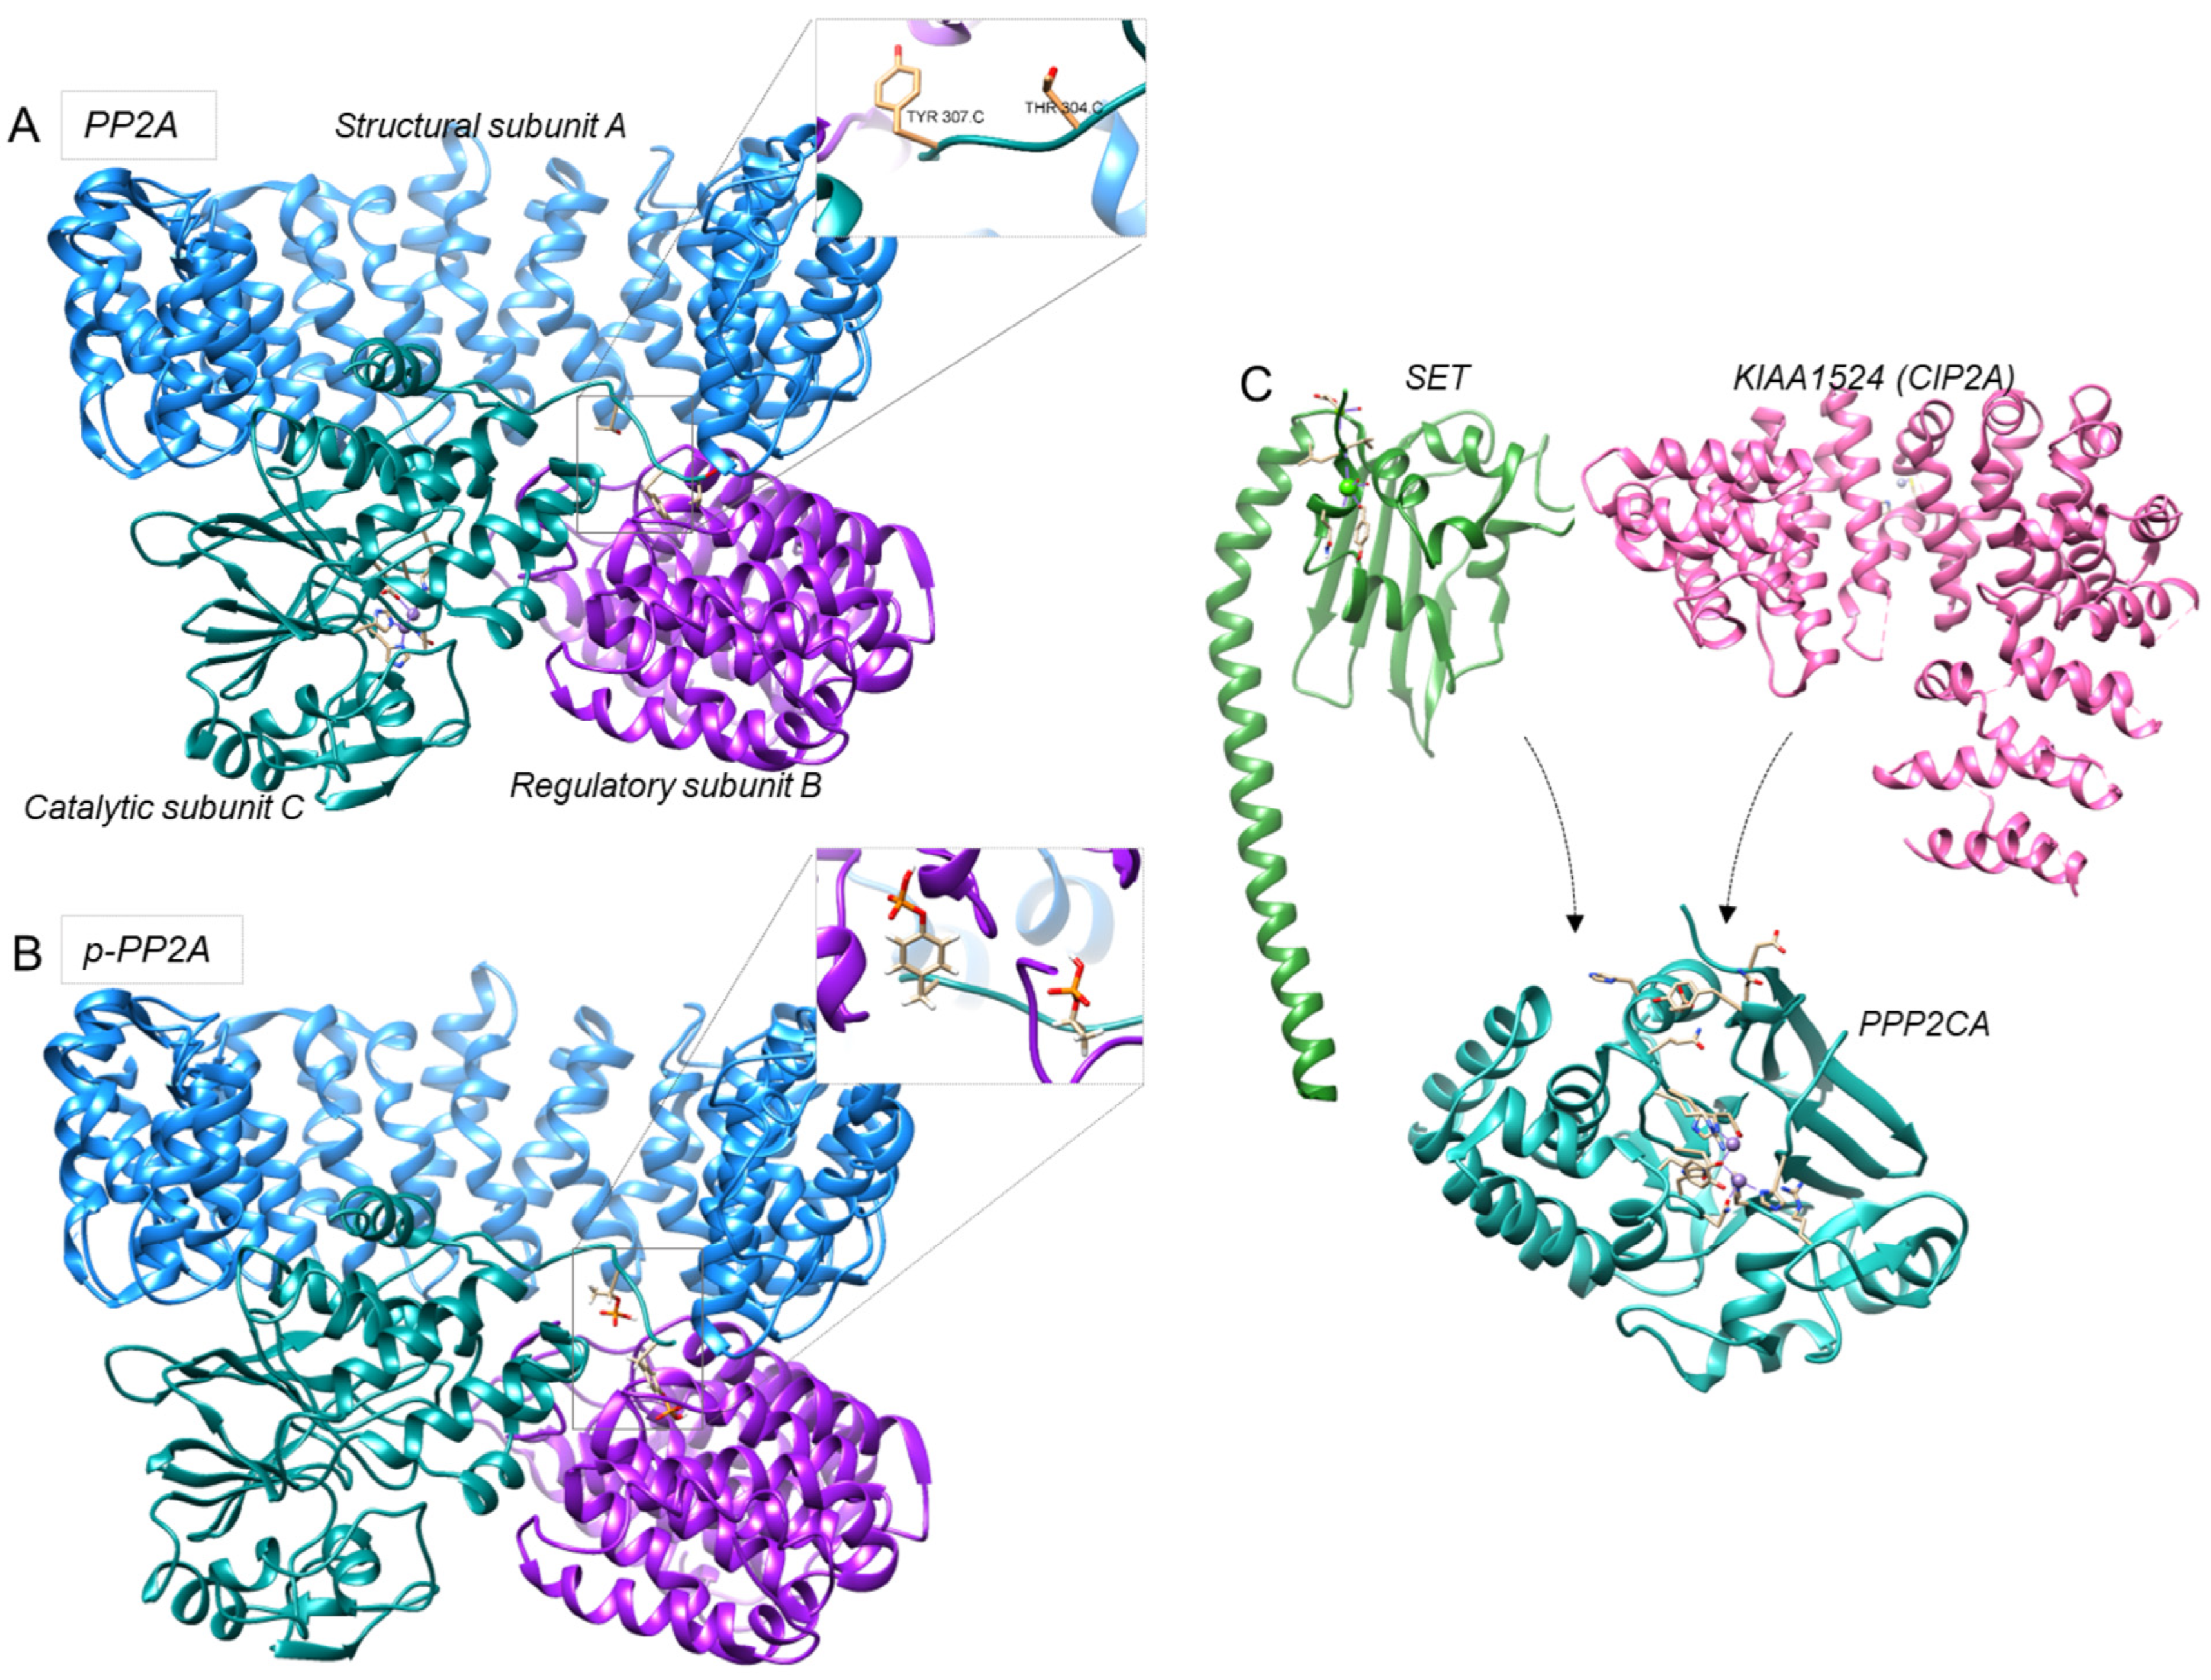
As an initial step, we identify the phosphorylation-susceptible residues associated with the loss of PP2A function, specifically Tyr307 and Thr304 [22,23]. These residues were found within the C subunit of the PP2A protein (Figure 2A, colour cyan). After identifying the locations of the key residues, we phosphorylated them to simulate protein inactivation (Figure 2B).
By modelling PP2A regulation using the endogenous inhibitors SET and CIP2A, the specific residues Tyr307 and Thr304 associated with PP2A loss of function are phosphorylated in their inactive state (Figure 2C). Importantly, SET and CIP2A do not directly phosphorylate PP2A; instead, they stabilize and maintain its inactive phosphorylated conformation, particularly at Tyr307, thereby preventing PP2A dephosphorylation and reactivation [22,23]. Therefore, bioinformatics results replicate in vitro and experimentally observed biological processes, providing a reliable platform for further therapeutic exploration.

2.3. Binding Mode Analysis of Chemical Probes Targeting PP2A Inhibitory Proteins

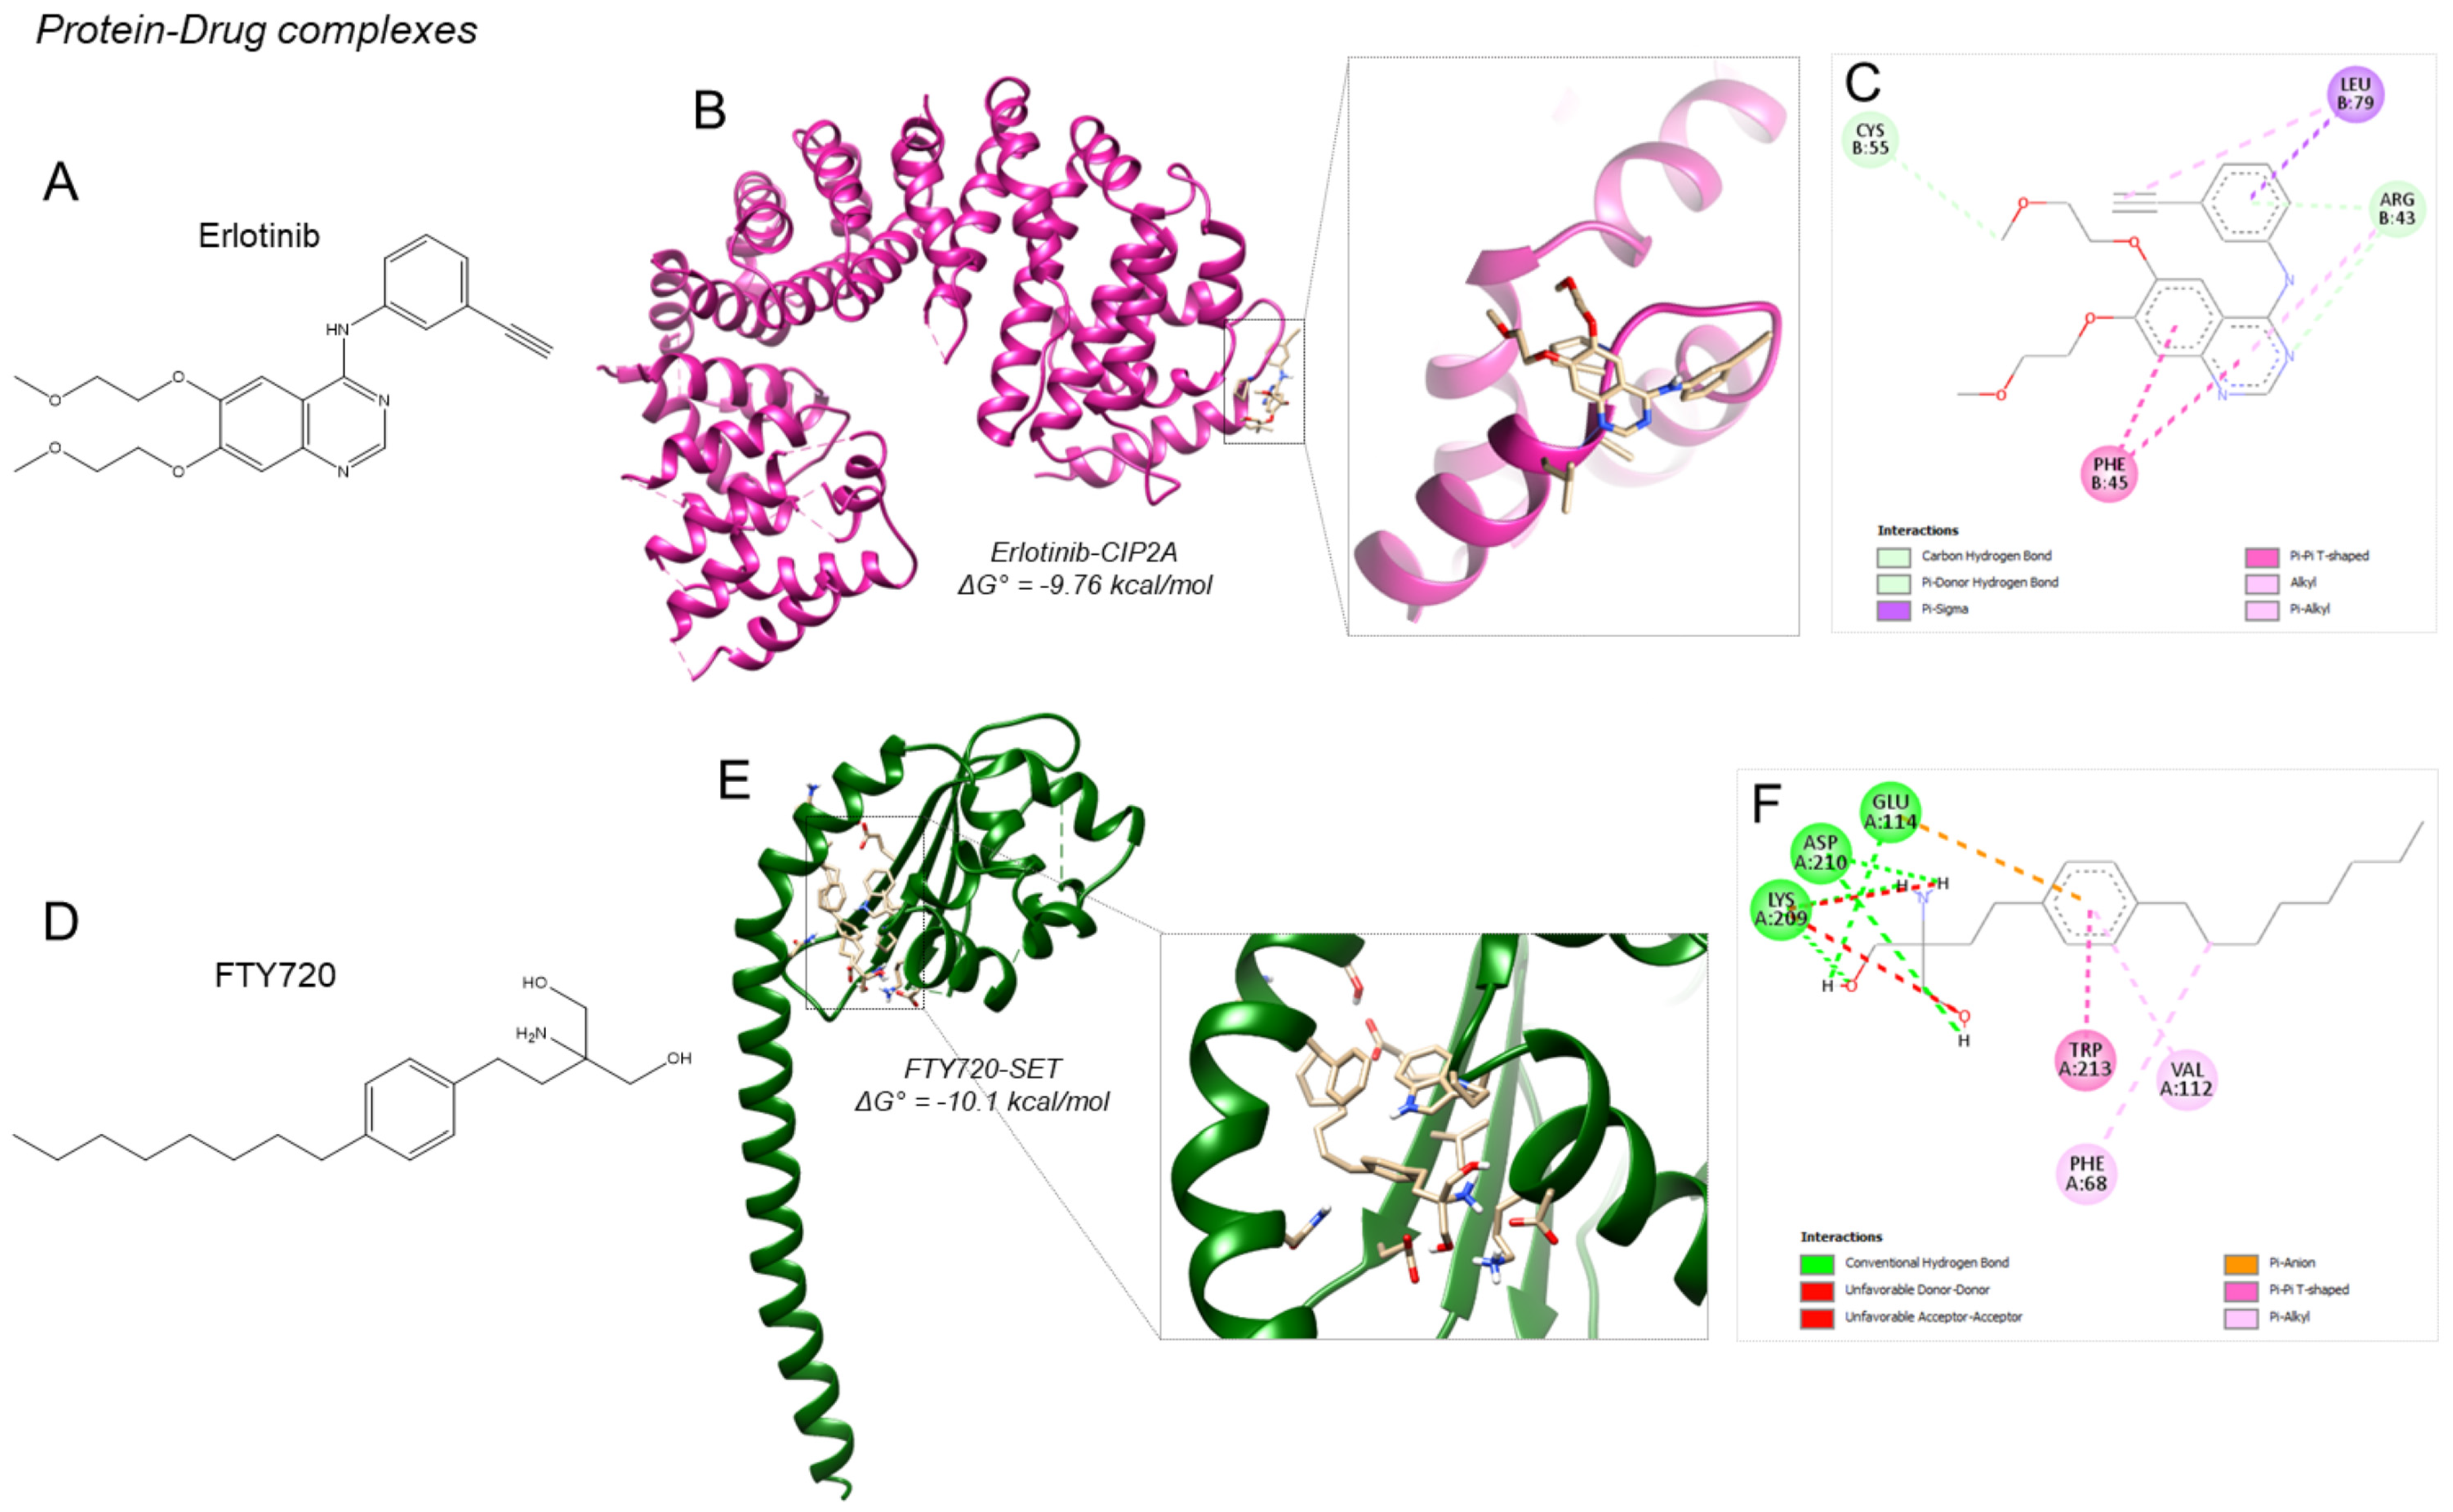
Erlotinib and FTY-720 have been proposed as potential CIP2A and SET inhibitors, respectively. Therefore, we aimed to investigate the specific binding interactions between erlotinib/CIP2A and FTY-720/SET proteins (see Figure 3A–F) in order to determine the ability of both to modulate PP2A activity. In the CIP2A–erlotinib complex (binding affinity = −9.76 kcal/mol), a total of eight interactions were identified, including three hydrogen bonds. The first of these was formed between the nitrogen atom of the quinazoline core and ARG43 (1.82 Å). The second hydrogen bond involved the π-electron system of the benzene ring adjacent to the quinazoline nucleus and the hydrogen atom of ARG43 (2.45 Å). The third interaction was identified between the terminal methoxy group of erlotinib and CYS55, with a distance of 3.38 Å. The remaining interactions were hydrophobic, involving residues such as PHE45, LEU79, and ARG43 (Figure 3B,C).
In the FTY-720–SET complex (binding affinity = −10.1 kcal/mol), FTY-720 formed six hydrogen bonds. LYS209 contributed three of them: two involving its amino hydrogen atoms and the ligand’s hydroxyl oxygen (2.51–2.20 Å), and one with the hydroxyl group (1.79 Å). Furthermore, ASP210 formed two additional bonds through interactions with the amino and hydroxyl groups of the 2-amino-2-methyl-1,3-propanediol moiety (1.79 Å and 2.58 Å). GLU114 contributed the sixth bond via the hydroxyl hydrogen adjacent to the amino group (1.94 Å). This same residue also engaged in a π-anion interaction with the ligand’s aromatic ring. Finally, the binding site included a hydrophobic pocket formed by TRP213, VAL112, and PHE68 (Figure 3E,F).

2.4. Molecular Dynamics Studies of the FTY-720–SET and Erlotinib—CIP2A Complex

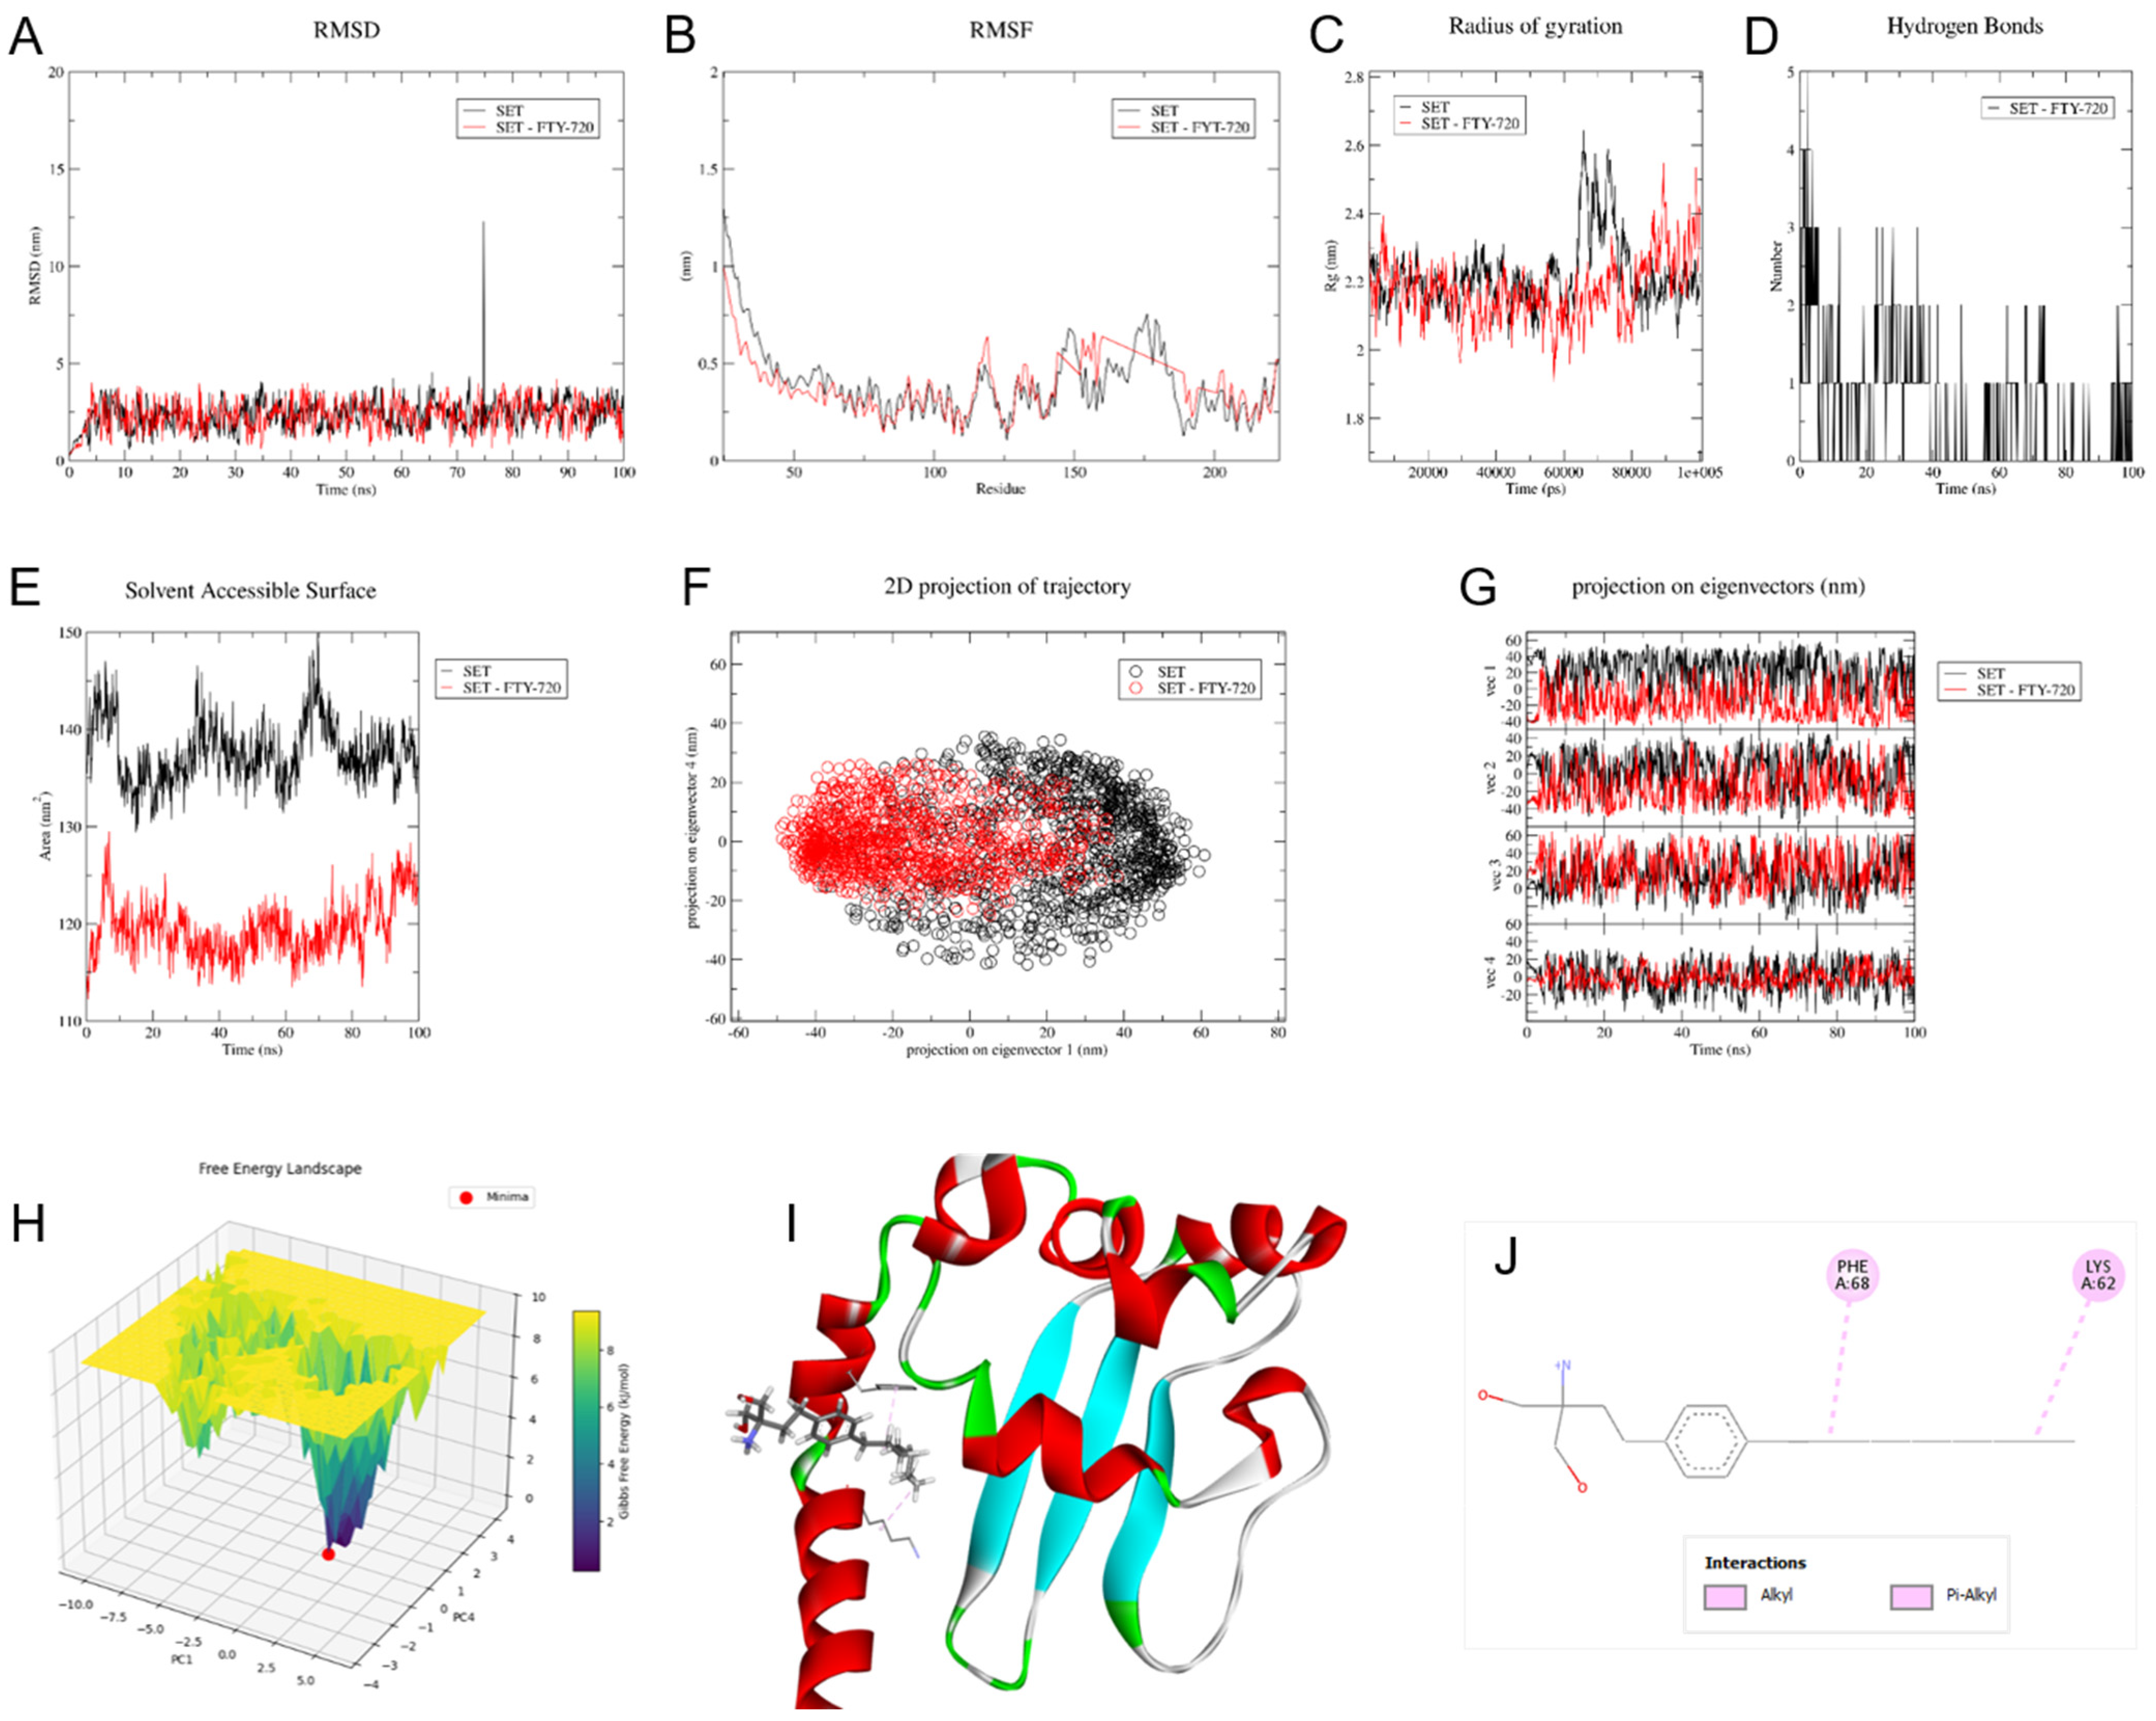
To explore the stability and dynamic behavior of drug-protein complexes under physiologically relevant conditions, we conducted molecular dynamics (MD) simulations. In the FTY-720–SET complex, the RMSD initially increased relative to the unbound SET protein during the first 30 ns of the simulation. After this period, the complex exhibited a more stable RMSD profile with reduced fluctuations, maintaining this stability between 32.9 and 72.39 ns. From 74.5 ns onward, the RMSD values of the FTY-720–SET complex remained consistently lower (0.700–3.94 nm) than those of the free SET protein (1.13–12.29 nm), indicating enhanced structural stability upon ligand binding (Figure 4A). The RMSF analysis revealed reduced structural flexibility of the SET protein upon binding with FTY-720, compared with its unbound form. While both the free and bound states exhibited similar fluctuation patterns between residues 23 and 142, the FTY-720–SET complex consistently showed lower RMSF values throughout this region. Beyond residue 144 and up to residue 224, the complex showed a distinct pattern marked by lower and more uniform fluctuations, indicating that ligand binding confers increased rigidity to the protein structure in this segment (Figure 4B).
The analysis of the radius of gyration (Rg) showed an initial upward trend in the compactness of the FTY-720–SET complex relative to the unbound SET protein during the first 27,500 ps of the simulation. From 28,000 ps onward, the Rg values of the unbound SET protein were consistently higher than those of the complex, suggesting that ligand binding enhances structural stability (Figure 4C). Similarly, hydrogen bond formation between FTY-720 and SET showed a consistent pattern throughout the simulation, with one to two hydrogen bonds maintained during most of the trajectory, except for the 50–55 ns interval, during which no hydrogen bonds were formed (Figure 4D).
Furthermore, the analysis of solvent-accessible surface area (SASA) revealed a clear distinction between the FTY-720–SET complex and the unbound SET protein. The complex consistently exhibited lower solvent exposure values (113–130 nm2) relative to the unbound SET protein (130–150 nm2), indicating that ligand binding induces a conformational state that reduces catalytic-site accessibility to the surrounding cellular environment (Figure 4E). We applied principal component analysis (PCA) to examine the dominant motions within the system during the molecular dynamics simulation. The first four components accounted for over 50% of the total variance, capturing the most relevant conformational fluctuations. The unbound SET protein exhibited a wider distribution along the principal components, reflecting increased structural mobility. In contrast, the FTY-720–SET complex exhibited more confined motions, suggesting that ligand binding contributed to greater conformational stability of the protein (Figure 4F,G). Finally, we identified the most stable conformation by analyzing the free energy landscape (FEL), which revealed a minimum energy state at 70.3 ns (Figure 4H). This conformation exhibited a binding mode primarily stabilized by hydrophobic interactions between the aliphatic chain of FTY-720 and the residues PHE68 and LYS62, forming alkyl-type contacts (Figure 4I,J).
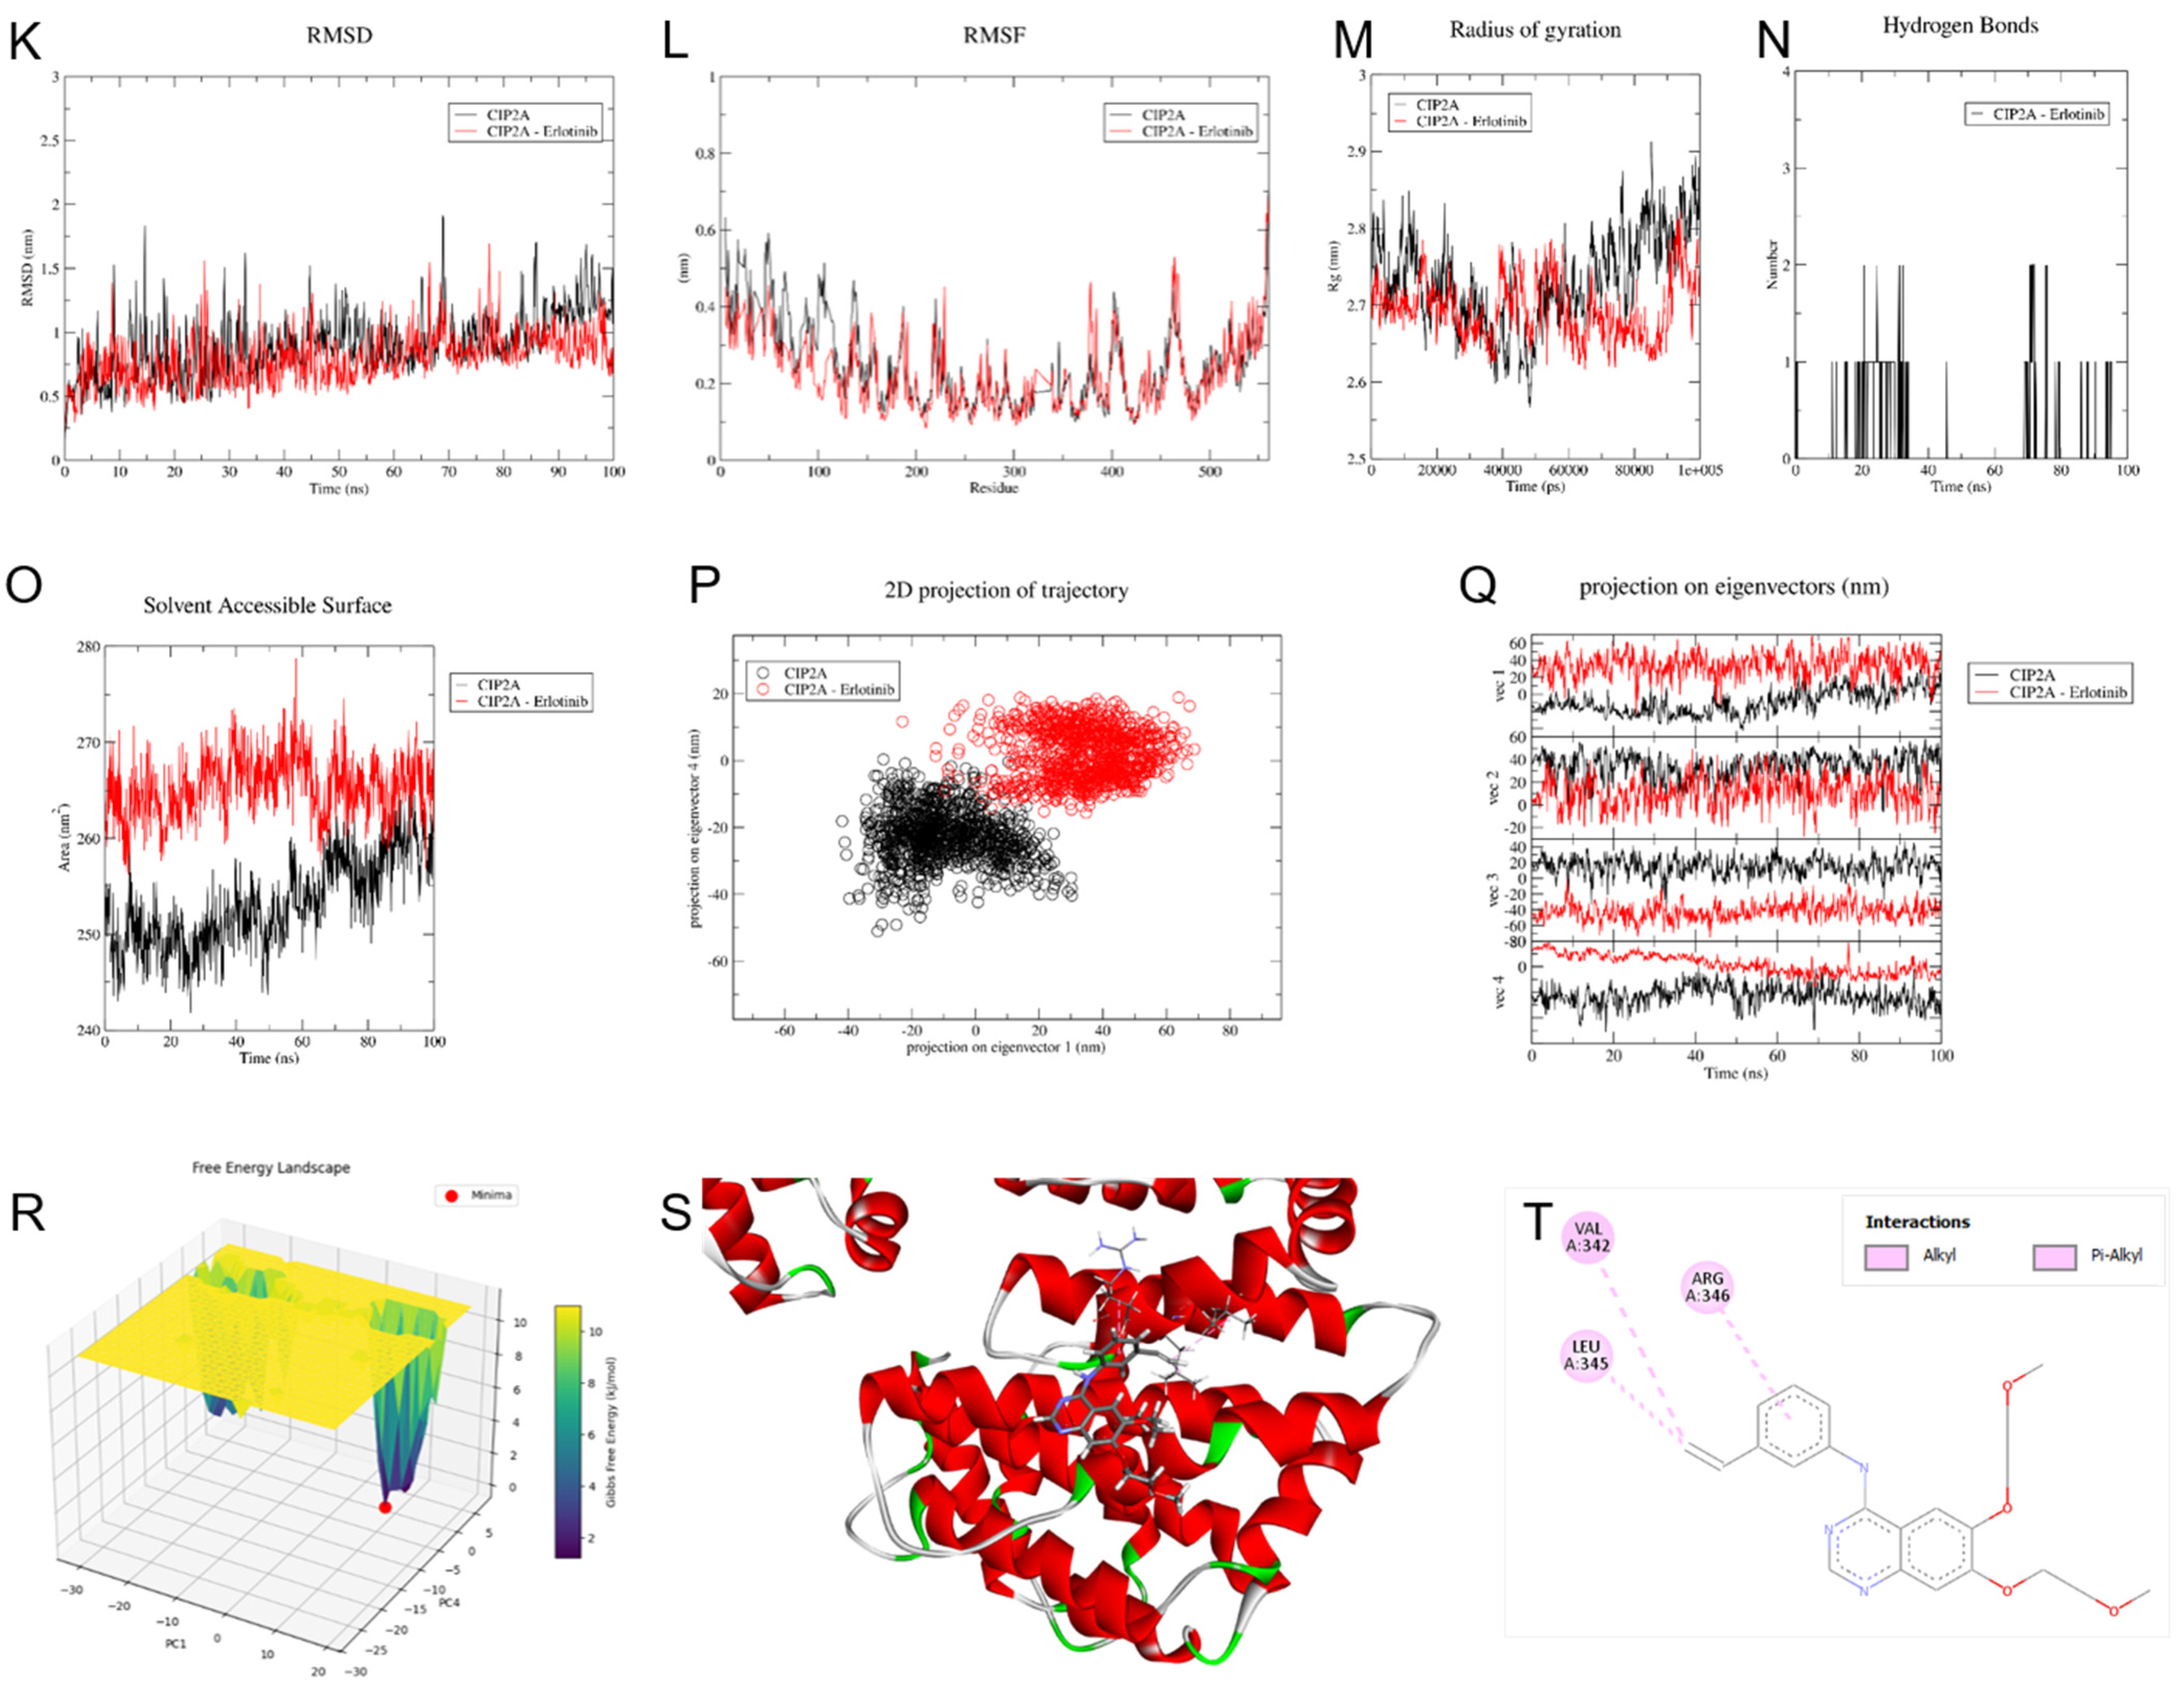
Similarly, the structural stability of the systems was evaluated by analyzing RMSD profiles of both the erlotinib–CIP2A complex and unbound CIP2A protein. The results demonstrated more stable conformational behavior for the ligand-bound complex. During the initial 18.9 ns of the simulation, both systems exhibited increasing RMSD values; however, the unbound protein showed higher deviations (0.35–1.83 nm) than the complex (0.45–1.38 nm). Between 19 and 26 ns, the complex showed slightly higher values (0.46–1.56 nm) compared with the free protein (0.48–1.21 nm). After this point, the trend reversed, and the complex consistently maintained lower fluctuations (0.41–1.70 nm) than the unbound protein (0.74–1.92 nm) through the remainder of the simulation, reflecting a stabilizing effect upon ligand binding (Figure 4K).
Subsequently, we examined RMSF profiles of the erlotinib–CIP2A complex and the unbound CIP2A protein to assess residue-level flexibility. The analysis revealed distinct fluctuation patterns between the two systems. Over the first 150 amino acid residues, the erlotinib–CIP2A complex exhibited reduced flexibility, with RMSF values ranging from 0.26 to 0.45 nm, compared with 0.16 to 0.60 nm observed for the unbound protein. Beyond residue 150, however, the trend reversed: the complex showed slightly higher RMSF values (0.097–0.45 nm) compared with the unbound CIP2A protein (0.10–0.52 nm) across residues 151 to 554, suggesting localized differences in flexibility upon ligand binding (Figure 4L). In the same way, analysis of the Rg revealed distinct differences between the erlotinib–CIP2A complex and the unbound CIP2A protein. During the initial 40,000 ps of the simulation, the unbound protein exhibited higher Rg values (2.68–2.84 nm) compared to the complex (2.66–2.78 nm), suggesting a more compact structure upon ligand binding. However, between 41.000 and 57.600 ps, this trend reversed, with the Rg values of the CIP2A protein decreasing significantly (2.56–2.78 nm) and increasing those of the complex (2.66–2.78 nm).
This indicates a transient expansion of the ligand-bound conformation. Following this interval, the initial trend resumed: the unbound protein again showed higher Rg values, while the complex exhibited a decline, consistent with a return to a more compact and potentially stabilized state upon ligand binding (Figure 4M). The analysis of hydrogen bond formation did not reveal a consistent pattern of stable interactions between erlotinib and CIP2A. Throughout the simulation, the number of hydrogen bonds fluctuated between 0 and 2, with extended periods without hydrogen bond formation between the protein and erlotinib, suggesting that polar interactions contribute minimally to the stability of the complex (Figure 4N). In accordance with these findings, the SASA analysis demonstrated a markedly different behavior between the two systems. The erlotinib–CIP2A complex consistently exhibited higher solvent exposure values (259–278 nm2) relative to the unbound CIP2A protein (241–262 nm2), a trend maintained throughout the full simulation period (Figure 4O). This increase in SASA may reflect conformational changes associated with ligand binding that affect the exposure of surface residues to the solvent.
Finally, we conducted PCA to examine the dominant collective motions within the systems. Four principal components were necessary to capture more than 50% of the total variance, with the erlotinib–CIP2A complex exhibiting a more compact and less dispersed conformational distribution compared with the unbound CIP2A protein structure (Figure 4P,Q).
These differences in conformational variability were particularly pronounced along principal components 2, 3, and 4, indicating that ligand binding restricts the protein’s dynamic behavior (Figure 4Q). Concurrently, FEL analysis determined the global minimum energy state at 77.8 ns of the simulation (Figure 4R). This conformation enabled the identification of key stabilizing interactions between erlotinib and CIP2A, characterized predominantly by hydrophobic contacts involving residues VAL342, LEU345, and ARG346, which appear to play a critical role in reinforcing the binding mode (Figure 4S,T).

2.5. Protein–Protein Interaction Analysis of PP2A Inhibitory Proteins in the Presence and Absence of Chemical Inhibitors

Following the structural analysis of the pharmacological inhibitors erlotinib and FTY-720 on the PP2A inhibitory proteins CIP2A and SET, we conducted protein–protein docking and molecular dynamics simulations to assess whether the drug-induced conformational changes could influence the binding modes of these proteins to PP2A. As a key metric, we focused on interactions involving the phosphorylated residue TYR307, essential for the inactivation of PP2A phosphatase activity.
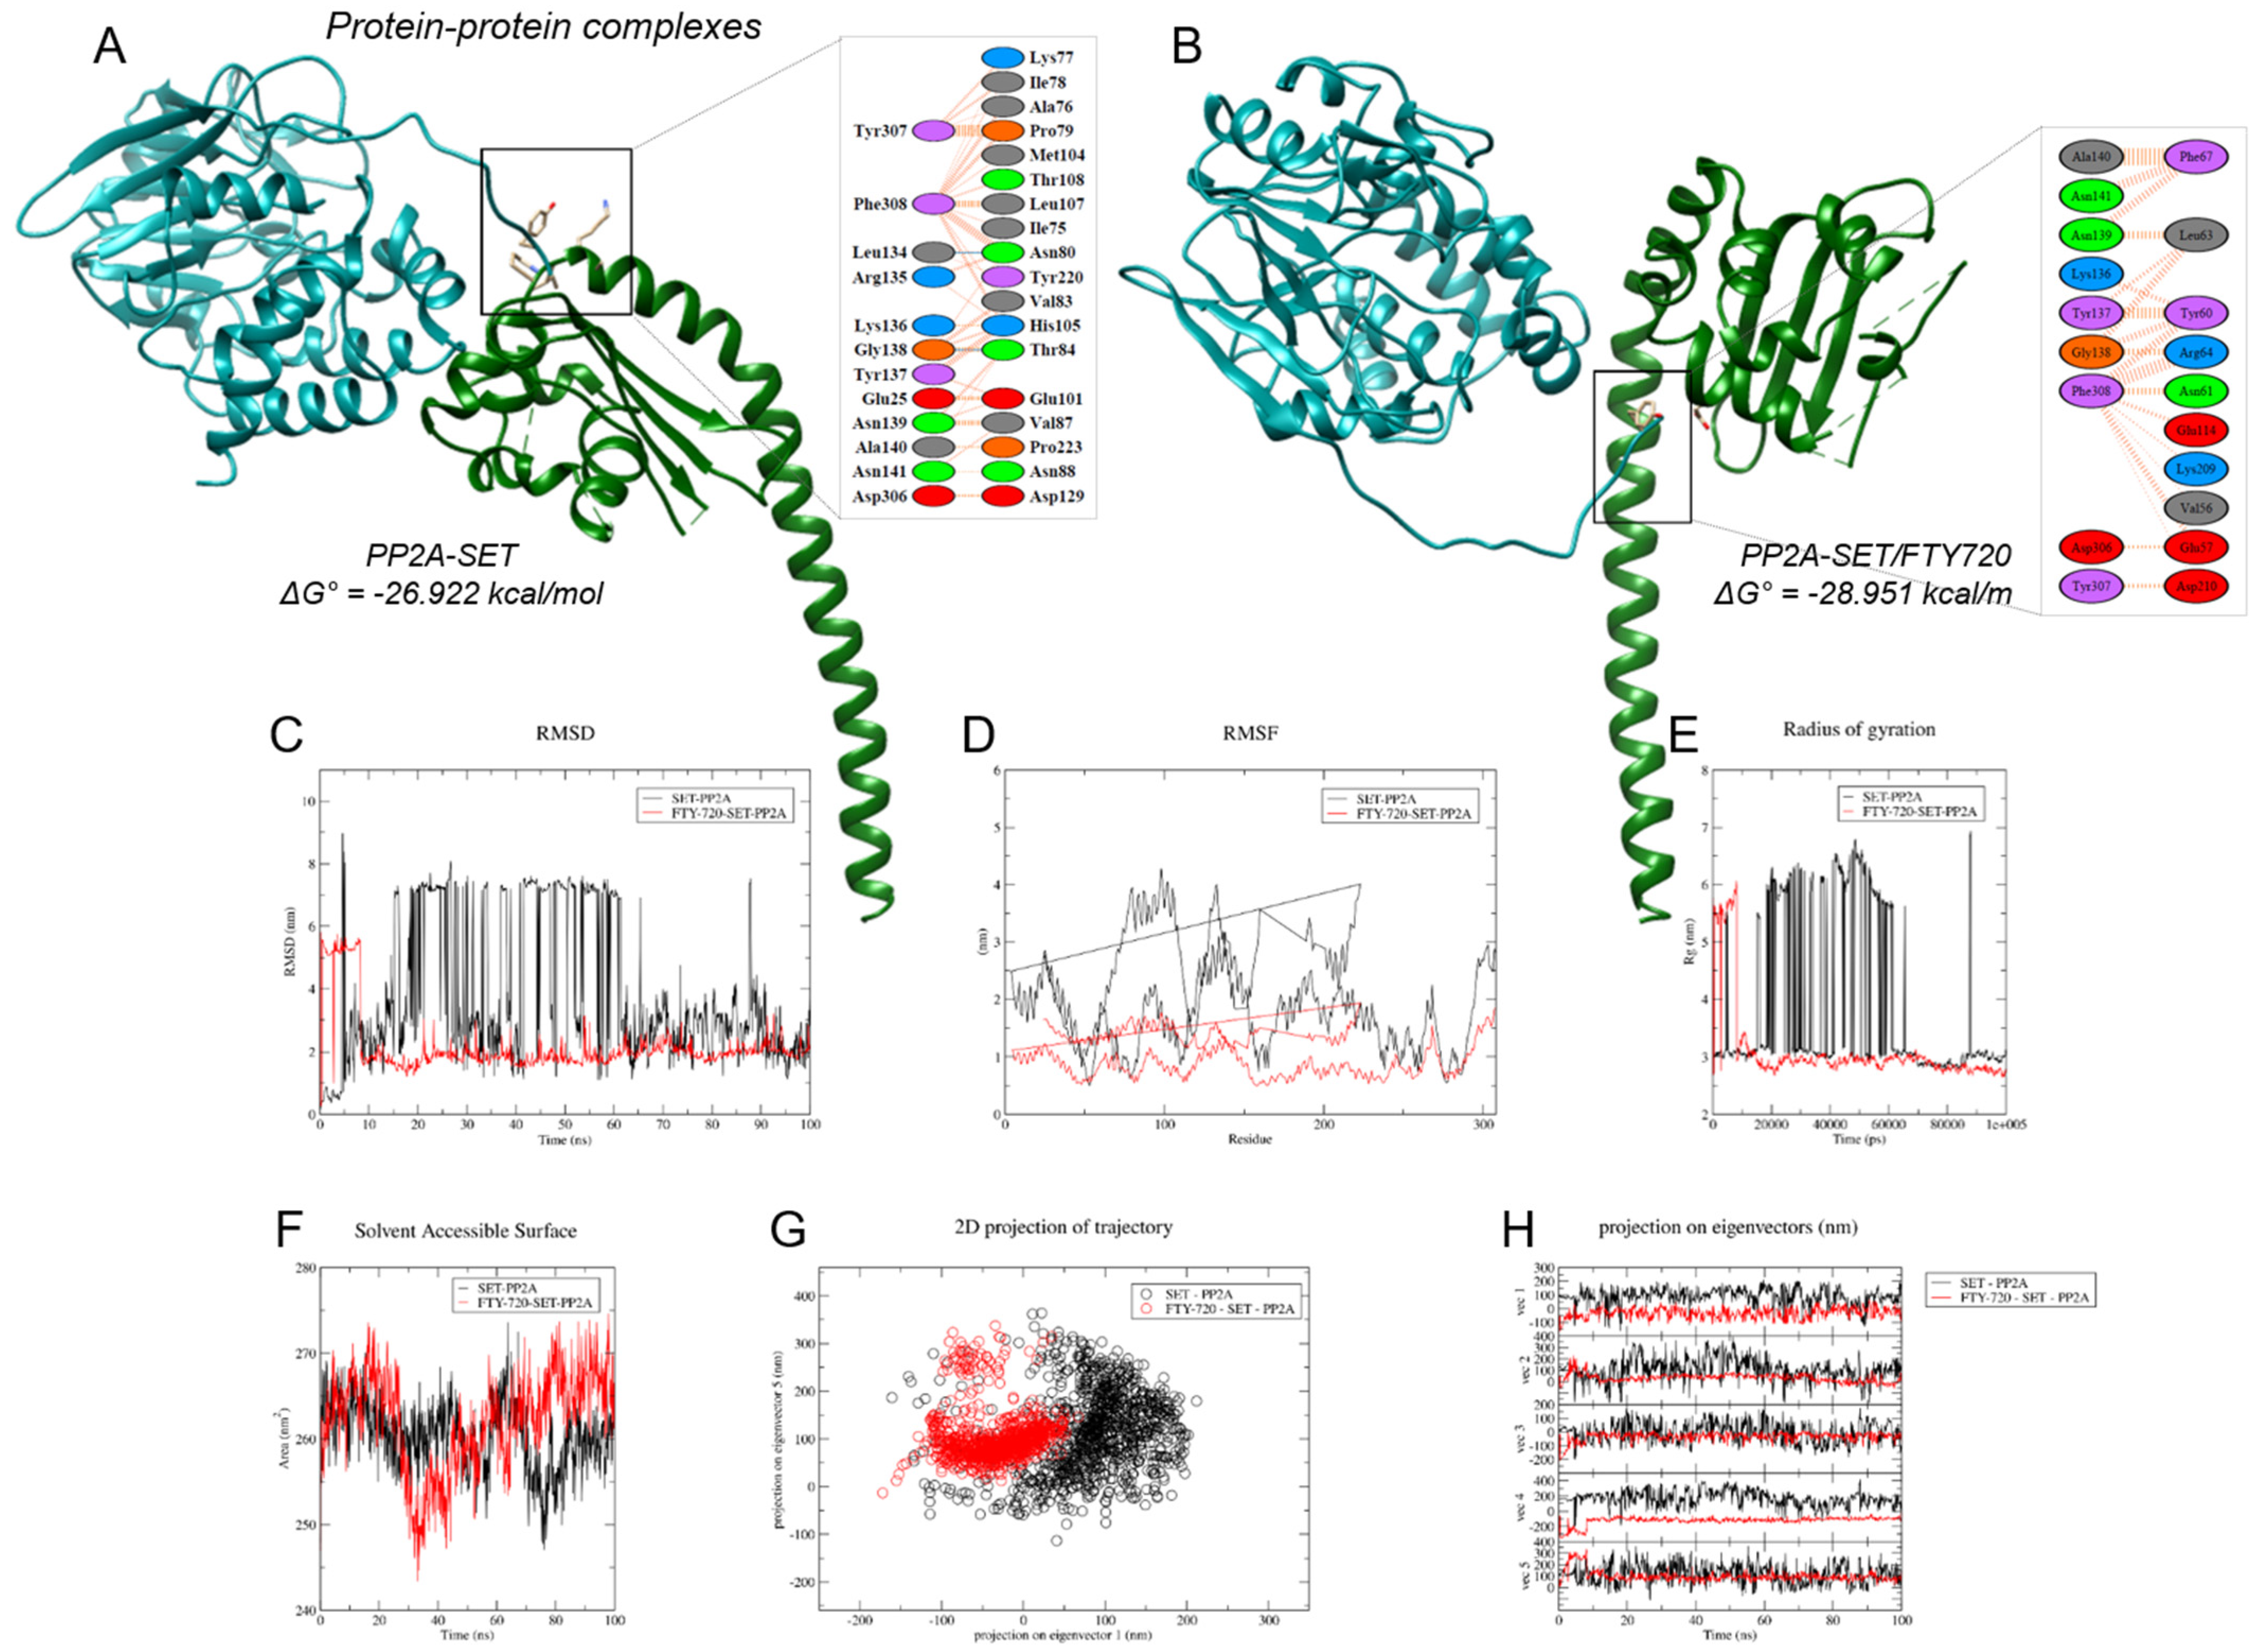
The SET–PP2A complex exhibited a binding affinity energy of −26.922 kcal/mol and established four hydrophobic interactions involving the phosphorylated residue TYR307 and the surrounding amino acids LYS77, ILE78, ALA76, and PRO79 (Figure 5A). The FTY-720–SET–PP2A complex demonstrated an improved binding affinity energy of −28.951 kcal/mol, accompanied by a significant decrease in interactions with TYR307, exhibiting only a single hydrophobic contact with ASP210 (Figure 5B). This decrease in direct interaction with the phosphorylated site, alongside the increased binding affinity, suggests that FTY-720 binding alters the conformational or interaction landscape of SET in a manner that may modulate its association with PP2A. In this regard, the protein–protein interaction between SET and PP2A was further evaluated using molecular dynamics simulations. The RMSD analysis revealed a significantly more stable interaction profile for the FTY-720–SET–PP2A complex, with fluctuations ranging from 1.027 to 5.58 nm, compared to the broader fluctuation range observed in the SET–PP2A complex without FTY-720 (0.76–9.00 nm). These findings support the notion that conformational changes induced by FTY-720 binding to SET may contribute to the enhanced stability of the SET–PP2A interaction (Figure 5C).
Subsequently, the RMSF analysis revealed a markedly more rigid interaction mode upon FTY-720 binding, as evidenced by a significant reduction in residue-level fluctuations (0.52–1.92 nm) compared to the SET–PP2A complex without FTY-720 (1.64–4.27 nm). These results suggest a substantial alteration in the flexibility profile of the amino acid residues, indicating that FTY-720 binding may restrict local motions within the complex (Figure 5D).
Consistently, the analysis of the radius of gyration further supported the increased structural compactness induced by FTY-720 binding. The FTY-720–SET–PP2A complex exhibited lower Rg values (2.75–3.43 nm) compared to the SET–PP2A complex (3.01–6.90 nm), indicating a more compact and potentially more stable protein–protein conformation. It is noteworthy that during the initial phase of the simulation (0–8000 ps), the FTY-720–SET–PP2A complex exhibited higher Rg values; however, this trend was reversed as the simulation progressed, with the Rg decreasing and remaining consistently below that of the SET–PP2A complex for the remainder of the simulation. The results suggest that FTY-720 binding may enhance the structural integrity of the complex by promoting a more compact conformational state (Figure 5E).
The SASA analysis provided further insights into the conformational behavior of the complexes. Initially, the FTY-720–SET–PP2A complex exhibited a higher solvent-exposed surface area (255.8–273 nm2) than the SET–PP2A complex (256–268 nm2), a trend that persisted throughout the first 26 ns of the simulation. However, between 27 and 33 ns, this pattern reversed, with the SET–PP2A complex showing slightly higher SASA values (254–267 nm2) than the FTY-720–SET–PP2A complex (243–260 nm2). Following this interval, the trend shifted again, and the FTY-720–SET–PP2A complex regained a higher level of solvent exposure (258–273 nm2) compared with the SET–PP2A complex (247–262 nm2). These dynamic changes in solvent accessibility suggest that binding of FTY-720 induces conformational rearrangements that modulate the exposure of surface residues over time (Figure 5F).
Then, we conducted a PCA to evaluate the dominant collective motions of the protein–protein complexes. Five principal components were required to account for more than 50% of the system’s total variance, reflecting the complexity of the conformational landscape. Notably, the FTY-720–SET–PP2A complex exhibited a markedly reduced conformational dispersion compared to the SET–PP2A complex. This suggests that the binding of FTY-720 limits large-scale structural fluctuations, resulting in a more compact dynamic behavior (see Figure 5G,H).
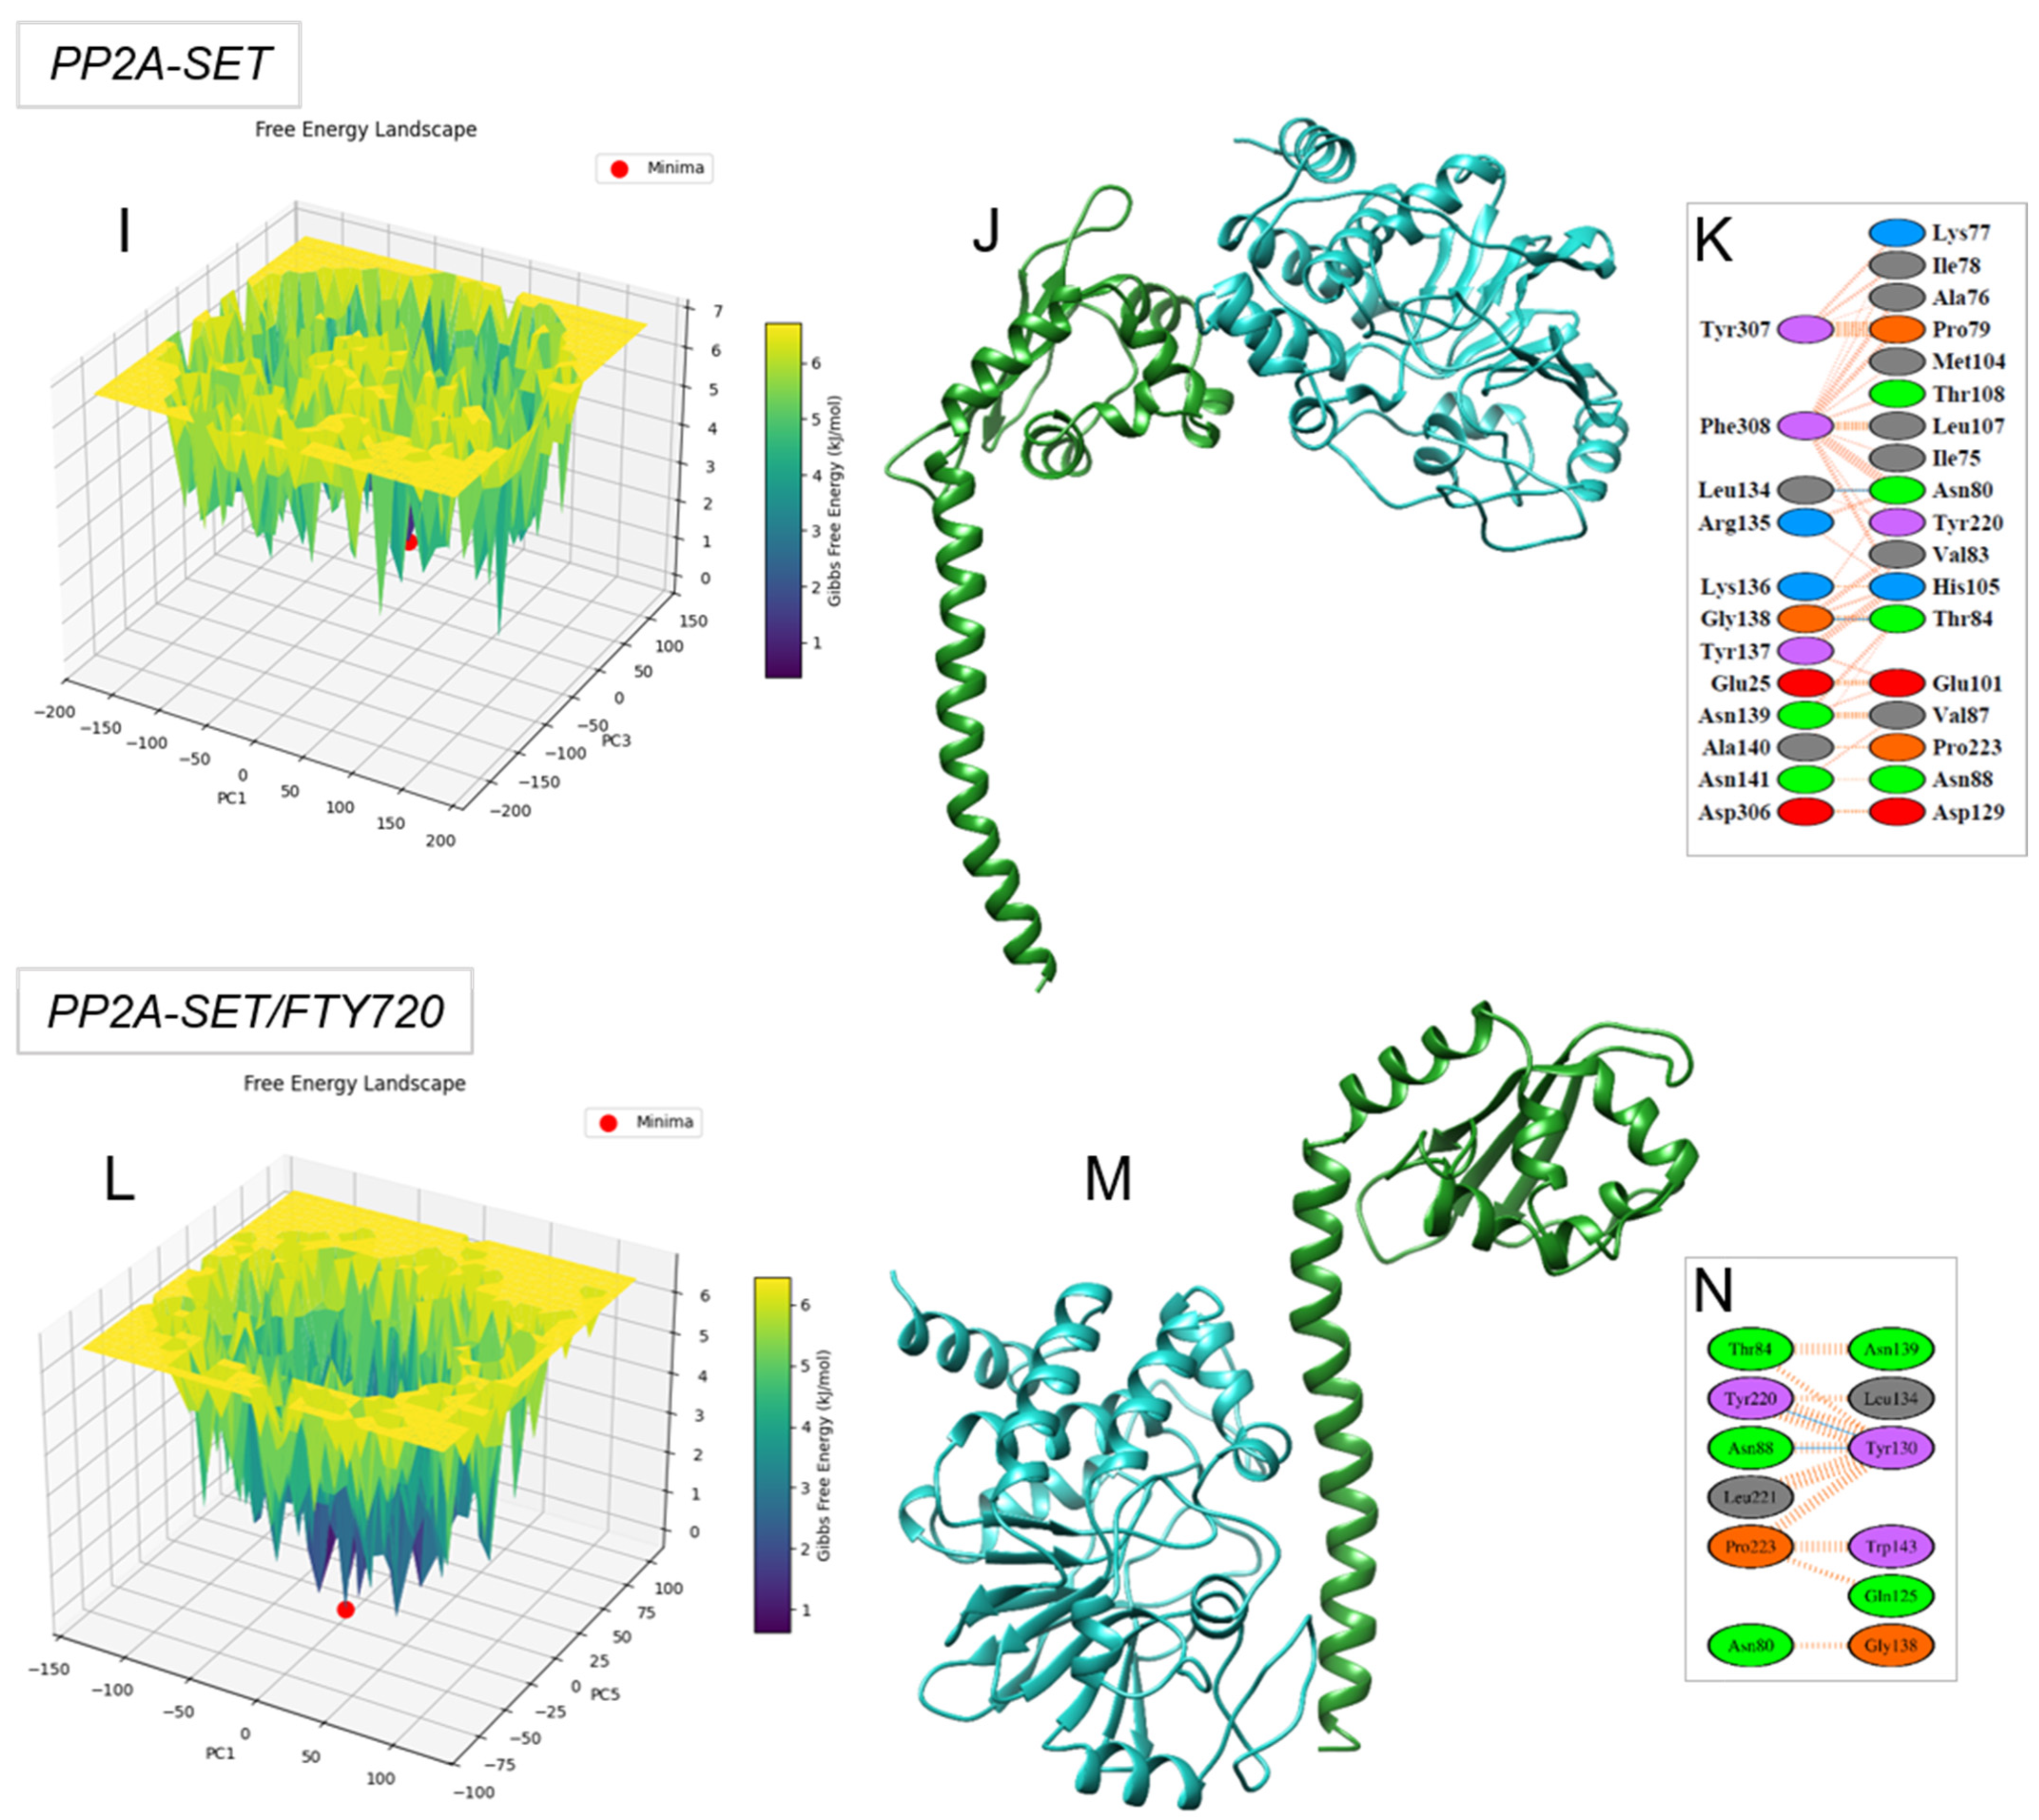
Finally, we analyzed the FEL to identify and compare the lowest-energy conformations of the protein–protein complexes. In the SET–PP2A complex, the system’s minimum-energy state was detected at 42.80 ns (Figure 5I), where SET maintained its interaction with the phosphorylated residue TYR307 through the same key amino acids identified in the initial docking: LYS77, ILE78, ALA76, and PRO79 (Figure 5J,K). In contrast, the FTY-720–SET–PP2A complex reached its lowest-energy conformation at 51.3 ns, accompanied by a pronounced conformational rearrangement at the interaction interface (Figure 5L).
Notably, TYR307 was no longer involved in the interaction with SET in this state, demonstrating that the structural changes induced by FTY-720 binding may interfere with the SET–PP2A binding mode and potentially disrupt its inhibitory function (Figure 5M,N).
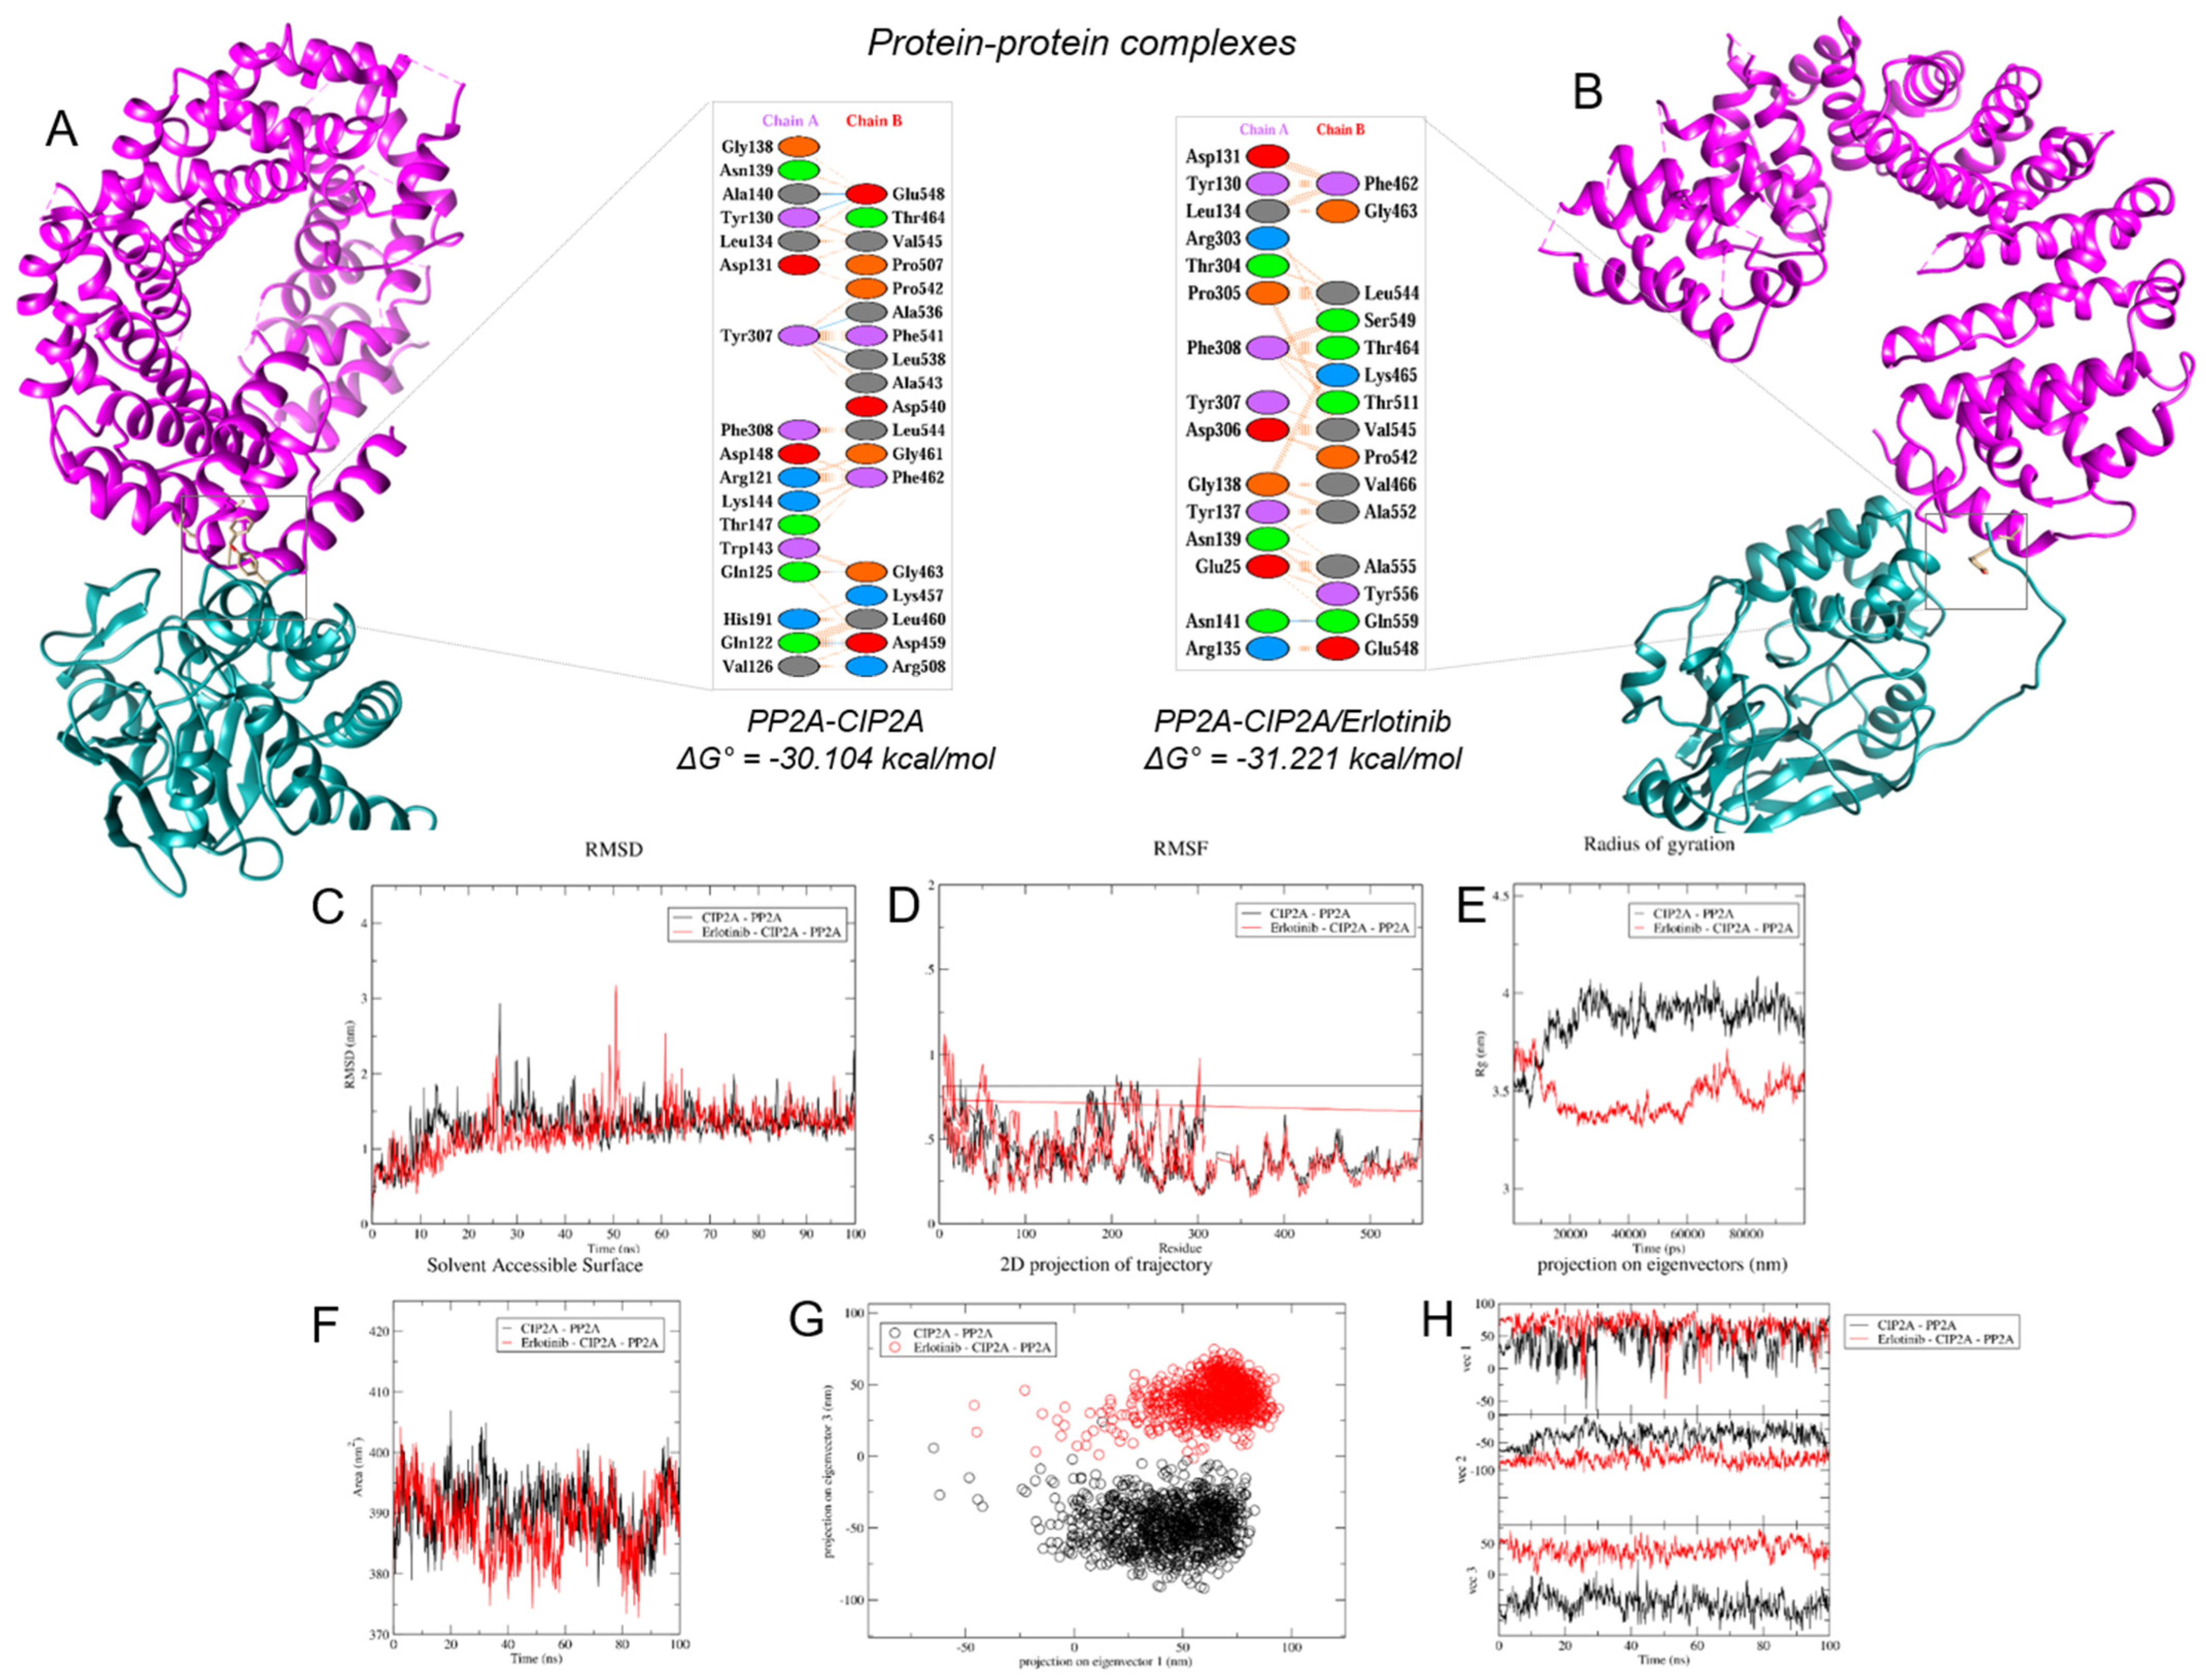
In a similar analysis, the complexes involving CIP2A also revealed notable differences in their interactions with PP2A. In the CIP2A–PP2A complex (binding affinity = −30.104 kcal/mol), the phosphorylated residue TYR307 established eight interactions. These included two hydrogen bonds with residues ALA536 and LEU538 and six hydrophobic contacts involving PRO542, ALA536, PHE541, LEU538, and ALA543 (Figure 6A). In contrast, the erlotinib–CIP2A–PP2A complex (binding affinity = −31.221 kcal/mol) showed a markedly reduced interaction with TYR307, limited to a single hydrophobic contact with VAL545 (Figure 6B).
Next, we examined the RMSD over the course of the simulation. During the first 40 ns, the CIP2A–PP2A complex exhibited higher RMSD values (0.49–2.91 nm) compared to the erlotinib–CIP2A–PP2A complex (0.41–2.24 nm), indicating more pronounced structural fluctuations in the absence of the drug. This pattern reversed between 41 and 73 ns, as the erlotinib–CIP2A–PP2A complex showed increased deviations (1.16–3.18 nm), exceeding those of the unbound complex. In the final segment of the simulation, both systems demonstrated similar RMSD levels, suggesting convergence toward a stabilized conformational state (Figure 6C). Subsequently, the RMSF analysis revealed a differential fluctuation pattern throughout the simulation. For residues 0 to 300, the erlotinib–CIP2A–PP2A complex exhibited consistently higher RMSF values (0.18–0.98 nm) compared to the CIP2A–PP2A complex (0.22–0.86 nm), indicating increased local flexibility in the presence of the drug. However, this trend diminished in the region spanning residues 301 to 557, where both complexes displayed similar fluctuation ranges, suggesting a convergence in flexibility within this segment of the protein (Figure 6D).
The Rg analysis provided further support for the observed structural differences between the complexes. Throughout the full simulation, the CIP2A–PP2A complex consistently exhibited higher Rg values (3.44–4.07 nm) than the erlotinib–CIP2A–PP2A complex (3.34–3.75 nm), indicating a more expanded conformation in the absence of the drug. This trend remained stable over time, suggesting that erlotinib binding contributes to a more compact overall structure (Figure 6E). In accordance with the Rg results, the SASA analysis further highlighted structural differences between the complexes. The CIP2A–PP2A complex consistently exhibited higher SASA values throughout the simulation (378.8–407.17 nm2), reflecting a more solvent-exposed conformation. In contrast, the erlotinib–CIP2A–PP2A complex showed slightly lower SASA values (373.1–400.52 nm2), suggesting that the presence of erlotinib may induce a more compact structural arrangement with reduced solvent-accessible area (Figure 6F).
To gain further insight into the global conformational dynamics of the CIP2A-containing complexes, we analyzed their principal components. A total of three components were required to explain more than 50% of the system’s variance, reflecting a moderately complex conformational space. In Figure 6G,H, the erlotinib–CIP2A–PP2A complex showed a more confined and compact motion profile in comparison to the broader dispersion observed in the CIP2A–PP2A complex. This finding suggests that erlotinib reduces large-scale fluctuations throughout the system, thereby significantly contributing toward a more stable binding mode than that observed for the CIP2A–PP2A complex.
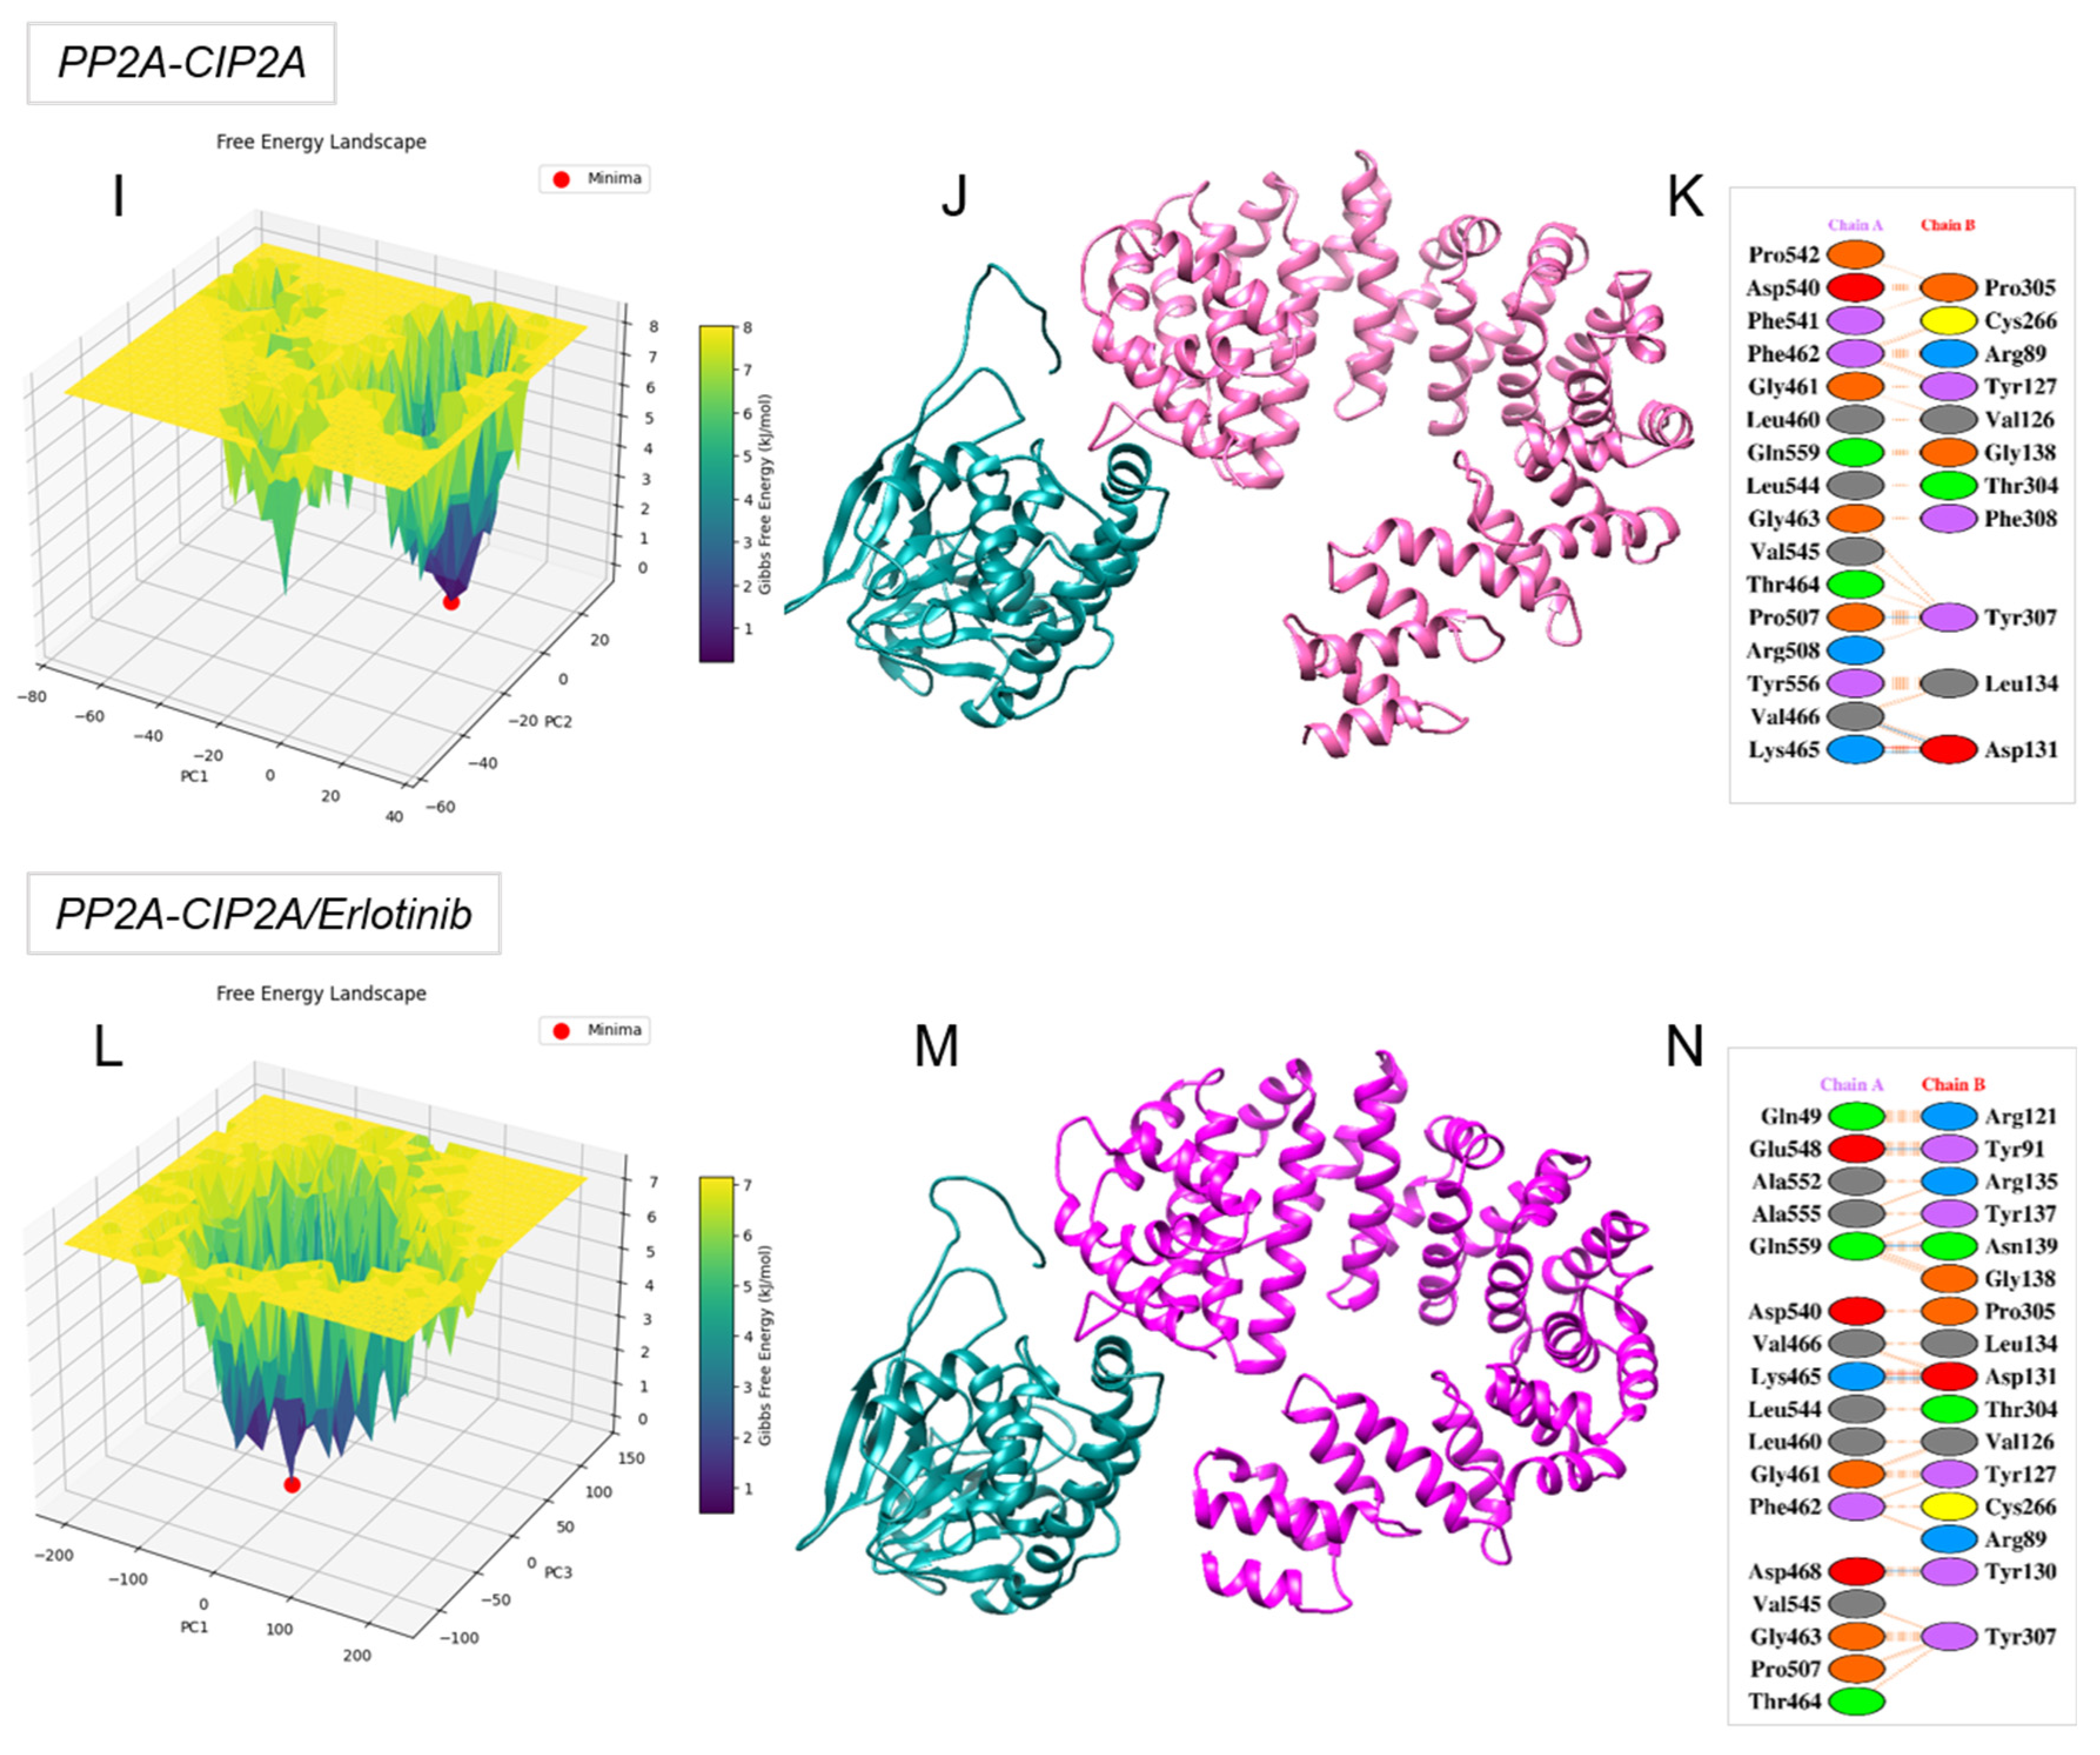
Subsequently, we examined the FEL to identify the lowest-energy conformations for the CIP2A–PP2A complex in the minimum energy state, which occurred at 34.35 ns (Figure 6I). This process revealed six contacts with the phosphorylated residue TYR307: one hydrogen bond with PRO507 and five hydrophobic interactions formed by GLY463, VAL545, THR464, PRO507, and ARG508 (Figure 6J,K). In comparison, the erlotinib–CIP2A–PP2A complex reached its energy minimum at 40.45 ns (Figure 6L), forming only four hydrophobic contacts with TYR307 through VAL545, GLY463, PRO507, and THR464 (Figure 6M,N). These findings suggest that erlotinib binding alters the structural conformation of CIP2A in a way that weakens its interaction with TYR307, potentially affecting its inhibitory engagement with PP2A.

2.6. The Restoration of Phosphatase Activity and Its Impact on Key Proteins Involved in BC Cell Motility

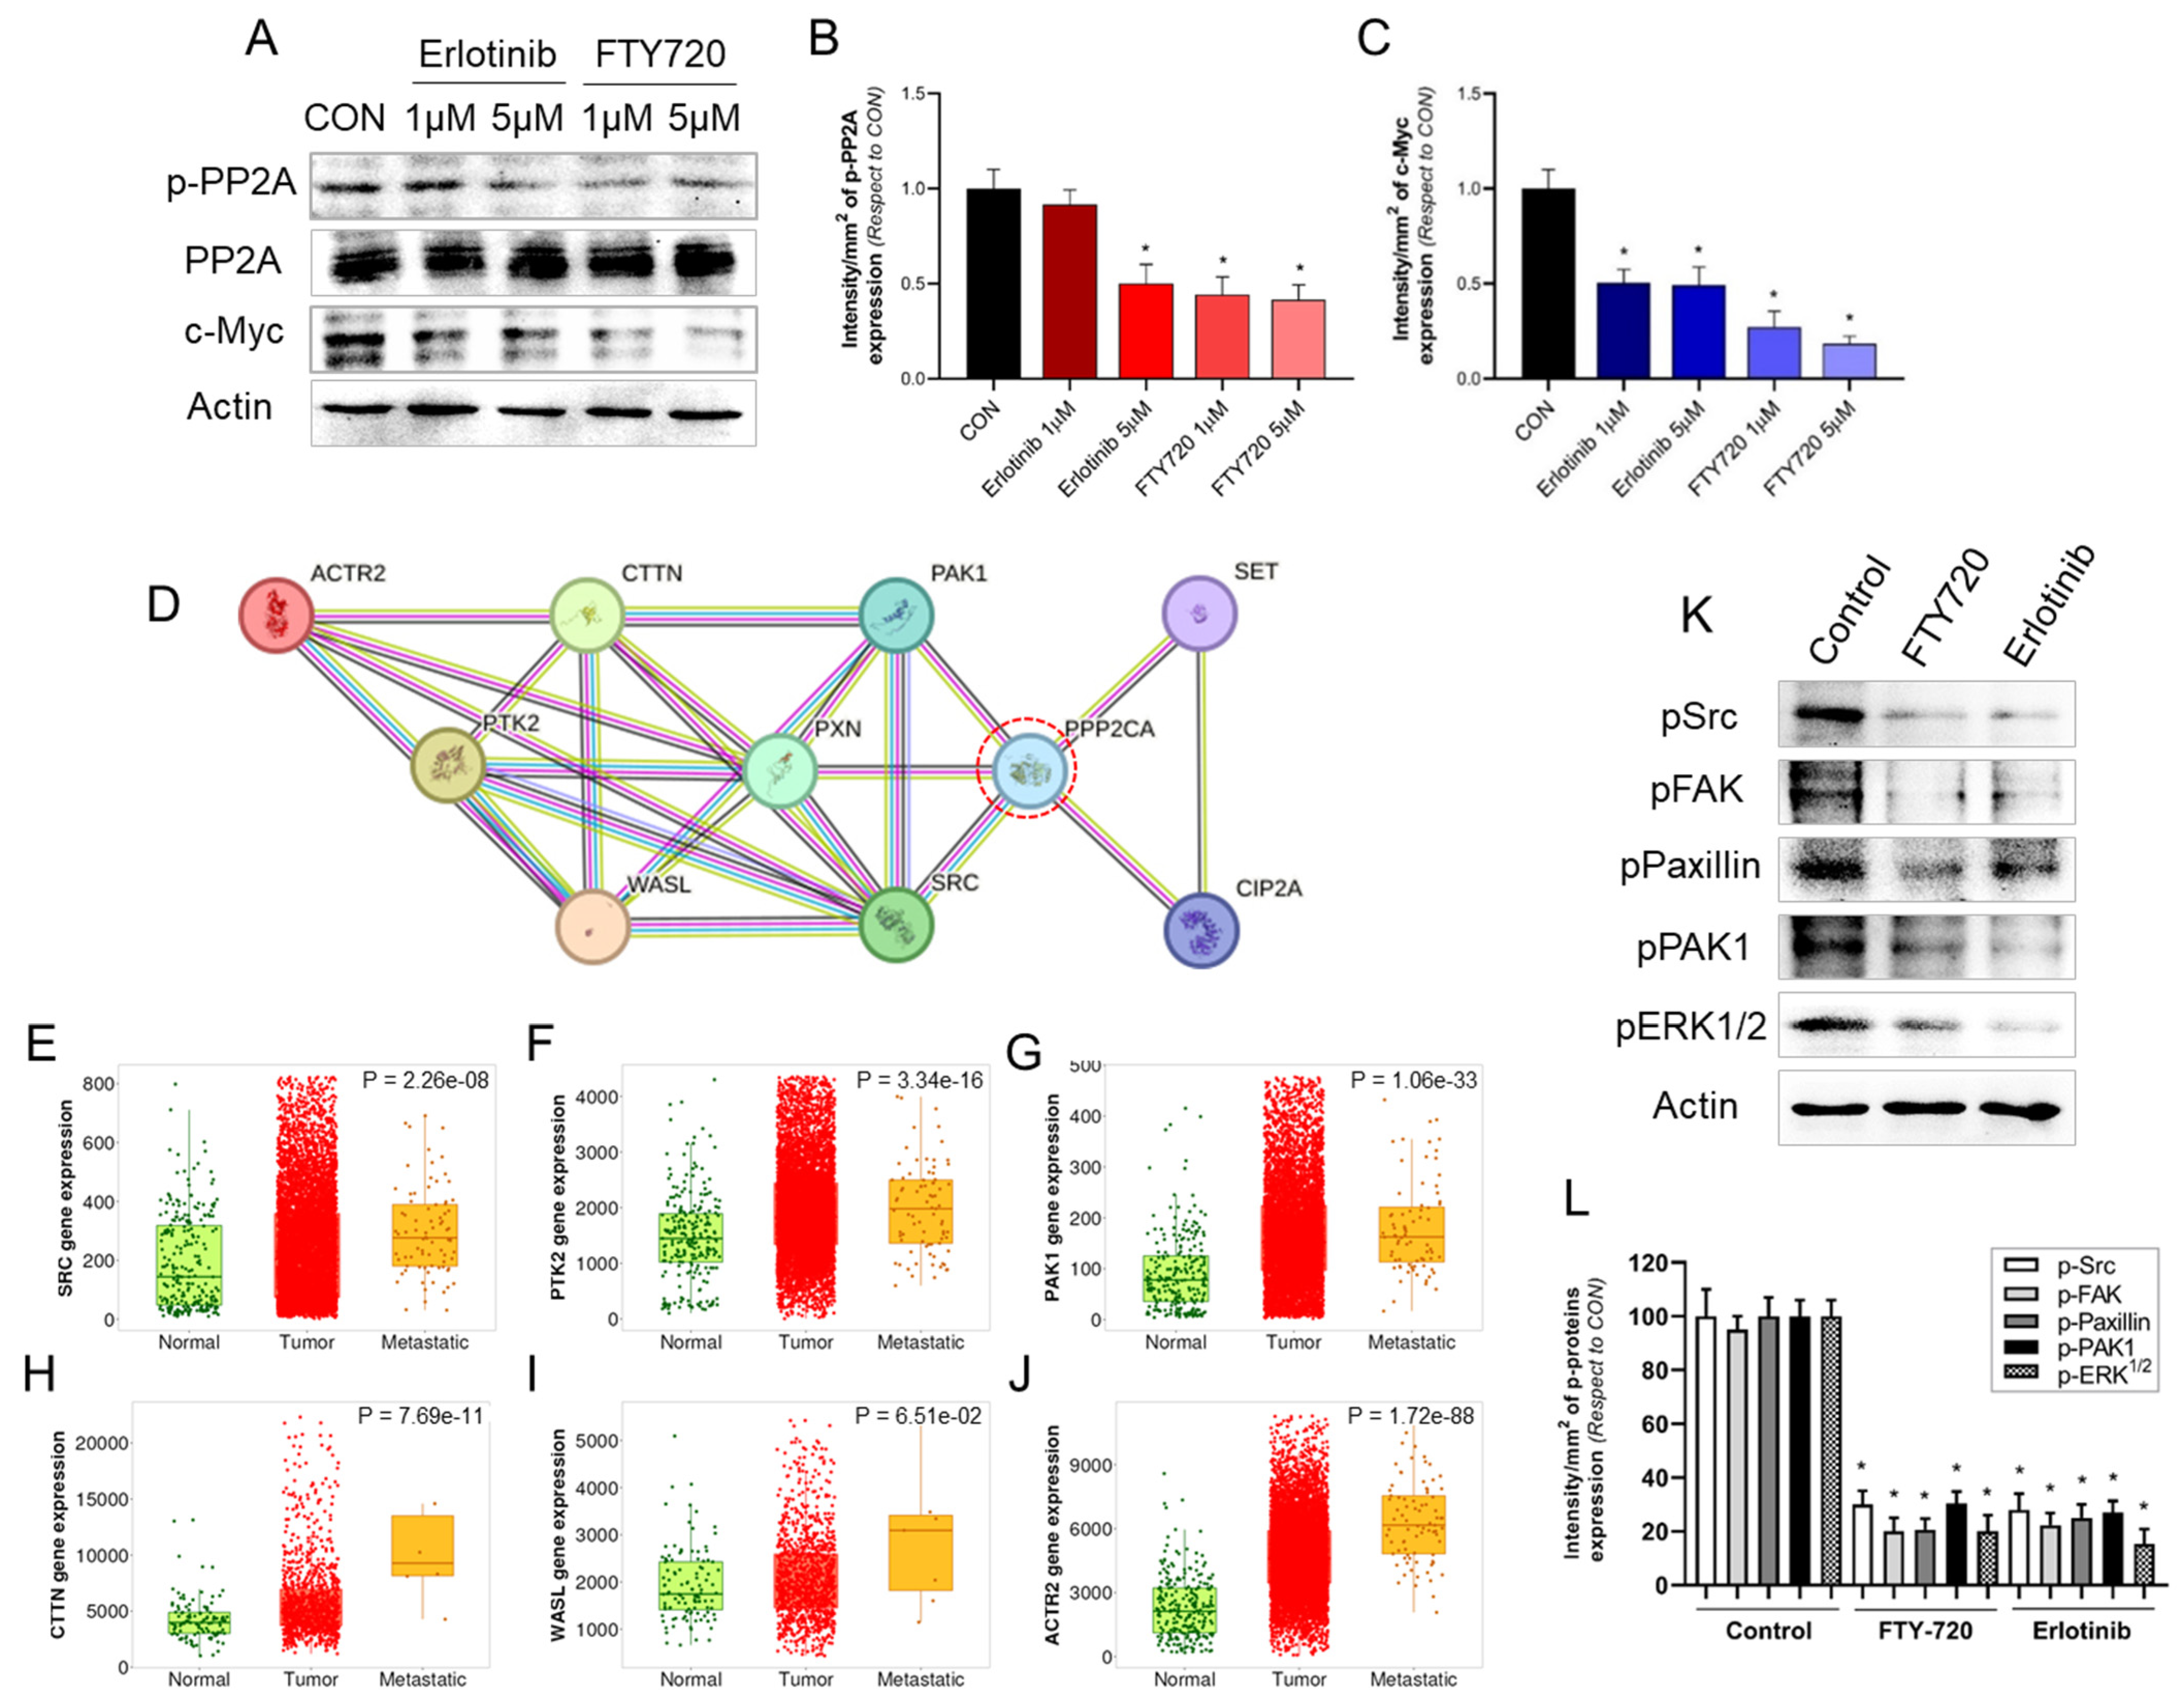
Finally, an in vitro assay was performed on human BC cells to investigate the effects of erlotinib and FTY-720 on the restoration of PP2A phosphatase activity by the inhibition of CIP2A and SET proteins. To this end, we employed Western blot assays to evaluate the expression levels of total PP2A and its phosphorylated, inactive form (p-PP2ATyr307) following 24 h of treatment with erlotinib and FTY-720 at 1 µM and 5 µM, respectively. Total PP2A levels remained stable across all treatment conditions, suggesting that these compounds do not alter the overall abundance of PP2A. Conversely, a significant reduction in p-PP2ATyr307 levels was observed with 5 µM of erlotinib and 1–5 µM FTY-720 (Figure 7A,B). The findings indicate that both compounds effectively reverse the inhibitory phosphorylation of PP2A, thereby facilitating its functional reactivation.
To determine the biological impact of PP2A reactivation, we analyzed the expression of c-Myc, the primary target protein of PP2A and a transcription factor fundamental to cell proliferation, metabolism, and tumorigenesis. c-Myc is frequently overexpressed in cancer and is post-translationally regulated by PP2A through dephosphorylation-induced destabilization and degradation [7,24]. Treatment with erlotinib and FTY-720 resulted in a considerable downregulation of c-Myc (Figure 7A–C), thereby validating the hypothesis that pharmacological reactivation of PP2A suppresses oncogenic signaling. These results highlight the therapeutic value of restoring PP2A activity to reestablish its tumor-suppressive function and impede cancer progression.
PP2A activity is modulated by treatment with FTY-720 and erlotinib, potentially through the downregulation of its endogenous inhibitors, CIP2A and SET. To explore the broader molecular context of this regulation, we employed the STRING database to construct a protein–protein interaction network, revealing functional associations between SET, CIP2A, PPP2CA, and key proteins involved in cell migration, invasion, and metastasis, including: SRC (Src), PXN (paxillin), PAK1 (PAK1), WASL (Wasl), PTK2 (FAK), CTTN (cortactin), and ACTR2 (Arp2 Complex) (Figure 7D). The interaction network analysis revealed that PPP2CA, the catalytic subunit of the serine/threonine phosphatase PP2A, acts as a central hub within the cytoskeletal signalling landscape. Notably, its interactions with the endogenous inhibitors SET and CIP2A highlight a potential mechanism of PP2A inactivation that could facilitate cytoskeletal reorganization and counteract migratory potential in tumor cells where PP2A is inactive. (Figure 7D). Collectively, these data establish PPP2CA as central to regulatory processes by integrating upstream signalling (via SRC, PXN, and PAK1) with cytoskeletal effectors, thereby indicating that dysregulation of PP2A activity may significantly impact the migratory machinery of BC cells.
To further explore the implications of these genes in BC progression, we analysed the expression levels of seven key genes: PPP2CA, SRC, PTK2, PAK1, CTTN, WASL, and ACTR2, in normal breast tissue, primary tumor, and metastases using RNA-seq datasets (Figure 7E–J). The analysis demonstrated that all genes were significantly upregulated in tumor and/or metastatic tissues relative to normal tissues, suggesting their potential involvement in tumor development and spread. Subsequently, the effect of FTY-720 and erlotinib on the activation/phosphorylation of proteins such as Src, FAK, paxillin, PAK1, and ERK1/2 in MDA-MB-231 cells was assessed by Western blot analysis. A marked reduction in the phosphorylation levels of Src, FAK, Paxillin, PAK1, and ERK1/2 (cell survival) was observed in both treatment groups, compared to the control group (Figure 7K,L).

2.7. Expression Levels of SET, KIAA1524, and PPP2CA as Predictive Markers of Recurrence and Metastasis

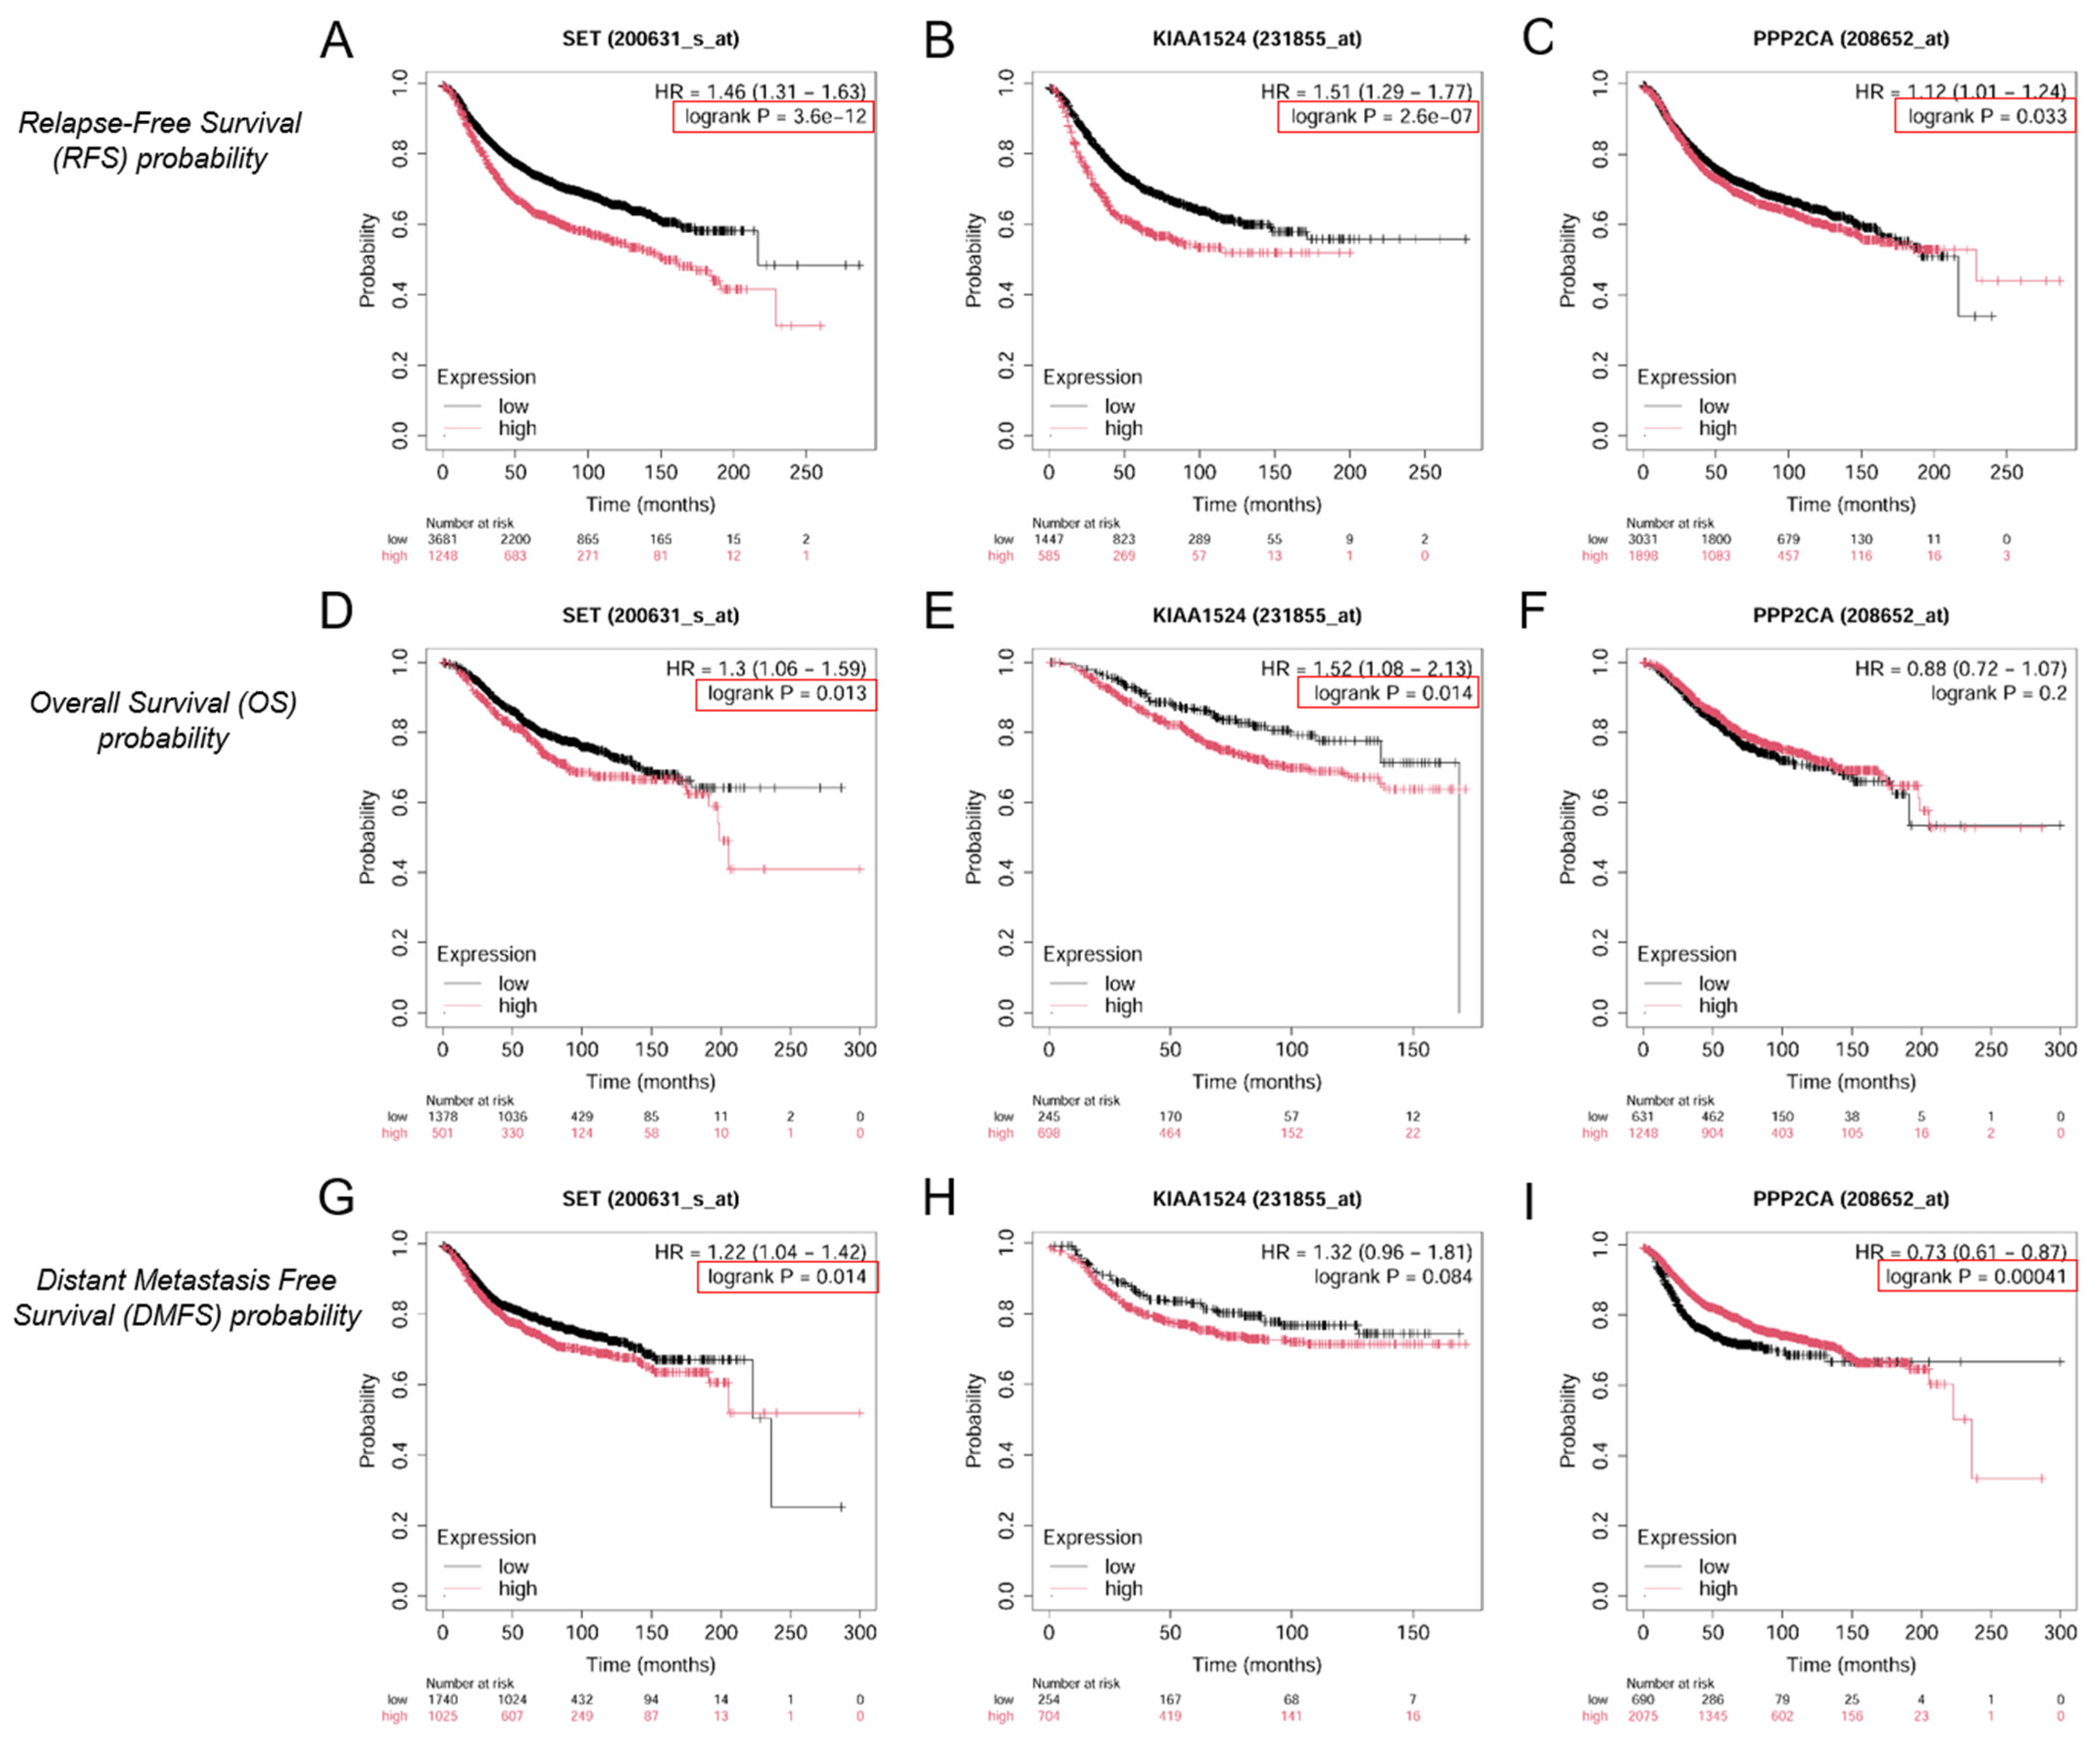
To gain further insights into the prognostic relevance of SET, KIAA1524 (CIP2A), and PPP2CA in BC, we analyzed their mRNA expression using the Kaplan–Meier Plotter, which integrates transcriptomic data and clinical outcomes across multiple BC cohorts. Given the intimate involvement of these genes in regulating the PP2A pathway, we evaluated their association with patient prognosis, including recurrence-free survival (RFS), distant metastasis-free survival (DMFS), and overall survival (OS) (Figure 8A–I).
The analysis revealed that high expression of SET (hazard ratio HR = 1.46; p = 3.6 × 10⁻¹²), KIAA1524 (HR = 1.51; p = 2.6 × 10⁻⁷, and PPP2CA (HR = 1.12; p = 0.033) was significantly associated with worse outcomes in terms of RFS (Figure 8A–C, marked in red), suggesting that increased activity of these genes may augmented the risk of disease recurrence. Furthermore, OS analysis showed that high expressions of SET (HR = 1.3; p = 0.013) and KIAA1524 (HR = 1.52; p = 0.014) were significantly associated with poorer prognosis (Figure 8D,E, marked in red). Finally, elevated mRNA levels of SET (HR = 1.22; p = 0.014) and diminished levels of PPP2CA (HR = 0.73; p = 0.00041) were found to be significantly associated with unfavorable DMFS outcomes (Figure 8G–I, marked in red), implying a potential role for these genes in metastatic dissemination. These findings suggest that elevated levels of SET and KIAA1524 (CIP2A) are associated with poorer prognosis, increased recurrence and metastatic risk, and higher mortality in BC patients, thereby reinforcing their value as prognostic biomarkers in BC and supporting their oncogenic roles as PP2A inhibitors.

3. Discussion

In the last decade, pharmacological reactivation of protein phosphatase 2A (PP2A) has emerged as a promising therapeutic strategy in cancer. PP2A functions as a tumor suppressor by negatively regulating multiple oncogenic signaling pathways, including those involved in cell proliferation, survival, and migration [8]. In many malignancies, PP2A activity is frequently suppressed through post-translational modifications and inhibitory protein–protein interactions mediated by endogenous regulators, such as SET and CIP2A [25,26].
Our transcriptomic analyses across normal, tumor, and metastasis tissues corroborate the dysregulation of the PP2A axis in cancer. Our results show that both SET and CIP2A exhibit significantly higher expression in tumors than in normal tissues across multiple cancer types, including BC. These findings are consistent with previous reports indicating that SET and CIP2A overexpressions are a frequent event in various malignancies, contributing to oncogenic signaling by suppressing PP2A activity [27,28]. Interestingly, we also observed increased expression of the PPP2CA gene, which encodes the catalytic subunit of PP2A, in several tumor types. Previous evidence indicates that, although PPP2CA levels are increased, PP2A activity may be suppressed due to elevated levels of its endogenous inhibitors [29,30]. This highlights the complexity of regulating this phosphatase in cancer [31]. Indeed, our Western blot analysis further substantiated these observations, demonstrating that TNBC cell lines exhibit elevated levels of both total wild-type PP2A protein and its Tyr307 phosphorylated inactive form. This post-translational modification is well established as a critical inhibitory mechanism that compromises PP2A catalytic function, thereby contributing to sustained oncogenic signaling. Accumulating evidence links elevated p-PP2A Tyr307 to increased tumor aggressiveness and unfavorable clinical outcomes in BC [18,32], reinforcing the rationale for targeting this regulatory axis.
Next, we confirmed significant overexpression of CIP2A, SET, and PPP2AC genes in tumor and metastatic breast tissue relative to normal controls, suggesting a previously underappreciated role for these regulatory networks in BC progression. These findings provide a strong rationale for targeting this axis as a novel pharmacological strategy in BC, complementing existing therapeutic approaches.
To elucidate the molecular mechanisms underlying PP2A reactivation, we performed structure-based molecular docking and molecular dynamics (MD) simulations to characterize the binding modes of FTY-720 and erlotinib to SET and CIP2A, respectively. Docking revealed distinct interaction paradigms for each ligand–target pair. Notably, the interaction profile of erlotinib with CIP2A revealed distinctive engagement of aromatic systems, in which π-π stacking, π-cation, and H-bond interactions mediated by the quinazoline core and surrounding residues (ARG43, CYS55, LEU79) were prominent.
These interactions defined a well-formed hydrophobic binding pocket that stabilized the ligand within the inhibitory protein. This is consistent with previous reports highlighting the importance of aromatic-driven interactions in stabilizing small molecule–oncoprotein complexes [33,34,35]. In contrast, the FTY-720–SET complex exhibited a binding mode predominantly stabilized by extensive hydrogen bonding, with LYS209 and ASP210 forming multiple strong polar interactions with the amino-diol moiety of FTY-720. These hydrogen bonds were complemented by secondary hydrophobic interactions involving aromatic residues such as PHE68, which engaged in stabilizing π-interactions with the benzene ring of FTY-720. This combination of polar and non-polar interactions suggests distinct binding paradigms for modulating CIP2A and SET inhibition, offering important implications for the rational design of next-generation PP2A activators [36,37,38].
Molecular dynamics simulations can provide valuable insights into the functional impact of ligand binding. In both complexes, ligand association reduced conformational mobility, as demonstrated by decreased RMSF fluctuations, more confined PCA motion spaces, and stabilization of low-energy conformations in the free-energy landscapes. However, the underlying mechanisms differed. FTY-720 has been shown to induce global rigidification and compaction of SET, thereby decreasing solvent accessibility and stabilizing a closed conformation. In contrast, erlotinib did not rigidify CIP2A uniformly, but redistributed flexibility towards peripheral regions while stabilizing the binding interface. The absence of persistent hydrogen bonds in the erlotinib–CIP2A trajectory indicates that its stability is entropically favored and driven mainly by hydrophobic packing rather than polar anchoring.
Additionally, SET and CIP2A interact strongly with phosphorylated Tyr307 of PP2A in the absence of ligands. Upon ligand binding, these contacts were markedly reduced. Free-energy minimum conformations demonstrated that FTY-720 eliminated the SET interaction with Tyr307, consistent with a physical displacement mechanism. Erlotinib weakened, but did not completely abolish CIP2A contacts, suggesting that the inhibitory complex was being destabilized, rather than being directly displaced. Consequently, the available data support two complementary pharmacological mechanisms for PP2A activation: (1) the inhibitor displacement (SET/FTY-720) and (2) interface destabilization (CIP2A/erlotinib). This distinction has direct implications for medicinal chemistry strategies targeting PP2A regulators.
Consistent with De Palma et al. (2019) [39], previously reported that FTY-720 serves as a potent activator of PP2A via SET inhibition. They described the mechanism by which FTY-720 activates PP2A, demonstrating that FTY-720 binds to SET and displaces PP2A, releasing it from inhibition and allowing a decrease in the specific phosphorylation in Tyr307, which also contributes to its activation [24]. However, the role of CIP2A in mediating Erlotinib-induced Tyr307 dephosphorylation is less established. In cancer cells, erlotinib induced a dose- and time-dependent decrease in CIP2A expression. This, in turn, has demonstrated the reactivation of PP2A phosphatase activity [40]. Our bioinformatics findings suggest that FTY-720-mediated inhibition of SET may achieve a more effective displacement from PP2A, resulting in greater restoration of phosphatase activity.
We next validated these computational insights in BC cellular models. Consistent with our structural predictions, both erlotinib and FTY-720 significantly reduced Tyr307 inhibitory phosphorylation of PP2A without altering total protein levels, indicating functional reactivation rather than changes in expression. The reactivation of PP2A was found to be more pronounced in response to FTY-720 than to erlotinib treatment. Furthermore, c-Myc expression was significantly downregulated following treatment with both compounds, consistent with PP2A reactivation and the suppression of downstream oncogenic signaling. In accordance, previous studies reported that inhibition of PP2A activity stabilizes several oncogenic signaling pathways, including c-Myc, Akt, and ERK [4,27,41]. Collectively, these results highlight that both FTY-720 and erlotinib hold potential as pharmacological PP2A activators by reducing its phosphorylation/inactivation. These insights offer a strong structural rationale for the prioritization of SET-targeting strategies, such as FTY-720, as a more potent and direct means of restoring PP2A tumor suppressor activity in BC.
In addition, our results provide new insights into the regulatory role of PP2A in controlling cytoskeletal dynamics and cell motility in BC. Using protein–protein interaction network analysis, we have identified the catalytic subunit of PP2A as a central hub linking signaling molecules, including SRC, PTK2, PXN, and PAK1, with cytoskeletal effectors involved in migration, invasion, and metastasis. This finding is consistent with previous evidence showing that PP2A regulates several components of the cytoskeletal machinery and cell adhesion complexes [5,30].
Importantly, our analysis across normal, tumor, and metastatic tissues revealed that PPP2CA, SRC, PTK2, PAK1, CTTN, WASL, and ACTR2 were significantly upregulated in tumorigenic and metastatic contexts. Previous studies demonstrated the overexpression of Src, FAK, PAK1, cortactin, WASP and Arp2/3 complex in invasive BC and their roles in promoting actin cytoskeleton reorganization and focal adhesion turnover, which ultimately leads to metastasis [21,42,43,44]. We then evaluated the ability of the PP2A activators, FTY-720 and erlotinib, to inhibit or dephosphorylate different fundamental kinases. Interestingly, FTY-720 and erlotinib reduced the phosphorylation and activation of Src, FAK, paxillin, PAK1, and ERK1/2. This suggests that FTY-720 and erlotinib could potentially reduce cell migration by inhibiting the kinases involved in cell motility.
Next, we analyzed genes involved in the regulation of the PP2A axis and their correlation with survival outcomes, highlighting their clinical relevance and prognostic value in BC. Specifically, elevated mRNA expression levels of the endogenous PP2A inhibitors SET and KIAA1524 (CIP2A) were consistently associated with worse survival outcomes, including reduced recurrence-free survival (RFS) and reduced overall survival (OS). These findings suggest that elevated SET, KIAA1524 (CIP2A) levels are associated with poorer prognosis and an increased risk of mortality and recurrence in BC patients. Other authors have reported that high CIP2A expression correlates with higher tumor grade, lymph node metastasis, and diminished overall and disease-free survival. Multivariate analyses confirm that elevated CIP2A is an independent prognostic factor for both overall survival and disease-free survival, and its overexpression is linked to an increased risk of recurrence and mortality in breast cancer cohorts [45,46,47]. Meta-analytic data further corroborated the correlation between CIP2A overexpression and unfavorable survival outcomes across solid tumors, including BC [32,48]. In addition, SET is overexpressed in all subtypes of invasive breast carcinoma and is enriched in circulating tumor cells, particularly in patients with recurrent or metastatic disease. The presence of high numbers of SET-expressing circulating tumor cells has been demonstrated to be associated with lymph node metastasis and recurrence, thereby supporting its role as a biomarker of malignant progression and metastatic potential [28].
Inhibition or inactivation of PP2A, whether through phosphorylation or overexpression of its endogenous inhibitors (SET and CIP2A), has been consistently associated with a poorer prognosis, greater tumor aggressiveness, chemotherapy resistance, and lower overall and disease-free survival. Conversely, restoring or activating PP2A has been linked to reduced tumor proliferation and an improved therapeutic response [26]. However, it is important to distinguish between the total PP2A expression and the phosphorylated/inactive form (p-PP2A). The most relevant study on p-PP2A overexpression in BC shows that increased levels of p-PP2A (the inactive form) are correlated with poorer overall survival, higher proliferation rates, and AKT activation. It is an independent prognostic factor for poor outcomes, especially in the triple-negative subtype [18]. Consequently, elevated levels of functional (active) PP2A are associated with a more favorable prognosis, while the expression of the inactive form (p-PP2A) is associated with an unfavorable prognosis. Together, our findings highlight the prognostic importance of SET, KIAA1524, and PPP2CA in breast cancer and corroborate previous reports implicating that deregulation of the PP2A axis promotes tumor aggressiveness and resistance to treatment. Notably, both SET and CIP2A have been proposed as potential therapeutic targets, with the pharmacological restoration of PP2A activity emerging as a promising strategy in the treatment of BC. In this context, our findings demonstrate that the indirect reactivation of PP2A, achieved through the pharmacological inhibition of its endogenous inhibitors, CIP2A and SET, restores PP2A’s catalytic function and triggers downstream regulatory effects on critical signaling pathways. This reactivation inhibits multiple pathways essential for tumor progression: it suppresses cell motility effectors (Src, FAK, PAK1, and paxillin) and proliferation mediators (ERK1/2 and c-Myc).
Collectively, our findings provide an integrated view of the central role of PP2A dysregulation in breast cancer development and progression, linking molecular alterations, structural mechanisms, and functional outcomes. The combination of transcriptomic, structural, and cellular data supports a model in which overexpression of the endogenous inhibitors SET and CIP2A, together with inhibitory phosphorylation of PP2A, functionally blocks its tumor-suppressive activity despite maintained or even elevated PPP2CA expression. This imbalance promotes sustained activation of oncogenic signaling pathways that drive proliferation, survival, and metastatic dissemination. Importantly, our results demonstrate that pharmacological targeting of this regulatory axis with agents such as FTY-720 and erlotinib restores PP2A activity via complementary mechanisms—either by displacing inhibitory complexes or by destabilizing protein–protein interactions—thereby reprogramming downstream signaling networks. This reactivation translates into the coordinated attenuation of kinase-driven pathways controlling cytoskeletal remodeling, focal adhesion dynamics, and cell motility (Src, FAK, PAK1, paxillin), as well as proliferation and therapeutic resistance (ERK1/2 and c-Myc), ultimately impairing the cellular processes that underlie tumor invasion and metastasis. From a clinical perspective, the strong association between elevated SET and CIP2A expression and poor patient outcomes further highlights the prognostic and therapeutic relevance of this axis. Altogether, these findings position PP2A reactivation as a mechanistically grounded phosphatase–kinase switch capable of restraining breast cancer progression and support its exploitation as a targeted strategy to limit metastatic disease.

4. Materials and Methods

4.1. Bioinformatics Analysis

-Gene expression analysis: all analyses were conducted utilizing the R version 4.1.3 software (http://www.r-project.org/ accessed on 1 October 2021) in a Windows environment, employing a computer with an Intel Core i7 processor and 32GB of RAM.

4.2. Differential Gene Expression Analysis in Different Breast Cancer Subtypes

-Data acquisition: two microarray gene expression datasets (GSE70884 and GSE68651) were programmatically downloaded from the Gene Expression Omnibus database (accessed in May 2025), using the R GEOquery package [49]. The initial datasets (GSE70884) were composed of three replicates of seven breast cancer cell lines (MCF7, T47D, ZR75.1, BT474, SKBR3, MDA.MB.468, and MDA.MB.231), representative of each BC subtype (luminal A, luminal B, HER2-enriched, and Basal-like). GSE68651 comprised three replicates of the non-tumorigenic epithelial breast cell line MCF-10A. To ensure comparability between datasets, batch effects were corrected using the ComBat function from the SVA package [50,51]. Subsequently, a log2 transformation was applied to the expression values to derive the expression matrix, which will be used as the foundation for subsequent expression profiling and differential gene expression analysis.
-Heatmap construction: from this matrix, eight cell lines (MCF-10A, T-47D, MCF-7, ZR-75-1, BT-474, SK-BR-3, MDA-MB-468, and MDA-MB-231) and a panel of sixteen genes were selected for detailed analysis. The selection comprised three genes encoding PP2A-related proteins (PPP2CA, SET, and KIAA1524) and thirteen genes associated with migration, invasion, and metastasis-related processes (MMP2, ACTR2, MSN, VIM, CDH1, CTTN, PTK2, PXN, ROCK2, SRC, MMP9, and WASL). A z-score was calculated for each gene to visualize the differences in gene expression patterns between each cell line. The columns were sorted based on a hierarchical cluster with an average.
-TNMplot.com analysis platform: we used the TNMplot tool (available at http://tnmplot.com/analysis/; accessed on 1 May 2025) [52], a platform that enables the analysis of gene expression and the evaluation of the predictive value of genes across multiple cancer types.
-Pan-cancer analysis: using TNMplot, we performed a pan-cancer analysis comparing gene expression between normal and tumor samples across 6 different tissue types, including breast, colon, liver, ovary, pancreas, and prostate. This analysis focused on the differential expression of SET, CIP2A, and PPP2CA across distinct cancer types. Significant differences in expression levels between cancerous and normal tissues were assessed using the Mann–Whitney U test, with statistically significant results highlighted in red (* p < 0.05).
-Comparison of gene expression: We performed a comparative RNA-seq-based analysis of gene expression in normal, tumor, and metastatic breast tissues using the TNMplot platform (accessed in May 2025). This comprehensive approach enabled the evaluation of the expression of key genes of interest: KIAA1524 (CIP2A), SET, PPP2CA (PP2A catalytic subunit), SRC, PTK2 (FAK), PAK1, CTTN (Cortactin), WASL, and ACTR2 (Arp2 subunit), thus facilitating the identification of significant differences associated with tumor progression and metastatic potential.

4.3. Molecular Modeling

-Ligand Preparation: Erlotinib and FTY-720 drugs were designed using ChemBioDraw 18.1 and Chem3D 18.1, and minimized their energies with MMFF94. We saved the structures in .mol2 format for compatibility with AutoDock. The ligands were prepared by adding polar hydrogen atoms and identifying the number of rotatable bonds. Finally, we converted the ligands to .pdbqt format using MGL Tools 1.5.6 (The Scripps Research Institute, La Jolla, CA, USA).
-Protein Preparation. We obtained the crystal structures of CIP2A and SET proteins from the Protein Data Bank (PDB). For CIP2A, we selected the PDB ID 5UFL structure, and for SET, we chose PDB ID 2E50. The proteins were then prepared for molecular docking analysis using MGL Tools 1.5.6. This preparation involved removing water molecules and co-crystallized ligands, merging nonpolar hydrogen atoms, assigning AD4.2 and Kollman-type charges, and saving the proteins in pdbqt format.
-Identification and Phosphorylation of PP2A Protein Residues.
The PP2A protein was sourced from PDB, selecting the crystal structure with the PDB code 2IAE at a resolution of 3.50 Å [11]. Subsequently, the protein underwent preparation steps involving the removal of water molecules and co-crystallized ligands, facilitated by the freely available software UCSF Chimera 1.15. Following this preparation, we used the software to determine the precise locations of key amino acid residues involved in the regulatory process. After locating these sites, we identified the residues of interest, which were then phosphorylated using the online-accessible software CHARMM-GUI v.2 [53].
-Docking studies pharmaco-protein. Molecular docking simulations were conducted using AutoDock 4.2 to identify the lowest-energy conformations of the ligand-protein complexes. Grid box parameters were carefully defined for each target protein to ensure accurate sampling of the active binding sites (Table 1).
The resulting docked complexes were subsequently analyzed and visualized using MGL Tools 1.5.6, UCSF Chimera, and Discovery Studio 4.0.
-Docking studies protein–protein. Protein–protein docking studies (CIP2A-PP2A and SET-PP2A) were conducted using the pyDockWEB server [54], which utilizes rigid-body docking with electrostatic and solvation scoring functions. The resulting protein complexes were analyzed using the PDBSum protein interaction predictor (European Bioinformatics Institute, EMBL-EBI, Hinxton, UK) and UCSF Chimera software [55].
-Molecular Dynamics studies. Molecular dynamics (MD) simulations of both protein–ligand and protein–protein complexes were performed using GROMACS 2020.6. Input files were prepared through the CHARMM-GUI platform [53], employing the CHARMM36m force field for proteins and ions and the TIP3P model for water molecules. To ensure system stability, energy minimization was carried out using the steepest descent algorithm for 5000 steps. The system was then equilibrated through two phases: firstly, under constant volume and temperature (NVT ensemble) at 300.15 K for 100 ps, followed by constant pressure and temperature (NPT ensemble) at 300.15 K and 1 atm for an additional 100 ps. Subsequently, unrestrained MD production runs were conducted for 100 ns (100,000 ps), during which positional restraints applied to ligands, heavy atoms, and protein backbones were released. The Verlet cutoff scheme was used with a grid spacing and nstlist of 10; electrostatic and van der Waals interactions were truncated at 1.0 nm. Energies and log files were saved every 10 ps. A total of 50 million steps were simulated.
-Simulation analysis. This strategy facilitated the evaluation of multiple descriptors associated with structural stability and conformational dynamics in the FTY-720–SET and erlotinib–CIP2A complexes, allowing the identification of the most stable conformational states and the detailed mapping of energy minima. All graphical representations were created using QtGrace v0.2.6. The root mean square deviation (RMSD) was utilized to track global structural changes over time [56], while the root mean square fluctuation (RMSF) was employed to measure residue-level flexibility [57]. The radius of gyration (Rg) provided insight into the overall compactness of the protein structures [58], while hydrogen bond analysis revealed the consistency and strength of intermolecular interactions. The solvent-accessible surface area (SASA) was analyzed to determine changes in molecular exposure to the solvent, reflecting shifts in structure or binding [59]. Additionally, principal component analysis (PCA) identified the principal conformational motions of the system [60], and free energy landscape (FEL) mapping allowed the identification of the most stable, low-energy states. When considered as a whole, these parameters offer a comprehensive dynamic perspective of complex stability that extends beyond static representations of coupling [61]. The calculation of root-mean-square deviation (RMSD), root-mean-square fluctuation (RMSF), and radius of gyration (Rg) was performed using gmx rms, gmx rmsf, and gmx gyrate, respectively. Principal component analysis (PCA) was also performed to capture the dominant motions of the complexes by diagonalizing the covariance matrix of atomic fluctuations. The free energy landscape (FEL) was generated using the principal components required to explain more than 50% of the total variance in system dynamics, following the approach described by Barraza et. al., 2024 [62].

4.4. Cell Culture and Treatments

The human breast cancer cell lines BT-474 (ER+/PR+/HER2+), SK-BR3 (ER/PR/HER2+), T-47D (ER+/PR+/HER2), MCF-7 (ER+/PR+/HER2), MDA-MB-231 (ER/PR/HER2), and MDA-MB-468 (ER/PR/HER2) and the human breast non-tumorigenic epithelial cell line MCF-10A (ER/PR/HER2), were obtained from the American Type Culture Collection (ATCC, Rockville, MD, USA). BT-474, SK-BR3, MDA-MB-231, MDA-MB-468, and MCF-7 were cultured in high-glucose Dulbecco’s Modified Eagle Medium (DMEM; Gibco) supplemented with 10% fetal bovine serum (FBS; Gibco, Invitrogen, Argentina), sodium bicarbonate, 100 U/mL penicillin, and 100 μg/mL streptomycin. T-47D cells were maintained in RPMI-1640 medium supplemented with 2 mM L-glutamine, 10% FBS, and antibiotics (penicillin/streptomycin). MCF-10A cells were maintained in Dulbecco’s modified Eagle medium/Ham F12 (DMEM/F12) supplemented with 10% FBS, 5 μg/mL insulin, 0.5 μg/mL hydrocortisone, 20 ng/mL epidermal growth factor (EGF; Sigma-Aldrich, CA, USA), and antibiotics. The BC cell lines were maintained at 37 °C in an incubator with 5% CO2. Before the treatments, BC cells were kept for 8–12 h in medium containing steroid-deprived FBS. Erlotinib (sc-396113, Santa Cruz Biotechnology, CA, USA) was dissolved in dimethyl sulfoxide (DMSO). EMULIMOD® (FTY-720, Fingolimod), prepared in sterile and apyrogenic water, was obtained from Laboratorio Varifarma S.A. (Beccar, Buenos Aires, Argentina). Whenever an inhibitor was used, were performed under reduced room light conditions. All experiments were performed in triplicate, and representative images are shown.

4.5. Immunoblotting

Total protein extracts from homogenized BC cell lines were separated by SDS-PAGE using 8–12% polyacrylamide gels and subsequently transferred onto polyvinylidene difluoride (PVDF) membranes. Membranes were blocked with 1% bovine serum albumin (BSA) in TBS-T for 30 min at room temperature. Antibodies used were: PP2A (sc-13601), p-PP2A (sc-12615), p-Src (sc-101802), p-paxillin (sc-365020), p-PAK1 (sc-166897), c-Myc (sc-40), and actin (sc-1615) from Santa Cruz Biotechnology; p-FAK (BD-611807) was obtained from BD Transduction Laboratories (CA, USA); and p-ERK1/ERK2 (36-8800) from Invitrogen. Primary and HRP-conjugated secondary antibodies were incubated according to standard protocols. Protein bands were detected using enhanced chemiluminescence and visualized with a Chemidoc XRS system (Bio-Rad, Hercules, CA, USA) equipped with Image Lab software (version 6.1). Densitometric analysis of protein bands was performed using ImageJ software (version 1.54r).

5. Conclusions

In summary, our study combined computational and experimental approaches to investigate the molecular mechanisms involved in PP2A inactivation in breast cancer, focusing on the endogenous inhibitors SET and CIP2A. We demonstrated that Tyr307 phosphorylation, together with elevated expression of SET and CIP2A, contributes to PP2A suppression and is associated with aggressive tumor phenotypes and metastatic progression.
Our analyses revealed that pharmacological targeting of this axis, particularly through FTY-720, effectively disrupted the SET–PP2A interaction, restored PP2A activity, reduced c-Myc expression, and inhibited key oncogenic pathways associated with cell migration, invasion, proliferation, and survival, including Src/FAK/paxillin/PAK1 and ERK signaling. Erlotinib also modulated the CIP2A–PP2A complex, although with a comparatively weaker effect. Overall, these findings highlight the SET/CIP2A–PP2A axis as a promising therapeutic target in breast cancer and support PP2A reactivation as a potential strategy to counteract tumor progression, particularly in aggressive breast cancer subtypes.

Author Contributions

G.A.B.: Conceptualization, Methodology, Formal analysis, Molecular docking and Molecular dynamics, Data curation, and Writing—Original Draft; J.M.M.: Conceptualization, Methodology, Validation of in vitro experiments, Genetic data analysis, Formal Writing, and Formal Analysis; J.M.F.M.: Software, Genetic data analysis, Data curation; B.M.V.: Investigation, Software, and Data curation; M.I.F.: Supervision, Project management, Resources, Clinical aspects, Writing—Review & Editing, Funding acquisition; A.M.S.: Central idea, Supervision, Project administration, Resources, Clinical aspects, Writing—Review & Editing, Funding acquisition. All authors have read and agreed to the published version of the manuscript.

Funding

This research was funded by Agencia Nacional de Promoción Científica y Tecnológica PICT-2020-0512 to F.M.I. and PICT-2021-0213 to A.M.S., Consejo Nacional de Investigaciones Científicas y Técnicas (CONICET) (11220210100720CO) PIP 2022-2024 to M.I.F. & A.M.S.

Institutional Review Board Statement

Not applicable.

Informed Consent Statement

Not applicable.

Data Availability Statement

The original contributions presented in the study are included in the article. Further inquiries can be directed to the corresponding author/s.

Acknowledgments

The results presented in this work were obtained using the facilities of the CCT-Rosario Computational Center, a member of the High-Performance Computing National System (SNCAD, MincyT, Argentina).

Conflicts of Interest

The authors declare no conflicts of interest.

Abbreviations

The following abbreviations are used in this manuscript:
ACTR2Actin Related Protein 2
AKTProtein Kinase B
Arp2/3Actin-Related Protein 2/3 Complex
BCBreast Cancer
CIP2ACancerous Inhibitor of PP2A
CTTNCortactin
DMFSDistant Metastasis-Free Survival
EREstrogen Receptor
ERK1/2Extracellular Signal-Regulated Kinases 1/2
FAK/PTK2Focal Adhesion Kinase/Protein Tyrosine Kinase 2
FELFree Energy Landscape
FTY-720Fingolimod
GEOGene Expression Omnibus
GROMACSGROningen MAchine for Chemical Simulations
H-bondHydrogen Bond
HER2Human Epidermal Growth Factor Receptor 2
KIAA1524Gene encoding CIP2A
MDMolecular Dynamics
NPTConstant Number of Particles, Pressure, and Temperature Ensemble
NVTConstant Number of Particles, Volume, and Temperature Ensemble
OSOverall Survival
PAK1p21-Activated Kinase 1
PCAPrincipal Component Analysis
PDBProtein Data Bank
PPP2CA/PPP2ACProtein Phosphatase 2 Catalytic Subunit Alpha
PP2AProtein Phosphatase 2A
PRProgesterone Receptor
p-PP2ATyr307Phosphorylated PP2A at Tyrosine 307
RFSRecurrence-Free Survival
RgRadius of Gyration
RMSDRoot Mean Square Deviation
RMSFRoot Mean Square Fluctuation
RNA-seqRNA Sequencing
SASASolvent-Accessible Surface Area
SETSET Nuclear Proto-Oncogene
SETBP1SET Binding Protein 1
Src/SRCProto-Oncogene Tyrosine-Protein Kinase Src
TNBCTriple-Negative Breast Cancer
WASL/WASPWiskott–Aldrich Syndrome Protein Like/Wiskott–Aldrich Syndrome Protein

References

  1. Anderson, B.O.; Ilbawi, A.M.; Fidarova, E.; Weiderpass, E.; Stevens, L.; Abdel-Wahab, M.; Mikkelsen, B. The Global Breast Cancer Initiative: A strategic collaboration to strengthen health care for non-communicable diseases. Lancet Oncol. 2021, 22, 578–581. [Google Scholar] [CrossRef]
  2. Chang-Qing, Y.; Jie, L.; Shi-Qi, Z.; Kun, Z.; Zi-Qian, G.; Ran, X.; Hui-Meng, L.; Ren-Bin, Z.; Gang, Z.; Da-Chuan, Y.; et al. Recent treatment progress of triple negative breast cancer. Prog. Biophys. Mol. Biol. 2020, 151, 40–53. [Google Scholar] [CrossRef]
  3. Brautigan, D.L.; Farrington, C.; Narla, G. Targeting protein phosphatase PP2A for cancer therapy: Development of allosteric pharmaceutical agents. Clin. Sci. 2021, 135, 1545–1556. [Google Scholar] [CrossRef]
  4. Qi, Y.; Li, L.; Wei, Y.; Ma, F. PP2A as a potential therapeutic target for breast cancer: Current insights and future perspectives. Biomed. Pharmacother. 2024, 173, 116398. [Google Scholar] [CrossRef]
  5. Basu, S. PP2A in the regulation of cell motility and invasion. Curr. Protein Pept. Sci. 2011, 12, 3–11. [Google Scholar] [CrossRef] [PubMed]
  6. Wlodarchak, N.; Xing, Y. PP2A as a master regulator of the cell cycle. Crit. Rev. Biochem. Mol. Biol. 2016, 51, 162–184. [Google Scholar] [CrossRef]
  7. Farrington, C.C.; Yuan, E.; Mazhar, S.; Izadmehr, S.; Hurst, L.; Allen-Petersen, B.L.; Janghorban, M.; Chung, E.; Wolczanski, G.; Galsky, M.; et al. Protein phosphatase 2A activation as a therapeutic strategy for managing MYC-driven cancers. J. Biol. Chem. 2020, 295, 757–770. [Google Scholar] [CrossRef]
  8. Mazhar, S.; Taylor, S.E.; Sangodkar, J.; Narla, G. Targeting PP2A in cancer: Combination therapies. Biochim. Biophys. Acta Mol. Cell Res. 2019, 1866, 51–63. [Google Scholar] [CrossRef] [PubMed]
  9. Shortrede, J.E.; Uzair, I.D.; Neira, F.J.; Flamini, M.I.; Sanchez, A.M. Paxillin, a novel controller in the signaling of estrogen to FAK/N-WASP/Arp2/3 complex in breast cancer cells. Mol. Cell. Endocrinol. 2016, 430, 56–67. [Google Scholar] [CrossRef] [PubMed]
  10. Perrotti, D.; Neviani, P. Protein phosphatase 2A: A target for anticancer therapy. Lancet Oncol. 2013, 14, e229–e238. [Google Scholar] [CrossRef]
  11. Cho, U.S.; Xu, W. Crystal structure of a protein phosphatase 2A heterotrimeric holoenzyme. Nature 2007, 445, 53–57. [Google Scholar] [CrossRef]
  12. Fujiki, H.; Sueoka, E.; Watanabe, T.; Komori, A.; Suganuma, M. Cancer progression by the okadaic acid class of tumor promoters and endogenous protein inhibitors of PP2A, SET and CIP2A. J. Cancer Res. Clin. Oncol. 2023, 149, 9425–9433. [Google Scholar] [CrossRef] [PubMed]
  13. Kiely, M.; Kiely, P.A. PP2A: The Wolf in Sheep’s Clothing? Cancers 2015, 7, 648–669. [Google Scholar] [CrossRef]
  14. Puustinen, P.; Jaattela, M. KIAA1524/CIP2A promotes cancer growth by coordinating the activities of MTORC1 and MYC. Autophagy 2014, 10, 1352–1354. [Google Scholar] [CrossRef]
  15. White, C.; Alshaker, H.; Cooper, C.; Winkler, M.; Pchejetski, D. The emerging role of FTY720 (Fingolimod) in cancer treatment. Oncotarget 2016, 7, 23106–23127. [Google Scholar] [CrossRef] [PubMed]
  16. Chen, K.F.; Pao, K.C.; Su, J.C.; Chou, Y.C.; Liu, C.Y.; Chen, H.J.; Huang, J.W.; Kim, I.; Shiau, C.W. Development of erlotinib derivatives as CIP2A-ablating agents independent of EGFR activity. Bioorg. Med. Chem. 2012, 20, 6144–6153. [Google Scholar] [CrossRef]
  17. Yu, H.C.; Hung, M.H.; Chen, Y.L.; Chu, P.Y.; Wang, C.Y.; Chao, T.T.; Liu, C.Y.; Shiau, C.W.; Chen, K.F. Erlotinib derivative inhibits hepatocellular carcinoma by targeting CIP2A to reactivate protein phosphatase 2A. Cell Death Dis. 2014, 5, e1359. [Google Scholar] [CrossRef]
  18. Chen, P.M.; Chu, P.Y.; Tung, S.L.; Liu, C.Y.; Tsai, Y.F.; Lin, Y.S.; Wang, W.L.; Wang, Y.L.; Lien, P.J.; Chao, T.C.; et al. Overexpression of phosphoprotein phosphatase 2A predicts worse prognosis in patients with breast cancer: A 15-year follow-up. Hum. Pathol. 2017, 66, 93–100. [Google Scholar] [CrossRef] [PubMed]
  19. Merisaari, J.; Denisova, O.V.; Doroszko, M.; Le Joncour, V.; Johansson, P.; Leenders, W.P.J.; Kastrinsky, D.B.; Zaware, N.; Narla, G.; Laakkonen, P.; et al. Monotherapy efficacy of blood-brain barrier permeable small molecule reactivators of protein phosphatase 2A in glioblastoma. Brain Commun. 2020, 2, fcaa002. [Google Scholar] [CrossRef]
  20. Fujiki, H.; Sueoka, E.; Watanabe, T.; Suganuma, M. The concept of the okadaic acid class of tumor promoters is revived in endogenous protein inhibitors of protein phosphatase 2A, SET and CIP2A, in human cancers. J. Cancer Res. Clin. Oncol. 2018, 144, 2339–2349. [Google Scholar] [CrossRef]
  21. Mondaca, J.M.; Uzair, I.D.; Castro Guijarro, A.C.; Flamini, M.I.; Sanchez, A.M. Molecular Basis of LH Action on Breast Cancer Cell Migration and Invasion via Kinase and Scaffold Proteins. Front. Cell Dev. Biol. 2020, 8, 630147. [Google Scholar] [CrossRef] [PubMed]
  22. Kauko, O.; Imanishi, S.Y.; Kulesskiy, E.; Yetukuri, L.; Laajala, T.D.; Sharma, M.; Pavic, K.; Aakula, A.; Rupp, C.; Jumppanen, M.; et al. Phosphoproteome and drug-response effects mediated by the three protein phosphatase 2A inhibitor proteins CIP2A, SET, and PME-1. J. Biol. Chem. 2020, 295, 4194–4211. [Google Scholar] [CrossRef]
  23. Zonta, F.; Pagano, M.A.; Trentin, L.; Tibaldi, E.; Frezzato, F.; Trimarco, V.; Facco, M.; Zagotto, G.; Pavan, V.; Ribaudo, G.; et al. Lyn sustains oncogenic signaling in chronic lymphocytic leukemia by strengthening SET-mediated inhibition of PP2A. Blood 2015, 125, 3747–3755. [Google Scholar] [CrossRef]
  24. Janghorban, M.; Farrell, A.S.; Allen-Petersen, B.L.; Pelz, C.; Daniel, C.J.; Oddo, J.; Langer, E.M.; Christensen, D.J.; Sears, R.C. Targeting c-MYC by antagonizing PP2A inhibitors in breast cancer. Proc. Natl. Acad. Sci. USA 2014, 111, 9157–9162. [Google Scholar] [CrossRef]
  25. Kauko, O.; Westermarck, J. Non-genomic mechanisms of protein phosphatase 2A (PP2A) regulation in cancer. Int. J. Biochem. Cell Biol. 2018, 96, 157–164. [Google Scholar] [CrossRef]
  26. Rincon, R.; Cristobal, I.; Zazo, S.; Arpi, O.; Menendez, S.; Manso, R.; Lluch, A.; Eroles, P.; Rovira, A.; Albanell, J.; et al. PP2A inhibition determines poor outcome and doxorubicin resistance in early breast cancer and its activation shows promising therapeutic effects. Oncotarget 2015, 6, 4299–4314. [Google Scholar] [CrossRef]
  27. Liu, C.Y.; Huang, T.T.; Chen, Y.T.; Chen, J.L.; Chu, P.Y.; Huang, C.T.; Wang, W.L.; Lau, K.Y.; Dai, M.S.; Shiau, C.W.; et al. Targeting SET to restore PP2A activity disrupts an oncogenic CIP2A-feedforward loop and impairs triple negative breast cancer progression. eBioMedicine 2019, 40, 263–275. [Google Scholar] [CrossRef]
  28. Tozuka, K.; Wongsirisin, P.; Nagai, S.E.; Kobayashi, Y.; Kanno, M.; Kubo, K.; Takai, K.; Inoue, K.; Matsumoto, H.; Shimizu, Y.; et al. Deregulation of protein phosphatase 2A inhibitor SET is associated with malignant progression in breast cancer. Sci. Rep. 2021, 11, 14238. [Google Scholar] [CrossRef]
  29. Johnson, H.; Narayan, S.; Sharma, A.K. Altering phosphorylation in cancer through PP2A modifiers. Cancer Cell Int. 2024, 24, 11. [Google Scholar] [CrossRef] [PubMed]
  30. Seshacharyulu, P.; Pandey, P.; Datta, K.; Batra, S.K. Phosphatase: PP2A structural importance, regulation and its aberrant expression in cancer. Cancer Lett. 2013, 335, 9–18. [Google Scholar] [CrossRef]
  31. Westermarck, J.; Neel, B.G. Piecing Together a Broken Tumor Suppressor Phosphatase for Cancer Therapy. Cell 2020, 181, 514–517. [Google Scholar] [CrossRef]
  32. Khanna, A.; Pimanda, J.E. Clinical significance of cancerous inhibitor of protein phosphatase 2A in human cancers. Int. J. Cancer 2016, 138, 525–532. [Google Scholar] [CrossRef] [PubMed]
  33. Kumbar, M.; Patil, S.A.; Toragalmath, S.S.; Kinnal, S.M.; Shettar, A.; Hosakeri, J.H. Anticancer activity studies of novel metal complexes of ligands derived from polycyclic aromatic compound via greener route. J. Organomet. Chem. 2020, 914, 121219. [Google Scholar] [CrossRef]
  34. Lanzarotti, E.; Defelipe, L.A.; Marti, M.A.; Turjanski, A.G. Aromatic clusters in protein-protein and protein-drug complexes. J. Cheminform. 2020, 12, 30. [Google Scholar] [CrossRef] [PubMed]
  35. Wang, S.; Hanna, D.; Sugamori, K.S.; Grant, D.M. Primary aromatic amines and cancer: Novel mechanistic insights using 4-aminobiphenyl as a model carcinogen. Pharmacol. Ther. 2019, 200, 179–189. [Google Scholar] [CrossRef]
  36. Makiabadi, B.; Zakarianezhad, M.; Zeydabadi, E. The role of hydrogen bonds on the stability of anticancer drug compounds TG/uracil, TG/5-fluorouracil and TG/gimeracil. Struct. Chem. 2023, 34, 755–767. [Google Scholar] [CrossRef]
  37. Wen, Y.; Ding, D.; Luo, M.Q.; Peng, X.Q.; Wang, E.Y.; Wu, Y.H.; Zhou, S.H.; Guo, J. Rationally Designed Highly Potent NKT Cell Agonists with Different Cytokine Selectivity through Hydrogen-Bond Interaction. J. Med. Chem. 2024, 67, 12819–12834. [Google Scholar] [CrossRef] [PubMed]
  38. Wu, Y.; Chen, S.; Zhu, J. Hydrogen-Bond-Driven Core-Crosslinked Supramolecular Micelles with pH/Thermal/Glutathione-Responsive Drug Release toward Enhanced Cancer Therapy. Chem. Mater. 2023, 35, 7655–7670. [Google Scholar] [CrossRef]
  39. De Palma, R.M.; Parnham, S.R.; Li, Y.; Oaks, J.J.; Peterson, Y.K.; Szulc, Z.M.; Roth, B.M.; Xing, Y.; Ogretmen, B. The NMR-based characterization of the FTY720-SET complex reveals an alternative mechanism for the attenuation of the inhibitory SET-PP2A interaction. FASEB J. 2019, 33, 7647–7666. [Google Scholar] [CrossRef]
  40. Yu, H.C.; Chen, H.J.; Chang, Y.L.; Liu, C.Y.; Shiau, C.W.; Cheng, A.L.; Chen, K.F. Inhibition of CIP2A determines erlotinib-induced apoptosis in hepatocellular carcinoma. Biochem. Pharmacol. 2013, 85, 356–366. [Google Scholar] [CrossRef]
  41. Niemela, M.; Kauko, O.; Sihto, H.; Mpindi, J.P.; Nicorici, D.; Pernila, P.; Kallioniemi, O.P.; Joensuu, H.; Hautaniemi, S.; Westermarck, J. CIP2A signature reveals the MYC dependency of CIP2A-regulated phenotypes and its clinical association with breast cancer subtypes. Oncogene 2012, 31, 4266–4278. [Google Scholar] [CrossRef]
  42. McLean, G.W.; Carragher, N.O.; Avizienyte, E.; Evans, J.; Brunton, V.G.; Frame, M.C. The role of focal-adhesion kinase in cancer—A new therapeutic opportunity. Nat. Rev. Cancer 2005, 5, 505–515. [Google Scholar] [CrossRef]
  43. Mondaca, J.M.; Guijarro, A.C.C.; Flamini, M.I.; Sanchez, A.M. Heregulin-induced cell migration is prevented by trastuzumab and trastuzumab-emtansine in HER2+ breast cancer. Breast Cancer Res. Treat. 2021, 186, 363–377. [Google Scholar] [CrossRef]
  44. Sanchez, A.M.; Flamini, M.I.; Baldacci, C.; Goglia, L.; Genazzani, A.R.; Simoncini, T. Estrogen receptor-alpha promotes breast cancer cell motility and invasion via focal adhesion kinase and N-WASP. Mol. Endocrinol. 2010, 24, 2114–2125. [Google Scholar] [CrossRef]
  45. Come, C.; Laine, A.; Chanrion, M.; Edgren, H.; Mattila, E.; Liu, X.; Jonkers, J.; Ivaska, J.; Isola, J.; Darbon, J.M.; et al. CIP2A is associated with human breast cancer aggressivity. Clin. Cancer Res. Off. J. Am. Assoc. Cancer Res. 2009, 15, 5092–5100. [Google Scholar] [CrossRef]
  46. Luque, M.; Cristobal, I.; Sanz-Alvarez, M.; Santos, A.; Zazo, S.; Eroles, P.; Arpi, O.; Rovira, A.; Albanell, J.; Madoz-Gurpide, J.; et al. CIP2A as a Key Regulator for AKT Phosphorylation Has Partial Impact Determining Clinical Outcome in Breast Cancer. J. Clin. Med. 2022, 11, 1610. [Google Scholar] [CrossRef] [PubMed]
  47. Xing, M.L.; Lu, Y.F.; Wang, D.F.; Zou, X.Y.; Zhang, S.X.; Yun, Z. Clinical significance of sCIP2A levels in breast cancer. Eur. Rev. Med. Pharmacol. Sci. 2016, 20, 82–91. [Google Scholar] [PubMed]
  48. Tang, M.; Shen, J.F.; Li, P.; Zhou, L.N.; Zeng, P.; Cui, X.X.; Chen, M.B.; Tian, Y. Prognostic significance of CIP2A expression in solid tumors: A meta-analysis. PLoS ONE 2018, 13, e0199675. [Google Scholar] [CrossRef]
  49. Davis, S.; Meltzer, P.S. GEOquery: A bridge between the Gene Expression Omnibus (GEO) and BioConductor. Bioinformatics 2007, 23, 1846–1847. [Google Scholar] [CrossRef] [PubMed]
  50. Johnson, W.E.; Li, C.; Rabinovic, A. Adjusting batch effects in microarray expression data using empirical Bayes methods. Biostatistics 2007, 8, 118–127. [Google Scholar] [CrossRef]
  51. Leek, J.T.; Johnson, W.E.; Parker, H.S.; Jaffe, A.E.; Storey, J.D. The sva package for removing batch effects and other unwanted variation in high-throughput experiments. Bioinformatics 2012, 28, 882–883. [Google Scholar] [CrossRef]
  52. Bartha, A.; Gyorffy, B. TNMplot.com: A Web Tool for the Comparison of Gene Expression in Normal, Tumor and Metastatic Tissues. Int. J. Mol. Sci. 2021, 22, 2622. [Google Scholar] [CrossRef]
  53. Jo, S.; Kim, T.; Iyer, V.G.; Im, W. CHARMM-GUI: A web-based graphical user interface for CHARMM. J. Comput. Chem. 2008, 29, 1859–1865. [Google Scholar] [CrossRef]
  54. Jimenez-Garcia, B.; Pons, C.; Fernandez-Recio, J. pyDockWEB: A web server for rigid-body protein-protein docking using electrostatics and desolvation scoring. Bioinformatics 2013, 29, 1698–1699. [Google Scholar] [CrossRef]
  55. Laskowski, R.A.; Jablonska, J.; Pravda, L.; Varekova, R.S.; Thornton, J.M. PDBsum: Structural summaries of PDB entries. Protein Sci. 2018, 27, 129–134. [Google Scholar] [CrossRef]
  56. Sargsyan, K.; Grauffel, C.; Lim, C. How Molecular Size Impacts RMSD Applications in Molecular Dynamics Simulations. J. Chem. Theory Comput. 2017, 13, 1518–1524. [Google Scholar] [CrossRef]
  57. Dong, Y.W.; Liao, M.L.; Meng, X.L.; Somero, G.N. Structural flexibility and protein adaptation to temperature: Molecular dynamics analysis of malate dehydrogenases of marine molluscs. Proc. Natl. Acad. Sci. USA 2018, 115, 1274–1279. [Google Scholar] [CrossRef]
  58. Battisti, A.; Ciasca, G.; Grottesi, A.; Tenenbaum, A. Thermal compaction of the intrinsically disordered protein tau: Entropic, structural, and hydrophobic factors. Phys. Chem. Chem. Phys. PCCP 2017, 19, 8435–8446. [Google Scholar] [CrossRef]
  59. Chen, H.; Panagiotopoulos, A.Z. Molecular Modeling of Surfactant Micellization Using Solvent-Accessible Surface Area. Langmuir 2019, 35, 2443–2450. [Google Scholar] [CrossRef]
  60. Post, M.; Wolf, S.; Stock, G. Principal component analysis of nonequilibrium molecular dynamics simulations. J. Chem. Phys. 2019, 150, 204110. [Google Scholar] [CrossRef]
  61. Al-Khafaji, K.; Taskin Tok, T. Molecular dynamics simulation, free energy landscape and binding free energy computations in exploration the anti-invasive activity of amygdalin against metastasis. Comput. Methods Programs Biomed. 2020, 195, 105660. [Google Scholar] [CrossRef]
  62. Barraza, G.A.; Castro-Guijarro, A.C.; de la Fuente Hoffmann, V.; Bolivar Avila, S.J.; Flamini, M.I.; Sanchez, A.M. Drug repositioning for rosacea disease: Biological TARGET identification, molecular docking, pharmacophore mapping, and molecular dynamics analysis. Comput. Biol. Med. 2024, 181, 108988. [Google Scholar] [CrossRef]
Figure 1. Transcriptional profiling of key genes driving tumor progression. Boxplot showing the expression levels of the genes (A) SET, (B) CIP2A, and (C) PPP2CA across different tumor types compared to normal tissues, using data from the TNMplot database. Significant differences, determined by the Mann–Whitney U-test, are highlighted in red. * = p ˂ 0.05. (DF) Boxplots showing the transcriptional expression levels of SET (D), CIP2A (E), and PPP2CA (F) in normal, tumor, and metastatic breast tissue samples, using data from the TNMplot database. (G) The heatmap showing the gene expression profile of 16 genes associated with cell motility. Genes were sorted using a hierarchical cluster algorithm, with average linkage and Pearson’s correlation distance, as illustrated by the silhouette dendrograms on the left. These data were obtained from eight breast cancer cell lines, representative of each molecular subtype, as shown in the upper part of the plot (MCF-10A, T-47D, MCF-7, ZR-75.1, BT-474, SK-BR3, MDA-MB-231, and MDA-MB-468 cells were used. The expression patterns of these genes are shown on a scale from green to red (low expression levels in green and high expression levels in red). (H) The levels of wild-type PP2A and phosphorylated PP2A (p-PP2A) were analysed using Western blot in whole cell lysates from non-tumorigenic breast epithelial cells (MCF-10A) and breast cancer cell lines representing distinct molecular subtypes (T-47D, MCF-7, BT-474, SK-BR-3, MDA-MB-231, and MDA-MB-468). Actin expression is shown as a loading control. A representative blot is shown. (I,J) PP2A and p-PP2A densitometry values were adjusted to actin intensity. * p < 0.05 vs. control.
Kinasesphosphatases 04 00012 g001aKinasesphosphatases 04 00012 g001b
Figure 2. Molecular regulation and expression profiling of PP2A-related genes in breast cancer. (A) Identification of residues susceptible to phosphorylation within the PP2A protein. (B) Phosphorylation of these residues by endogenous PP2A inhibitors. (C) Protein structures of SET, CIP2A, and PP2A (catalytic subunit), highlighting structural domains relevant to PP2A regulation.
Kinasesphosphatases 04 00012 g002
Figure 3. Molecular Docking and Dynamics studies of drug-protein complex formed between pharmacological regulators erlotinib, FTY-720, and exogenous inhibitors of PP2A, CIP2A, and SET. (A) Chemical structure of erlotinib, (B) 3D representation of the erlotinib—CIP2A complex, (C) 2D representation of the erlotinib—CIP2A complex, (D) chemical structure of FTY-720, (E) 3D representation of the FTY-720–SET complex, (F) 2D representation of the FTY-720–SET.
Kinasesphosphatases 04 00012 g003
Figure 4. Molecular Dynamics studies of the FTY-720–SET complex: (A) RMSD, (B) RMSF, (C) radius of gyration, (D) Hydrogen Bond Formation, (E) Solvent Accessible Surface Area. Principal component analysis (PCA) of the protein trajectory of the FTY-720–SET complex: (F) 2D projection of the trajectory, (G) projection of the eigenvectors. Free energy landscape analysis of the FTY-720–SET complex: (H) free energy surface, (I) minimal energy conformation, (J) profile of protein–ligand interactions. Molecular Dynamics studies of the erlotinib—CIP2A complex: (K) RMSD, (L) RMSF, (M) radius of gyration, (N) Hydrogen Bond Formation, (O) Solvent Accessible Surface Area. Principal component analysis (PCA) of the protein trajectory of the erlotinib—CIP2A complex: (P) 2D projection of the trajectory, (Q) projection of the eigenvectors. Free energy landscape analysis of the FTY-720–SET complex: (R) free energy surface, (S) minimal energy conformation, (T) profile of protein–ligand interactions.
Kinasesphosphatases 04 00012 g004aKinasesphosphatases 04 00012 g004b
Figure 5. Molecular Docking and molecular Dynamics studies of the protein–protein complex formed between FTY-720-SET complex and exogenous inhibitor of PP2A SET. (A) SET—PP2A complex, (B) FTY-720-SET—PP2A complex. Molecular Dynamics studies of the protein–protein complexes formed by SET-PP2A: (C) RMSD, (D) RMSF, (E) radius of gyration, (F) Solvent Accessible Surface Area. Principal component analysis (PCA) of the protein trajectory of the complexes formed by SET-PP2A: (G) 2D projection of the trajectory, (H) projection of the eigenvectors. Free energy landscape analysis of the complexes formed by SET-PP2A. (I) Free energy surface of SET-PP2A complex, (J) minimal energy conformation of SET-PP2A complex, (K) profile of protein–protein interactions of SET-PP2A complex, (L) free energy surface of FTY-720-SET-PP2A complex, (M) minimal energy conformation of FTY-720-SET-PP2A complex, (N) profile of protein–protein interactions of FTY-720-SET-PP2A complex.
Kinasesphosphatases 04 00012 g005aKinasesphosphatases 04 00012 g005b
Figure 6. Molecular Docking and molecular Dynamics studies of the protein–protein complex formed between erlotinib–CIP2A complex and exogenous inhibitor of PP2A CIP2A. (A) CIP2A–PP2A complex, (B) Erlotinib–CIP2A–PP2A complex. Molecular Dynamics studies of the protein–protein complexes formed by CIP2A-PP2A: (C) RMSD, (D) RMSF, (E) radius of gyration, (F) Solvent Accessible Surface Area. Principal component analysis (PCA) of the protein trajectory of the complexes formed by CIP2A-PP2A: (G) 2D projection of the trajectory, (H) projection of the eigenvectors. Free energy landscape analysis of the complexes formed by CIP2A-PP2A. (I) Free energy surface of CIP2A-PP2A complex, (J) minimal energy conformation of CIP2A-PP2A complex, (K) profile of protein–protein interactions of CIP2A-PP2A complex, (L) free energy surface of erlotinib–CIP2A–PP2A complex, (M) minimal energy conformation of erlotinib–CIP2A–PP2A complex, (N) profile of protein–protein interactions of erlotinib–CIP2A–PP2A complex.
Kinasesphosphatases 04 00012 g006aKinasesphosphatases 04 00012 g006b
Figure 7. Modulation of PP2A activity and its impact on target proteins associated with BC progression. (A) Western blot analysis showing the levels of total PP2A, phosphorylated PP2A (p-PP2A), and c-Myc in MDA-MB-231 cells treated with FTY-720 (1 and 5 µM) and/or erlotinib (1 and 5 µM) for 24 h. Actin was used as a loading control (CON). (B) Phospho-PP2A densitometry value was adjusted to PP2A intensity, respectively, and then normalized to the control sample. (C) The quantification of c-Myc band intensities was adjusted to actin and normalized to the control group. (D) The STRING tool was employed to identify proteins involved in cytoskeletal remodeling (ACTR2, WASL, CTTN, PXN, PAK1, PTK2, and SRC) and regulators of the PP2A pathway (PPP2CA, CIP2A, and SET). The nodes represent proteins, and the coloured lines between them indicate the type of interaction evidence used in predicting the associations. Red: fusion evidence; green: neighborhood evidence; blue: co-occurrence evidence; purple: experimental evidence; yellow: text-mining evidence; light blue: database evidence; black: co-expression evidence, and light violet: protein homology evidence. B) Boxplot showing the gene expression levels of (E) SRC (Src), (F) PTK2 (FAK), (G) PAK1 (PAK1), (H) CTTN (Cortactin), (I) WASL (Wasl), and (J) ACTR2 (ARP2 Complex), across normal, tumor, and metastatic breast tissues were generated using data from the TNMplot database. Statistical significance was determined using the Kruskal–Wallis test. (K) The representative Western blot demonstrated the levels of phosphorylated Src (p-Src), FAK (p-FAK), paxillin (p-paxillin), PAK1 (p-PAK1), and Erk1/2 (p-ERK1/2) in MDA-MB-231 cells treated with FTY-720 (5 µM) and/or erlotinib (10 µM) for 24 h. Actin expression was used as a protein loading control (CON). (L) The quantification of protein band intensities was then normalized to actin and expressed relative to the untreated control group. * p < 0.05 vs. control. All experiments were performed in triplicate with consistent results.
Kinasesphosphatases 04 00012 g007
Figure 8. Association between SET, KIAA1524, and PPP2CA expression and breast cancer patient outcomes. Kaplan–Meier survival curves showing the association between tumor expression of SET, KIAA1524 (CIP2A), and PPP2CA and clinical outcomes in breast cancer patients. (AC) Relapse-free survival (RFS) curves for the overall breast cancer cohort based on individual gene expression. (DF) The overall survival (OS) curves for all breast cancer subtypes, based on individual gene expression levels. (GI) Distant metastasis-free survival (DMFS) curves for all breast cancer subtypes, based on the expression of the same genes. Patients were stratified into low (black) and high (red) expression groups using the median as a cut-off, with the optimal threshold automatically selected by the KMplotter algorithm. The log-rank p-values, hazard ratios (HR), and 95% confidence intervals (CI) are indicated in each plot. Statistically significant differences (p < 0.05) are highlighted in red.
Kinasesphosphatases 04 00012 g008
Table 1. Grid values for molecular docking.
ValueCIP2ASET
Size X4050
Size Y4052
Size Z4040
Center X52.155−14.62
Center Y32.303−8.34
Center Z17.4453.775
Disclaimer/Publisher’s Note: The statements, opinions and data contained in all publications are solely those of the individual author(s) and contributor(s) and not of MDPI and/or the editor(s). MDPI and/or the editor(s) disclaim responsibility for any injury to people or property resulting from any ideas, methods, instructions or products referred to in the content.