1. Introduction
1.1. Objective of the Study and Research Questions
Academic achievement is a complex process of student engagement in educational procedures and varies greatly from student to student for the same course, as well as from course to course for the same student, as faculty members can assure. Assessment of academic achievement represents a measurement of students’ knowledge, skills, and abilities.
The aim of this research is to investigate the possible correlation of student performance as expressed in the oral grades and the written final examination grades in a Greek military academy (henceforth “the Academy”), located in Attica, Athens’ metropolitan area.
The Academy offers, among other specializations, a degree in telecommunications and electronics engineering (TEE). This program is equivalent to a bachelor’s degree in electrical engineering [
1]. In contrast to universities, engineering classes have a small number of students.
The data were collected from two technology-related undergraduate 400-level courses:
Course One, Fall 2017, Fall 2019, and Fall 2021 semesters;
Course Two, period 1: Fall 2014, Fall 2015, and Fall 2017 semesters;
Course Two, period 2: Fall 2019, and Fall 2021 semesters.
The two courses were taught by different teachers to the same students at the same period of time. Two datasets were derived per semester per course: oral grades and final exam scores. In both courses, the final written exam typically consisted of a set of open-ended questions and problems, similar to those included in the textbooks.
1.1.1. Alternative Assessment
Alternative assessment is a method of evaluation that measures a student’s level of proficiency in a subject as opposed to the student’s level of knowledge (typically measured by exams). The concept of alternative assessment is to allow students to acquire and demonstrate knowledge and skills by performing tasks. Alternative assessment is also called performance testing or authentic assessment, because it is deeply rooted in one’s ability to do something by leveraging newly-gained knowledge. As part of the assessment, the students have to perform meaningful tasks that reflect a clear understanding of the teaching and learning objectives. Since Course Two is mostly a practical subject, it makes sense to adopt alternative assessment [
2].
1.1.2. Course One
Course One is a theoretical technological undergraduate 400-level course offered by the Division of Electronics, Electric Power and Telecommunications to the TEE cadets of the Academy during their seventh semester of studies. The syllabus includes optical fibers, optical sources (LED and laser), photodetectors (photodiodes), optical couplers, optical filters, optical amplifiers, etc. This course assumes two prerequisite courses: applied electromagnetics and solid state electronic devices, as well as a strong mathematical background.
The recommended textbook is S.O. Kasap’s, Optoelectronics and Photonics, 2nd edition, Pearson, 2013. There is also a supplementary recommended textbook: Optical Fiber Communications, 3rd ed., by G. Keiser, McGraw Hill, 2000. In addition, instructor’s notes and lecture slides are used. Oral grades result from a midterm exam. The educational policy of the course remained unchanged for the duration of this study.
1.1.3. Course Two
Course Two is a mostly practical technological undergraduate 400-level course offered by the Division of Computer Engineering and Information Science to the telecommunications and electronics engineering cadets during their seventh semester.
Course Two covers an introduction and application and transport layers. The textbook used is J. F. Kurose and K. W. Ross’ Computer Networking: A Top-Down Approach, 7th edition.
For many years, oral grades were derived from homework assignments and a midterm exam, based on the textbook problems or similar problems from the bibliography, with the midterm exam counting for 70% of the oral grade. From Fall 2019 onward, oral grades in Course Two have been derived from a set of alternative academic activities offered throughout the semester, instead of exams or tests. These activities typically include educational scenarios, lab exercises, simulations, etc. [
1,
3]. The set of activities changes every year, to adapt to technological developments, as well as to the students’ interests.
The reasons behind this decision were the following:
Course Two is a practical subject. Lab exercises and educational scenarios are invaluable for practical courses and enjoyable for the students. On the other hand, they facilitate and deepen learning;
Different students have different cognitive abilities; using a variety of alternative activities caters for more learning styles;
There were students who could not perform well in written exams due to stress, although they were trying hard in the classroom. Assessment in Course Two should have pluralism, in order to be fair.
After this change in the oral assessment policy, the teacher of Course Two noticed a significant difference between oral grades and final examination scores; there were students who performed well on alternative academic activities but poorly on the final exam and vice versa. This observation was one of the motivations for this research.
1.2. Motivation and Objective of This Work
One field of pedagogical research is investigating the relationship of oral grades to final examination performance. If the two datasets are correlated, then oral grades could serve as a predictor of final grades. If this is the case, then low oral grades could be used as an early warning of student failure in the course.
It is important to identify at-risk students at an early stage of their academic career, so that strategies to support them can be put into action [
4,
5,
6]. Early prediction of student course failure is important in our academy, and gives the potential to provide students with timely feedback and support.
Since there is not enough research literature regarding the use of oral scores as a predictor of final exam scores [
7], this study represents a contribution towards this direction.
A second objective of this study was to investigate the association between different oral assessment methods and the level of academic performance in the final written examination. Three oral assessment methods were considered: exam-based oral assessment (Course One); oral assessment based on lab exercises and homework assignments, and a midterm exam (Course Two period 1); and assessment based exclusively on alternative activities (lab exercises and educational scenarios, Course Two period 2 [
3]).
This comparative, quantitative, and correlational research used regression analysis to construct predictive models for the Course One and Course Two final grades. Hence, the research questions are as follows:
Research question 1: Can the oral grades based on homework assignments and a midterm exam be used as a predictor of the final examination scores?
Research question 2: Can the oral grades based exclusively on alternative assessment activities be used as a predictor of the final examination scores?
Consequently, the purpose of this research was to examine if there is any relationship between the oral grades and final examination grades for undergraduate telecommunications and electronics engineering cadets in computer technology courses, in three different cases: when the oral grades resulted from exams, when the oral grades resulted from homework assignments and exams, and when the oral grades resulted from alternative assessment activities.
3. Methodology and Design
In this research, where the data were numerical, a linear regression analysis was used to produce predictive models between oral grades and final exam scores. This design type also allowed for hypothesis testing. The methodology selection was driven by the research questions. For the above reasons, a quantitative methodology was selected, utilizing a correlational study.
3.2. Variables
In this study, the oral grades were used as the independent variable and the final examination scores as the dependent variable. Correlation between variables does not necessarily imply causality.
3.3. Environment and Control
Both courses met once a week for three academic hours (120 min), face-to-face, for 15 weeks during the fall semester (September to mid-January). The midterm written examinations (where applicable) lasted three academic hours (2 h and 15 min). The final written examinations were set at the end of each semester (January and June) and lasted approximately 3 h; they were given on paper and were manually graded by the instructors. Both midterm and final exams were supervised by an instructor or staff members. Grades ranged from 0 to 100. In general, final exams are more difficult than midterm exams, because they examine all (or a large part) of the syllabus, may combine issues from various chapters, and typically contain more complex problems.
3.4. Data Collection
Both courses were offered in the fourth year of studies. After 2015, the TEE specialization was offered biennially, hence both courses were offered in Fall 2017, 2019, and 2021.
In this study, aggregated data from academic years 2014–2015, 2015–2016, 2017–2018, 2019–2020, and 2021–2022 were analyzed. In all cases, the whole class population participated (100%). For each case we considered, we took the most recent semesters. The data encompassed three sets, each consisting of oral grades and final grades.
Dataset 1 consists of 33 pairs of exam-based oral and final examination scores and came from Course One Fall 2017, 2019, and 2021.
In dataset 2, the oral grades resulted from homework assignments, lab exercises, and a midterm exam, accounting for 70% of the oral grade; this came from Course Two Fall 2014, 2015, and 2017, and consisted of 37 samples;
In dataset 3, the oral grades resulted exclusively from alternative assignment activities; it came from Course Two Fall 2019 and 2021, and consisted of 24 samples. In this case, there was no third semester, so the sample was smaller than for the other two cases.
Consequently, the purpose of this research was to investigate possible relationships between oral grades and final grades in these three datasets. The grades were analyzed in terms of correlations and score prediction. Next, three predictive models were created: one for Course One, and two for Course Two.
3.5. Demographics
Sixty-one students participated in this study. The students were in their fourth year of studies, about 21 years old, 87% males and 13% females.
The teachers of both courses are senior full-time professors, men, with over 25 years of experience, having taught these courses for at least 16 years.
3.6. Data Analysis
The grades were analyzed in terms of statistics and correlations using the Calc software package (part of LibreOffice version 6), and Excel’s Data Analysis ToolPak (part of MS Office 2021). The results were verified in Matlab, Octave, and PSPP, a free program for statistical analysis of sampled data (
https://www.gnu.org/software/pspp, accessed on 10 March 2023). The resultant predictive models were derived from the analysis.
The metrics used to evaluate the models were the correlation R, R squared (R
), the standard error, the ANOVAs, the
p-value, the root mean squared error (RMSE), etc. [
7,
39].
The correlation coefficient R, or Pearson’s r, is a measure of the strength and direction of the linear relationship between two variables; it is defined as the covariance of the variables divided by the product of their standard deviations and represents the relationship between two variables.
When R is close to zero, there is no relationship between the variables. When it is close to 1 or −1, there is a strong relationship between the two variables. The square of the correlation coefficient R is often used instead of R. In an ideal model, R should be close to 1. An R close to 0 indicates no relationship.
The mean squared error (MSE) measures the average of the squares of the errors between the real and estimated final grades. The square root of the MSE, called RMSE, is often used instead. The lower the MSE and RMSE, the better the forecast.
The standard error is the average distance of the observed values from the regression line.
Analysis of variance (ANOVA) determines the influence of the independent variable on the dependent variable in a regression study.
Significance F is the p-value associated with the F-test of overall significance. This test determines whether a model does a better job explaining the dependent variable’s variability than a model with no independent variable, and informs us whether or not the regression model is statistically significant. Here, we assumed a confidence interval of 95%. Thus, if the p-value was less than 0.05, there would be a statistically significant association between the oral and final grades.
An outlier is a point far away from the regression trend line. Such cases are possible and may be due to various factors, including stress, poor planning, negligence, indifference, psychological factors, or even external causes. The presence of even one outlier in a small sample (such as ours) can dramatically deteriorate or even nullify a model.
4. Results
From our experience, we anticipated the oral activities statistics (maximum, minimum, and mean) would be higher than the final exam statistics, because the problems in the final exam are typically more complicated than those of the midterm exam.
Using linear regression, models predicting the final examination score (dependent variable y) using the oral grades as a predictor (independent variable x) were constructed for each semester. The models had the form of a linear equation, where
is the coefficient and
is the constant (or intercept) term:
4.1. Course One
In Course One, the oral grades result from a midterm exam. Next, the collective results for the three most recent semesters are presented (Fall 2017, Fall 2019, and Fall 2021).
The dataset consisted of 33 pairs of oral–final grades. The resulting model had the following characteristics (
Table 1):
The average score for the midterm exam (oral grade) was 61.76%, while the average score for the final exam was 59.33%, i.e., very close. The standard deviation for the midterm exam was 15.47%, while the standard deviation for the final exam was 17.74%, i.e., comparable. Moreover, the maximum grades were very close, but the variances presented some difference.
The regression equation is presented below (Equation (
2)).
The predictive model for Course One is presented below in
Figure 1. Notice the existence of outliers.
Figure 2 describes statistically the produced linear regression model for Course One.
The regression statistics table provides statistical measures of how well the model fits the data. We can see that R
= 0.521295, which agrees with
Figure 1.
The R-squared value of 0.521295 indicates that our model accounted for about 52.1% of the dependent variable’s variance.
The standard error of the regression indicates the typical size of the residuals. This statistic shows how wrong the regression model was on average. We want lower values, because this signifies that the distances between the data points and the fitted values are smaller. Here, the standard error was 12.663785, which is rather large.
In the ANOVA table, df means degrees of freedom. SS is the sum of squares (4971.515017 in this case; see second line), and MS is the mean of squares produced as SS/df, where df is 31 here.
F is the significance, which is very good in this case, meaning that our test result was statistically significant, so the model was valid.
Table 2 summarizes the produced linear regression model for Course One, obtained using the Data Analysis ToolPak in Excel.
The regression equation was statistically significant (2.108099 ). However, R was equal to 0.506, rather moderate. The standard error of the estimate was also moderate (12.66). These facts indicate that the produced model for Course One was significant but had a moderate accuracy.
4.2. Course Two
In Course Two, we consider two different cases, according to the way oral grades are derived:
- 1.
Period 2014–2017, including three semesters: Fall 2014, Fall 2015, and Fall 2017. A series of assignments are offered throughout the semester, contributing 30% to the oral grade. The remaining 70% of the oral grade comes from a midterm exam.
- 2.
Period 2017–2019, including two semesters: Fall 2019 and Fall 2021; the oral grades are derived from a series of alternative assessment activities.
4.2.1. Period 2014–2017
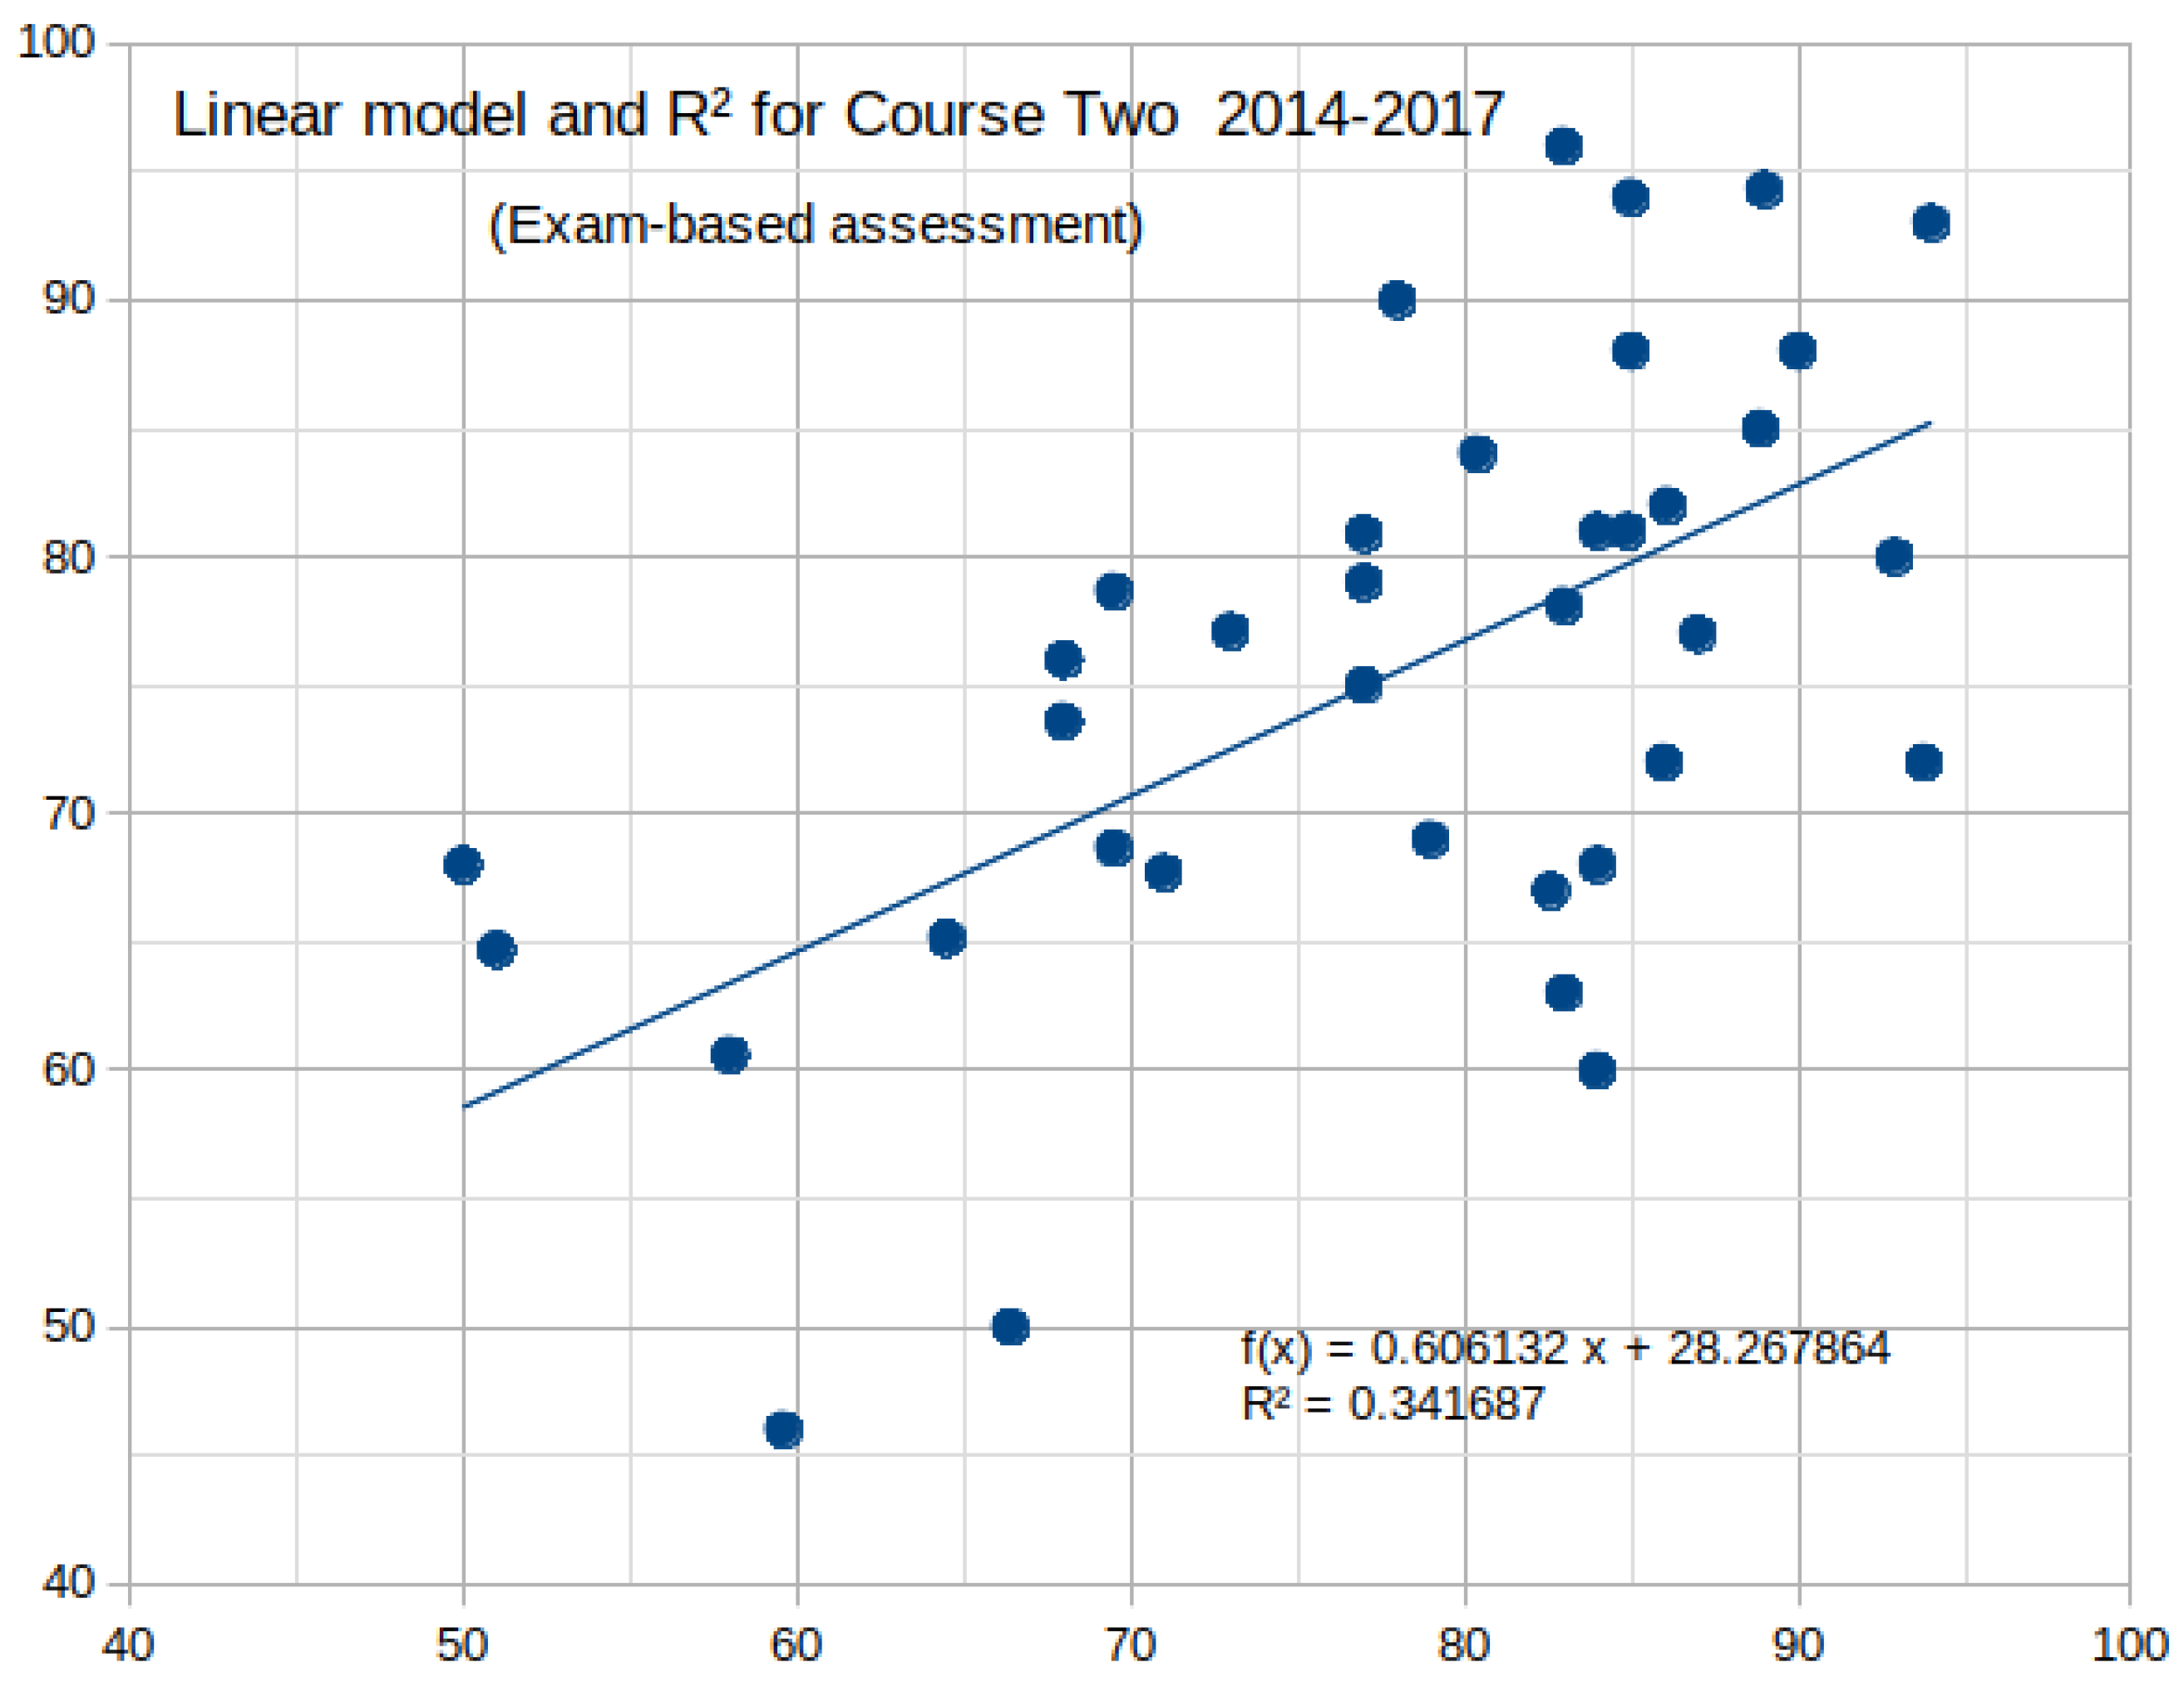
The oral grades and final exam statistics for Course Two are presented in
Table 3. The maximum, average, and minimum of oral grades were superior to those of the final exam, as expected.
The above results are considered normal, according to our educational policy. In addition, the oral and final scores are comparable across all criteria (maximum, mean, minimum, standard deviation, etc.).
The regression equation (e.g., predictive model) for Course Two is presented below (Equation (
3) and
Figure 3).
Figure 4 describes statistically the produced linear regression model.
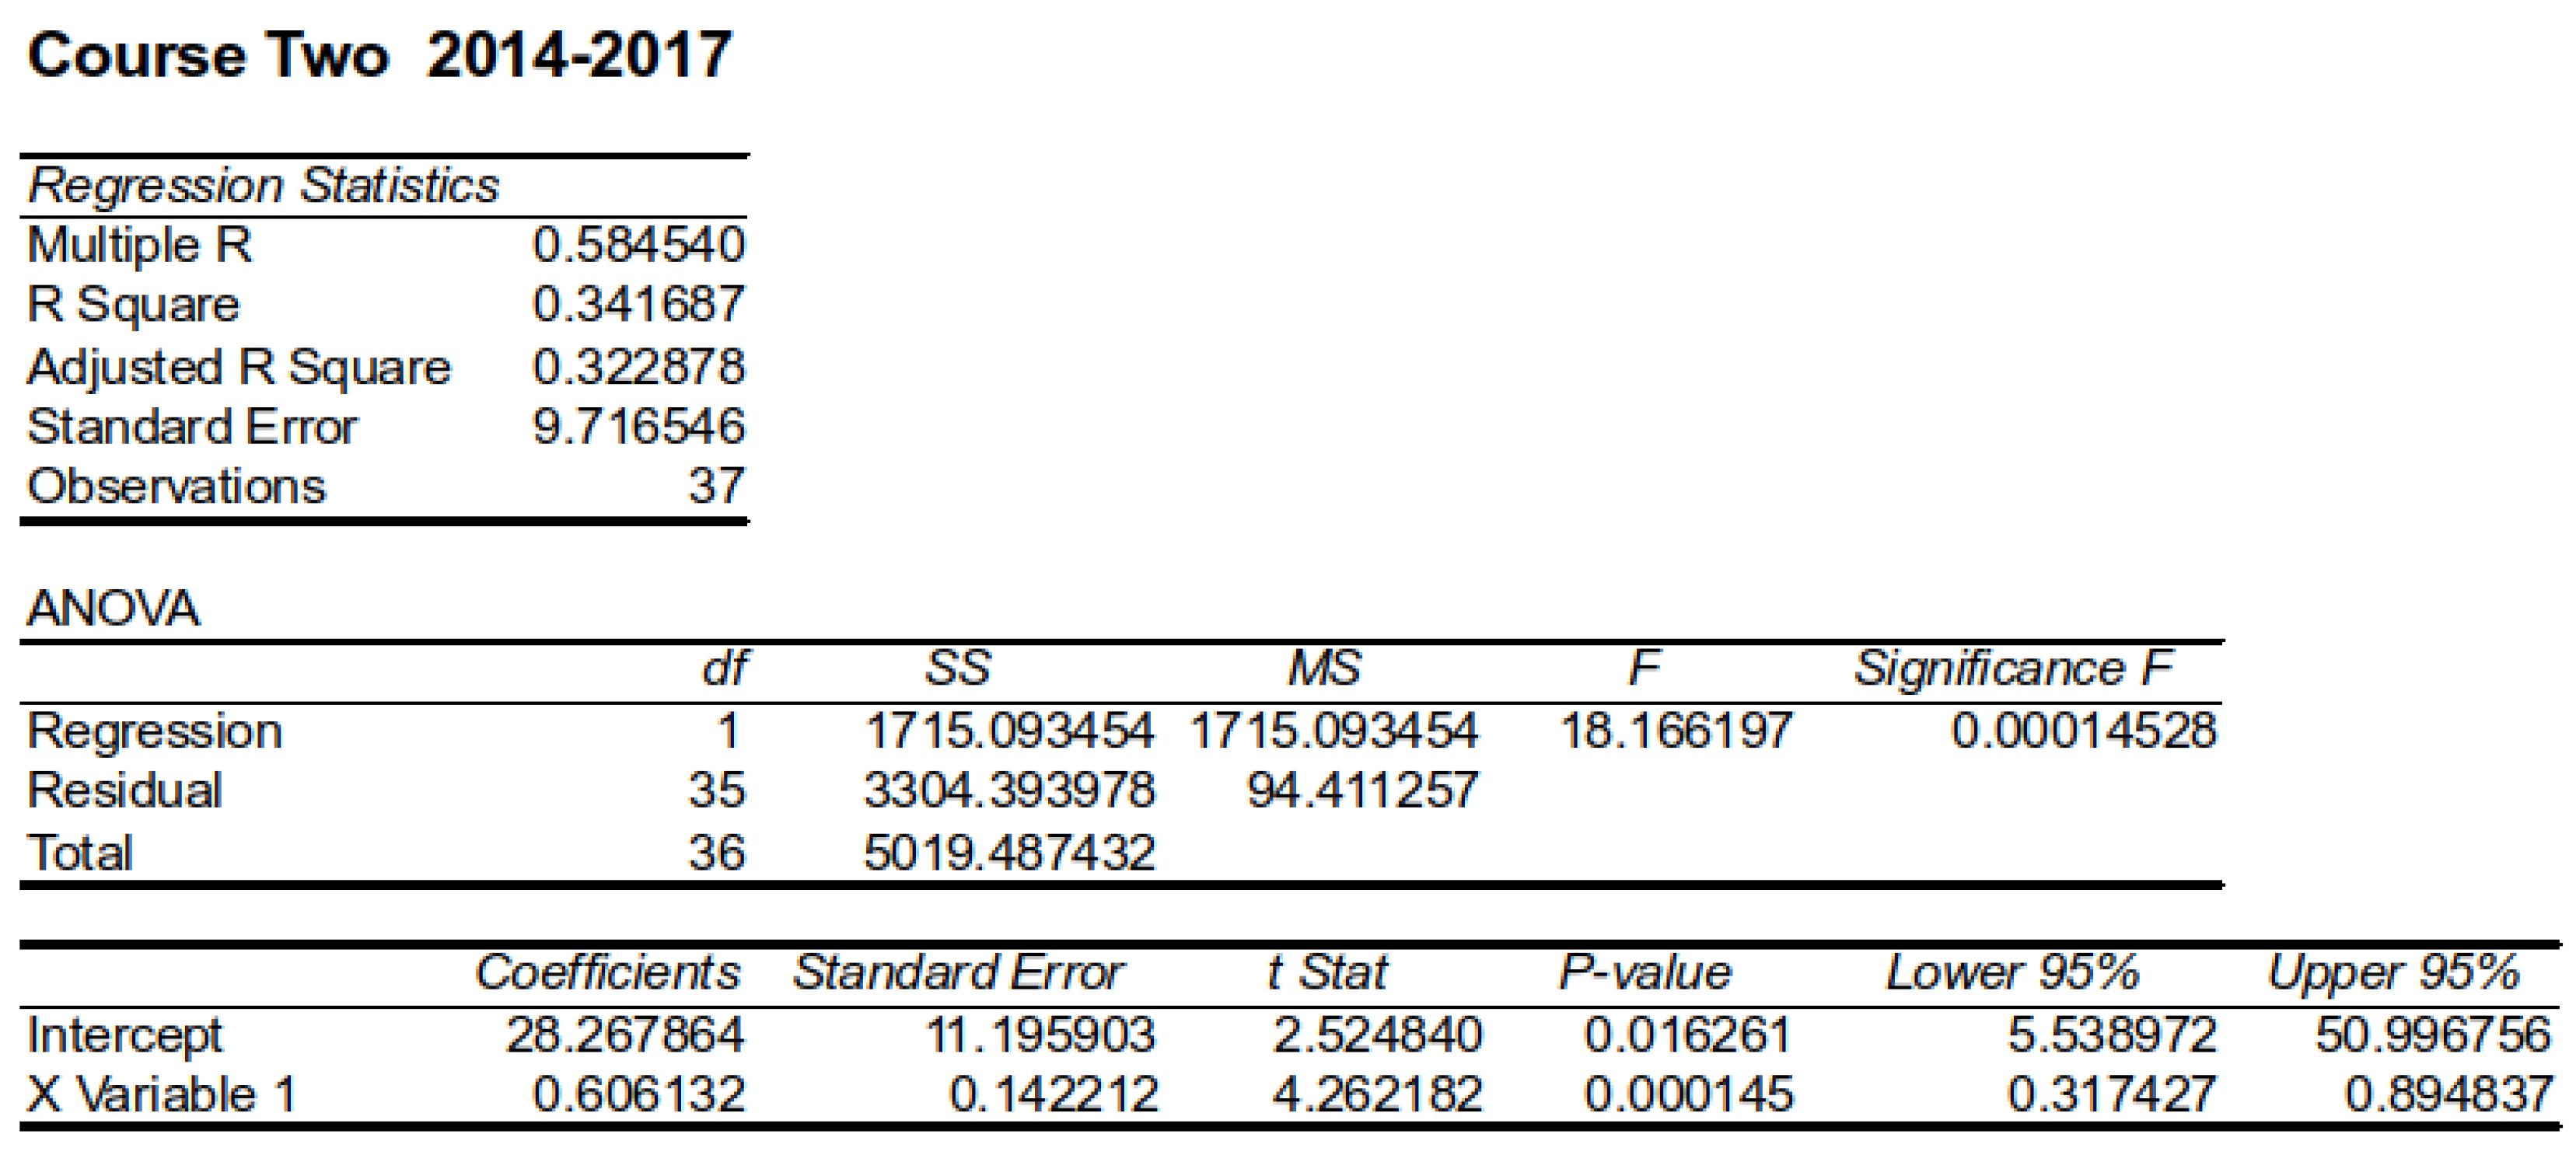
Table 4 summarizes the produced linear regression model for Course Two, period 2014–2017, obtained by the Data Analysis ToolPak of Excel.
The regression equation was statistically significant (0.00014528). However, R was equal to 0.342, rather small. The standard error of the estimate was not bad (9.7). These facts indicate that the produced model for Course Two was significant but had a medium accuracy.
4.2.2. Period 2019–2021
The oral grades of Course Two Fall 2019 and Fall 2021 resulted exclusively from alternative assessment activities including lab exercises, educational scenarios [
3], even the attendance of a free MOOC [
42].
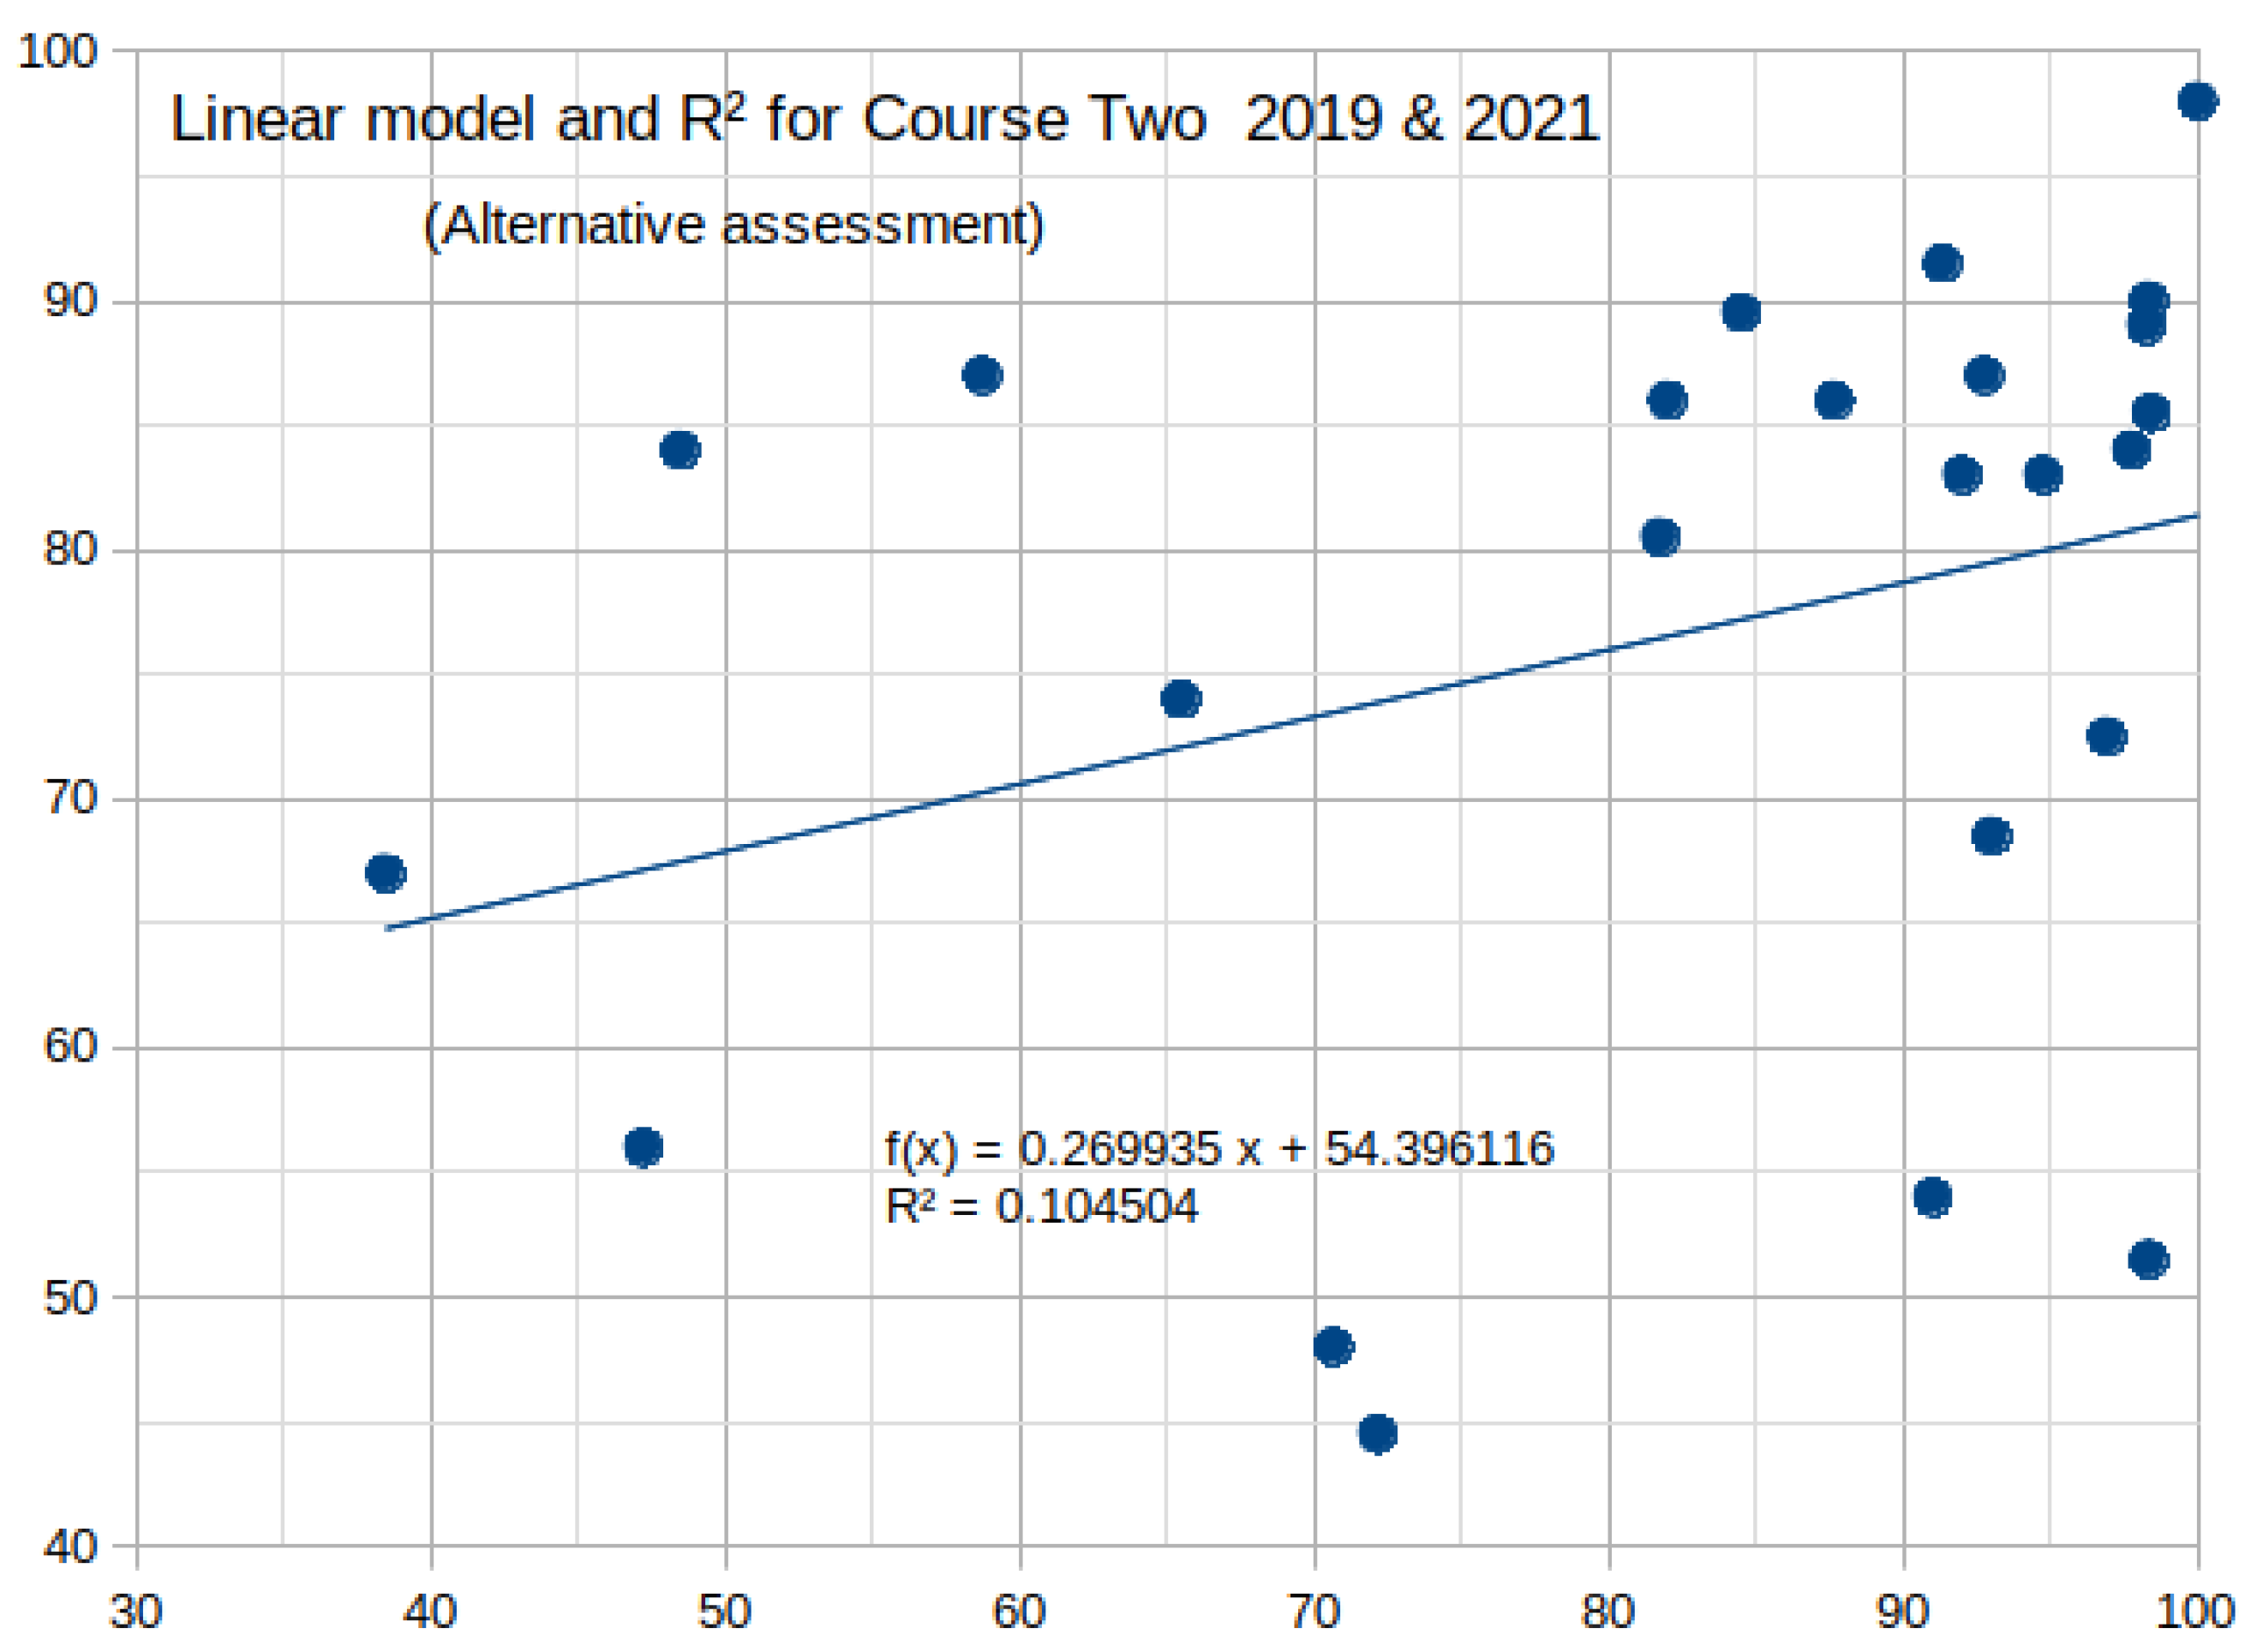
Oral grades and final exam statistics are presented in
Table 5. The maximum and average of the oral grades were superior to those of the final exam, as expected. However, the spread, standard deviation, and variance of the oral grades were superior to those of the final grades, while the oral minimum was lower than the final minimum. This result is in contrast with Course One and Course Two, period 2014–2017, where the oral grades were derived from a midterm exam by 100% or 70% respectively. This means that the alternative assessment made a difference.
The regression equation (e.g., predictive model) for Course Two Fall 2019 and Fall 2021 is presented below (Equation (
4) and
Figure 5).
Figure 6 summarizes the produced linear regression model, obtained using the Data Analysis ToolPak in Excel.
Table 6 describes statistically the produced linear regression model for Course Two, period 2019–2021.
The generated model was statistically insignificant and exhibited poor characteristics (e.g., a small R square and large standard error). This result was expected because, as we have already mentioned, the observation that triggered this research was that there were students with a low overall performance who excelled in the alternative assessment activities, but also students with a good overall performance who performed poorly in the alternative assessment activities. The rule of thumb in such cases is the existence of points in the upper left and lower right quadrants of the regression graph(in this case,
Figure 5).
4.3. Impact of Results on Hypotheses
The models produced for Course One and Course Two 2014–2017 were valid and, to some degree, accurate; consequently, they could be used to predict final grades. Therefore, the null hypothesis could be rejected for these courses; and the alternative hypothesis holds. Thus, exam-based oral grades do significantly predict written final exam scores.
On the other hand, the model produced for Course Two 2019 & 2021 was statistically insignificant and could not be used to predict final grades. Therefore, the null hypothesis holds in this case: oral grades based on alternative assessment activities do not predict written final exam scores.
5. Discussion
The oral grades in Course Two 2014–2017 are based primarily on the midterm exam (70%); this was the reason behind the good characteristics of the Course Two Fall 2017 model (since we found that exam-based oral grades can predict final exam grades).
The oral grades of Course Two Fall 2019 and Fall 2021 resulted from alternative assessment activities instead of midterm exams; as a result, the generated models were invalid, in the sense that they could not predict the final exam grades. Course Two Fall 2019 & 2021 presented almost no correlation between the oral and final grades (R = 0.1045).
The Course One model showed that, under certain conditions, it was possible to predict final exam scores from oral scores. In this case study, these prerequisites seemed to be:
- 1.
Similar methods of deriving oral and final grades (that is, exams).
- 2.
Consistent educational policy (same teacher, same book, etc.).
- 3.
Consistent student behavior. When students lose their motivation or have a weak background or when something goes wrong and they cannot perform regularly, outliers occur which deteriorate or even cancel the model.
Over time, with the aggregation of additional data, and provided that the other critical factors of the educational process remain stable, the models are expected to improve and stabilize; therefore, it is imperative to maintain historical data. When important factors change across semesters, new models must be constructed. If we have a lot of observations, it is possible, as well as acceptable, to remove extreme samples, in order to improve the model. A statistical estimator that is often "tweaked" to obtain the best possible model is the MSE (mean squared error); the smaller the MSE, the closer we are to finding the line of best fit [
43]. For example, we can “tweak” the Course One model by removing the samples which generated the largest MSE between the prediction and final grade, to obtain a better model. The improved predictive model and regression equation for Course One are presented below (
Figure 7).
Figure 8 describes statistically the improved linear regression model for Course One, obtained after removing the four worst samples, and
Table 7 presents the regression statistics.
The produced model is significantly improved in terms of R, standard error, significance, etc., and hence, more accurate. This being the case, low oral grades can be used as an early warning of student failure in the final exam.
On the other hand, the failure of the model produced for Course Two period 1 is attributed to the fact that the alternative assessment activities used to produce the oral grades were different in nature and skills from the problems used in the final exam.
The model produced for Course Two period 1 is different from that of period 2. The difference between the two cases was attributed to the change in the educational policy concerning oral assessment.
The results presented here are a case study for engineering classes of the Academy, which typically have few students. In such cases it is difficult to design accurate prediction models, because the unpredictable performance of even one student can affect a large percentage of the class statistics and may invalidate the model. We expect larger samples would produce more reliable models.
This is a pioneer study concerning the Higher Education Military Academies of Greece. Its value lies in the fact that, in courses where oral grades are based on exams, the generated models per course could be used primarily as prediction tools, allowing the educators and dean to identify students at risk of failing the exam early and intervene in order to help these students improve their academic performance. The students themselves could perceive any individual deficiency in the course in time, in order to avoid failure. In this case, early awareness may bring about less accumulated stress, because the students would have more time to study consciously to avoid failure. In courses with prerequisites or in colleges with specific restrictions, where students are permanently expelled if they fail several times in a course or miss the academic year due to inadequate performance, a prediction tool would be particularly useful.
In addition, this study demonstrates that alternative assessment helps students who perform poorly in exams to learn practically. This was confirmed in an interview with one such student after his graduation [
44].
For Course Two Fall 2019 and Fall 2021, the lack of correlation between oral and final exam grades was attributed to the following reasons:
- 1.
Learning activities that contributed to the oral grades tested different skill sets from the final exams. Therefore, students’ ability to execute lab exercises and homework assignments was not a good predictor of their ability to solve the problems in the final exam.
- 2.
The students’ performance changed under the different conditions that applied in the alternative activities and the final written exam and depended to a large extent on their learning style; some learning styles are favored in alternative assessment activities, while other learning styles are favored in written exams [
3,
44,
45].
Different Courses, Different Models
Our findings also indicate that different courses produce different models; this is reasonable, since different courses can vary a great deal in terms of course contents, learning objectives, educational policy, methods of evaluation and assessment, etc. Several changes in critical parameters, such as different instructors, teaching methods, books, etc., will greatly affect the model credibility. Each course tends to have unique characteristics that affect its predictive model [
6]. Moreover, the difficulty levels of different courses vary considerably, so we should not expect models from a difficult course to apply to a relatively easy course and vice versa. Our results indicate that a general model cannot address the complexity of all courses, because learning objectives, content difficulties, educational policy, activities and assessments, exam difficulty, etc., vary greatly. The use of a general model would unavoidably compromise the model accuracy in predicting student course failure [
6].
6. Conclusions
This research study explored the relationships between oral grades and final examination grades for two undergraduate 400-level engineering courses, offered in a Hellenic military academy during the period 2014–2022.
A quantitative, correlational approach utilizing linear regression analysis to describe possible relationships between oral and final grades was employed. The results indicated that, under certain conditions, prediction of the final examination scores from the oral grades was possible; these conditions were as follows: first, the assessment mode producing the oral and final grades being written exams; and second, the other factors of the educational process (except the students of the course) remaining invariant. The credibility of the predictive models was verified. We also found that the assessment method used to produce the oral grades greatly affected the performance (validity) of the model. Hence, we estimated that it would not always be possible to produce predictive models. Our findings are in agreement with the results of other researchers [
6,
7,
41].
The main findings of this study are summarized as follows:
Under the assumption that the main factors of the teaching process such as the instructor, objectives, textbook, teaching style, assessment policy, etc., remain constant, it is possible to produce reliable predictive models;
A model changes when one or more critical factor affecting the teaching process change;
Different courses produce different models;
When alternative assessment was used to produce the oral grades, it was impossible to produce statistically significant models;
It is useful to keep historical data per course, in order to build a predictive model.
Our results also provide a deeper insight into alternative assessment and could assist educators in choosing methods to enrich their oral assessment policy [
44].
This research was exploratory in nature and was specifically limited to the undergraduate telecommunications and electronics engineering cadets of the Academy and the specific courses, as offered by their instructors. Further research is needed to identify the conditions that would allow us to generalize our findings.


