1. Introduction
Extended reality (XR), an umbrella term encompassing augmented reality (AR), virtual reality (VR), and mixed reality (MR), has emerged as a core enabling technology for the realization of virtual worlds and immersive human–computer interaction paradigms. XR systems integrate sensing, rendering, interaction, and spatial computing components to deliver persistent and context-aware experiences that bridge physical and digital environments [
1,
2]. As XR hardware and software ecosystems mature, XR technologies are increasingly embedded in diverse application domains, including industrial training, manufacturing, healthcare, education, entertainment, and remote collaboration. Consequently, understanding the evolving structure of XR technologies and identifying meaningful XR sub-technologies have become important for both research and practice [
1,
2]. A particularly informative lens for studying technology evolution is patent data, which often capture early stage inventive activity and provide structured signals such as assignees, filing dates, classifications, and claims that can be leveraged for technology intelligence and R&D strategy [
3]. In recent years, patent analytics has expanded from descriptive statistics to data-driven discovery of technology clusters, novelty, and trajectories, enabling more systematic technology landscape mapping and evidence-based decision making [
4,
5].
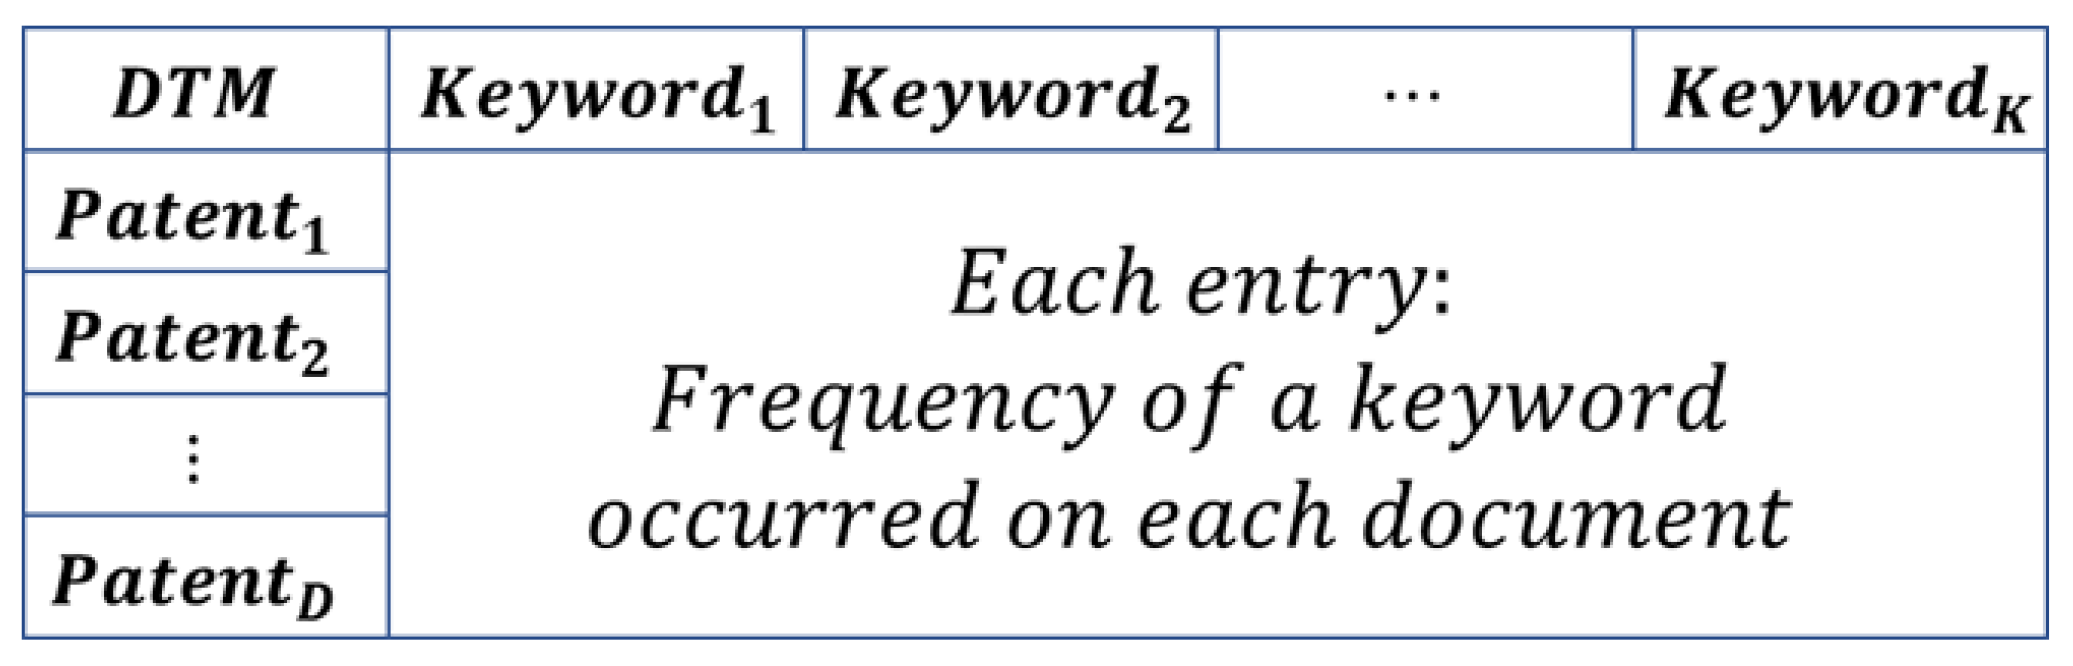
However, despite the growing strategic importance of XR, the patent-based XR technology landscape remains challenging to analyze at scale because the underlying textual evidence must be translated into machine-readable representations that support robust modeling and interpretation. A common pipeline for patent text analytics transforms patent documents into a document–keyword matrix (DKM), where rows correspond to patent documents, columns correspond to extracted keywords, and entries represent keyword frequencies [
6,
7,
8,
9]. While DKM representations enable classical machine learning workflows and facilitate interpretability, the DKM related to XR patents is typically high-dimensional and extremely sparse. In such settings, the observed number of zeros greatly exceeds what standard count models would predict, exhibiting a zero-inflated (ZI) pattern that reflects both structural absence of a technology concept in a patent and stochastic absence due to limited disclosure length, vocabulary variability, and extraction noise [
10,
11,
12]. This sparse, zero-inflated count structure can degrade the validity of downstream analyses if ignored, leading to unstable topic discovery, biased similarity estimation, and overly fragmented clustering outcomes [
10,
11,
12]. Much of the prior patent analytics literature has relied on probabilistic topic modeling or embedding-based clustering for technology topic identification and trend analysis, often combined with visualization or network-based mapping. These approaches have demonstrated practical utility across domains, including technology forecasting and emerging technology detection [
13,
14,
15]. Nevertheless, many widely used workflows implicitly treat the DKM as if zeros were generated solely by a standard count process, or they apply ad hoc preprocessing such as term frequency-inverse document frequency (TF-IDF) transformations, aggressive filtering, or binarization to mitigate sparsity [
16,
17]. Such practices can be problematic for XR patents because the mechanism generating excessive zeros is not explicitly modeled, and the resulting sub-technology structures may be sensitive to preprocessing choices. This motivates the need for modeling strategies that are likelihood-aware for zero-inflated counts while retaining interpretability for technology mapping [
18]. To address these challenges, this study focuses on XR patent DKM and proposes an analysis framework that treats extracted keywords as observable variables representing XR sub-technologies, while explicitly accounting for sparse, zero-inflated count generation. In particular, we position XR sub-technology discovery as a problem of learning low-dimensional latent structure from a high-dimensional sparse count matrix, where both structural zeros and sampling zeros may coexist [
18,
19,
20]. Building on advances in count-based latent factor models and scalable inference for sparse matrices, we aim to extract interpretable sub-technology components and quantify their relationships in a way that is statistically principled and empirically robust [
20]. In addition to sub-technology extraction, XR technology planning often requires understanding how technological elements combine and co-evolve. Therefore, we further analyze the association structure among keywords using a co-occurrence network perspective and exploit modern community detection methods to summarize dense interaction patterns into coherent technology modules. This network view complements count-likelihood modeling by highlighting technology combinations that frequently appear together, providing an intuitive map of sub-technology proximity and modular organization [
21,
22].
The main contributions of this work are summarized as follows. First, we introduce a statistically grounded framework for XR technology analysis by explicitly modeling patent-derived DKMs as zero-inflated count data, addressing a critical limitation of conventional text mining approaches that ignore excess zeros and overdispersion. Second, we develop a likelihood-based modeling pipeline that enables interpretable extraction of XR sub-technologies through incidence rate ratio (IRR) analysis, providing statistically meaningful measures of technology relatedness. Third, we construct a technology relatedness network based on statistically significant IRR effects, offering an intuitive and structurally grounded representation of XR technology relationships. Finally, by integrating statistical modeling with network analysis, we provide a unified and reproducible framework that improves robustness, interpretability, and practical applicability for XR patent analytics.
The remainder of this paper is organized as follows.
Section 2 introduces the research background related to technology analysis and zero-inflated count modeling.
Section 3 presents the data and proposed method for XR technology analysis using machine learning and statistical models.
Section 4 shows the experimental results to verify the performance of our method. Lastly, we represent the conclusions of our paper in
Section 5.
4. Experiments and Results
The objective of this analysis is to uncover the static structural relationships among XR technology keywords, rather than to model their temporal evolution. Therefore, the results should be interpreted as representing the overall organization of XR technologies across the dataset. We collected the patents related to XR technology from the KIPRIS and USPTO [
50,
51] for XR technology analysis. To analyze the DKM of XR technology, we used the R project and its packages [
16,
17,
47,
48,
54,
55]. All figures were generated with high resolution and carefully designed to ensure readability and clear presentation of the results. This experiment was conducted on the DKM constructed from XR patents. Each row in the DKM represents a patent document, each column represents a keyword representing a sub-technology, and each element represents the frequency of occurrence of that keyword. Due to the general characteristic of patent text data, the DKM is highly sparse and suffers from zero inflation. Preprocessing was performed to remove all zero rows—those with all column values set to zero. In cases where identical keywords were duplicated in columns, suffixes were removed. Then, columns with identical base names were combined to normalize the DKM. This prevented selection errors in the regression model and prevented the problem of identical sub-technology being estimated as fragmented. Additionally, to control for the document length effect, the total occurrence count
was calculated for each document, and
was included as a covariate. This was intended to reduce the confounding effect of increased keyword counts in longer documents, thereby increasing the stability of the estimated conditional association between keywords and technologies. While the two keywords reality and extend were the primary targets of this study, the proposed framework can target any keyword, enabling a multi-faceted exploration of the structure of XR sub-technologies. Each element targeted by DKM is count data, which suffers from overdispersion as the variance is greater than the mean, and zero-inflated data. Therefore, to analyze such zero-inflated data, this study fitted and compared three likelihood-based models, Poisson regression (PR), negative binomial regression (NBR), and zero-inflated negative binomial regression (ZINBR). In this paper, model comparisons were performed based on AIC. A lower AIC indicates a better balance between data fit and complexity. In general, Poisson is disadvantaged in DKM due to its inability to account for overdispersion, while NB often significantly improves AIC by absorbing overdispersion. Furthermore, in cases where there is a structural excess of zeros, ZINB can provide additional improvements over NB. The AIC values for the three models considered in this paper are shown in
Table 1 below.
Table 1 reports the AIC values obtained from three count models for the two target keywords, reality and extend. Since a smaller AIC indicates a better trade-off between goodness of fit and model complexity, the results suggest that NBR provides the best fit for the reality target (AIC = 5389.11), substantially improving over PR (AIC = 5582.91). This reduction implies that the reality counts exhibit meaningful overdispersion, which is not adequately captured by the Poisson assumption (mean–variance equality), whereas the negative binomial likelihood accommodates extra-Poisson variability more effectively. For the extend target, NBR again yields the lowest AIC (AIC = 6257.34), although the difference among models is relatively modest compared to the reality case. Although the ZINB model is designed to account for excess zeros, the results indicate that it does not provide sufficient improvement over the NB model in terms of AIC to justify the additional model complexity in this dataset. This result suggests that the observed overdispersion in the data can be effectively captured by the NB model, and that the contribution of an explicit zero-inflation component may be limited under the current data conditions.
Based on these results, we adopt NBR as the primary model for subsequent inference on technology relatedness via IRR-based interpretation and downstream analyses. That is,
Table 1 presents the AIC values for the three models. Since a lower AIC indicates a better balance between model fit and complexity, the results suggest that the negative binomial model provides the most appropriate fit for the data. This finding indicates that overdispersion is a key characteristic of the XR patent keyword counts and should be explicitly accounted for in the analysis. It is important to note that the objective of model selection in this study is not to optimize predictive performance, but to identify an appropriate statistical model that captures the underlying data characteristics, such as overdispersion and zero inflation. Therefore, likelihood-based criteria such as AIC are used to ensure a statistically coherent model specification.
Table 2 summarizes the parameter estimates for the selected predictor keywords in the count regression model with extend as the response.
The reported estimate values are interpreted as IRRs, because the coefficients were exponentiated,
. Each predictor keyword is coded as a binary presence indicator, that is, 1 if the keyword appears at least once in a patent document and 0 otherwise. Hence, an IRR represents the multiplicative change in the expected count of extend when the corresponding keyword is present, holding all other predictors constant. A key control variable in the model is
, defined as
, where
is the total keyword count in document
d. This covariate adjusts for document length effects, because longer texts tend to generate higher counts across many keywords, which may confound inference on keyword-specific associations. In
Table 2, the IRR for
is 0.5489. Because loglen is included primarily as a normalization control, its coefficient should not be over-interpreted as a technology effect. Rather, its role is to ensure that the IRRs of keywords reflect conditional relationships beyond the trivial effect of document length and overall verbosity. Among the predictors, wall (IRR = 1.6208) and edg (IRR = 1.4900) show the strongest positive associations with extend. Additional large IRRs are observed for connect (1.4119), layer (1.3599), arrang (1.3449), assembl (1.3284), surfac (1.2916), and electr (1.2806). Collectively, these predictors form a coherent theme that emphasizes geometric or structural representation and spatial organization, for example, wall, edge, surface, and layer, together with system integration and connectivity such as connect, electr, assembly, and arrangement. This pattern suggests that extend in XR-related patents is not merely an abstract extension concept, but is closely tied to an implementation layer involving spatial structure, surfaces, and their integration within connected systems. Several additional predictors, such as contact (1.2339), structur (1.2380), face (1.3685), and region (1.2015), indicate that extend frequently co-occurs with terms describing structural composition, contact-based interaction, and region or geometry definitions. In particular, the positive association with face may reflect either face-related sensing/interaction or the use of face in a geometric sense, for example, planar faces of surfaces. This highlights the importance of domain-aware interpretation and, where necessary, checking representative patents to disambiguate semantics. Finally, variables with IRRs close to 1 (or with confidence intervals that approach 1) indicate weaker independent contributions under the multivariable model. Overall,
Table 2 provides evidence that the extend keyword is strongly associated with a sub-technology axis emphasizing spatial or structural representation and connectivity-driven integration, which is relevant for XR technology management because it points to a plausible implementation pathway for extended systems, the coupling of geometry or surfaces with connected components and structural assembly. Next,
Table 3 reports exponentiated parameter estimates for predictor keywords in the model with reality as the response.
As in
Table 2, predictors are binary presence indicators, and IRRs describe the multiplicative change in the expected reality count when a predictor keyword is present, after controlling for
and all other included predictors. The results reveal a markedly different structure from the extend model, highlighting a sub-technology axis that is more closely aligned with XR experience concepts and content or interaction layers. The largest IRRs are observed for virtual (IRR = 3.1558) and augment (2.7976). These effects are substantial and strongly consistent with XR semantics, patents that explicitly mention virtual or augment are much more likely to exhibit higher reality counts. In practical terms, these findings indicate that reality is centrally embedded within the AR/VR conceptual core of XR patents, and that the association remains strong even under multivariable adjustment, suggesting a robust conditional relationship rather than a simple cooccurrence artifact. Beyond the AR or VR core, the positive IRRs for content (1.2896) and environ (1.2327) indicate that reality is frequently coupled with content generation/delivery and environment representation. This aligns with the view that reality in XR patents is expressed not only as an abstract label but in conjunction with the mechanisms that make XR experiences realistic: content pipelines and environmental context modeling. Additional positive associations for view (1.1248), video (1.1386), captur (1.1091), and display (1.0965) further suggest that reality is linked to an end-to-end experience stack, spanning acquisition/capture, media representation, viewpoint specification, and display output. In contrast, certain predictors exhibit IRRs below 1, most notably render (0.7749) and imag (0.8757). These negative conditional associations should not be interpreted as “rendering” or “image processing” being unimportant for XR. Rather, they likely reflect feature competition and wording substitution within patent texts under multivariable adjustment. For example, some patents may emphasize rendering-related terminology instead of using the term reality, leading to a negative conditional association once other AR/VR and content variables are included. Similarly, the relatively weak or slightly negative association for imag may indicate that reality is expressed more through concept-level XR descriptors (virtual/augment/content/environment) than through generic image-processing language, at least within the selected predictor set. Several predictors such as user (0.9407), camera (0.8995), and object (0.9426) are near or below 1, suggesting that reality in this regression specification is less directly tied to sensor/device terms and more strongly tied to the experience/content layer. Nevertheless, these terms may still play important roles in higher-order structures (e.g., bundle analysis or co-occurrence networks), and their influence can also emerge through interactions or different target choices. From a technology management perspective,
Table 3 supports the conclusion that reality is anchored in the XR landscape by the AR or VR conceptual core (augment, virtual) and is operationalized through a content-and-environment pipeline (content, environ, video, captur, view, display). This suggests that future XR innovation and patent strategies centered on “reality” may be most effectively pursued through integrated developments that connect content creation, environmental context modeling, and media capture/display pipelines, rather than focusing narrowly on isolated device or low-level imaging terminology.
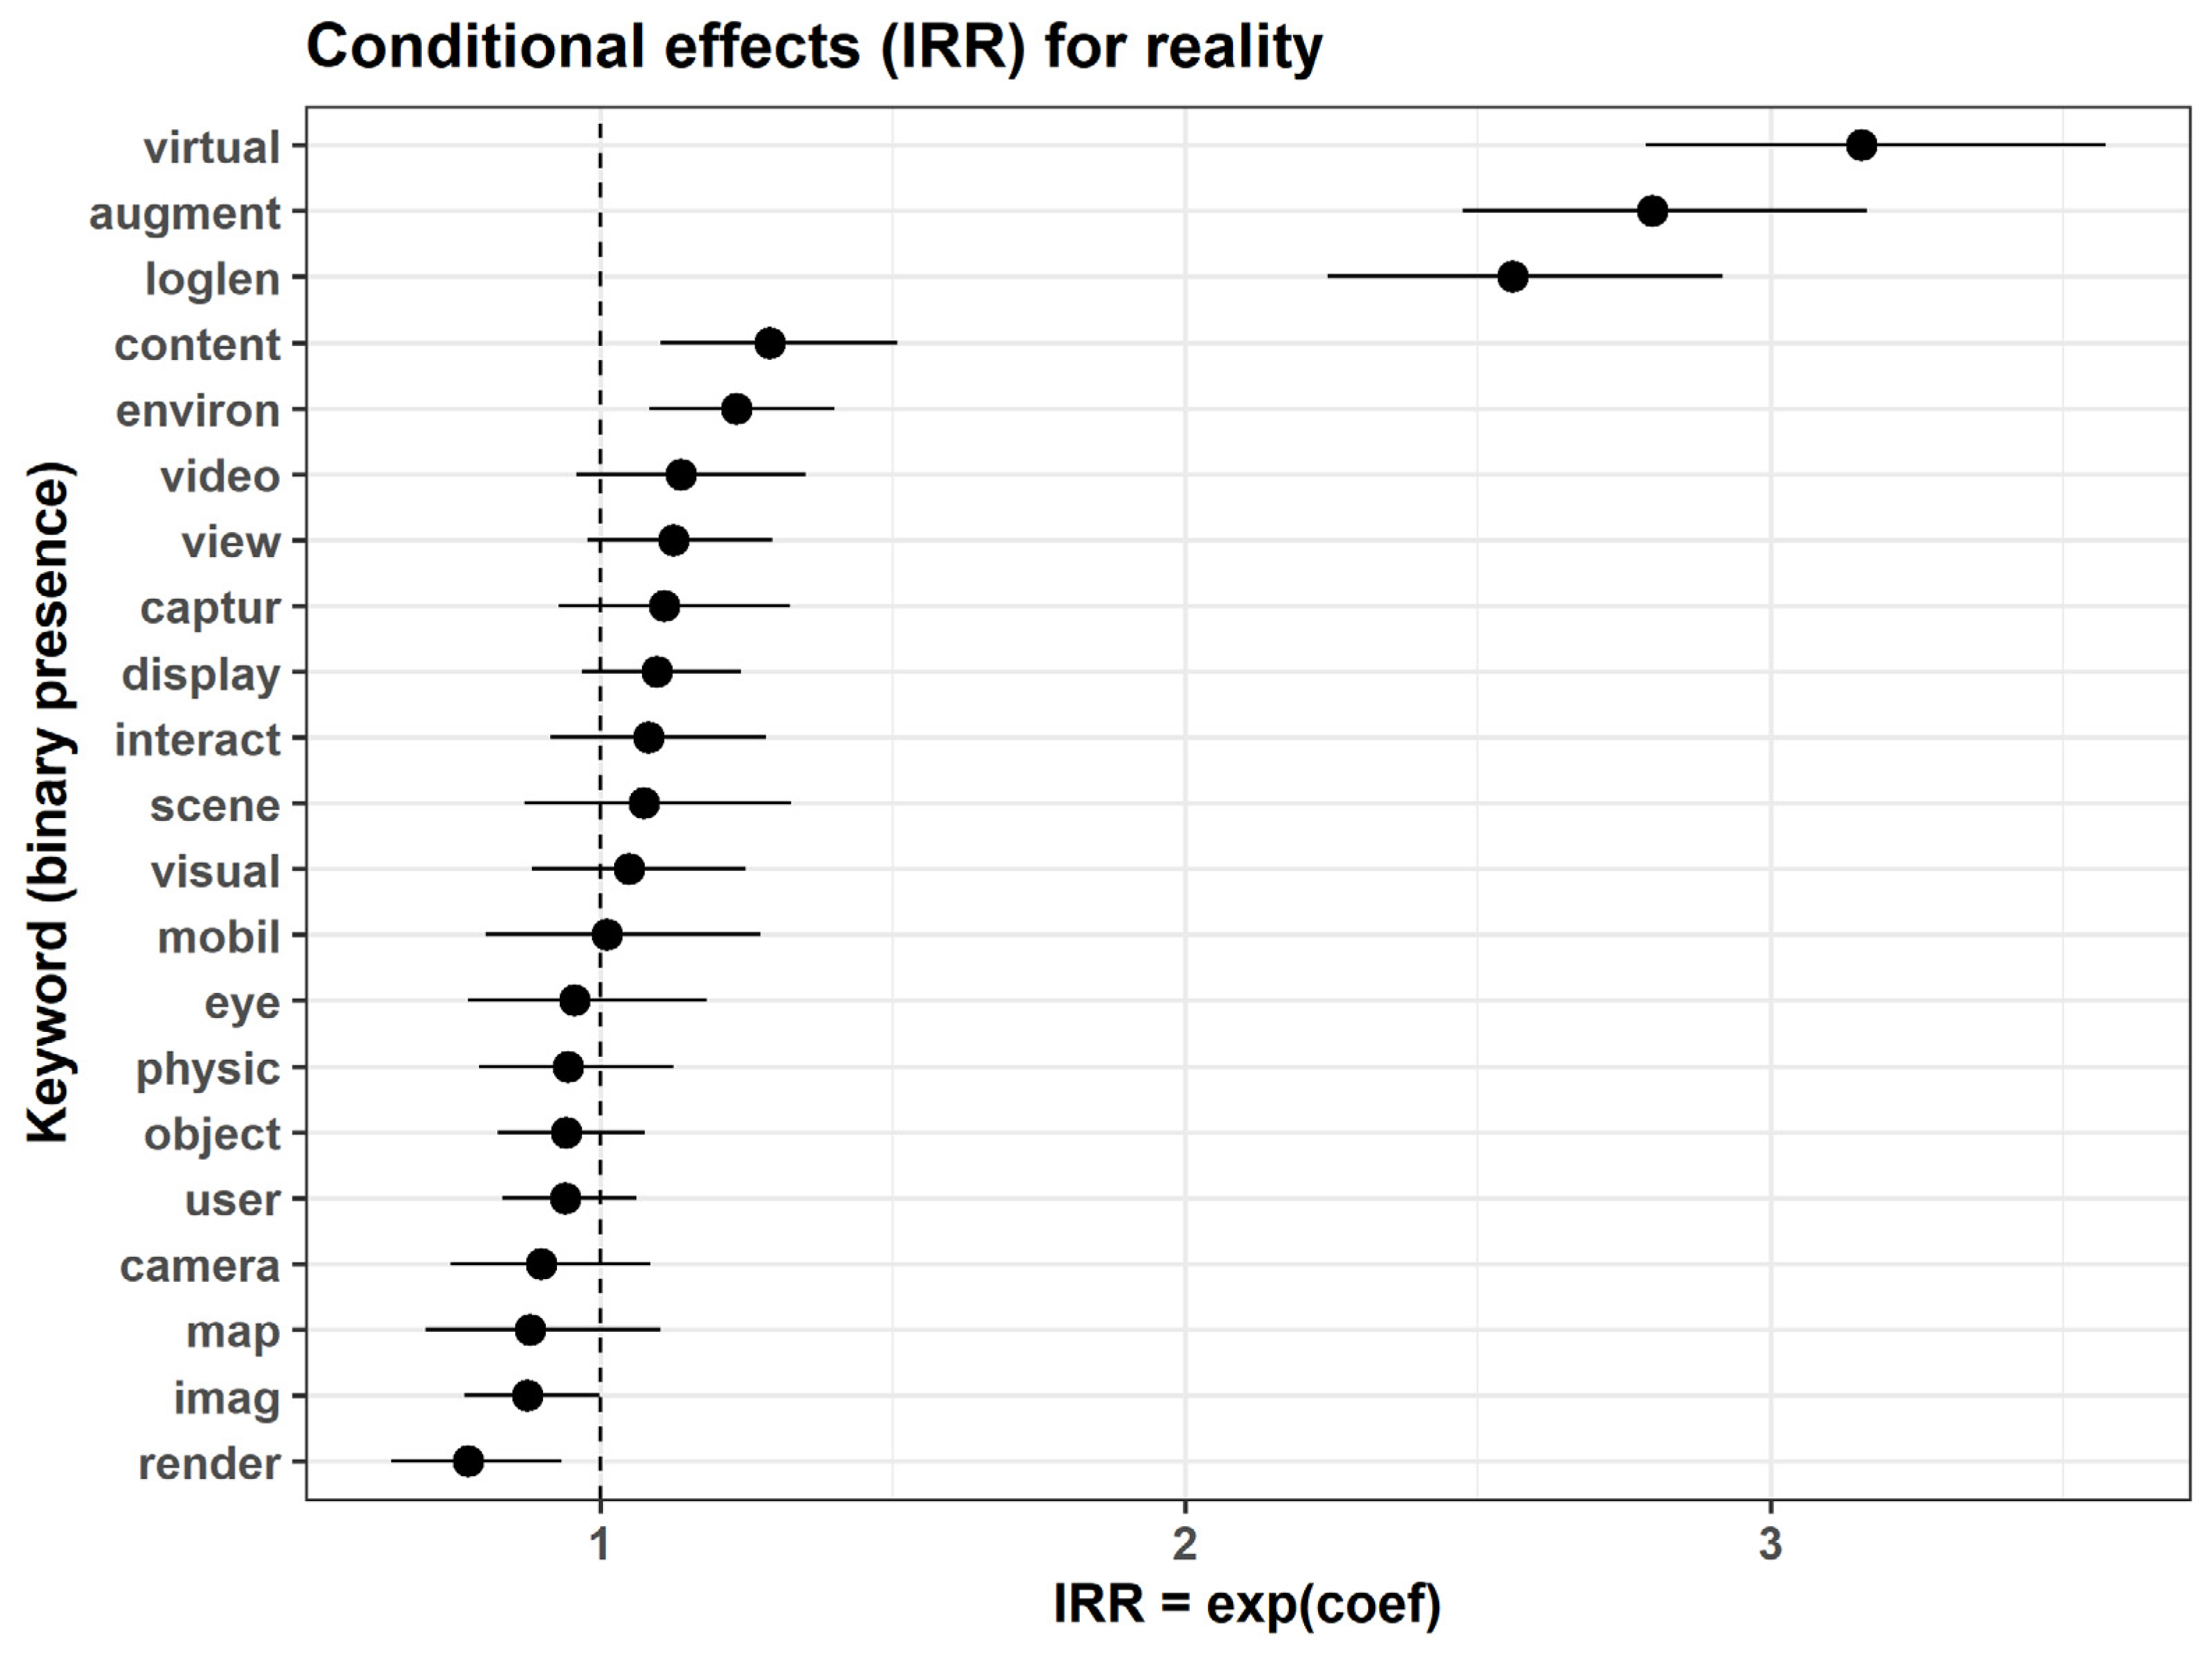
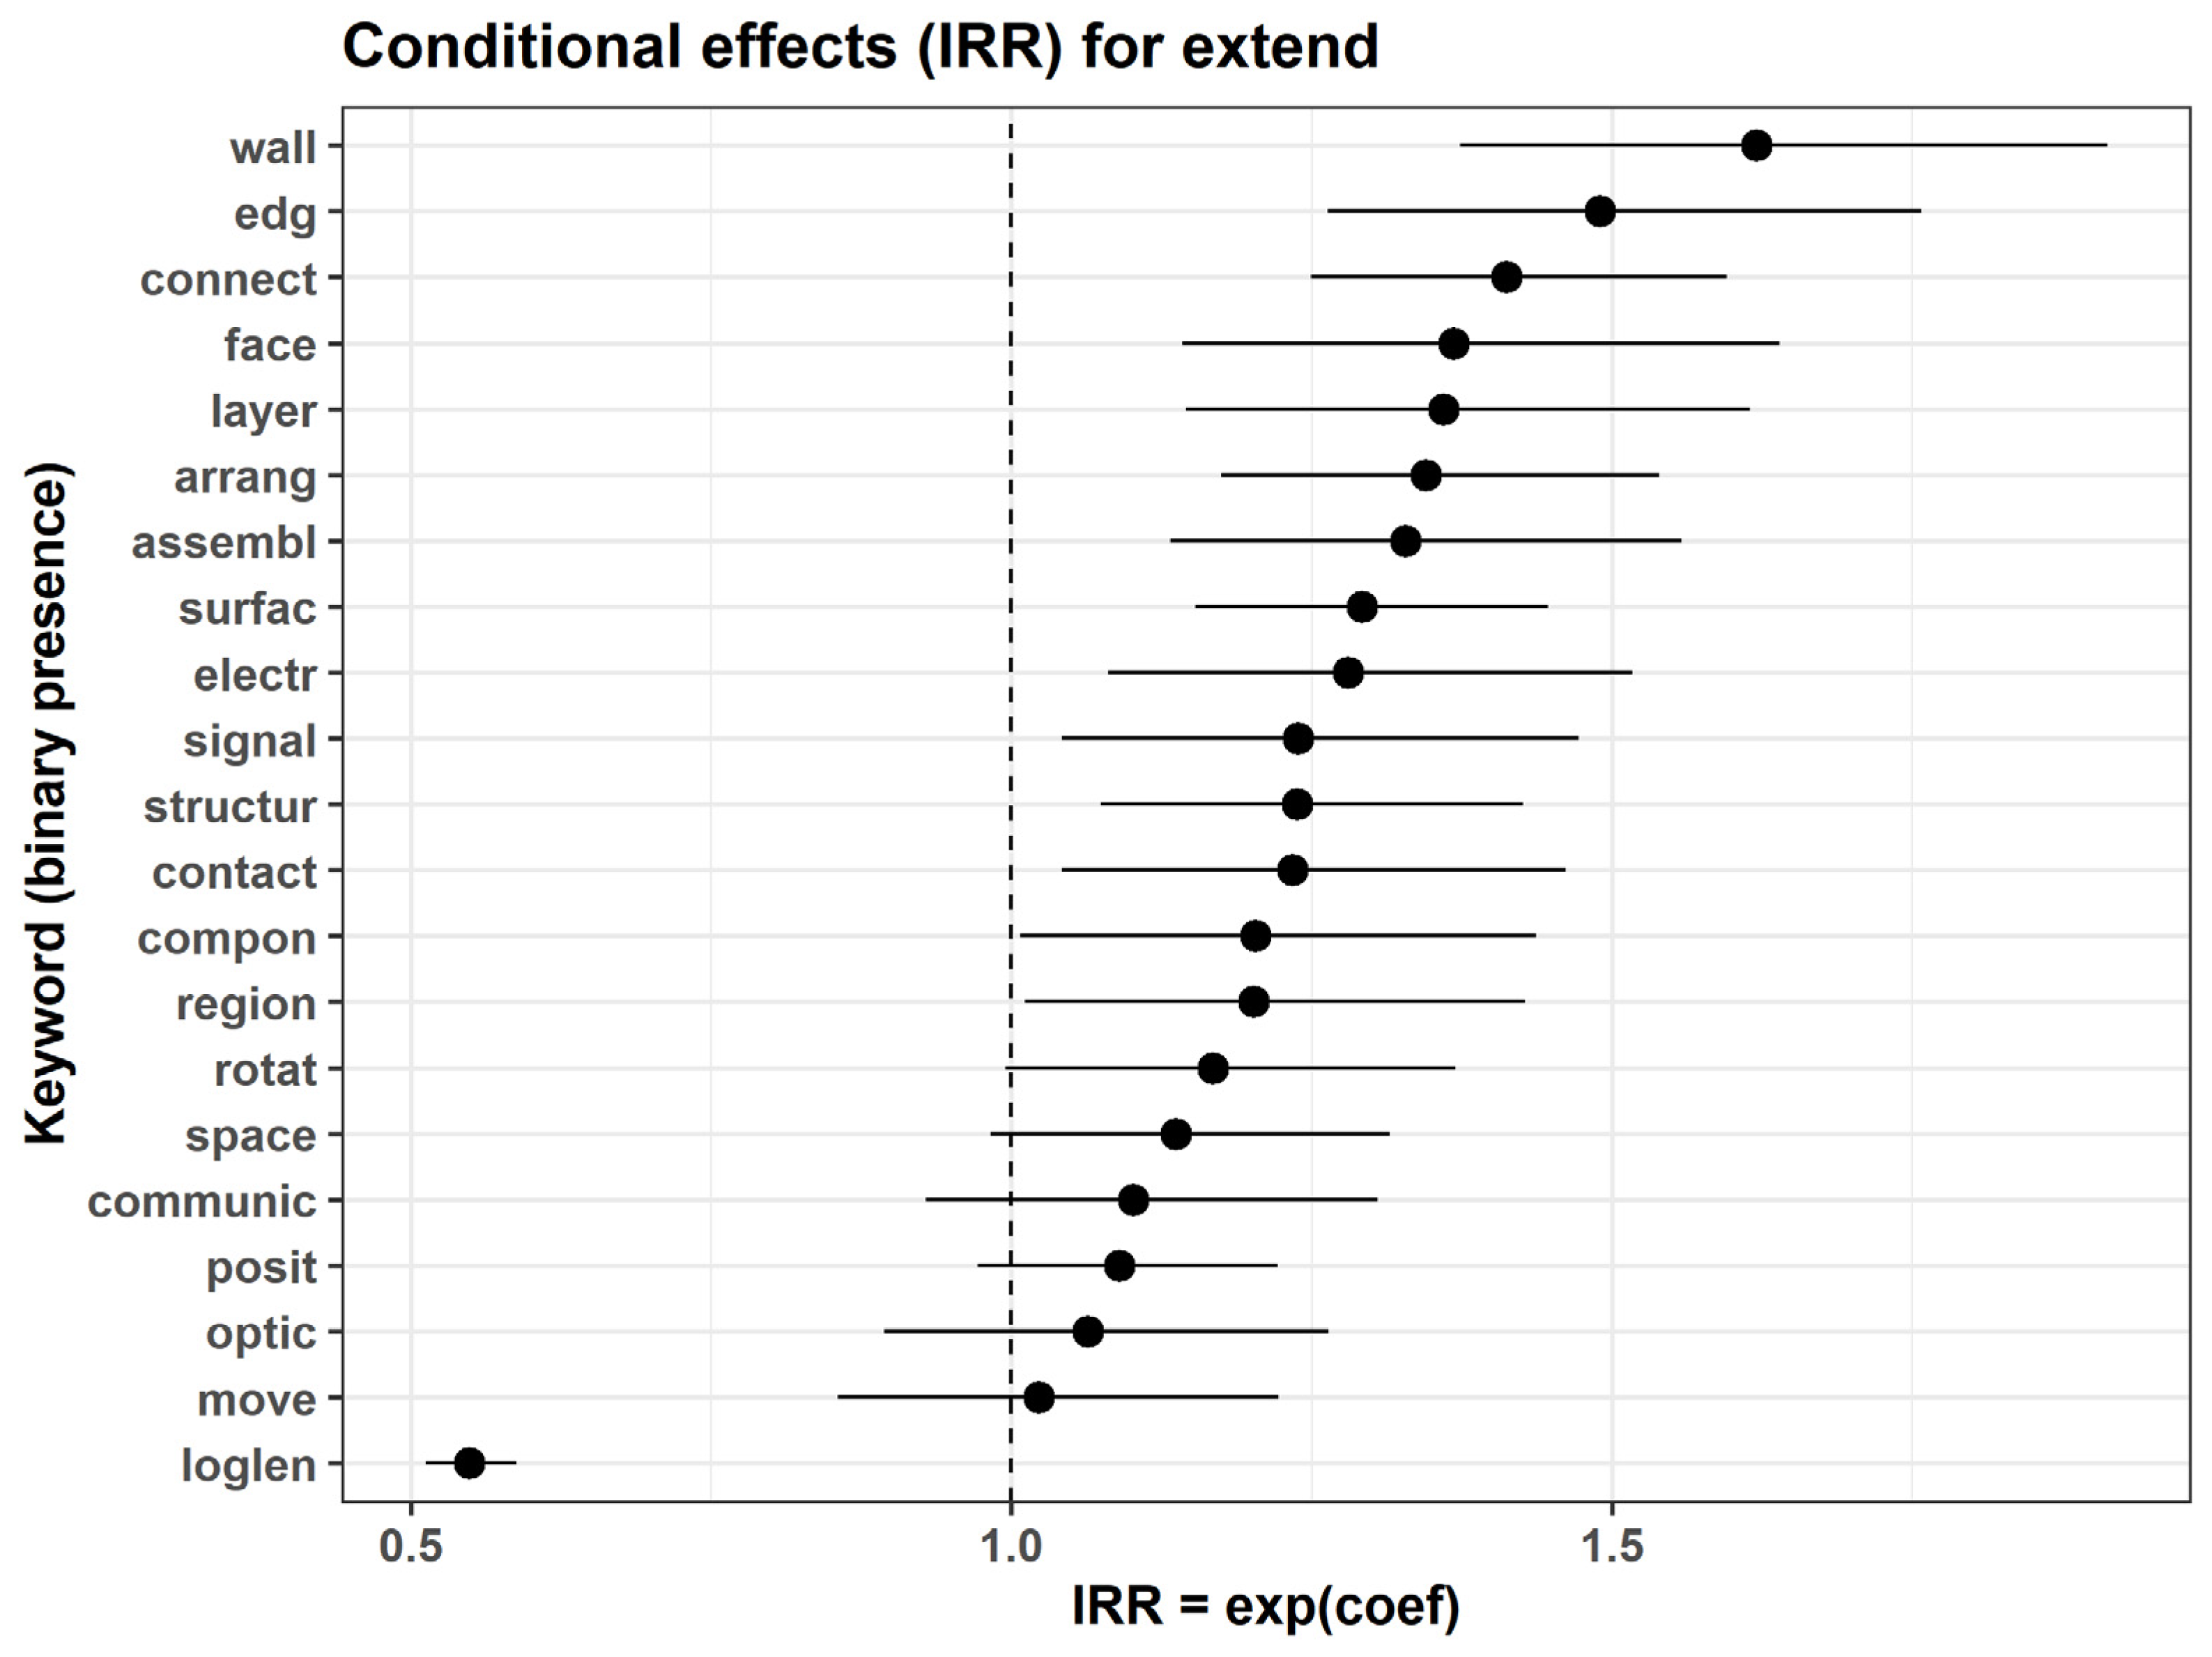
We visualize the conditional effects reported in
Table 2 and
Table 3 using forest plots of the estimated IRRs in
Figure 2 and
Figure 3. In both figures, each dot represents the point estimate of the IRR for a predictor keyword coded as a binary presence indicator, and the horizontal line denotes its 95% confidence interval. The vertical dashed line at IRR = 1 corresponds to no effect on the expected target keyword count. Accordingly, predictors whose confidence intervals lie entirely to the right of 1 indicate a statistically meaningful positive conditional association with the target, whereas those lying to the left indicate a negative conditional association, after adjusting for document length
and the remaining predictors.
Figure 2 shows the conditional effect (IRR) for target keyword extend.
Figure 2 corresponds to
Table 2 and highlights that extend is most strongly associated with structural and integration-related sub-technologies. Specifically, the largest positive effects are observed for wall and edg, followed by connect, layer, arrang, assembl, surfac, and electr, most of which have confidence intervals clearly above 1. This pattern is consistent with
Table 2 and suggests that patents emphasizing boundary or geometry and structural elements such as wall, edge, surface, and layer as well as system-level integration such as connect, electr, assembly, and arrangement tend to exhibit substantially higher expected counts of extend. The plot therefore provides an intuitive structural view that extend is positioned along an XR implementation axis involving spatial structure representation and connectivity-driven integration. In contrast, predictors whose confidence intervals overlap 1, for example, some motion or optics-related terms, show comparatively weaker conditional contributions under the multivariable model. The
term appears as a control covariate rather than a sub-technology keyword, and its inclusion ensures that these IRR estimates represent associations beyond trivial document-length effects. Next, we represent the conditional effects (IRR) for target keyword reality in
Figure 3.
Figure 3 is related to
Table 3 and shows a markedly different profile, centered on XR experience-layer concepts. The strongest positive effects are clearly associated with virtual and augment, whose IRRs are substantially greater than 1 and well separated from the null line. This finding aligns with
Table 3 and indicates that the presence of AR or VR core concepts is the dominant conditional driver of reality counts. Several additional predictors such as content, environ, video, view, captur, and display, tend to lie on or to the right of IRR = 1, supporting the interpretation that reality is closely linked to an end-to-end experience/content pipeline, including environmental context and media acquisition/display components. Conversely, predictors such as render and, to a lesser extent, imag appear with IRRs below 1, suggesting a negative conditional association that may reflect wording substitution and feature competition within multivariable patent text descriptions rather than a literal technological incompatibility. Overall,
Figure 3 provides a compact visualization of the distinct technology axis associated with reality, contrasting with the structural or connectivity emphasis observed for extend in
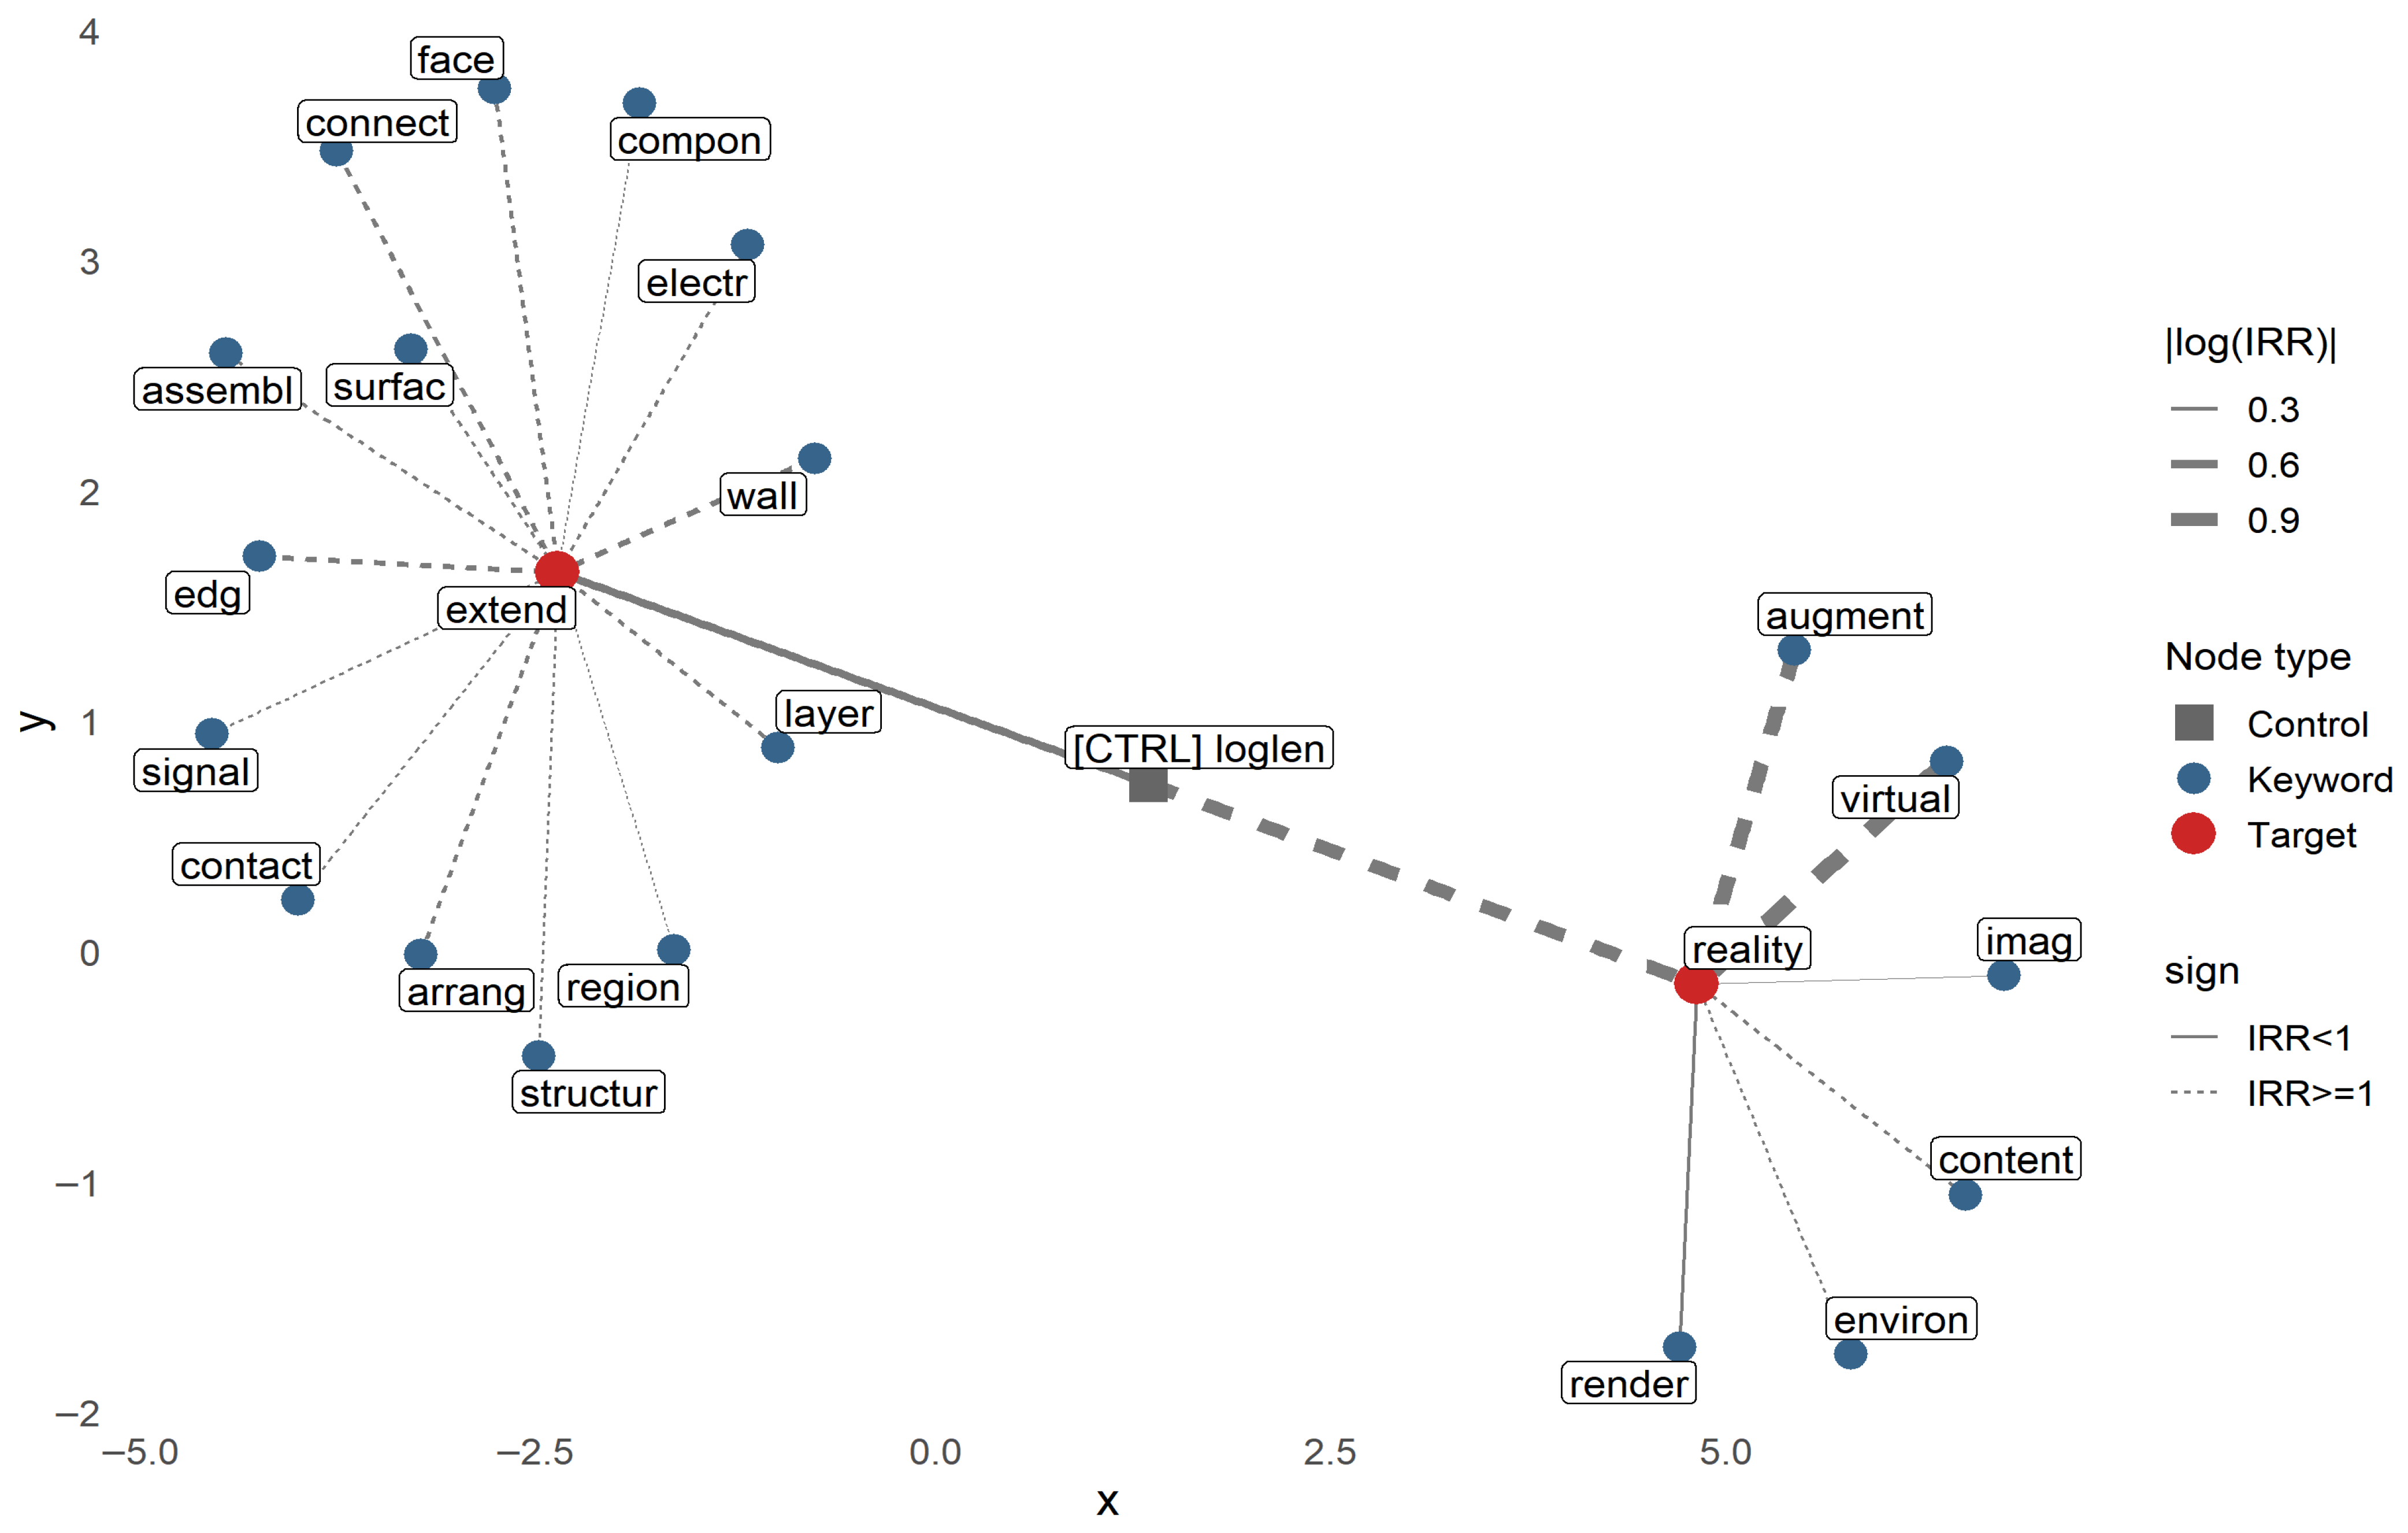
Figure 2. In this context, a technology stack can be interpreted as a set of interrelated sub-technologies that are jointly implemented to deliver XR functionalities. The proposed network analysis enables the identification of such stacks by revealing statistically significant relationships among keywords. We show the technology relatedness network based on significant IRR edges using the previous results as the following figure.
Figure 4 summarizes the XR technology structure by integrating statistically significant relationships derived from the regression models. Specifically, nodes represent keywords, and directed edges indicate significant conditional associations based on IRR estimates. By focusing on statistically validated relationships rather than raw co-occurrence, the network provides a more reliable and interpretable representation of XR sub-technology structure. The construction of this network follows directly from the inference pipeline summarized in
Table 2 and
Table 3, and visualized in
Figure 2 and
Figure 3. Specifically, for each target keyword of extend and reality, we fitted likelihood-based count models and reported exponentiated coefficients as IRRs, which quantify the multiplicative change in the expected target count when a predictor keyword is present, after controlling for document length
and other predictors.
Figure 2 and
Figure 3 displayed these IRRs and their confidence intervals as forest plots, enabling a clear identification of predictors whose conditional effects are consistently above or below the null line IRR = 1.
Figure 4 then integrates these results by retaining only statistically significant IRR edges and representing them as directed links from predictor sub-technologies to the target concepts, with edge thickness proportional to
and edge type indicating the sign of association
. In doing so,
Figure 4 converts coefficient level evidence into an interpretable structural map of XR sub-technologies.
A key conclusion from
Figure 4 is that the XR patent landscape in this dataset exhibits a dual-axis sub-technology structure anchored by two qualitatively different target concepts. The extend-centered cluster is dominated by keywords such as wall, edg, surfac, layer, structur, and integration-related terms including connect and electr. This configuration, consistent with
Table 2 and
Figure 2, indicates that extend is primarily associated with an implementation and integration layer of XR, emphasizing geometric or spatial structure representation, surface or edge modeling, component arrangement/assembly, and connectivity. In contrast, the reality-centered cluster, consistent with
Table 3 and
Figure 3, is driven by virtual and augment as the strongest predictors, alongside experience-layer and pipeline-related terms such as content, environ, and media or view-related descriptors. This pattern positions reality within an experience and content layer, where value creation is mediated by virtualization/augmentation, content generation, and environmental context representation. Importantly, the separation of these clusters suggests that XR patents operationalize extended reality not as a single monolithic technology, but as a layered stack in which distinct families of sub-technologies play different roles.
Figure 4 also clarifies the role of
as a control covariate rather than a sub-technology. Its placement between the two target neighborhoods reflects that document length is a global source of variation that can influence keyword counts broadly. However, by explicitly controlling for
in the regression framework, the network edges represent conditional relationships beyond trivial verbosity effects. Consequently, the observed contrast between the extend and reality neighborhoods is unlikely to be an artifact of document length and is instead indicative of meaningful, model-supported structure in the XR technology space. The network in
Figure 4 provides a statistically grounded interpretation of XR sub-technology relatedness. Relatedness here is not defined by raw cooccurrence alone; rather, it reflects conditional association under multivariable adjustment. This distinction is important for technology analysis because it reduces spurious correlations driven by long documents or common background terms. The strong extend links to structural and connectivity terms imply that patents emphasizing spatial structure and system integration constitute a coherent sub-technology family. Conversely, the strong reality links to AR or VR core descriptors and content or environment terms imply another coherent family centered on immersive experience. The resulting map can therefore serve as an interpretable taxonomy for XR sub-technologies, where keywords are not only grouped by frequency but also by statistically validated relationships to central concepts. Although explicit time information is not required for the present inference,
Figure 4 suggests a practical approach to technology prediction in the sense of identifying likely future integration directions. A natural prediction is that competitive innovation will increasingly occur at the interfaces between the two axes, namely where experience/content pipelines must be tightly coupled with robust spatial structure representation and system integration. From a patent strategy perspective, this implies that future high-impact XR inventions may not lie solely within the core AR or VR concept layer or solely within the structural integration layer, but in their systematic combination. Therefore, combinations that bridge the reality cluster, for example, virtual, augment, content, and environ, with the extend cluster such as surfac, layer, edg, and connect can be interpreted as promising white-space directions for R&D and intellectual property (IP) exploration, particularly if they are underrepresented in current patents despite their conceptual complementarity. The dual-axis structure supports a portfolio strategy that differentiates between experience-layer R&D and implementation/integration-layer R&D, while actively investing in cross-layer integration capabilities. For example, firms specializing in content and immersive user experience may strengthen their competitive position by partnering with or acquiring capabilities in spatial structure modeling and connectivity integration. Conversely, firms with strengths in hardware integration and spatial structure representation may gain strategic advantage by integrating advanced content pipelines and environment modeling into their platforms. In both cases,
Figure 4 provides a data-driven rationale for defining XR R&D roadmaps around bundles rather than isolated keywords, and for prioritizing cross-cluster integration as a key innovation lever. From a service and deployment standpoint, the reality neighborhood aligns naturally with XR service experiences such as immersive content delivery, virtual environments, and interaction-centric applications, whereas the extend neighborhood aligns with XR system robustness and scalability such as structured spatial mapping, device configuration, connectivity and integration. This implies that end user XR services will be most competitive when they achieve both high-quality immersive experience and reliable spatial or system integration. Consequently, XR service providers may interpret the two clusters as two complementary design requirements, first, experience fidelity and content-environment richness, and second, stable spatial representation and integrated system operation.
In addition,
Figure 4 demonstrates that the proposed analysis framework, combining likelihood-based count modeling with IRR interpretation and network synthesis, yields a transparent and reproducible technology map that is robust to the sparsity and zero-inflation properties of patent DKM. Unlike purely descriptive cooccurrence graphs, the presented network is explicitly grounded in a statistical model that controls for document length and isolates conditional associations. This strengthens the evidential basis of the extracted XR technology structure and supports more credible downstream decisions in technology management, including sub-technology taxonomy design, integration forecasting, and strategic white space exploration. In summary, the integrated evidence from
Table 2 and
Table 3,
Figure 2 and
Figure 3, and the network in
Figure 4 indicates that XR patents in this dataset are organized around two major sub-technology axes: an AR or VR experience-and-content axis anchored by reality, and a structure and integration axis anchored by extend. The most actionable innovation opportunities are likely to emerge from cross axis integration, providing clear guidance for future XR technology forecasting, R&D prioritization, and service-oriented system design.
From a practical perspective, these findings provide valuable insights for metaverse developers. The identified dual-axis structure suggests that innovative XR systems are likely to emerge from the integration of experience-oriented components such as virtual, augment, content, environment with structure and connectivity-oriented components related to surface, layer, edge, and connect. Therefore, the developers can use this framework to identify promising technology stacks by focusing on combinations that bridge these two axes. While predictive evaluation methods such as cross-validation and out-of-sample testing can provide additional insights, they are not the primary focus of this study. The proposed framework emphasizes interpretability and structural understanding of technology relationships rather than predictive accuracy. A more detailed assessment of zero-inflation mechanisms, including formal statistical tests such as the Vuong test and residual diagnostics, may provide additional insights into the relative suitability of NB and ZINB models. However, such analyses are beyond the scope of the present study. Incorporating temporal information may provide additional insights into how XR technologies evolve over time. However, such analysis would require dynamic modeling frameworks and is beyond the scope of the present study.
6. Conclusions
This study presented a patent-driven technology analysis framework for XR that combines likelihood-based count modeling with interpretable network synthesis to map sub-technology structure from a sparse DKM. Using keyword counts extracted from XR patent documents as proxies for XR sub-technologies, we addressed the fundamental challenge that patent DKM is highly sparse and often exhibits excess zeros and overdispersion, which can degrade the reliability of conventional text-mining pipelines when applied without an explicit count data perspective. Methodologically, we modeled target keyword counts under Poisson, Negative Binomial, and Zero-Inflated Negative Binomial specifications using generalized linear mixed modeling and selected models via RMSE, complemented by simulation-based residual diagnostics. The results consistently indicated that the Negative Binomial model provided the most appropriate balance between fit and complexity for the analyzed targets, implying that overdispersion is a dominant feature of the XR patent DKM and should be accounted for in statistical inference. We then interpreted exponentiated coefficients as IRRs to quantify conditional technology relatedness, and translated statistically significant IRR effects into a technology relatedness network that provides an intuitive, structurally grounded view of XR sub-technologies.
Empirically, the integrated evidence from coefficient tables, forest plots, and the relatedness network revealed a clear dual-axis organization of XR technologies in this dataset. The target reality was anchored in an AR or VR experience-and-content axis characterized by strong associations with core concepts such as virtual and augment, and reinforced by content and environment pipeline terms. In contrast, the target extend was embedded in a structure-and-integration axis characterized by spatial or structural representation and system integration terms such as surfac, layer, edg, and connect. This separation suggests that XR patents operationalize extended reality as a layered technology stack rather than a single monolithic domain, with distinct sub-technology families corresponding to experience layer versus implementation or integration layer innovation. From a technology management perspective, the derived structure supports actionable guidance for XR R&D and IP strategy. First, the conditional relatedness network provides a statistically grounded taxonomy for identifying core sub-technology clusters and bridge components. Second, the dual-axis structure suggests that high-impact innovation opportunities are likely to arise at cross-axis interfaces, where immersive experience and content pipelines are coupled with robust spatial structure representation and system integration. Accordingly, portfolio design and R&D planning may benefit from bundling sub-technologies into coherent development tracks, experience or content vs. structure or integration, while prioritizing integration projects that connect these tracks. Moreover, the framework naturally supports white space exploration by highlighting underrepresented but conceptually complementary combinations that warrant targeted patent landscaping and expert review.
This work has several limitations that motivate future research. The current analysis is based on keyword counts from titles and abstracts; incorporating richer text fields and stronger normalization of synonyms and multiword expressions may improve semantic fidelity. In addition, the present dataset does not explicitly encode time, which restricts direct temporal forecasting; future work may extend the framework by integrating publication years and adopting dynamic count models to quantify sub-technology evolution. Finally, while IRR-based relatedness provides interpretable conditional associations, causal interpretations should be avoided; additional validation using external metadata such as assignees, international patent classification classes, or citation networks would further strengthen managerial insights. Overall, this study demonstrates that combining statistically principled count modeling with interpretable network synthesis offers a practical and reproducible approach for XR patent technology analysis under sparsity and zero inflation. The proposed framework provides an evidence-based map of XR sub-technologies, clarifies the structural separation between experience or content and structure or integration layers, and offers concrete implications for technology forecasting, R&D prioritization, and service-oriented XR system design.
Future research can extend the proposed framework in several directions. First, incorporating temporal information such as patent filing years would enable dynamic analysis of XR technology evolution and facilitate technology forecasting using time-aware models. Second, recent advances in large language models (LLMs) offer promising opportunities for improving keyword extraction, semantic representation, and contextual understanding of patent texts, which can further enhance the quality of document–keyword matrices. Third, graph-based deep learning methods, such as graph neural networks (GNNs), can be applied to model complex relationships among XR sub-technologies beyond pairwise associations. In addition, future studies may incorporate predictive performance evaluation across statistical and machine learning models, using metrics such as cross-validation error and out-of-sample likelihood, to complement the interpretability-focused approach of this study. Finally, integrating additional patent metadata, such as assignees, classification codes, and citation networks, would enable more comprehensive and multi-dimensional XR technology analysis. Recent advances in large language models (LLMs) provide promising opportunities for improving patent text analysis. In particular, LLMs can enhance keyword extraction, semantic representation, and contextual understanding of patent documents, which may complement the count-based modeling framework proposed in this study. Integrating LLM-based approaches with statistically grounded methods represents an important direction for future research. Another future research task may incorporate formal model comparison procedures, such as the Vuong test, as well as detailed diagnostics to distinguish structural and sampling zeros, in order to further investigate the role of zero-inflation in patent-derived count data.