Article

The Use of Different Technologies to Provide a Virtual Grocery Store Tour for Nutrition Education

Department of Food Science and Human Nutrition, Iowa State University, Ames, IA 50312, USA
*
Author to whom correspondence should be addressed.
Virtual Worlds 2025, 4(2), 21; https://doi.org/10.3390/virtualworlds4020021
Submission received: 20 February 2025 / Revised: 9 May 2025 / Accepted: 15 May 2025 / Published: 22 May 2025

Abstract

Dietitian-led grocery store tours (GSTs) educate consumers about nutrition. Virtual GSTs could increase access to nutrition education. A feasibility study was conducted to determine participant acceptability and their physiological responses to a virtual GST using immersive virtual reality (IVR), a desktop monitor (PC), or a tablet. Participants were asked to report to the laboratory on three occasions to view a virtual GST. Physiological measurements were collected, and participants completed questionnaires about their feelings of presence, nausea, mood, and enjoyment during the virtual GST. Participants experienced a greater sense of presence (IVR = 5.8, PC = 2.6, tablet = 2.6; p < 0.05) with a greater feeling of nausea (IVR = 1.7, PC = 0.4, tablet = 0.4; p < 0.05) in the IVR treatment. Participants enjoyed the IVR GST more than the tablet GST (IVR = 5.3, PC = 4.6, tablet = 4.1; p < 0.05). There were marginal effects of treatment on heart rate (p < 0.05) but not on other physiological measures. There were no differences in the participants’ willingness to recommend a virtual GST given the use of different technologies to a friend or in the participants’ reported mood. Virtual GSTs, using different technologies, may be a feasible approach to provide nutrition education

1. Introduction

Poor dietary choices are linked to an increased risk of several chronic diseases, including cardiovascular disease [1], cancer [2], type 2 diabetes [3], and obesity [4]. Globally, poor dietary habits have been attributed to eleven million premature deaths and 255 million disability-adjusted life years [5]. In the United States, dietary guidelines recommend reducing energy, saturated fat, trans-fat, and sodium intake while increasing consumption of whole grains, fiber, fruits, and vegetables [6]. In 2020, 51.9% of all U.S. food expenditures were for food consumed at home, such as from supermarkets or grocery stores [7], suggesting that improving food choices in these settings could have a significant impact on diet quality.
A grocery store tour (GST) is defined as “the dissemination of nutrition information and/or shopping strategies by an educator to a small group of individuals while moving from aisle to aisle within a market that sells a wide variety of food products” [8]. GSTs deliver education in the same context where participants make food decisions, which may improve knowledge retention and application [9]. They can also be tailored to meet the needs of diverse populations, such as individuals with specific health conditions or at certain life stages (e.g., diabetes, heart disease, food allergies, parents, or athletes). While some studies report positive health outcomes, a systematic review concluded that further research is needed to determine long-term effectiveness and best practices [8,10,11,12,13].
An alternative to in-person GSTs is to create a virtual grocery store tour accessible via any internet-connected device. This approach could greatly expand access, allowing individuals to participate at their convenience from any location. Virtual GSTs can incorporate supplemental materials such as videos and animations to enhance engagement and support comprehension. Although the evidence for gamification is limited, it may help promote learning and should be explored further [14]. Importantly, virtual tours can be revisited multiple times, enabling users to review sections based on their interests or attention span. Nutrition educators could also quickly customize tours to meet specific client needs.
While virtual GSTs can be experienced using several different technologies (e.g., PC, tablet or smartphone), an intriguing technology is immersive virtual reality, which may provide additional benefits over other technologies. IVR creates an increased sense of presence, which is the feeling of actually being in the virtual scene [15,16]. An increased sense of presence enhances user experience in IVR simulations [17] and is associated with increased task engagement and performance [18,19,20]. Crucially, increased presence may also improve learning outcomes [20]. However, Maransky et al. [21] found that while participants enjoyed IVR more, they learned less, possibly due to increased cognitive load, which reduced the capacity to learn. Understanding the differences in feelings of presence between different mediums used to provide virtual GSTs may aid in the development of IVR GSTs. At this time, there is no widely accepted measure of presence, although questionnaires [22,23] and physiological measures such as heart rate, heart rate variability, skin conductance, skin temperature, or electroencephalograms [24,25,26] are generally used.
A potentially serious drawback with IVR is cybersickness, which may limit its usefulness. Cybersickness is a constellation of symptoms or discomfort produced by exposure to virtual reality [27,28] and arises from a mismatch between observed and expected sensory information [29]. These symptoms include vomiting, fainting, dizziness, tiredness, blurred vision or sweating [30]. It has been reported that 80% of people experiencing virtual reality exhibit cybersickness symptoms and these may last for up to 5 h post immersion [31]. An increase in cybersickness also results in a reduction in the sense of presence [32], which may negate the advantages of IVR. Consequently, if an IVR GST leads to feelings of cybersickness, this could outweigh any benefits that this approach may confer.
While the use of virtual worlds as an education tool has gained increased attention [33,34,35], little work has been conducted to develop virtual GSTs. The objective of this present study was to identify broad differences between the mediums in terms of user experience to provide data that aid in the design of future studies. In this present study, the participants experienced three identical virtual GSTs using either a tablet, PC monitor, or IVR headset. The sense of presence (determined using a questionnaire and physiological measures), feelings of cybersickness, enjoyment of the tour and mood were measured.

2. Materials and Methods

All subjects gave their written informed consent for inclusion before they participated in the study. The study was conducted in accordance with the Declaration of Helsinki, and the protocol was approved by the Ethics Committee of Iowa State University (IRB 21-078-00) on 4 June 2021. Participants were recruited from the local community via word-of-mouth or email. Individuals interested in this study were invited to attend a screening session to determine their eligibility for the study. Participants were recruited subject to the following inclusion criteria: aged 18–65 years. Potential participants were excluded from this study if they suffered from motion sickness, had a history of seizures or epilepsy or had a chronic disease. If a participant was eligible for this study, they were randomized to a treatment order.

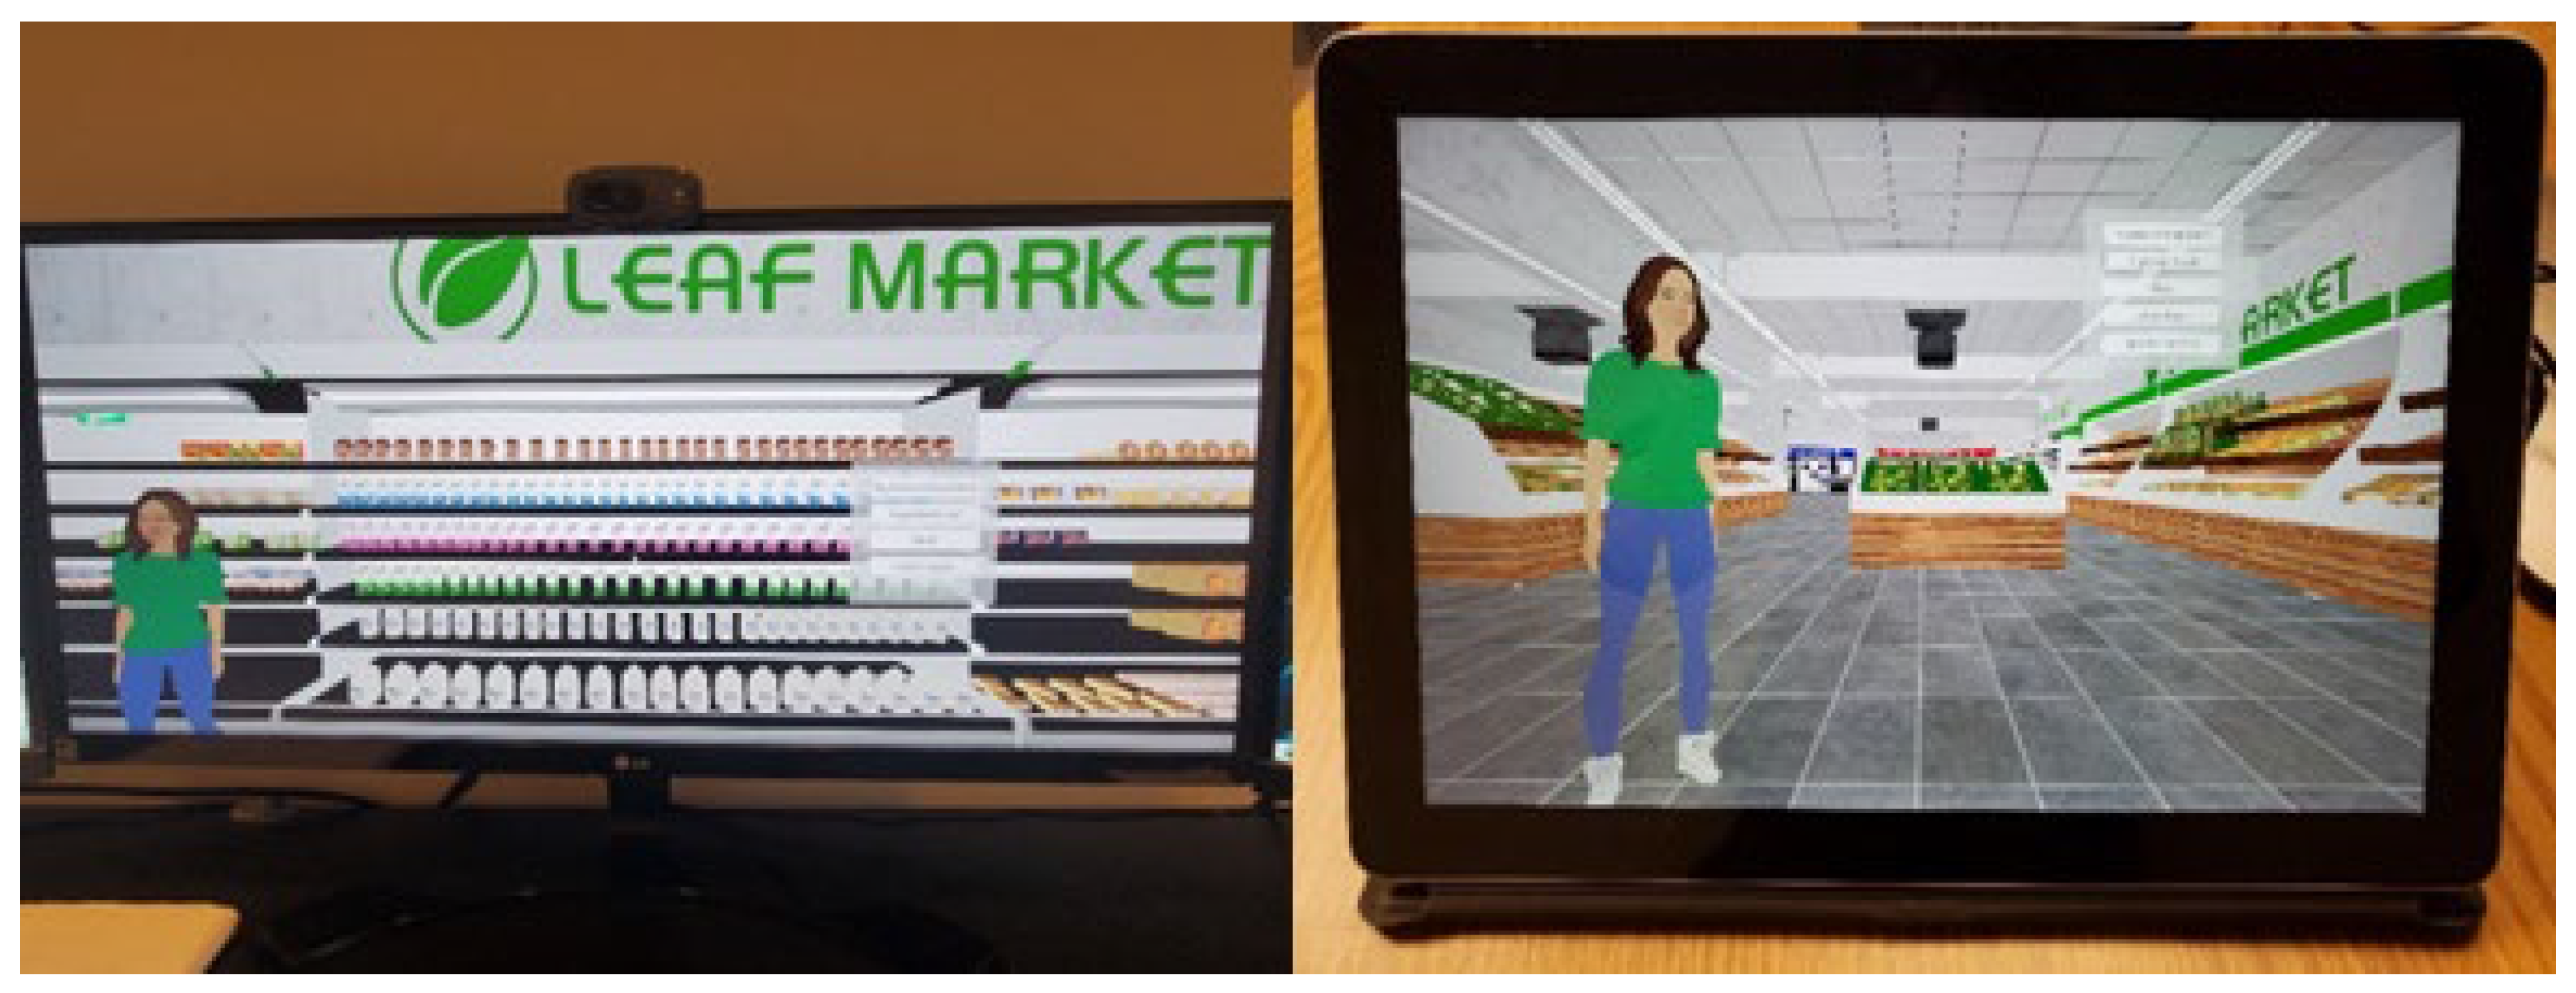
2.1. The Virtual Grocery Store Tour

For this present study, a 3D digital model of a grocery store was purchased from Turbosquid (www.turbsquid.comFigure 1) and imported into the Unity game engine (Unity Technologies, San Francisco, CA, USA). The supermarket was populated with 3D models of foods purchased from Turbosquid or the Unity Asset Store (https://assetstore.unity.com/—accessed on 30 October 2020). The grocery store tour was developed to run on a tablet or PC (Figure 2). The PC version was experienced using either a desktop monitor or an IVR headset.
An avatar was created using Unity Multipurpose Avatar version 2, which is available from the Unity Asset Store (https://assetstore.unity.com/packages/3d/characters/uma-2-unity-multipurpose-avatar-35611 accessed on 14 May 2025). For this present study, the avatar was a young female (Figure 2) that represented the person who recorded the voiceovers. The MP3 that was recorded was linked to the avatar by using Salsa Lip Synch Suite (Crazy Minnow Studio, www.crazyminnowstudio.com accessed on 14 May 2025). Salsa Lip Synch Suite is a Unity asset that is used to provide lip synch approximation with a recorded soundtrack. A full description of the development of this grocery store tour is provided in a previous paper [36].

2.2. Equipment

For the tablet condition, participants viewed the GST on a Microsoft Surface Go (Microsoft, Redmond, WA, USA). For the PC condition, participants viewed the GST on a Dell 21-inch desktop monitor connected to a Dell Alienware Aurora PC (Dell USA, Round Rock, TX, USA). For the immersive virtual reality condition, participants viewed the GST using an HTC Vive Headset (HTC Corporation, Taoyuan City, Taiwan) connected to the Dell Alienware PC (Dell USA, Round Rock, TX, USA). An Empatica wristband (Empatica, Boston, MA, USA) was used to measure heart rate, skin conductance, and skin temperature.

2.3. Questionnaires

Before the study commenced, all participants completed a questionnaire that collected information about their demographics, self-reported height and weight and use of computer technology. Following the completion of each test session, the participants completed a questionnaire that was based on the System Useability Scale with five domain-specific questions added to rate the usability of the GSTs on a 10-point scale [37]. The questions posed are provided in Table 1. Following each test session, participants completed the validated Slater-Usoh-Steed questionnaire regarding their sense of presence in the virtual scenes [38]. Responses were captured on a 7-point scale. The questions posed are provided in Table 2 (with physiological markers of presence provided in Table 3). Prior to and immediately following each session, participants rated their mood using a subset of the Visual Analogue Mood Scales (sad, tired, energetic, happy) [39,40] with additional items (boredom, amusement, frustration, calm, anxiety) chosen to capture affective states elicited by immersion (e.g., [41]). The questions posed are listed in Table 4. Responses to these questions were captured on a 100 mm visual analogue scale. Following each test session, participants completed the validated. All surveys were completed using Qualtrics Surveys (Qualtrics Xm, Seattle, WA, USA).

2.4. Procedure

Upon being accepted into the study, participants were randomized to a treatment order. Participants were required to report to the laboratory on three separate occasions at a time convenient for them. Upon reporting to the laboratory, the participant completed a baseline mood questionnaire. Then, an Empatica E4 wristband was placed on the participant’s non-dominant wrist and they were asked to sit quietly for 10 min while baseline physiological measurements were taken.
Then, the participant viewed the virtual GST using either the tablet, a desktop monitor or an IVR headset. The participant was asked to watch the tour in its entirety and was not allowed to pause the tour. The tour lasted approximately 20 min. At the end of the virtual GST, the wristband and headset (when used) were removed, and they were asked to complete a questionnaire about their sense of presence in the virtual GST, their mood and how usable they found the software. They were then allowed to leave the laboratory. The total duration of the study was approximately forty-five min.

2.5. Statistical Analysis

All statistical analysis was conducted using SPSS v26, (IBM, Armonk, NY, USA). Medians and interquartile ranges (IQRs) were calculated for all variables. A Shapiro–Wilk test was conducted to determine if the data were normally distributed. Due to deviations from normality, a non-parametric Freidman test was used to determine between-treatment differences in the participants’ responses to the questionnaires and their physiological responses. Post hoc analysis with Wilcoxon’s signed-rank test was conducted with a Bonferroni correction applied, resulting in a significance level set at p < 0.017.

3. Results

3.1. Demographics

The study group was 100% female and predominantly white (12/13 participants). Most were undergraduate students (12/13 participants) and were aged less than 25 years. The mean body mass index of the group was 25.2 kg/m2. Most of the participants (11/13) had used immersive virtual reality a little or a moderate amount, and all participants used a computer regularly.

3.2. Usability Questionnaire

Table 1 provides details of the usability questionnaire. Participants reported a difference in their enjoyment of the program (χ = 11.056, p < 0.05). Post hoc analysis indicated that the participants enjoyed the IVR medium more than the tablet or PC (p < 0.017). There were no other statistically significant differences.

3.3. Presence

Table 2 provides information about the feelings of presence reported by the participants when experiencing the GST using different mediums. There was a statistically significant difference in the participants’ sense of being in the supermarket, χ2 = 20.039, p < 0.05. Post hoc analysis revealed that participants had a higher sense of presence in the IVR conditions compared to the tablet conditions (p < 0.017). There was a statistically significant difference in the participants’ feeling that the supermarket was ‘reality’ for them, χ2 = 18.957, p < 0.05. Post hoc analysis revealed that participants had a higher sense of presence in the IVR conditions compared to the tablet conditions (p < 0.017). When asked “do you think of the supermarket more as images that you saw, or more as somewhere that you visited?”, the participants reported a statistically significant difference between the treatments, χ2 = 16.909, p < 0.05. Post hoc analysis revealed that participants had a higher sense of presence in the IVR conditions (p < 0.017). When asked “During the time of the experience, which was strongest on the whole, your sense of being in the supermarket, or of being elsewhere?”, the participants reported a statistically significant difference between the treatments, χ2 = 19.244, p < 0.05. Post hoc analysis revealed that participants had a higher sense of presence in the IVR conditions (p < 0.017). There was a statistically significant difference between treatments when answering the question “Consider your memory of being in the supermarket. How similar in terms of the structure of the memory is this to the structure of the memory of other places you have been today?”, χ2 = 7.538, p < 0.05. Post hoc analysis revealed that participants had a higher sense of presence in the IVR conditions (p < 0.017). There was a statistically significant effect of treatment on feelings of nausea or dizziness, χ2 = 13.520, p < 0.05. Post hoc analysis revealed that participants had a higher sense of presence in the IVR conditions (p < 0.017). When asked “Please rate the extent to which you were aware of background sounds in the laboratory in which this experience was actually taking place”, there was a statistically significant difference between treatments, χ2 = 8.600, p < 0.05. Post hoc analysis revealed that participants had a higher sense of presence in the IVR conditions (p < 0.01).
Table 3 provides details of changes in physiological measures during the treatment period. There was a statistically significant main effect of treatment on the change in heart rate, χ2 = 8.600, p < 0.05. However, the post-hoc analysis did not find a significant difference between treatments. There were no statistically significant differences between treatments for skin conductance or skin temperature.

3.4. Changes in Mood

Table 4 provides participant responses to the mood questionnaire. No statistically significant changes in mood were reported between the treatments.

4. Discussion

The virtual GST provided in this study was developed by a Registered Dietitian who has considerable experience conducting GSTs in physical supermarkets. In this present study, the virtual GST was preset and non-interactive (that is, while participants could jump to various parts of the store the avatar communicated pre-recorded information). However, there is no reason why virtual GSTs could not be synchronous with where a dietitian can lead a live GST to one or more clients in a virtual supermarket. This would provide new avenues to communicate nutrition information. Moreover, it would mean that GSTs could be given at more convenient times and would not require people to travel. Virtual GSTs may also be more efficient. In addition to not having to travel, individuals ‘transport’ immediately to various parts of the store without the requirement to walk. This may reduce the amount of time taken to provide a tour. Further research is required to understand the possible efficiency savings of providing a virtual GST to both nutrition professionals and consumers and to determine effective practices to develop virtual GSTs. It would be particularly interesting to see if gamification techniques could be used to increase user engagement and enjoyment.
Virtual GSTs provide the opportunity for new approaches to delivering information (including videos, pictures, demonstrations), which may increase participant enjoyment and useability. It is essential that users find virtual GSTs useable and enjoyable if they are to repeatedly use the software. In this present study, participants reported that they found the IVR treatment more enjoyable than the tablet or PC, although the difference was modest. There were no other differences in the participants’ rated usability of the software. The participants in this study were relatively young and regularly used computer technology, and further studies are required to determine if different demographic groups find the software equally useable.
In this present study, participants felt a greater sense of presence in the IVR tour than the PC or tablet tours. However, it was not possible to blind participants to the study protocol. Therefore, participants may have guessed the purpose of the study and provided responses to the questionnaires that they believed the researchers were looking for [42]. An alternative approach is to use physiological measures as a marker of presence. Several potential markers have been suggested, including heart rate, heart rate variability, skin conductance or skin temperature [43]. In this present study, heart rate, skin conductance and skin temperature were measured. While there was a statistically significant effect of the treatment on heart rate (PC being lower than tablet or IVR), this was a very modest effect. In addition, there was no effect of treatment on EDA or skin temperature. Further work is required to determine if the feeling of presence increases the amount of information retained during a virtual GST. Moreover, it is vital to determine if virtual GSTs, provided using different mediums, have any differential effects on consumer purchasing behavior over the long-term.
A potentially significant problem with IVR is that it can create feelings of cybersickness. It has been hypothesized that cybersickness arises from a mismatch between sensory information modalities (e.g., the eyes report motion where the vestibular system reports no motion) [44]. However, good design practices can minimize this effect. In this present study, there was a modest increase in cybersickness, but the scene was relatively benign with movements between sections being several minutes apart. However, the study group was young and several had experience with virtual reality headsets. Further studies need to be completed using a diverse group of participants to determine if IVR causes cybersickness in different groups. Moreover, how much time people can spend in a virtual GST before experiencing cybersickness should be determined. In addition to cybersickness, wearing a VR headset for extended periods of time may be uncomfortable. In this present study, participants wore a headset for approximately 20 min and did not report a change in their mood. Again, further studies with a more diverse study group are required to determine if virtual headsets are comfortable for all groups and the length of time they can be worn.

5. Limitations

This study has several limitations which must be highlighted. First, the study group was small and was not diverse. The aim of this study was to establish the feasibility of using virtual GSTs (and identify any large problems with each of the approaches), and bigger studies are required to obtain more robust results and to determine how different demographic groups respond to the different mediums of providing a GST. Second, this study only examined usability, presence and mood changes while experiencing a virtual GST. Future studies need to determine if there are differences between groups in the ability of a virtual GST to facilitate learning and information retention. Third, the mood questionnaire was not validated, and these data should be treated with caution.

6. Conclusions

To inform future study design, participants experienced three identical virtual GSTs via a tablet, PC monitor, and IVR headset while we measured presence, cybersickness, enjoyment, and mood. While participants enjoyed the IVR version more than the tablet and desktop monitor versions, they reported higher levels of dizziness and nausea after the IVR GST. Participants reported a higher sense of presence when in the IVR GST with a minor change in heart rate between the treatments. There was no difference in skin temperature or conductance. There was no change in the participants’ mood after experiencing the virtual GSTs. However, an increase in feelings of nausea and dizziness was noted in the IVR treatment. These data suggest that different technological mediums could be used to provide virtual GSTs, but further research is required to determine if they are effective methods of educating consumers. Moreover, it is essential to determine if the IVR causes unacceptable levels of cybersickness that would limit its usefulness compared to using non-immersive virtual GSTs.

7. Implications

Although the IVR conditions produced modestly higher levels of cybersickness, they also yielded a substantially greater sense of presence—a factor consistently linked to deeper engagement, contextual learning, and improved retention in virtual environments [16,20,21]. Virtual reality uniquely recreates the spatial and sensory context of a real supermarket and supports naturalistic navigation and interactivity, features that other formats cannot match. When paired with best-practice design to minimize nausea (e.g., stable camera paths, ample rest intervals), these educational benefits justify the further development of immersive VR as a medium for grocery store nutrition education despite its cybersickness challenges.

Author Contributions

Conceptualization, J.H.H. and S.W.; methodology, J.H.H., J.S. and S.W.; software development, J.H.H.; investigation, J.S., S.W. and J.H.H.; resources, J.H.H.; writing—original draft preparation, J.H.H., J.S. and S.W.; writing—review and editing, J.H.H., J.S. and S.W.; supervision, J.H.H.; project administration, J.H.H. All authors have read and agreed to the published version of the manuscript.

Funding

This research received no external funding.

Institutional Review Board Statement

The study was conducted in accordance with the Declaration of Helsinki and approved by the Institutional Review Board (or Ethics Committee) of Iowa State University (IRB 21-0278-00) on 4 June 2021.

Informed Consent Statement

Informed consent was obtained from all subjects involved in the study.

Data Availability Statement

The data presented in this study are available on request from the corresponding author. The data are not publicly available due to lack of participant consent to make the data publicly available.

Conflicts of Interest

The authors declare no conflicts of interest.

References

  1. Petersen, K.S.; Kris-Etherton, P.M. Diet Quality Assessment and the Relationship between Diet Quality and Cardiovascular Disease Risk. Nutrients 2021, 13, 4305. [Google Scholar] [CrossRef] [PubMed]
  2. Key, T.J.; Bradbury, K.E.; Perez-Cornago, A.; Sinha, R.; Tsilidis, K.K.; Tsugane, S. Diet, nutrition, and cancer risk: What do we know and what is the way forward? BMJ 2020, 368, m511. [Google Scholar] [CrossRef] [PubMed]
  3. Schwingshackl, L.; Hoffmann, G.; Lampousi, A.-M.; Knüppel, S.; Iqbal, K.; Schwedhelm, C.; Bechthold, A.; Schlesinger, S.; Boeing, H. Food groups and risk of type 2 diabetes mellitus: A systematic review and meta-analysis of prospective studies. Eur. J. Epidemiol. 2017, 32, 363–375. [Google Scholar] [CrossRef] [PubMed]
  4. Rouhani, M.H.; Haghighatdoost, F.; Surkan, P.J.; Azadbakht, L. Associations between dietary energy density and obesity: A systematic review and meta-analysis of observational studies. Nutrition 2016, 32, 1037–1047. [Google Scholar] [CrossRef]
  5. Collaborators, G.D. Health effects of dietary risks in 195 countries, 1990–2017: A systematic analysis for the Global Burden of Disease Study 2017. Lancet 2019, 393, 1958–1972. [Google Scholar]
  6. Liu, J.; Micha, R.; Li, Y.; Mozaffarian, D. Trends in Food Sources and Diet Quality Among US Children and Adults, 2003–2018. JAMA Netw. Open 2021, 4, e215262. [Google Scholar] [CrossRef]
  7. Zeballos, E.; Sinclair, W.U.S. Food-at-Home Spending Surpasses Food-Away-from-Home Spending in 2020. 20 August 2021. Available online: https://www.ers.usda.gov/data-products/chart-gallery/gallery/chart-detail/?chartId=58364 (accessed on 2 November 2024).
  8. Nikolaus, C.J.; Muzaffar, H.; Nickols-Richardson, S.M. Grocery Store (or Supermarket) Tours as an Effective Nutrition Education Medium: A Systematic Review. J. Nutr. Educ. Behav. 2016, 48, 544–554.e1. [Google Scholar] [CrossRef]
  9. Jung, S.E.; Shin, Y.H.; Niuh, A.; Hermann, J.; Dougherty, R. Grocery store tour education programme promotes fruit and vegetable consumption. Public Health Nutr. 2019, 22, 2662–2669. [Google Scholar] [CrossRef]
  10. Carson, J.A.S.; Hedl, J.J. Smart shoppers tours: Outcome evaluation. J. Nutr. Educ. 1998, 30, 323–331. [Google Scholar] [CrossRef]
  11. Crawford, S.M.; Kalina, L. The shop smart tour. J. Nutr. Educ. 1993, 25, 100B. [Google Scholar] [CrossRef]
  12. Sadler, M.J.; Fine, G.; Richards, S.; Read, L. Healthy heart store tours–A useful communication tool? Nutr. Bull. 2003, 28, 179–186. [Google Scholar] [CrossRef]
  13. Bunce, D.M.; EFlens, A.; Neiles, K.Y. How Long Can Students Pay Attention in Class? A Study of Student Attention Decline Using Clickers. J. Chem. Educ. 2010, 87, 1438–1443. [Google Scholar] [CrossRef]
  14. Dichev, C.; Dicheva, D. Gamifying education: What is known, what is believed and what remains uncertain: A critical review. Int. J. Educ. Technol. High. Educ. 2017, 14, 9. [Google Scholar] [CrossRef]
  15. Slater, M.; Wilbur, S. A framework for immersive virtual environments (FIVE): Speculations on the role of presence in virtual environments. Presence Teleoperators Virtual Environ. 1997, 6, 603–616. [Google Scholar] [CrossRef]
  16. Cheng, L.-K.; Chieng, M.-H.; Chieng, W.-H. Measuring virtual experience in a three-dimensional virtual reality interactive simulator environment: A structural equation modeling approach. Virtual Real. 2014, 18, 173–188. [Google Scholar] [CrossRef]
  17. Emma-Ogbangwo, C.; Cope, N.; Behringer, R.; Fabri, M. Enhancing user immersion and virtual presence in interactive multiuser virtual environments through the development and integration of a gesture-centric natural user interface developed from existing virtual reality technologies. In Proceedings of the HCI International 2014-Posters’ Extended Abstracts: International Conference, HCI International 2014, Heraklion, Greece, 22–27 June 2014; Proceedings, Part I 16; Springer: Berlin/Heidelberg, Germany, 2014. [Google Scholar]
  18. Slater, M.; Frisoli, A.; Tecchia, F.; Guger, C.; Lotto, B.; Steed, A.; Pfurtscheller, G.; Leeb, R.; Reiner, M.; Sanchez-Vives, M.V.; et al. Understanding and realizing presence in the Presenccia project. IEEE Comput. Graph. Appl. 2007, 27, 90–93. [Google Scholar] [CrossRef]
  19. Ochs, C.A. Sonderegger, The interplay between presence and learning. Front. Virtual Real. 2022, 3, 742509. [Google Scholar] [CrossRef]
  20. Lønne, T.F.; Karlsen, H.R.; Langvik, E.; Saksvik-Lehouillier, I. The effect of immersion on sense of presence and affect when experiencing an educational scenario in virtual reality: A randomized controlled study. Heliyon 2023, 9, e17196. [Google Scholar] [CrossRef]
  21. Makransky, G.; Terkildsen, T.S.; Mayer, R.E. Adding immersive virtual reality to a science lab simulation causes more presence but less learning. Learn. Instr. 2019, 60, 225–236. [Google Scholar] [CrossRef]
  22. Witmer, B.G.; Singer, M.J. Measuring Presence in Virtual Environments: A Presence Questionnaire. Presence Teleoperators Virtual Environ. 1998, 7, 225–240. [Google Scholar] [CrossRef]
  23. Schwind, V.; Knierim, P.; Haas, N.; Henze, N. Using Presence Questionnaires in Virtual Reality. In Proceedings of the 2019 CHI Conference on Human Factors in Computing Systems, Glasgow, UK, 4–9 May 2019; Association for Computing Machinery: Glasgow, UK, 2019; p. 360. [Google Scholar]
  24. Insko, B.E. Measuring presence: Subjective, behavioral and physiological methods. In Being There: Concepts, Effects and Measurements of User Presence in Synthetic Environments; IOS Press: Amsterdam, The Netherlands, 2003; pp. 109–119. [Google Scholar]
  25. Kober, S.E.; Neuper, C. Using auditory event-related EEG potentials to assess presence in virtual reality. Int. J. Hum.-Comput. Stud. 2012, 70, 577–587. [Google Scholar] [CrossRef]
  26. Oliver, J.H.; Hollis, J.H. Virtual Reality as a Tool to Study the Influence of the Eating Environment on Eating Behavior: A Feasibility Study. Foods 2021, 10, 89. [Google Scholar] [CrossRef]
  27. Stanney, K.M.; Kennedy, R.S.; Drexler, J.M. Cybersickness is not simulator sickness. In Proceedings of the Human Factors and Ergonomics Society Annual Meeting; SAGE Publications Sage CA: Los Angeles, CA, USA, 1997. [Google Scholar]
  28. Rebenitsch, L.; Owen, C. Review on cybersickness in applications and visual displays. Virtual Real. 2016, 20, 101–125. [Google Scholar] [CrossRef]
  29. LaViola, J.J., Jr. A discussion of cybersickness in virtual environments. ACM Sigchi Bull. 2000, 32, 47–56. [Google Scholar] [CrossRef]
  30. Cobb, S.V.; Nichols, S.; Ramsey, A.; Wilson, J.R. Virtual reality-induced symptoms and effects (VRISE). Presence Teleoperators Virtual Environ. 1999, 8, 169–186. [Google Scholar] [CrossRef]
  31. Nichols, S. Physical ergonomics of virtual environment use. Appl. Ergon. 1999, 30, 79–90. [Google Scholar] [CrossRef]
  32. Weech, S.; Kenny, S.; Barnett-Cowan, M. Presence and Cybersickness in Virtual Reality Are Negatively Related: A Review. Front. Psychol. 2019, 10, 158. [Google Scholar] [CrossRef]
  33. Porat, E.; Shamir-Inbal, T.; Blau, I. Teaching prototypes and pedagogical strategies in integrating Open Sim-based virtual worlds in K-12: Insights from perspectives and practices of teachers and students. J. Comput. Assist. Learn. 2023, 39, 1141–1153. [Google Scholar] [CrossRef]
  34. Suh, I.; McKinney, T.; Siu, K.-C. Current Perspective of Metaverse Application in Medical Education, Research and Patient Care. Virtual Worlds 2023, 2, 115–128. [Google Scholar] [CrossRef]
  35. Ahuja, A.S.; Polascik, B.W.; Doddapaneni, D.; Byrnes, E.S.; Sridhar, J. The digital metaverse: Applications in artificial intelligence, medical education, and integrative health. Integr. Med. Res. 2023, 12, 100917. [Google Scholar] [CrossRef]
  36. Lanningham-Foster, L.; Wolff, M.; Woodall, S.; Hollis, J.H. The Development of Virtual Worlds as a Tool for Providing Virtual Grocery Store Tours. Dietetics 2022, 1, 54–65. [Google Scholar] [CrossRef]
  37. Brooke, J. SUS: A quick and dirty usability scale. Usability Eval. Ind. 1995, 189, 4–7. [Google Scholar]
  38. Slater, M.; Usoh, M.; Steed, A. Taking steps: The influence of a walking technique on presence in virtual reality. ACM Trans. Comput.-Hum. Interact. (TOCHI) 1995, 2, 201–219. [Google Scholar] [CrossRef]
  39. Stern, R.A.; Arruda, J.E.; Hooper, R.G.; Wolfner, G.; Morey, C. Visual analogue mood scales to measure internal mood state in neurologically impaired patients: Description and initial validity evidence. Aphasiology 1997, 11, 59–71. [Google Scholar] [CrossRef]
  40. Arruda, J.E.; Stern, R.A.; Somerville, J.A. Measurement of mood states in stroke patients: Validation of the Visual Analog Mood Scales. Arch. Phys. Med. Rehabil. 1999, 80, 676–680. [Google Scholar] [CrossRef]
  41. Felnhofer, A.; Kothgassner, O.D.; Schmidt, M.; Heinzle, A. -.K.; Beutl, L.; Hlavacs, H.; Kryspin-Exner, I. Is virtual reality emotionally arousing? Investigating five emotion-inducing virtual park scenarios. Int. J. Hum.-Comput. Stud. 2015, 82, 48–56. [Google Scholar] [CrossRef]
  42. Orne, M.T. On the social psychology of the psychological experiment: With particular reference to demand characteristics and their implications. Am. Psychol. 1962, 17, 776. [Google Scholar] [CrossRef]
  43. Halbig, A.; Latoschik, M.E. A Systematic Review of Physiological Measurements, Factors, Methods, and Applications in Virtual Reality. Front. Virtual Real. 2021, 2, 694567. [Google Scholar] [CrossRef]
  44. Souchet, A.D.; Lourdeaux, D.; Burkhardt, J.-M.; Hancock, P.A. Design guidelines for limiting and eliminating virtual reality-induced symptoms and effects at work: A comprehensive, factor-oriented review. Front. Psychol. 2023, 14, 1261103. [Google Scholar]
Figure 1. The start screen of the 3D supermarket model used in this present study.
Virtualworlds 04 00021 g001
Figure 2. The virtual GST displayed on a tablet and PC monitor.
Virtualworlds 04 00021 g002
Table 1. Results from the usability questionnaire completed by the participants. Results are presented as medians and interquartile ranges. A Freidman test was used to determine differences between treatments. Post hoc analysis with Wilcoxon’s signed-rank test was conducted with a Bonferroni correction applied. See reference [37].
Tablet (Median (IQR))PC (Median (IQR))IVR (Median (IQR))Test Statistic
Overall, how did you enjoy the nutrition education program?4.0 (2.0–5.0)4.0 (3.0–5.0)5.0 (4.5–5.5)χ = 11.056, p < 0.05
I think that I would like to use this nutrition education program frequently.3.0 (2.0–4.0)3.0 (1.5–4.5)4.0 (2.0–5.0)χ = 2.098, p > 0.05
I found the nutrition education program unnecessarily complex.1.0 (0.0–2.0)1.0 (0.0–2.0)1.0 (0.0–2.0)χ = 0.162, p > 0.05
I think that I would need the support of a technical person to be able to use this nutrition education program. 1.0 (0.0–2.0)1.0 (0.0–1.5)2.0 (0.0–5.0)χ = 1.152, p > 0.05
I found the various functions in the nutrition education program were well integrated4.0 (3.5–5.0)5.0 (4.5–5.0)5.0 (4.5–6.0)χ = 5.905, p > 0.05
I thought there was too much inconsistency in this nutrition education program.1.0 (0.5–2.0)1.0 (0.5–2.0)1.0 (0.0–2.5)χ = 0.950, p > 0.05
I would imagine that most people would learn to use this nutrition education program very quickly. 6.0 (5.0–6.0)5.0 (5.0–6.0)6.0 (5.5–6.5)χ = 3.267, p > 0.05
I found the nutrition education program very cumbersome to use.2.0 (0.0–4.0)1.0 (0.5–4.0)2.0 (1.0–4.5)χ = 1.756, p > 0.05
How convincing did you find the nutrition education information provided?5.0 (4.0–7.0)5.0 (5.0–6.5)6.0 (5.0–6.0)χ = 0.056, p > 0.05
How interesting did you find the nutrition education information provided?5.0 (3.5–5.5)5.0 (5.0–6.0)5.0 (4.5–6.0)χ = 4.412, p > 0.05
How comfortable were you during the nutrition education program?5.0 (5.0–6.0)6.0 (5.0–6.5)6.0 (5.0–6.0)χ = 3.846, p > 0.05
On a scale of 1–10, how likely are you to recommend this nutrition education program to a friend or colleague?6.0 (3.0–7.5)7.0 (7.0–8.0)6.0 (4.5–8.5)χ = 9.053, p < 0.05
Table 2. Participant responses to the presence questionnaire. Results are presented as median and interquartile range. A Freidman test was used to determine differences between treatments. Post hoc analysis with Wilcoxon’s signed-rank test was conducted with a Bonferroni correction applied. See reference [38].
QuestionTablet (Median (IQR))PC (Median (IQR))IVR (Median (IQR))Test Statistic
Please rate your sense of being in the supermarket.3.0 (2.0–3.5)2.0 (1.0–4.5)6.0 (5.0–7.0)χ2 = 20.039, p < 0.05
To what extent were there times during the experience when the supermarket was the reality for you?2.0 (0.5–3.5)1.0 (0.0–3.5)5.0 (4.5–6.0)χ2 = 18.957, p < 0.05
When you think back about your experience, do you think of the supermarket more as images that you saw, or more as somewhere that you visited?2.0 (1.0–2.0)1.0 (1.0–2.5)5.0 (3.0–6.0)χ2 = 16.909, p < 0.05
During the time of the experience, which was strongest on the whole, your sense of being in the supermarket, or of being elsewhere?2.0 (0.5–2.5)2.0 (0.5–4.0)5.0 (4.5–6.0)χ2 = 19.244, p < 0.05
Consider your memory of being in the supermarket. How similar in terms of the structure of the memory is this to the structure of the memory of other places you have been today?2.0 (1.5–4.5)2.0 (1.0–4.5)4.0 (3.0–5.0)χ2 = 7.538, p < 0.05
During the time of the experience, did you often think to yourself that you were actually in the supermarket?2.0 (0.0–3.0)1.0 (0.5–3.5)4.0 (4.0–5.0)χ2 = 13.217, p < 0.05
How dizzy, sick or nauseous did you feel resulting from the experience, if at all?0.0 (0.0–0.5)0.0 (0.0–1.0)2.0 (0.5–2.5)χ2 = 13.520, p < 0.05
Please rate the extent to which you were aware of background sounds in the laboratory in which this experience was actually taking place. 3.0 (2.0–4.0)3.0 (1.5–6.0)2.0 (0.5–2.5)χ2 = 8.600, p < 0.05
Table 3. Changes in physiological measurements during the treatment periods. Results are presented as median and interquartile range. A Freidman test was used to determine differences between treatments. Post hoc analysis with Wilcoxon’s signed-rank test was conducted with a Bonferroni correction applied.
Tablet (Median (IQR))
(Δ Baseline)
PC (Median (IQR))
(Δ Baseline)
IVR (Median (IQR))
(Δ Baseline)
Test Statistic
Heart rate (BPM)−1.5 (−3.1–0.75)−3.8 (−5.1–0.0)−2.5(−5.6–−0.25)χ2 = 8.600, p < 0.05
Skin conductance (μseimans)0 (−0.11–0.02)−0.1 (−0.27–0.04)−0.37 (−0.78–0.01)χ2 = 3.640, p > 0.05
Skin temperature (c)−0.1 (−0.92–0.4)0.3 (−0.69–0.87)0.1 (−0.37–1.07)χ2 = 4.769, p > 0.05
Table 4. Participants’ responses to the mood questionnaire. All data are shown as change from baseline. Results are presented as median and interquartile range. A Freidman test was used to determine differences between treatments. Post hoc analysis with Wilcoxon’s signed-rank test was conducted with a Bonferroni correction applied. See reference [39,40,41].
QuestionTablet (Median (IQR))
(Δ Baseline)
PC (Median (IQR))
(Δ Baseline)
IVR (Median (IQR))
(Δ Baseline)
Test Statistic
How tired do you feel right now?−4.0 (−12.5–15.5)8.0 (−3.5–21.0)−1.0 (−16.5–9.0)χ = 1.922, p > 0.05
How happy do you feel right now?13.5 (−37.0–35.0)−2.0 (−4.5–19.5)3.0 (−11.0–15.0)χ = 0.39, p > 0.05
How sad do you feel right now?0 (−5–19.0)7.0 (−1.0–15.5)3.0 (−8.5–12.0)χ = 0.280, p > 0.05
How energetic do you feel right now?1 (−21.5–6.0)−3.0 (−19.0–6.0)−5.0 (−9.5–9.0)χ = 0.353, p > 0.05
How bored do you feel right now?−3.0 (−19.0–4.0)−2.7 (−3.6–−1.5)−3.0 (−19.0–10.5)χ = 3.569, p > 0.05
How amused do you feel right now?3.0 (−10.5–28.0)−17.0 (−24.5–−1.0)4.0 (−5.5–31.0)χ = 3.647, p > 0.05
How frustrated do you feel right now?1.0 (−3.5–12.0)0 (−11.0–0.5)0 (−19.5–11.0)χ = 0.286, p > 0.05
How calm do you feel right now?−8.0 (−10.5–1.0)8.0 (−0.5–17.5)0 (−12.5–23.0)χ = 2.627, p > 0.05
How anxious do you feel right now?0 (−6.0–7.5)0 (−20.0–15.0)8.0 (−2.0–15.0)χ = 2.440, p > 0.05
Disclaimer/Publisher’s Note: The statements, opinions and data contained in all publications are solely those of the individual author(s) and contributor(s) and not of MDPI and/or the editor(s). MDPI and/or the editor(s) disclaim responsibility for any injury to people or property resulting from any ideas, methods, instructions or products referred to in the content.

