Article

Study of Visualization Modalities on Industrial Robot Teleoperation for Inspection in a Virtual Co-Existence Space

by
Damien Mazeas
1,* and
Bernadin Namoano
2
1
Faculty of Science and Technology, Beijing Normal-Hong Kong Baptist University, Zhuhai 519088, China
2
Centre of Digital Engineering and Manufacturing, Cranfield University, Bedford MK43 0AL, UK
*
Author to whom correspondence should be addressed.
Virtual Worlds 2025, 4(2), 17; https://doi.org/10.3390/virtualworlds4020017
Submission received: 2 April 2025 / Revised: 23 April 2025 / Accepted: 27 April 2025 / Published: 28 April 2025

Abstract

:
Effective teleoperation visualization is crucial but challenging for tasks like remote inspection. This study proposes a VR-based teleoperation framework featuring a ‘Virtual Co-Existence Space’ and systematically investigates visualization modalities within it. We compared four interfaces (2D camera feed, 3D point cloud, combined 2D3D, and Augmented Virtuality-AV) for controlling an industrial robot. Twenty-four participants performed inspection tasks while performance (time, collisions, accuracy, photos) and cognitive load (NASA-TLX, pupillometry) were measured. Results revealed distinct trade-offs: 3D imposed the highest cognitive load but enabled precise navigation (low collisions). 2D3D offered the lowest load and highest user comfort but slightly reduced distance accuracy. AV suffered significantly higher collision rates and participant feedback usability issues. 2D showed low physiological load but high subjective effort. No significant differences were found for completion time, distance accuracy, or photo quality. In conclusion, no visualization modality proved universally superior within the proposed framework. The optimal choice is balancing task priorities like navigation safety versus user workload. Hybrid 2D3D shows promise for minimizing load, while AV requires substantial usability refinement for safe deployment.

1. Introduction

The effective teleoperation of industrial robots is essential for tasks in hazardous, remote, or precision-demanding environments [1]. This capability is fundamentally limited by the operator’s ability to perceive the remote workspace and maintain situational and spatial awareness [2,3]. Adequate awareness is critical not only for task success but also for ensuring operational safety and efficiency. Traditional teleoperation interfaces often rely solely on 2D video feeds [4]. These interfaces frequently present inadequate perceptual cues. This inadequacy hinders task performance by impairing the operator’s judgment of distances and spatial relationships [5], increasing cognitive load as operators struggle to mentally reconstruct the 3D scene [6], and elevating the risk of errors. The risk of errors is particularly high during complex operations like industrial inspection, which often demand precise maneuvering and specific viewpoint control [7,8].
The imperative for robust remote inspection capabilities stems from pressing industrial needs unmet by traditional on-site practices. Many sectors engage with assets in locations unsafe for routine human presence, such as nuclear installations [9]. Furthermore, the logistics and costs of deploying specialized inspectors globally, including travel time and potential operational shutdowns, present significant operational challenges. Robot-mediated remote inspection provides a pathway to circumvent these physical and economic barriers, offering the potential to conduct thorough assessments via specialized personnel operating from a central or distant location. This paradigm shift promises enhanced safety and cost savings and enables more frequent monitoring and faster responses.
To overcome these limitations, Virtual Reality (VR), Augmented Reality (AR), and Mixed Reality (MR) technologies offer powerful paradigms for enhancing human-robot interaction in teleoperation scenarios. These technologies leverage immersion and spatial interfaces to provide operators with richer environmental context and more intuitive control mechanisms compared to traditional screen-based approaches [10]. This study explores the potential of VR to create immersive and intuitive control interfaces. Central to this approach is a “Virtual Co-Existence Space”, a dynamic virtual environment integrating real-time data from the physical world, including the robot’s pose, sensor readings, and environmental representations, with interactive virtual elements. Such spaces aim to bridge the perceptual gap between the operator and the remote reality, potentially improving decision-making and safety. Designing the Human-Machine Interface (HMI) within these immersive systems, specifically how environmental information is visualized alongside the robot’s digital twin, becomes paramount for enabling efficient, safe, and perceptually grounded teleoperation. However, the optimal method for presenting complex environmental data within these VR systems remains an open question, particularly concerning the trade-offs between visual richness, information density, and operator cognitive capacity.
This research systematically investigates the human factors associated with different visualization modalities within a VR-based teleoperation system specifically designed to facilitate remote inspection tasks common in industrial settings, such as visual quality control assessments, non-destructive testing, or maintenance checks in areas that are hazardous or difficult for humans to access [11,12]. We compare four distinct approaches: (1) Traditional 2D Camera Feed (2D), (2) 3D Point Cloud Representation (3D), (3) Combined 2D Feed and 3D Point Cloud (2D3D), and (4) an AV approach overlaying contextual information directly onto the virtual representation of the remote environment. We employed a physical industrial robot (FANUC M-20iA), representative of multi-axis manipulators frequently used in manufacturing and logistics due to their dexterity, payload capacity, and precise motion capabilities, making them suitable candidates for carrying inspection sensors into constrained environments. The robot was operated within a protective safety fence as per standard industrial practice. The Virtual Co-Existence Space implemented is designed to overcome this physical separation. It virtually brings the human operator and the robot together into a shared, interactive virtual world, aiming to facilitate more intuitive control despite the necessary physical isolation.
This research presents a system architecture for immersive teleoperation using a Virtual co-existence space. It investigates how different visualization modalities implemented within this framework influence operator performance and cognitive workload. To ensure a comprehensive evaluation grounded in established Human-Robot Interaction (HRI) methodologies and allow for comparison with prior teleoperation studies [3,10], operator performance is assessed using a combination of standard and task-specific metrics. These include: task completion time, a widely accepted measure of efficiency in teleoperation tasks [13]; collision count, a critical indicator of safety and the operator’s spatial awareness provided by the interface, particularly vital in potentially cluttered industrial environments [1,14]; distance accuracy, essential for evaluating the system’s suitability for inspection tasks requiring precise viewpoint control or optimal sensor standoff distances [5,11]; and photo quality, which directly measures the operator’s ability to achieve the core objective of the visual inspection task successfully. Cognitive workload, a key factor influencing user acceptance, fatigue, and potential for error [13,15,16], is assessed using the subjective NASA-TLX questionnaire and objective pupillometry data captured via the VR headset’s integrated eye-tracking capabilities.
This paper is organized as follows: Section 2 presents the state of the art and identifies the research gap. Section 3 details the system architecture, experimental methods, and data collection procedures. Section 4 presents the results regarding cognitive workload and performance. Section 5 discusses these findings and their implications. Finally, Section 6 concludes the paper and outlines future work.

2. State of the Art

Effective teleoperation of industrial robots, particularly for complex tasks such as inspection, heavily relies on the operator’s situational awareness and spatial understanding of the remote environment [14]. Visualization is the cornerstone for achieving this awareness [3]. This section reviews existing literature on visualization techniques in telerobotics, user interface paradigms, and environment representation, highlighting challenges and advancements relevant to performing industrial inspection tasks within a virtual co-existence space.

2.1. Limitations of Conventional Teleoperation Visualization

Traditional approaches to telerobotic visualization typically involve deploying mono- and stereoscopic multi-camera setups either within the robot’s environment or mounted on its end-effectors [17]. These cameras provide video streams displayed on standard monitors or immersive environments, offering operators a direct view of the remote workspace. While functional, this methodology inherently suffers from limitations. A primary drawback is the restricted Field of View (FOV) offered by fixed or narrowly aimed cameras, hindering the operator’s ability to grasp the broader environmental context [14,18]. Furthermore, interpreting multiple 2D video feeds, potentially from non-ideal viewpoints, significantly increases the operator’s cognitive workload [19]. Consequently, situational awareness (understanding the overall state) and spatial awareness (understanding locations, orientations, and distances) are often compromised, limiting the effectiveness and efficiency of teleoperation, especially for precision tasks like inspection.

2.2. Immersive Visualization and Virtual Co-Existence Spaces

To overcome the limitations of conventional displays, immersive Virtual Reality (VR) technologies have emerged as a promising alternative. VR can provide operators with a more encompassing and intuitive perception of the remote site [13,14,17,18,19]. The concept of a “Virtual Co-Existence Space”, central to our study, involves integrating real-time data from the remote robot and its environment into a shared virtual space accessible by the operator. This requires visual feedback and the seamless integration of diverse sensor information (e.g., robot pose, sensor readings, environmental data) into the immersive 3D scene. Presenting this information effectively is crucial; therefore, designing fast and intuitive user interfaces (UIs) is paramount to avoid cognitive overload while ensuring the operator receives all necessary live data for task execution. The UI effectively becomes the central hub for interaction within the teleoperation or telexistence system [20].

2.3. User Interface Paradigms for Immersive Teleoperation

Within immersive environments, two primary interface viewpoints dominate: egocentric and exocentric views.
Egocentric View: This provides a first-person perspective, often mimicking the robot’s camera view, which can feel natural, particularly for humanoid robots. However, this view is prone to occlusion issues, where parts of the environment or the robot obstruct the view, potentially hindering inspection tasks. Furthermore, if the robot is in motion, the egocentric view can induce cybersickness in the operator.
Exocentric View: This offers a third-person perspective or “world-in-miniature” view [21] providing a broader overview of the remote workspace, including a digital representation of the robot. This perspective generally aids spatial understanding and path planning but may lack the fine detail visible from a first-person viewpoint.
Recognizing the distinct advantages and disadvantages of each, researchers have explored hybrid approaches. For instance, Livatino et al. (2021) proposed a mixed-reality system allowing operators to switch between egocentric and exocentric views for a ground robot [2]. Their system overlaid guidance information (e.g., trajectories, arrows) onto the camera stream in the egocentric view. Using a virtual pointer allowed interaction with a 3D environmental reconstruction in the exocentric view to query data like altitude or distance.

2.4. Environment Representation and Data Handling in VR

Representing the remote environment accurately and efficiently within the virtual space is critical. Environments can range from unstructured (unpredictable, little prior knowledge, e.g., disaster sites) to structured (partially or fully known, common in industrial settings or simulations).
Unstructured environments are often captured and visualized as point clouds, typically generated using RGBD cameras or LiDAR [22]. While capturing detailed geometry, point clouds pose significant challenges in terms of the bandwidth required for transmission and the computational power needed for rendering and processing [23]. Techniques to mitigate this include replacing known objects with pre-defined 3D meshes [2,24,25], downsampling using methods like voxelization, or employing hierarchical structures like OctoMaps. Kohn et al. (2018) demonstrated a dramatic reduction in data transfer by selectively using meshes [25]. Multi-camera systems can improve reconstruction quality but increase bandwidth needs and calibration complexity [26,27].
Structured environments, often encountered in industrial contexts, are frequently represented using 3D meshes. These offer clarity and are computationally less demanding than dense point clouds. The fidelity of the environmental model directly impacts the quality of the visualization and the operator’s ability to perform precise inspection tasks [28].
Furthermore, identifying material properties can be relevant for inspection. Machine learning techniques, especially Convolutional Neural Networks (CNNs), have shown success in classifying materials from image data [29]. In visually degraded environments, tactile sensing might supplement visual data [30], although integrating such multi-modal data into a primarily visual interface presents its challenges.

2.5. Research Gap

The reviewed literature highlights significant progress in utilizing immersive visualization and advanced interaction paradigms for telerobotics, aiming to overcome the limitations of conventional methods. However, persistent challenges related to operator cognitive load, achieving comprehensive situational and spatial awareness, and efficiently handling complex environmental data remain, particularly for precision-oriented tasks like remote industrial inspection performed within a virtual co-existence space. Understanding the specific effects of modalities ranging from established 2D interfaces to immersive 3D environmental representations (like point clouds), to information-enhanced Augmented Virtuality (AV), and potential hybrid combinations (such as integrated 2D/3D views) is crucial for optimizing operator effectiveness and system design in these complex scenarios. This gap directly motivates the primary research question addressed by this study: How do different visualization modalities affect user performance, cognitive workload, and qualitative experience during a remote industrial inspection task conducted within a virtual co-existence space?

3. Materials and Methods

3.1. Proposed VR-Based Teleoperation System

3.1.1. System Architecture

The proposed VR-based teleoperation system, depicted in Figure 1, establishes a virtual co-existence space. This space aims to overcome the physical separation inherent in teleoperation by digitally integrating the remote Physical System (robot and environment) and the local Operator Space (human user and interface) through a mediating Cyber System. The architecture is designed for modularity and real-time performance, leveraging the Data Distribution Service (DDS) protocol as its communication backbone. The key elements and their interactions are as follows:
  • Physical System: This represents the robot’s actual operational environment.
    Environmental Components: Includes the physical Work Area, any Task Objects the robot interacts with (e.g., inspection targets), and Environmental Constraints (e.g., obstacles, safety zones).
    Robot: The physical industrial robot (a FANUC M-20iA in this study) comprises sensing elements: cameras (two Azure Kinects on the end-effector) providing visual data for 2D feeds and 3D point cloud generation, and other robot sensors (e.g., force, proximity) capturing interaction data. This raw data is the physical system’s output to the cyber realm.
  • Operator Space: This is where the human operator performs the teleoperation task.
    Human Operator: Provides high-level commands and utilizes Domain-Specific Knowledge for the inspection task.
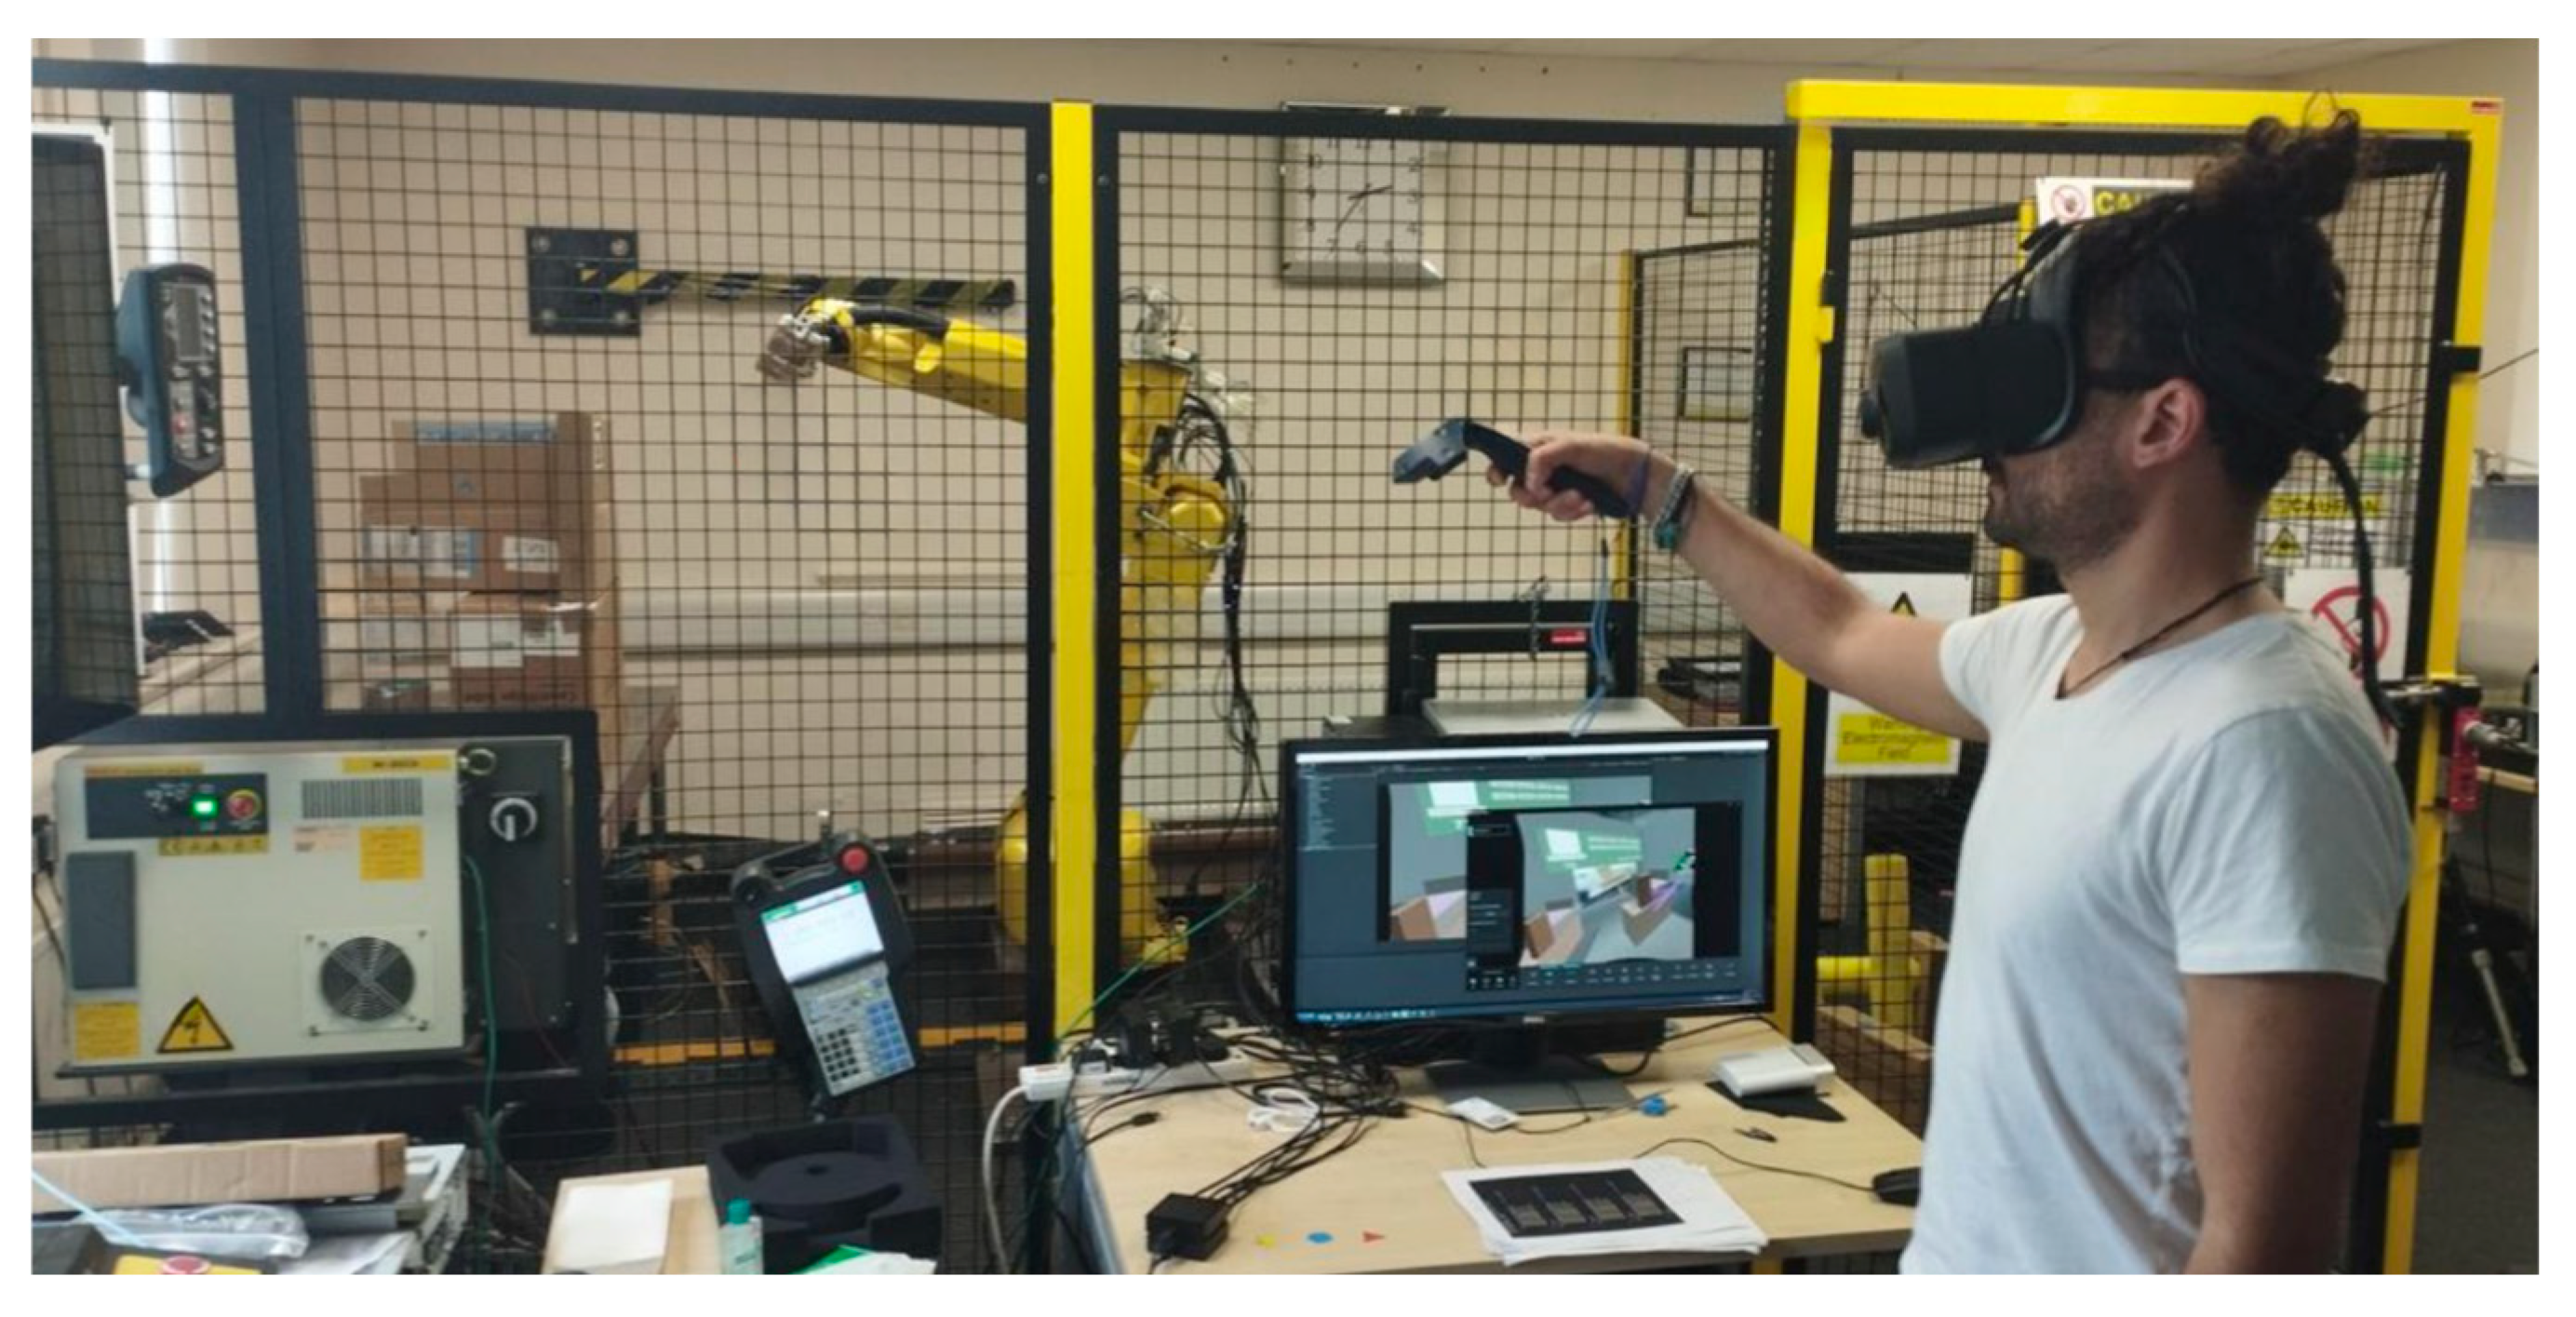
    Human-Machine Interface (HMI): The means through which the operator interacts. This includes Haptic Controllers (HTC VIVE) for command input and tactile feedback, and a Virtual Reality Headset (VARJO XR-3) for immersive visualization. It has a resolution of 2880 x 2720 pixels per eye, a 90 Hz refresh rate, and a 115-degree field of view. The interface logic and display are managed by a Unity 3D application running on the following system: an AMD Ryzen PRO 3975WX 32-Cores, an Nvidia Quadro RTX 8000, and 64 GB DDR4 RAM.
  • Cyber System: The core digital infrastructure connects, processes, and synchronizes information between the physical and operator spaces.
    Gateways: The Gateway Physical System (a C# application using FANUC PC Developer’s Kit (PCDK) and Azure Kinect SDK APIs) is the bridge, collecting data from the physical robot/sensors and translating commands to the robot controller. The Gateway Operator Space similarly connects the HMI hardware/software to the cyber system, sending operator inputs and receiving data for visualization.
    DDS Databus: Central to the Cyber System is the DDS Databus (using RTI Connext DDS). It functions as a real-time ‘data highway’ employing a publish-subscribe mechanism. System components (Gateways, Data Management, etc.) publish data on specific topics (e.g., Robot_State, Operator_Teleop_Target) and subscribe to the topics they need, ensuring efficient communication (see Section 3.1.2 for data structures).
    Core Modules: Several specialized modules operate on the data flowing through the DDS bus to perform key functions. The Data Management module stores and retrieves critical information like real-time robot poses and joint angles. Data Analytics processes incoming data, for example, performing Collision Detection based on robot pose and environmental sensor readings. The Digital Twin Viewer, implemented in Unity 3D, subscribes to relevant data streams (robot state, point clouds) to render the dynamic virtual representation of the robot and its environment for the operator, including Status Visualization and a Shadow Model Display for planned movements. Operator commands received via DDS are processed by the Control and Interaction module, which calculates necessary joint movements (Inverse Kinematics), generates robot control commands, manages the Virtual Camera perspective, and provides Manual Override capabilities. Additionally, an Expert Support System can analyze the operational context to provide Contextual Assistance through the HMI, and a Data Logging module records operational data for subsequent analysis and playback.
  • Interaction Flows (Arrows): The arrows in Figure 1 indicate the direction and type of interaction.
    Information Flow (Blue Arrows): Represents the flow of sensor data, system states, and processed information between components, primarily published/subscribed via the DDS Databus (e.g., sensor data flowing from Gateway Physical System to DDS, then consumed by Digital Twin Viewer).
    Feedback Flow (Green Arrows): Indicates responsive data, such as command acknowledgments, status updates resulting from actions, collision warnings from Data Analytics, or guidance from the Expert System flowing back towards the operator or control modules.
    Primary Control (Black Arrows): Shows the direct command path originating from the operator’s input, processed by the Control and Interaction module, and ultimately actuating the physical robot.
Figure 1. The system architecture of the proposed VR-based teleoperation system.
Virtualworlds 04 00017 g001
In summary, the architecture captures the state of the Physical System, transmits it via the Gateway and DDS to the Cyber System for processing and visualization within the Digital Twin Viewer, presents this dynamic virtual representation to the Operator via the HMI, receives control inputs from the Operator, translates these into robot commands within the Cyber System, and sends them back to the Physical System for execution. This continuous loop, facilitated by the DDS Databus, creates the functional Virtual Co-Existence Space for immersive teleoperation.
Figure 2 shows the experimental setup described above and a participant during the experiment. Additional demonstration videos are available as Supplementary Materials.

3.1.2. Data Synchronization with DDS

DDS acts as the central data bus, employing a publish-subscribe architecture to ensure efficient and timely data exchange between decoupled system components. DDS utilizes the concepts of Topics, Data Types, and Samples to structure the data transmission. A Topic represents a specific stream of data (e.g., robot joint states), defined by a unique name and an associated Data Type that specifies the structure of the data being sent. A Sample is an individual piece of data published or received under a specific Topic. While standard robotics message formats like those in ROS exist, custom data structures were defined for this framework to optimize data handling (see Table 1), particularly for bandwidth-intensive streams like point clouds, and to ensure only necessary information is transmitted efficiently. These structures facilitate the bidirectional flow of information:

3.2. Visualization Modalities and Experimental Task

The VR-based teleoperation interface used in this study provided operators with a synchronized digital twin of the remote industrial robot. This virtual robot model accurately mirrored the real robot’s real pose in real time and served as the primary interface for operator control and interaction across all experimental conditions.
The study evaluated the impact of four distinct modalities (Figure 3), which differed primarily in how the spatial information of the surrounding remote environment was presented to the operator alongside the robot’s digital twin:
  • 2D Camera Feed (2D): Alongside the robot’s digital twin, this modality presented participants solely with the conventional live 2D video stream captured from the camera mounted on the real robot’s end-effector, displayed on a virtual screen within the VR environment.
  • 3D Point Cloud (3D): In this modality, the environment surrounding the robot’s digital twin was visualized using only a live 3D point cloud reconstruction streamed into the VR headset. The 2D camera feed was omitted.
  • Combined Feed (2D3D): This modality provided participants with the 2D live camera feed (displayed as in modality 1) and the 3D live point cloud environmental representation simultaneously, in addition to the robot’s digital twin.
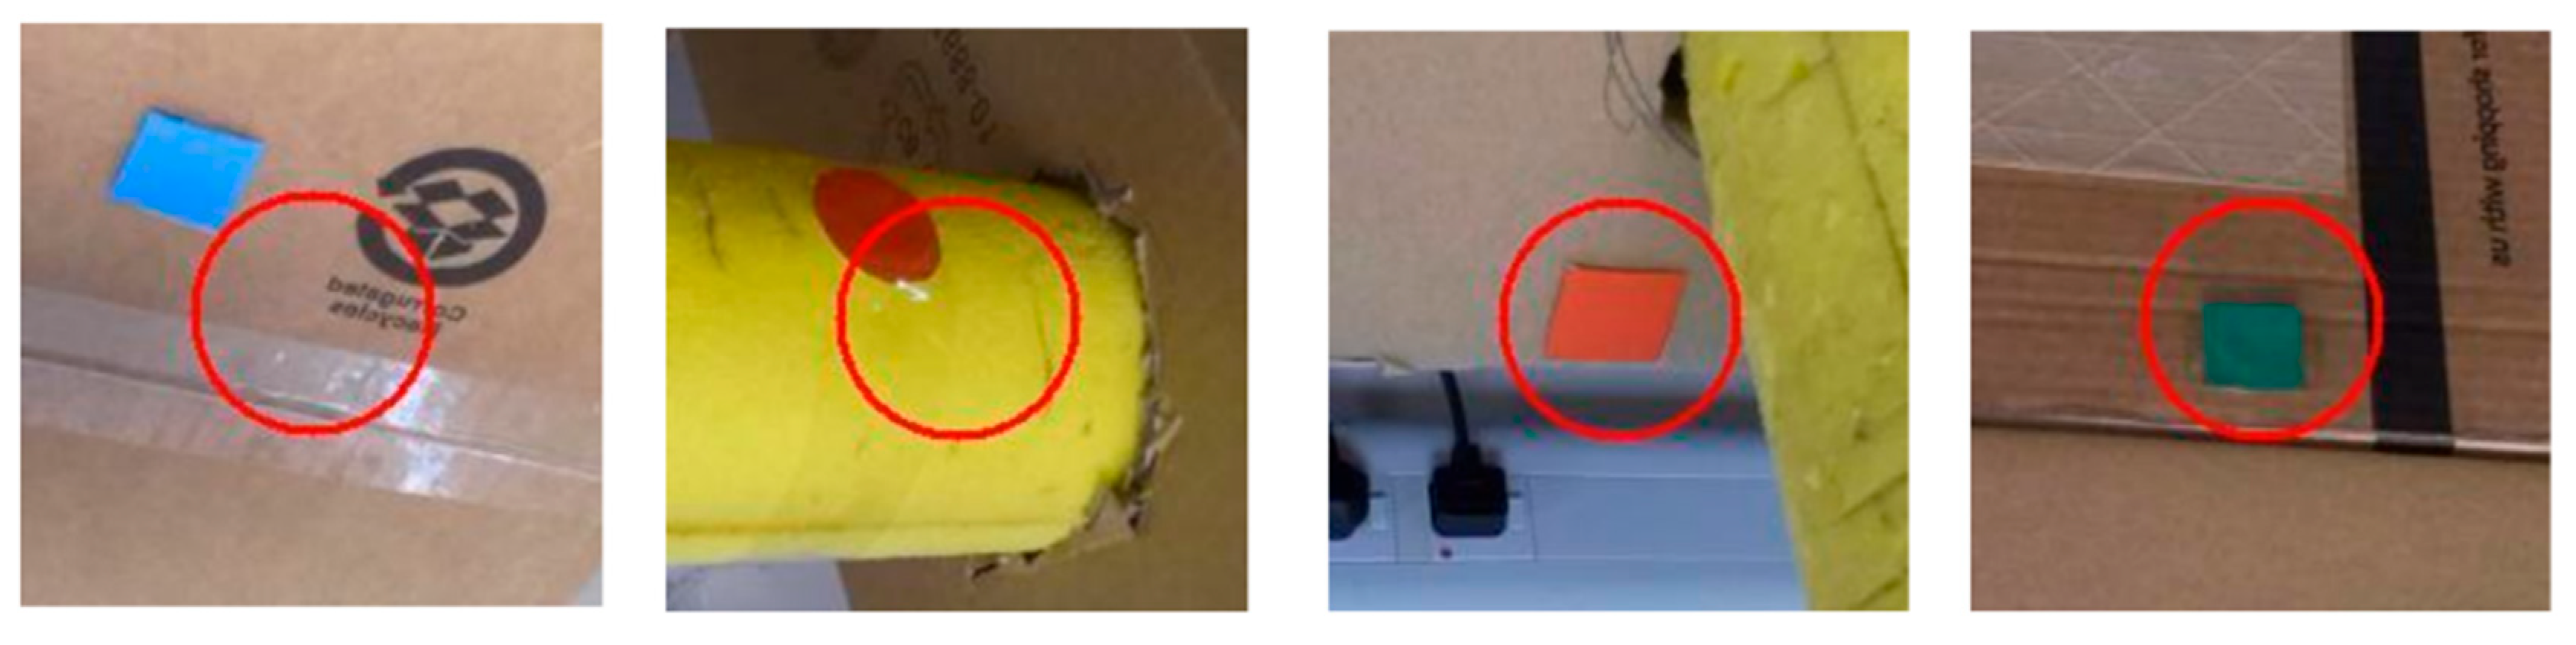
  • Augmented Virtuality (AV): This modality integrated the 2D live camera feed and enhanced the virtual scene with registered information overlays linked to OpenCV markers placed within the physical workspace.
Figure 3. Visualization modalities.
Virtualworlds 04 00017 g003
The experimental task involved inspecting designated areas within a structured environment constructed using boxes and foam pipes, as depicted in the four schematic representation setups in Figure 4. The four visualization modalities (2D, 3D, 2D3D, AV) were tested within their distinct physical setups.
For each trial, the robot started from a consistent home position. Participants were required to teleoperate the robot to inspect three specific target areas (t1, t2, t3), marked visually in the setup (and represented by colored arrows in Figure 4). These tasks were designed to simulate different inspection scenarios with varying complexities:
  • Task 1 (t1): The inspection area was located directly in front of the robot’s starting position and was visible without requiring significant robot or camera reorientation (Figure 4, green arrow).
  • Task 2 (t2): The inspection area was visible from the start position but required substantial rotation of the robot-mounted camera (towards the ground relative to the participant’s initial view) for successful inspection (Figure 4, blue arrow).
  • Task 3 (t3): The inspection area was positioned such that it was not visible from the robot’s starting orientation (located on the left side). This required participants to actively navigate or reorient the robot arm and camera to locate and inspect the target (Figure 4, red arrow).
All tasks involved capturing photos of markers that varied in shape (circle, square, triangle, star) and color (blue, green, red, yellow) but were consistent in size (4 cm × 4 cm). These markers were arranged at positions t1, t2, and t3, as shown in Figure 4. Participants were instructed to take photos of the markers from a specified distance, visually aligning the target marker within a red circle overlay provided in their view. After pressing the photo-taking button, they received immediate visual feedback within the virtual environment, allowing them to adjust and retake the photo if necessary.

3.3. User Evaluation

3.3.1. Participants

The study was initially conducted with 28 participants. Due to inconsistencies in baseline pupillometry measurements, data from four participants were excluded, resulting in a final sample of 24 participants for analysis, with an average age of 28.17 ± 6.94 years. The demographic breakdown of the participants is depicted in Table 2. All participants received standardized introductory explanations (approx. 4 min) and a hands-on practice session (approx. 5 min) with the robot controls and VR interface as part of the experimental procedure (detailed in Section 3.3.3) to ensure a baseline level of familiarity before commencing the experimental tasks.
The experimental protocol involved four distinct modality conditions. The order of modalities was systematically counterbalanced across the sample using a Latin Square Design [31] and arranged so that, by the study’s conclusion, each of the four possible sequences was experienced by six different participants.
The exclusion of four participants based on their baseline pupil dilation measurements was necessary for statistical integrity and not a reflection of their inherent ability to engage with telepresence technologies. These participants were excluded because their baseline pupil dilation measurements exceeded the values observed during experimental modalities, which would have compromised the validity of our cognitive workload assessments.
Pupillometry, which gauges cognitive workload based on pupil dilation, requires reliable baseline measurements against which changes can be compared. Several factors can influence baseline pupil dilation, including ambient lighting conditions, participants’ emotional states (anxiety or excitement), prior cognitive engagement, fatigue, and consumption of substances like caffeine [15]. In our study, we controlled these variables by maintaining consistent testing conditions and excluding outliers to ensure the accuracy and reliability of our findings.

3.3.2. Data Collection

In our evaluation of the visualization modalities, we aimed to assess the cognitive workload imposed by the different conditions. To achieve this, we utilized the NASA-TLX questionnaire and pupillometry
The NASA-TLX [16] is a multi-dimensional approach to assess the perceived workload in an individual engaged in a task. The index offers a subjective yet robust method for evaluating the workload experienced by users in human-machine interaction scenarios. The NASA-TLX comprises six dimensions, each reflecting a different aspect of the perceived workload: mental demand, physical demand, temporal demand, performance, effort, and frustration level. In application, the NASA-TLX uses a two-step process. Individuals rate their experience on each of the six dimensions on a scale from 0 (very low) to 100 (very high), except for the performance dimension from 0 (perfect) to 100 (failure).
Eye-tracking data was recorded at 100 Hz using the Varjo XR-3 headset API (https://developer.varjo.com/docs/get-started/eye-tracking-with-varjo-headset, accessed on 15 April 2024), including pupil size measurements from both eyes. Given the high correlation between pupil diameters of both eyes [32], we analyzed the mean pupil size time series. Following the established four-step framework for pupillometry data processing by [33], we implemented the methodology to ensure data quality. This approach ensured the removal of artifacts commonly caused by blinks or eyelid occlusion, which typically manifest as significant changes in measured pupil size.
Our data collection process also involved collecting performance metrics, including the time to complete the task, the number of collisions, the distance accuracy, and the photo quality.
The collision parameter was the most critical factor in the evaluation process, as maintaining safety in teleoperation tasks is paramount.
Efficiency in task execution was evaluated based on the time participants took to complete the task. This metric helped quantify the participant’s ability to operate the system efficiently.
Distance accuracy was assessed by evaluating whether the participant successfully positioned the robot within the target’s given range (displayed on the inspection task instruction in VR). This metric was particularly important in tasks requiring precise spatial awareness, such as object inspection or manipulation.
The photo quality metric was introduced to assess the participant’s ability to align the robot’s camera for visual inspection correctly. A photo was deemed successful if it was clear, well-framed, and captured the required details of the target object.
In addition, qualitative feedback was collected during the evaluation sessions. Participants’ verbal comments were meticulously recorded and coded to distill valuable insights into their experiences and perceptions of the visualization modalities. These qualitative findings and quantitative data from the NASA-TLX and performance metrics gave us a holistic understanding of the user experience across the four conditions.

3.3.3. Procedure

The experiment followed a structured procedure to ensure participant consistency and gather reliable data, primarily managed by an automated system controlled via JSON configuration files (Participant.json, Questions.json, Settings.json). These files handled participant identification, condition assignment based on counterbalancing, language preference (English or French) for instructions and questionnaires, task flow sequence, and data logging. The total estimated duration for each participant was approximately 45 min.
The procedure for each participant unfolded as follows:
  • Arrival and Consent (Approx. 2 min): Upon arrival, participants were welcomed and received a detailed information sheet outlining the study’s purpose, procedures, duration, and potential risks. Participants provided written informed consent before proceeding. All procedures adhered to the Cranfield University Research Ethics System guidelines (reference CURES/17958/2023 and project ID 20805).
  • Pre-Test Questionnaires (Approx. 2 min): Participants completed a questionnaire gathering demographic information (age, gender) and self-reported experience levels with robotics and VR to characterize the sample.
  • Introduction and Familiarization (Approx. 4 min): Participants received a standardized presentation explaining the VR teleoperation interface, the robot control mechanisms, the objectives of the inspection tasks (t1, t2, t3), and the overall experiment flow. They were then assisted in fitting the VR headset with an integrated eye-tracker.
  • Eye-Tracker Calibration (Approx. 2 min): A manual eye calibration procedure was conducted for each participant. This step, requiring experimenter oversight, ensured the eye-tracking system was accurately calibrated for the individual, guaranteeing reliable pupillometry data.
  • Baseline Pupillometry (Approx. 3 min): A baseline measure of the participant’s pupil diameter was recorded while they remained in a quiet, resting state within the VR environment for one minute. This provided a reference point for task-induced cognitive load measurements.
  • Robot Manipulation Practice (Approx. 5 min): Participants engaged in a practice session within a neutral VR environment (distinct from the experimental task layouts) to become comfortable with controlling the robot’s digital twin using the provided VR controllers.
  • Experimental Conditions (Within-Subjects, Counterbalanced) (Approx. 24 min total):
    • Design: The core of the experiment used a within-subjects design, where each participant experienced all four experimental conditions (each pairing a specific visualization modality with its unique physical layout).
    • Counterbalancing: To mitigate potential learning or fatigue-related order effects, the presentation sequence of the four conditions was counterbalanced across participants using four predefined Latin square sequences:
      Sequence 1: 2D → 3D → AV → 2D3D
      Sequence 2: 3D → AV → 2D3D → 2D
      Sequence 3: AV → 2D3D → 2D → 3D
      Sequence 4: 2D3D → 2D → 3D → AV
      The control system automatically assigned participants to one of these sequences.
    • Per-Condition Loop (Repeated 4 times): For each condition within their assigned sequence, participants underwent the following automated steps:
      Task Performance (Approx. 3 min): The system presented the appropriate visualization modality, and the researcher set up the corresponding physical task environment. The participant then performed the three inspection tasks (t1, t2, t3) in a predetermined order. Pupillometry data and relevant task performance metrics were automatically recorded throughout this phase.
      Workload Assessment (Approx. 3 min): Immediately after completing the tasks for the condition, the participant responded to a subjective cognitive workload questionnaire (NASA-TLX) presented within the VR interface. Responses were logged automatically. During this phase, the physical task environment was set up for the next modality.
  • Debriefing (Approx. 3 min): After completing all four conditions, participants were debriefed. They had the opportunity to ask questions and provide open-ended feedback regarding their experience with the different modalities and the overall experiment.
This structured and largely automated procedure, including counterbalancing and dedicated time blocks based on pilot testing, aimed to ensure data reliability and consistency while maintaining participant comfort and minimizing fatigue during the unpaid session.

4. Results

4.1. Cognitive Workload

The cognitive workload perceived by participants across the four interaction modalities (2D, 3D, 2D3D, AV) was evaluated using the NASA-TLX questionnaire. Figure 5 presents the mean scores for each of the six workload dimensions across the modalities:
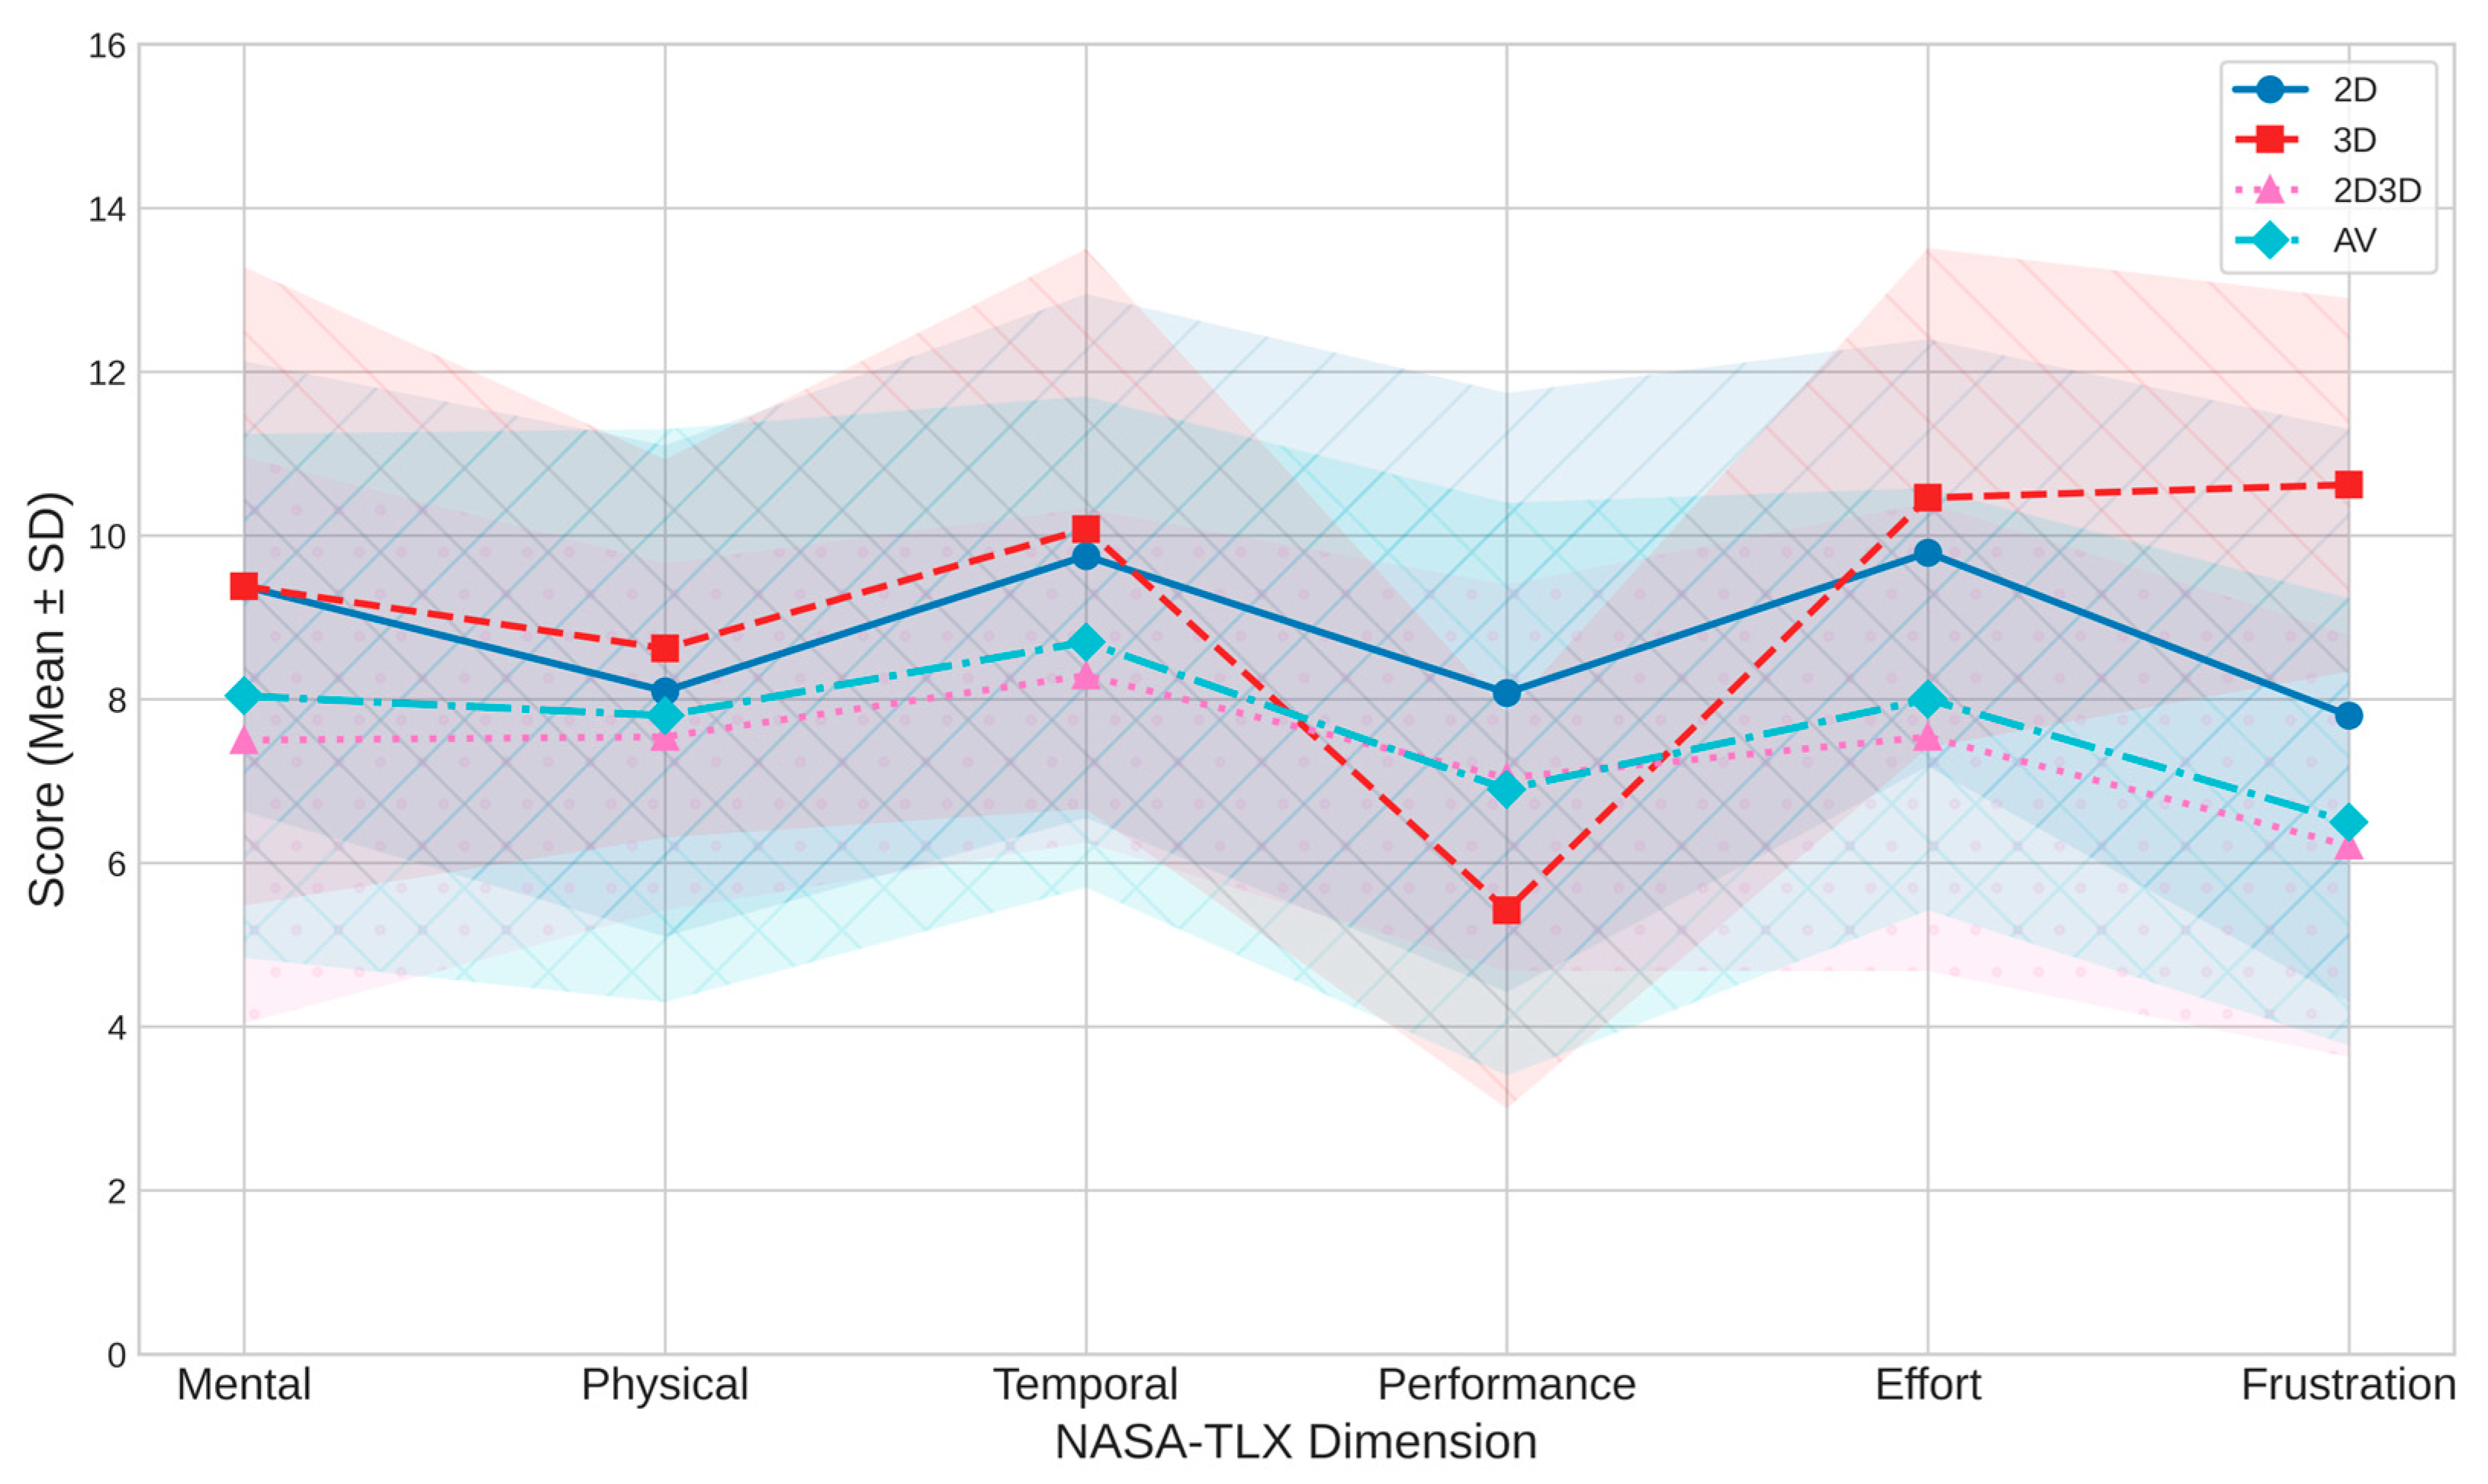
  • 2D Modality: This modality was tied for the highest perceived Mental Demand (M = 9.38, SD = 2.75). Participants also reported the highest perceived Performance (M = 8.08, SD = 3.66), indicating they felt most successful completing the task using 2D. Its scores for Effort (M = 9.79, SD = 2.61) and Temporal Demand (M = 9.75, SD = 3.20) were also notably high.
  • 3D Modality: This modality generally imposed the highest cognitive load. It yielded the highest mean scores for Physical Demand (M = 8.62, SD = 2.31), Temporal Demand (M = 10.08, SD = 3.42), Effort (M = 10.46, SD = 3.05), and Frustration (M = 10.62, SD = 2.28). It was also tied for the highest Mental Demand (M = 9.38, SD = 3.90). Crucially, participants reported the lowest perceived Performance (M = 5.42, SD = 2.42) in this modality.
  • 2D3D Modality: This modality was generally associated with the lowest perceived workload based on mean scores. It showed the lowest means for Mental Demand (M = 7.50, SD = 3.46), Physical Demand (M = 7.54, SD = 2.12), Temporal Demand (M = 8.29, SD = 2.04), Effort (M = 7.54, SD = 2.86), and Frustration (M = 6.21, SD = 2.58). Perceived Performance (M = 7.04, SD = 2.36) was second highest.
  • AV Modality: This modality typically presented mean scores falling between the extremes of the other modalities across most dimensions (e.g., Mental M = 8.04, SD = 3.20; Effort M = 8.00, SD = 2.58; Frustration M = 6.50, SD = 2.73).
Figure 5. NASA-TLX profiles across modalities.
Virtualworlds 04 00017 g005
While specific modalities imposed higher demands on certain dimensions (3D showing particularly high load across several dimensions and 2D3D showing generally lower load), no single modality was significantly rated highest or lowest across all six dimensions.
An analysis of variance (ANOVA) was conducted to assess potential order effects and determine if the sequence in which participants experienced the modalities influenced their NASA-TLX scores. The study revealed statistically significant order effects for certain dimensions within specific modalities. Within the AV modality, the presentation order significantly influenced perceived Mental Demand (p = 0.0054), Performance (p = 0.0339), and Effort (p = 0.0128). For the 2D modality, order significantly impacted the Frustration dimension (p = 0.0448). In the 2D3D modality, the presentation order significantly affected Temporal Demand scores (p = 0.0071). For other dimensions and modalities, the influence of order did not reach statistical significance. These findings suggest that while presentation order can shape workload perceptions for specific dimension-modality combinations, it may not be a universal confounding factor across all conditions in this study.
Pupil dilation, often used as an indicator of cognitive load, was measured as the percentage change from baseline for each interaction modality (results shown in Figure 6).
The analysis revealed differences in mean pupil dilation across modalities. The largest average increase was observed for the 3D modality (Mean = 7.43%, SD = 3.49%), suggesting this condition imposed the highest cognitive load. Similar results were found for the 2D modality (Mean = 3.83%, SD = 3.22%) and the 2D3D modality (Mean = 3.98%, SD = 3.36%). The AV modality showed an intermediate mean increase in pupil dilation (Mean = 5.27%, SD = 3.30%).
An ANOVA was conducted separately for each modality to assess the potential influence of presentation order on pupil dilation changes. The results indicated no statistically significant effect of presentation order for any of the modalities: 2D (p = 0.8793), 3D (p = 0.2101), AV (p = 0.2081), and 2D3D (p = 0.8369). As all p-values exceeded the conventional significance threshold of 0.05, the order in which participants experienced the modalities did not significantly alter their pupil dilation responses within those modalities.

4.2. Performance

Table 3 summarizes the performance results.
Regarding task completion time, mean performance varied across the modalities. The 2D modality yielded the highest average completion time and showed substantial variability (M = 248.75 s, SD = 85 s), suggesting it was descriptively the slowest condition. The lowest mean completion times were observed for the AV modality (M = 200.46 s, SD = 70 s) and the 3D modality (M = 201.88 s, SD = 65 s). The 2D3D modality resulted in an intermediate mean time with relatively high variability (M = 218.29 s, SD = 75 s). Despite these descriptive variations in mean times and variability, an ANOVA assessing the main effect of modality found no statistically significant difference in completion times across the four conditions (F(3, 69) = 2.13, p = 0.102). Therefore, the formal analysis indicates insufficient evidence to conclude that any modality inherently led to faster or slower task completion overall.
Collision count varied across the modalities, measured as the percentage of trials where a collision occurred. The AV modality showed the highest mean collision rate (M = 5.56%, SD = 3.1%). On average, participants using the 3D modality experienced fewer collisions (M = 2.31%, SD = 1.53%). The 2D modality (M = 1.39%, SD = 1.0%) and the 2D3D modality (M = 1.39%, SD = 0.85%) registered the lowest, and identical, mean collision rates, suggesting these conditions were associated with the fewest collisions. The ANOVA yielded a statistically significant result, F(3, 69) = 4.50, p = 0.006. Such a result would suggest that the observed differences in mean collision rates among the modalities, particularly the higher rate for AV, are unlikely to be due to random chance alone.
Distance accuracy, the percentage of trials where participants respected the required distance threshold, showed some variation across modalities. The 2D modality resulted in the highest mean compliance rate (M = 84.72%, SD = 10%), suggesting participants were most successful at maintaining the correct distance in this condition. The AV (M = 80.56%, SD = 12%) and 3D (M = 79.17%, SD = 12%) modalities had slightly lower mean compliance rates. The 2D3D modality showed the lowest means of compliance (M = 76.39%, SD = 13%). The ANOVA yielded a non-significant result, F(3, 69) = 1.50, p = 0.222. Such a result would suggest that there isn’t strong statistical evidence to conclude that the choice of modality significantly impacts distance accuracy performance.
The quality of photos taken by participants, assessed as the percentage of valid photos, was generally high across all conditions. Figure 7 shows examples of photos; valid photos have at least 50% of the marker in the red circle. The 2D3D modality yielded the highest mean rate of well-taken photos (M = 97.22%, SD = 3.0%). The 2D modality followed with a slightly lower rate (M = 94.44%, SD = 5.0%). The 3D (M = 93.06%, SD = 5.5%) and AV modalities (M = 93.06%, SD = 4.0%) recorded the lowest, and identical, mean success rates for photo quality.
The ANOVA assessing the main effect of modality yielded a non-significant result, F(3, 69) = 2.20, p = 0.096. Such an outcome would suggest that, despite the numerical differences, there isn’t strong statistical evidence to conclude that photo quality significantly differed based on the visualization modality used.

4.3. Qualitative Results

Qualitative feedback on the user experience with the four visualization modalities (2D, 3D, 2D3D, AV) was collected via post-experiment questionnaires and debriefing comments. Table 4 summarizes key themes emerging from participant feedback.

5. Discussion

This study investigated how different visualization modalities—2D, 3D, 2D3D (hybrid), and Augmented Virtuality (AV) impact user performance, cognitive workload, and qualitative experience during a remote industrial inspection task conducted within a virtual co-existence space. The results revealed distinct profiles for each modality, highlighting specific strengths and weaknesses rather than identifying a universally superior approach.

5.1. Impact of Visualization Modalities on Cognitive Workload

The findings consistently indicate that the choice of visualization modality significantly influences cognitive workload, corroborated by subjective NASA-TLX ratings and objective pupil dilation measurements.
  • The 3D modality emerged as the most cognitively demanding. It elicited the highest scores across multiple NASA-TLX dimensions (Physical Demand, Temporal Demand, Effort, Frustration, tied Mental Demand) and induced the most significant increase in pupil dilation. This aligns with qualitative feedback, where participants described it as imposing a high workload, frustrating, and visually demanding. While offering rich spatial information, processing and interacting with the 3D point cloud likely required substantial cognitive resources.
  • Conversely, the 2D3D modality was associated with the lowest cognitive load. It garnered the lowest scores on most NASA-TLX dimensions, resulting in low pupil dilation comparable to the 2D view. This quantitative finding was strongly supported by qualitative feedback, with most participants describing it as the easiest, most comfortable, and least effortful interface. This suggests providing both an overview (2D) and detailed immersive (3D) views simultaneously, allowing users to switch focus as needed, effectively mitigating the high load associated with the 3D view alone.
  • The AV modality presented an intermediate cognitive load profile subjectively via NASA-TLX and objectively via pupil dilation. While qualitatively perceived as engaging and novel, the cognitive benefits of the augmented information seemed offset by potential confusion or interaction challenges, preventing it from being as low-load as 2D3D.
  • The 2D modality presented an intriguing divergence between subjective and objective measures. Participants rated it highly demanding regarding mental demand and effort, which aligned with qualitative comments about requiring high concentration. However, its associated pupil dilation was low, like the easy 2D3D condition. This might suggest that while the task felt effortful and perhaps tedious in 2D, the familiar representation and clear view (as noted in qualitative feedback) did not overload cognitive processing resources to the same extent as the more complex 3D or AV interfaces. Alternatively, pupil dilation might be less sensitive to the specific type of sustained mental effort required by the 2D condition compared to the spatial processing demands of 3D/AV.
Furthermore, while statistically significant order effects were found for some NASA-TLX dimensions, they were not observed for pupil dilation, suggesting that physiological responses to the inherent modality characteristics were relatively stable regardless of presentation sequence.

5.2. Impact of Visualization Modalities on Performance

Performance metrics revealed a more nuanced picture, where statistically significant differences were less widespread than cognitive load, except for collision avoidance.
  • Task Completion Time: Although descriptive statistics suggested that 2D was slowest and AV/3D was the fastest, the overall ANOVA found no significant difference between modalities. This statistical outcome aligns somewhat with qualitative feedback, where 2D felt slow. However, it also indicates that any speed advantages of 3D/AV might have been counteracted by their increased complexity or cognitive load, leading to comparable overall times when variability is considered.
  • Collision Count: This metric showed a clear and statistically significant difference. The AV modality with the highest collision rate stood out, strongly supported by qualitative feedback highlighting navigation difficulties and confusing overlays. This suggests a critical usability issue with the AV implementation in this study for tasks requiring precise maneuvering. Conversely, the 3D modality resulted in very few collisions, echoed in qualitative feedback by comments on possible precise navigation, suggesting reasonable spatial control despite the high cognitive load. The 2D and 2D3D modalities also had very low collision rates, indicating safe navigation.
  • Accuracy & Quality: No statistically significant differences were found for Distance Accuracy or Photo Quality. However, descriptive trends and qualitative comments suggested advantages for specific modalities (e.g., 2D for distance accuracy, 2D3D for photo quality). The consistently high performance on Shape/Color accuracy across all modalities suggests this aspect of the task was relatively straightforward, regardless of the view. As reflected in qualitative comments, the lack of significant difference in Photo Quality might indicate that participants could generally achieve acceptable photos across modalities, even if some felt easier (2D3D) than others (3D/AV).

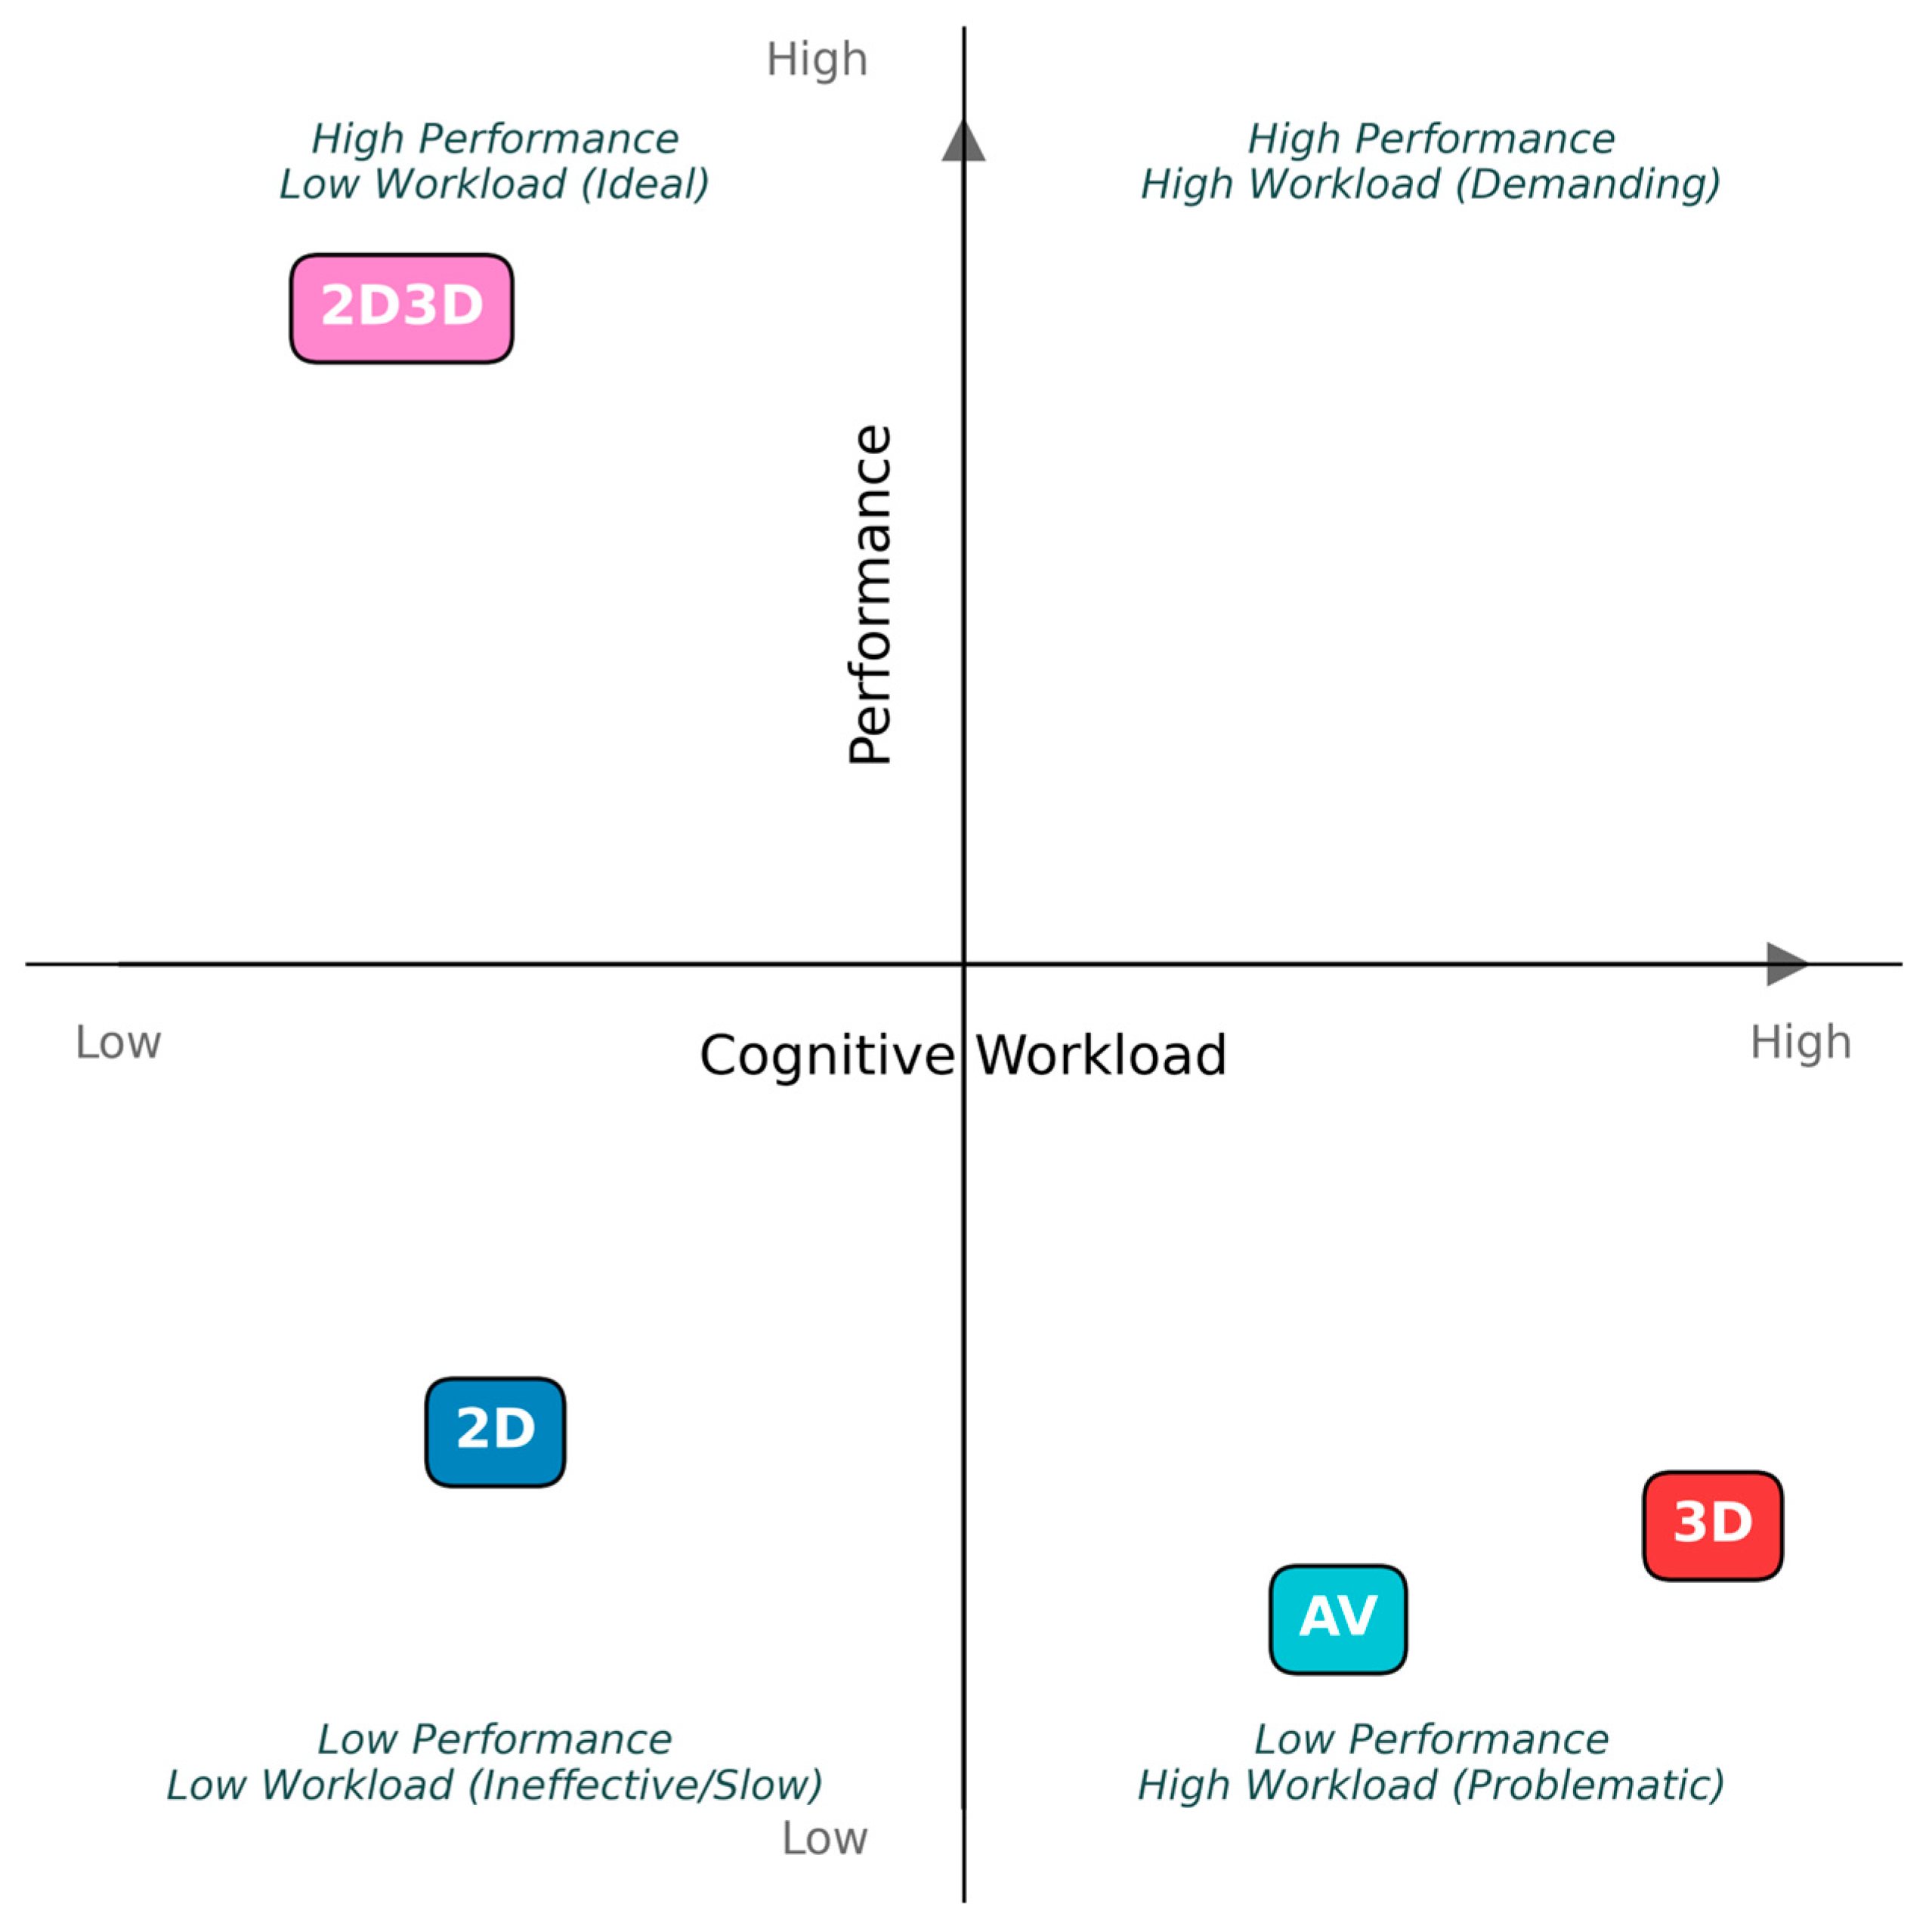
5.3. Answering the Research Question

Addressing the main research question: How do different visualization modalities affect user performance, cognitive workload, and qualitative experience during a remote industrial inspection task? The findings indicate that each modality presents a unique profile of trade-offs (see Figure 8):
  • 2D: Reliable and accurate (distance judgement, perceived performance), but subjectively demanding (effort, mental load) and descriptively slowest. Low physiological load. Familiar but potentially inefficient/tedious.
  • 3D: Allows precise navigation (low collisions) but imposes a very high cognitive load (subjective & objective), is perceived as frustrating and challenging, and leads to poor perceived performance.
  • 2D3D: It offers the lowest cognitive load and highest user comfort/ease-of-use, with good photo quality. However, it suffers in precise distance estimation. Overall, it appears to be the most user-friendly, but it has a specific performance limitation.
  • AV: Engaging and novel, with intermediate cognitive load and fast descriptive task completion. However, this modality was marred by significant navigation issues (the highest collision rate) and potential information confusion, indicating usability challenges in its current form.
Figure 8. Performance vs. cognitive workload for different visualization modalities.
Virtualworlds 04 00017 g008
Therefore, no single modality emerged as definitively superior across all criteria. The optimal choice likely depends on the specific priorities of the inspection task:
*
If minimizing cognitive load and maximizing user comfort is key, 2D3D appears favorable, provided precise distance judgement is not critical.
*
If collision avoidance during navigation is paramount, 3D (or 2D/2D3D) might be safer than AV, despite 3D’s high workload.
*
If precise distance estimation is crucial, 2D remains a strong contender, requiring more effort.
*
While potentially engaging, the AV modality requires significant refinement to address its navigation and information presentation issues before it can be recommended based on this study’s findings.
The discrepancy between subjective (high effort/demand) and objective (low pupil dilation) workload for the 2D modality warrants further investigation, potentially relating to user familiarity or the specific nature of cognitive processes captured by each measure.

5.4. Practical Implications and Beneficiaries

The findings of this study hold practical implications for various stakeholders involved in the design, deployment, and use of remote robotic systems. System designers and engineers developing teleoperation interfaces, particularly for industrial inspection in sectors like nuclear energy, manufacturing, infrastructure maintenance, or aerospace, can directly benefit. The results provide empirical evidence to guide the selection of visualization modalities based on specific operational priorities. For instance, decision-making regarding interface choice can be informed by the trade-offs identified. If minimizing operator cognitive load and maximizing comfort is paramount for long-duration tasks, the 2D3D hybrid modality shows significant promise, accepting a potential minor decrease in distance accuracy. Conversely, if navigating complex, cluttered environments where collision avoidance is the absolute priority, the 3D point cloud view, despite its high cognitive demand, offers advantages in precise maneuvering, potentially outperforming the current AV implementation, demonstrating higher collision risks. The traditional 2D view remains viable when high distance accuracy is critical, and operators can tolerate higher subjective effort.
Furthermore, organizations deploying remote inspection solutions can use these insights to understand the potential impact of different interfaces on operator performance, safety, and training requirements. Human factors researchers and practitioners also benefit from the comparative data on performance and cognitive load (subjective and objective) across these distinct immersive visualization paradigms within a co-existence space, adding to the knowledge base for designing effective human-robot interaction systems.

6. Conclusions

This study investigated the impact of four distinct visualization modalities, 2D, 3D point cloud, a 2D3D hybrid, and Augmented Virtuality (AV), on operator performance and cognitive load during a VR-based industrial robot teleoperation task for inspection. Our findings reveal that no single modality is universally optimal within the tested virtual co-existence framework; each presents a unique profile of advantages and disadvantages. Notably, the 3D view facilitated precise navigation (reflected in low collision rates like 2D/2D3D) but at the cost of the highest cognitive load. Conversely, the 2D3D hybrid minimized cognitive load and maximized user comfort, yet slightly impaired distance judgment accuracy. Traditional 2D provided reliable accuracy but incurred high subjective effort. In contrast, despite potential engagement benefits, the AV modality exhibited significant usability drawbacks, leading to the highest collision rates among the tested conditions. While collision rates differed significantly, statistical analysis revealed no significant differences between modalities for overall task completion time, distance accuracy, or the quality of inspection photos captured.
While informative, the study’s findings are limited by the relatively small university-based sample and the focus on a single structured task and environment. Therefore, future research is crucial for validation and expansion. Key directions include testing with larger, more diverse populations (including professional operators) and expanding the scope to encompass more varied tasks (e.g., fine manipulation, unstructured navigation) and environmental conditions. Systematically incorporating user feedback is essential for refining interface usability, particularly for the AV modality, and understanding the factors behind the 2D view’s high subjective effort. Further investigation into the 2D workload discrepancy (subjective vs. objective) and the potential of adaptive interfaces is also warranted. This research provides valuable comparative insights into visualization modalities, informing the design of more effective and user-centered remote inspection systems.

Supplementary Materials

The following supporting demo videos can be downloaded at: https://dspace.lib.cranfield.ac.uk/handle/1826/22136 (accessed on 15 April 2024), Video S1: Fanuc industrial robot controlled in VR.mp4 (28.04 MB), Video S2: FANUC ROBOGUIDE UNITY 3D LINK.mp4 (9.93 MB), Video S3: Control of a FANUC industrial robot arm in Unity 3D.mp4 (9.6 MB). GitHub repositories used in this project are available free for use/modification at: https://github.com/mazeasdamien/p2_fanuc_cranfield (accessed on 15 April 2024) and https://github.com/mazeasdamien/TelexistenceRig (accessed on 15 April 2024).

Author Contributions

Conceptualization, D.M.; methodology, D.M.; software, D.M.; validation, D.M. and B.N.; formal analysis, D.M.; investigation, D.M.; resources, D.M.; data curation, D.M.; writing—original draft preparation, D.M.; writing—review and editing, D.M. and B.N.; visualization, D.M.; supervision, D.M.; project administration, B.N.; funding acquisition, D.M. All authors have read and agreed to the published version of the manuscript.

Funding

This work is supported by the BNBU Research Grant with No. UICR0700120-25 at Beijing Normal-Hong Kong Baptist University, Zhuhai, PR China. This work is also supported by the Centre for Digital Engineering and Manufacturing (CDEM) of Cranfield University in the UK.

Institutional Review Board Statement

This research work was conducted at the CDEM and adhered to the Cranfield University Research Ethics System (CURES) guidelines, approved under the reference CURES/17958/2023 with project ID 20805.

Informed Consent Statement

Informed consent was obtained from all subjects involved in the study.

Data Availability Statement

In accordance with institutional ethics protocols and the project proposal submitted regarding participant data retention, the dataset supporting this study’s findings was subject to a 12-month storage limit, which has now expired. Therefore, the data is no longer available.

Acknowledgments

The author would like to sincerely thank all the participants who generously dedicated their time and effort to contribute to this study at the CDEM.

Conflicts of Interest

The authors declare no conflicts of interest.

References

  1. González, C.; Solanes, J.E.; Muñoz, A.; Gracia, L.; Girbés-Juan, V.; Tornero, J. Advanced Teleoperation and Control System for Industrial Robots Based on Augmented Virtuality and Haptic Feedback. J. Manuf. Syst. 2021, 59, 283–298. [Google Scholar] [CrossRef]
  2. Livatino, S.; Guastella, D.C.; Muscato, G.; Rinaldi, V.; Cantelli, L.; Melita, C.D.; Caniglia, A.; Mazza, R.; Padula, G. Intuitive Robot Teleoperation Through Multi-Sensor Informed Mixed Reality Visual Aids. IEEE Access 2021, 9, 25795–25808. [Google Scholar] [CrossRef]
  3. Moniruzzaman, M.; Rassau, A.; Chai, D.; Islam, S.M.S. Teleoperation Methods and Enhancement Techniques for Mobile Robots: A Comprehensive Survey. Rob. Auton. Syst. 2022, 150, 103973. [Google Scholar] [CrossRef]
  4. Rea, D.J.; Seo, S.H. Still Not Solved: A Call for Renewed Focus on User-Centered Teleoperation Interfaces. Front. Robot. AI 2022, 9, 704225. [Google Scholar] [CrossRef]
  5. Lathan, C.E.; Tracey, M. The Effects of Operator Spatial Perception and Sensory Feedback on Human-Robot Teleoperation Performance. Presence Teleoperators Virtual Environ. 2002, 11, 368–377. [Google Scholar] [CrossRef]
  6. Slezaka, R.J.; Keren, N.; Gilbert, S.B.; Harvey, M.E.; Ryan, S.J.; Wiley, A.J. Examining Virtual Reality as a Platform for Developing Mental Models of Industrial Systems. J. Comput. Assist. Learn. 2023, 39, 113–124. [Google Scholar] [CrossRef]
  7. Alexandropoulou, V.; Johansson, T.; Kontaxaki, K.; Pastra, A.; Dalaklis, D. Maritime Remote Inspection Technology in Hull Survey & Inspection: A Synopsis of Liability Issues from a European Union Context. J. Int. Marit. Saf. Environ. Aff. Shipp. 2021, 5, 184–195. [Google Scholar] [CrossRef]
  8. Einizinab, S.; Khoshelham, K.; Winter, S.; Christopher, P.; Fang, Y.; Windholz, E.; Radanovic, M.; Hu, S. Enabling Technologies for Remote and Virtual Inspection of Building Work. Autom. Constr. 2023, 156, 105096. [Google Scholar] [CrossRef]
  9. Tokatli, O.; Das, P.; Nath, R.; Pangione, L.; Altobelli, A.; Burroughes, G.; Jonasson, E.T.; Turner, M.F.; Skilton, R. Robot-Assisted Glovebox Teleoperation for Nuclear Industry. Robotics 2021, 10, 85. [Google Scholar] [CrossRef]
  10. Walker, M.; Phung, T.; Chakraborti, T.; Williams, T.; Szafir, D. Virtual, Augmented, and Mixed Reality for Human-Robot Interaction: A Survey and Virtual Design Element Taxonomy. ACM Trans. Hum. Robot Interact. 2023, 12, 1–39. [Google Scholar] [CrossRef]
  11. Martín-Barrio, A.; Roldán-Gómez, J.J.; Rodríguez, I.; del Cerro, J.; Barrientos, A. Design of a Hyper-Redundant Robot and Teleoperation Using Mixed Reality for Inspection Tasks. Sensors 2020, 20, 2181. [Google Scholar] [CrossRef]
  12. Kamran-Pishhesari, A.; Moniri-Morad, A.; Sattarvand, J. Applications of 3D Reconstruction in Virtual Reality-Based Teleoperation: A Review in the Mining Industry. Technologies 2024, 12, 40. [Google Scholar] [CrossRef]
  13. Nenna, F.; Zanardi, D.; Gamberini, L. Enhanced Interactivity in VR-Based Telerobotics: An Eye-Tracking Investigation of Human Performance and Workload. Int. J. Hum. Comput. Stud. 2023, 177, 103079. [Google Scholar] [CrossRef]
  14. Zhou, T.; Zhu, Q.; Du, J. Intuitive Robot Teleoperation for Civil Engineering Operations with Virtual Reality and Deep Learning Scene Reconstruction. Adv. Eng. Inform. 2020, 46, 101170. [Google Scholar] [CrossRef]
  15. Müller, A.; Petru, R.; Seitz, L.; Englmann, I.; Angerer, P. The Relation of Cognitive Load and Pupillary Unrest. Int. Arch. Occup. Env. Health 2011, 84, 561–567. [Google Scholar] [CrossRef] [PubMed]
  16. Hart, S.G. Nasa-Task Load Index (NASA-TLX); 20 Years Later. Proc. Hum. Factors Ergon. Soc. Annu. Meet. 2006, 50, 904–908. [Google Scholar] [CrossRef]
  17. Bejczy, B.; Bozyil, R.; Vaičekauskas, E.; Krogh Petersen, S.B.; Bøgh, S.; Hjorth, S.S.; Hansen, E.B. Mixed Reality Interface for Improving Mobile Manipulator Teleoperation in Contamination Critical Applications. Procedia Manuf. 2020, 51, 620–626. [Google Scholar] [CrossRef]
  18. Wibowo, S.; Siradjuddin, I.; Ronilaya, F.; Hidayat, M.N. Improving Teleoperation Robots Performance by Eliminating View Limit Using 360 Camera and Enhancing the Immersive Experience Utilizing VR Headset. IOP Conf. Ser. Mater. Sci. Eng. 2021, 1073, 012037. [Google Scholar] [CrossRef]
  19. Su, Y.; Chen, X.; Zhou, T.; Pretty, C.; Chase, G. Mixed Reality-Integrated 3D/2D Vision Mapping for Intuitive Teleoperation of Mobile Manipulator. Robot. Comput. Integr. Manuf. 2022, 77, 102332. [Google Scholar] [CrossRef]
  20. Tachi, S. Telexistence: Past, present, and future. In Virtual Realities: International Dagstuhl Seminar, Dagstuhl Castle, Germany, 9–14 June 2013, Revised Selected Papers; Springer: Berlin/Heidelberg, Germany, 2015; pp. 229–259. [Google Scholar]
  21. Stoakley, R.; Conway, M.J.; Pausch, R. Virtual Reality on a WIM. In Proceedings of the SIGCHI Conference on Human Factors in Computing Systems—CHI ’95, Denver, CO, USA, 7–11 May 1995; ACM Press: New York, NY, USA, 1995; pp. 265–272. [Google Scholar]
  22. Gray, S.; Chevalier, R.; Kotfis, D.; Caimano, B.; Chaney, K.; Rubin, A.; Fregene, K.; Danko, T. An Architecture for Human-Guided Autonomy: Team TROOPER at the DARPA Robotics Challenge Finals. J. Field Robot. 2017, 34, 852–873. [Google Scholar] [CrossRef]
  23. Rusu, R.B.; Cousins, S. 3D Is Here: Point Cloud Library (PCL). In Proceedings of the 2011 IEEE International Conference on Robotics and Automation, Shanghai, China, 9–13 May 2011; pp. 1–4. [Google Scholar]
  24. Whitney, D.; Rosen, E.; Ullman, D.; Phillips, E.; Tellex, S. ROS Reality: A Virtual Reality Framework Using Consumer-Grade Hardware for ROS-Enabled Robots. In Proceedings of the 2018 IEEE/RSJ International Conference on Intelligent Robots and Systems (IROS), Madrid, Spain, 1–5 October 2018; pp. 1–9. [Google Scholar]
  25. Kohn, S.; Blank, A.; Puljiz, D.; Zenkel, L.; Bieber, O.; Hein, B.; Franke, J. Towards a Real-Time Environment Reconstruction for VR-Based Teleoperation Through Model Segmentation. In Proceedings of the 2018 IEEE/RSJ International Conference on Intelligent Robots and Systems (IROS), Madrid, Spain, 1–5 October 2018; pp. 1–9. [Google Scholar]
  26. Okura, F.; Ueda, Y.; Sato, T.; Yokoya, N. Free-Viewpoint Mobile Robot Teleoperation Interface Using View-Dependent Geometry and Texture. ITE Trans. Media Technol. Appl. 2014, 2, 82–93. [Google Scholar] [CrossRef]
  27. Wei, D.; Huang, B.; Li, Q. Multi-View Merging for Robot Teleoperation With Virtual Reality. IEEE Robot. Autom. Lett. 2021, 6, 8537–8544. [Google Scholar] [CrossRef]
  28. Kazanzides, P.; Vagvolgyi, B.P.; Pryor, W.; Deguet, A.; Leonard, S.; Whitcomb, L.L. Teleoperation and Visualization Interfaces for Remote Intervention in Space. Front. Robot. AI 2021, 8, 747917. [Google Scholar] [CrossRef]
  29. Bell, S.; Upchurch, P.; Snavely, N.; Bala, K. Material Recognition in the Wild with the Materials in Context Database. In Proceedings of the IEEE Conference on Computer Vision and Pattern Recognition, Boston, MA, USA, 7–12 June 2015. [Google Scholar]
  30. de Boissieu, F.; Godin, C.; Guilhamat, B.; David, D.; Serviere, C.; Baudois, D. Tactile Texture Recognition with a 3-Axial Force MEMS Integrated Artificial Finger. In Robotics; The MIT Press: Cambridge, MA, USA, 2010; pp. 49–56. [Google Scholar]
  31. Bradley, J.V. Complete Counterbalancing of Immediate Sequential Effects in a Latin Square Design. J. Am. Stat. Assoc. 1958, 53, 525–528. [Google Scholar] [CrossRef]
  32. Jackson, I.; Sirois, S. Infant Cognition: Going Full Factorial with Pupil Dilation. Dev. Sci. 2009, 12, 670–679. [Google Scholar] [CrossRef]
  33. Kret, M.E.; Sjak-Shie, E.E. Preprocessing Pupil Size Data: Guidelines and Code. Behav. Res. Methods 2019, 51, 1336–1342. [Google Scholar] [CrossRef]
Figure 2. An experimental setup and participants perform the inspection tasks.
Virtualworlds 04 00017 g002
Figure 4. Schematic representation of experimental task setups. Setup 1 for modality 2D. Setup 2 for modality 2D3D. Setup 3 for modality 3D. Setup 4 for modality AV.
Virtualworlds 04 00017 g004
Figure 6. Change in pupil dilation from baseline across modalities.
Virtualworlds 04 00017 g006
Figure 7. Examples of valid (the 2 photos on the right) and invalid (the 2 photos on the left) reporting from participants.
Virtualworlds 04 00017 g007
Table 1. DDS data structures for synchronization.
Data Flow DirectionData Structure/Topic NamePrimary Content/Purpose
Physical System → OperatorRobot_StateTime-stamped robot joint angles (J1-J6) and calculated world pose (X, Y, Z, W, P, R).
Physical System → OperatorRobot_Point_CloudTime-stamped sequence of 3D points and color data from environmental sensors (e.g., Kinect).
Physical System → OperatorRobot_ImageTime-stamped, compressed (MPEG) image data from the robot’s end-effector camera.
Physical System → OperatorRobot_AlarmTime-stamped status or error messages generated by the robot controller.
Physical System → OperatorRobot_Reachability_StateTime-stamped boolean flag indicating if a target pose is reachable.
Operator → Physical SystemOperator_Teleop_TargetTime-stamped desired target pose (X, Y, Z, W, P, R) for the robot end-effector from operator input.
Operator → Physical SystemOperator_RequestTime-stamped discrete commands initiated by the operator (e.g., RESET, ABORT, HOME).
Operator → Physical SystemOperator_Path_PointTime-stamped data for creating/modifying robot path waypoints (ID, Add/Update/Delete flags, Pose).
Cyber → OperatorExpert_GuidanceTime-stamped instructions, suggestions, or context information from the Expert Support System for the UI.
Cyber → Operator/PhysicalCollision_AlertTime-stamped warning/status from collision detection module (e.g., proximity level, collision imminent).
Cyber/Physical → OperatorHaptic_CommandTime-stamped command to trigger specific haptic feedback on the operator’s controllers.
Physical/Cyber → Operator/CyberProcessed_Perception_DataTime-stamped results of perception processing (e.g., detected ArUco tag poses)
Table 2. Demographic characteristics of the 24 participants.
CharacteristicsNumber of
Participants (n = 24)
Percentage (%)
GenderMale1979.17%
Female520.83%
Previous exposure to VRYes1770.80%
No729.20%
Familiar with roboticsYes1562.50%
No937.5%
Confidence in using new technologiesHigh833.30%
Moderate1562.5%
Low14.2%
Table 3. Summary of performance metrics across modalities.
Metric2D3D2D3DAVANOVA (Main Effect of Modality) F(3, 69)
Completion Time (s)248.75
(±85)
201.88
(±65)
218.29
(±75)
200.46
(±70)
F = 2.13, p = 0.102
Collision Count (%)1.39
(±1.0)
2.31
(±1.53)
1.39
(±0.85)
5.56
(±3.1)
F = 4.50, p = 0.006
Distance Accuracy (%)84.72
(±10)
79.17
(±12)
76.39
(±13)
80.56
(±12)
F = 1.50, p = 0.222
Photo Quality (%)94.44
(±5.0)
93.06
(±5.5)
97.22
(±3.0)
93.06
(±4.0)
F = 2.20, p = 0.096
Table 4. Summary of participant feedback themes by modality (n = 24).
AspectFeedback ThemeNumber of Participants (%)
2D INTERFACE
PositiveClear, easy to judge distances accurately7 (29.2%)
Felt successful5 (20.8%)
Simple, straightforward4 (16.7%)
NegativeRequired high mental effort/concentration9 (37.5%)
Felt slower6 (25.0%)
Less engaging/detached from environment3 (12.5%)
3D INTERFACE
PositivePrecise navigation possible5 (20.8%)
Good for identifying shape3 (12.5%)
NegativeHigh overall workload5 (20.8%)
Frustrating/Difficult to control precisely11 (45.8%)
Felt performance was poor7 (29.2%)
Can feel tiring/visually demanding4 (16.7%)
2D3D INTERFACE
PositiveEasiest/Most comfortable/Least effort required13 (54.2%)
Efficient because both 2D and 3D can be used together8 (33.3%)
NegativeVisually demanding3 (12.5%)
AV INTERFACE
PositiveAugmented information is occasionally helpful5 (20.8%)
NegativeDifficult to navigate/Prone to collisions11 (45.8%)
Information overlay sometimes confusing/Obscuring13 (54.2%)
Control felt imprecise at times3 (12.5%)
Disclaimer/Publisher’s Note: The statements, opinions and data contained in all publications are solely those of the individual author(s) and contributor(s) and not of MDPI and/or the editor(s). MDPI and/or the editor(s) disclaim responsibility for any injury to people or property resulting from any ideas, methods, instructions or products referred to in the content.

