Abstract
The use of plant-based medicine dates back centuries, and cannabis (Cannabis sativa) is one such plant that has been used medicinally and illicitly. Although cannabis contains hundreds of cannabinoids and other natural products, its potential medicinal use was largely ignored by modern researchers due to the legal restrictions and heavy regulations introduced in the 1930s. As restrictions on cannabis access have eased since the 1990s there is renewed interest in the research of cannabinoids and the other components in the cannabis plant. The focus of this review article is an overview of cannabis and the analytical challenges in the quality control and biological analysis. The pharmacological effects of psychoactive cannabinoids, delta-9-tetrahydrocannabinol (Δ9-THC) and delta-8-trans- tetrahydrocannabinol (Δ8-THC) is discussed, along with an abundant non-intoxicating cannabinoid, cannabidiol (CBD). The analytical methods for the quality control assays of cannabis products include gas chromatography and liquid chromatography coupled to different detectors, including mass spectrometry. This review will highlight various analytical methods for the quality control of cannabis products and the quantitation of cannabinoids in biological matrices for forensics and toxicology.
1. Introduction
Although the potency of cannabis has been known for thousands of years, the industry has been slow to develop and has rapidly sped up over the past several years. The slow growth of the cannabis industry can be attributed to a negative public perception of cannabis throughout most of the 20th century because of its psychoactive components. As perceptions change, movements to legalize and regulate cannabis will increase in the United States and elsewhere, leading to rapid growth in the cannabis industry. A recent Pew survey found that 89% of US adults say either that marijuana should be legal for medical and recreational use by adults (59%) or that it should be legal for medical use only (30%) [1]. The global legal cannabis market was valued at 17.8 billion US dollars in 2021 and is expected to grow to more than 130 billion by 2030 [2].
The cannabis plant (Cannabis sativa) has been cultivated for thousands of years for use in fabric (Figure 1). The use of cannabis for its psychoactive effects can be traced back to China around 2500 BC. The term marijuana generally refers to cannabis plants or the plant material with high levels of delta-9-tetrahydrocannabinol (Δ9-THC), the main psychoactive component of cannabis. Hemp, another name for cannabis, generally refers to the plants with low levels of Δ9-THC. From the 1800s to 1937, major US pharmaceutical firms marketed cannabis tinctures as analgesics and sedatives. However, the US Marihuana Tax Act of 1937 prohibited the sale of such products. The media and government began to shift public perception against marijuana as evident in the 1936 propaganda film Reefer Madness, which promoted the idea that opium, morphine and heroin were dangerous, but “even more dangerous, more deadly, than these soul destroying drugs is the menace of marijuana” (Figure 1) [3,4]. The classification of THC as a Schedule I substance under the US Controlled Substance Act of 1970 also acted to hinder cannabis research progress and growth in the cannabis industry. However, from 1990, public perception has shifted in regard to the legalization of marijuana for medical and recreational use [4].
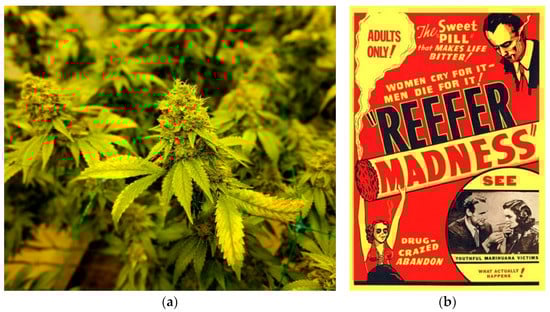
Figure 1.
Cannabis plant and a 1930s film poster. (a) Mature cannabis plants. Reprinted from My 420 Tours (https://commons.wikimedia.org/wiki/File:Mature_cannabis_plant.jpg, accessed on 17 February 2023), https://creativecommons.org/licenses/by-sa/4.0/legalcode, accessed on 17 February 2023); (b) Poster for the 1936 propaganda film Reefer Madness exaggerating the dangers of marijuana [3]. This image is in the public domain.
There are more than 460 compounds identified in cannabis, and more than 140 are phytocannabinoids, which are a unique group of C21 terpenophenolic natural products. Phytocannabinoids are categorized into 11 types: (–)-delta-9-trans-tetrahydrocannabinol (Δ9-THC), (–)-delta-8-trans- tetrahydrocannabinol (Δ8-THC), cannabigerol (CBG), cannabichromene (CBC), cannabidiol (CBD), cannabinodiol (CBND), cannabielsoin (CBE), cannabicyclol (CBL), cannabinol (CBN), cannabitriol (CBT) and other cannabinoids [5]. The focus of this review is to provide a brief history of the societal and scientific views of cannabis and a discussion of the analytical methodologies for cannabinoid analyses. The psychoactive constituents reviewed include Δ9-THC, Δ8-THC and CBN. In addition, CBD, a non-intoxicating cannabinoid that is the second most prevalent bioactive constituent in cannabis, will be discussed. The structures of the reviewed cannabinoids are shown in Figure 2.
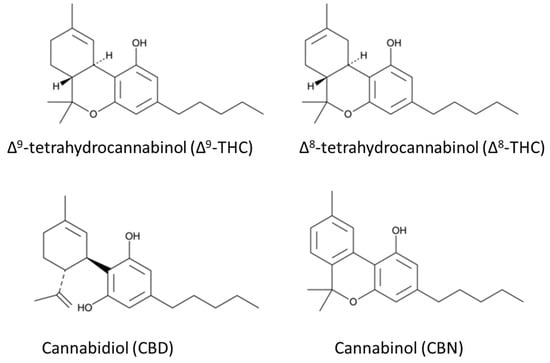
Figure 2.
Chemical structures of the well-known cannabinoids in Cannabis sativa.
Therapeutic Research on Cannabis
The first pure phytocannabinoid isolated from cannabis was CBN in 1899 [6]. CBN is mildly psychoactive and has some pharmacological activity [7,8]. It is marketed as a sleep aid, though there is a lack of peer reviewed studies on the pharmacology of CBN [9].
By the 1940s, researchers had synthesized some tetrahydrocannabinols that had psychoactive effects on laboratory animals. The structure of Δ9-THC was discovered in the 1960s, and its bioactivity at the CB1 receptor was identified decades later. Of the principal constituents of cannabis, Δ9-THC is the most abundant and most active psychoactive component which can be found in the plant in various amounts from trace levels to 12% by weight. In cannabis plants, Δ8-THC is found in trace levels and has approximately half the psychoactive effect of Δ9-THC [10]. The legal status of Δ8-THC in the United States has been the subject of debate. The Agriculture Improvement Act of 2018 (https://www.ers.usda.gov/agriculture-improvement-act-of-2018-highlights-and-implications/ accessed on 17 February 2023) (known informally as the 2018 Farm Bill) defined hemp as cannabis or a cannabis product with less than 0.3% Δ9-THC and removed hemp and hemp products from the legal definition of marijuana in the Controlled Substance Act of 1970. Since hemp was defined as “all derivatives, extracts, cannabinoids, isomers, acids, salts and salts of isomers” of cannabis excluding Δ9-THC [11], then an argument can be made that Δ8-THC is legal. However, Δ8-THC is present only in negligible amounts in cannabis plants; therefore, the Δ8-THC produced for consumers is cyclized from CBD making it a synthetic cannabinoid, which some may argue is illegal under the 2018 Farm Bill. Legality aside, the sale of Δ8-THC has increased substantially in the areas of the United States where marijuana is not legal.
CBD is one of the most abundant bioactive constituents in cannabis. It has been suggested that CBD might aid those experiencing pain, anxiety, insomnia and other ailments [12]. CBD is frequently mischaracterized as non-psychoactive or non-psychotropic. However, these labels are inaccurate as it has pharmacological effects for anxiety, depression and addiction [13]. CBD should, instead, be characterized as non-intoxicating compared to THC since it lacks the craving and compulsive use that would be indicative of a drug of abuse [13]. The number of CBD oils, tinctures and vaporization liquids marketed to consumers has increased recently as many people see it as a safe alternative to using products containing Δ9-THC. The quality control of these products needs to be addressed by the industry or government. A 2016 study found that many CBD were mislabeled, with lab tests showing only 31% of the 84 CBD products from 31 companies were accurately labeled with the CBD content [14].
Raw cannabis plant material has low amounts of neutral cannabinoids (Δ8-THC, Δ9-THC, CBN and CBD). These phytocannabinoids mostly exist as carboxylic acid precursors. For example, Δ9-tetrahdrocannabinolic acid (Δ9-THCA) is the carboxylic acid precursor to Δ9-THC. When Δ9-THCA is heated, the compound undergoes decarboxylation to form Δ9-THC. The use of cannabis traditionally involves smoking baking, or vaporization to ensure the maximum conversion of Δ9-THCA to Δ9-THC [15,16]. In the same manner, other cannabinolic acid precursors (Δ8-THCA, CBNA and CBDA) undergo decarboxylation to form Δ8-THC, CBN and CBD [16].
Although the public acceptance of cannabis use is growing, there are some adverse effects of its use and abuse. Smoking marijuana can have the same effects on the lungs as smoking tobacco, including coughing and phlegm. Acute cannabis use increases the heart rate and mildly increases the supine blood pressure, with a tolerance to these effects present with repeat exposure [17]. There are neurophysiological effects from persistent cannabis use in youth as adolescent-onset users have a greater cognitive decline than adult-onset users [18]. These adverse effects of the recreational use of cannabis may be mitigated by increasing the efforts toward delaying the onset use of cannabis in young people. Continued research may provide more guidance for cannabis or cannabinoids dosages in medicinal use.
Despite the negative public perception of cannabis over the years, the US Food and Drug Administration (FDA) has approved three drugs that are cannabinoids. In 1985, the FDA approved dronabinol (Marinol), which is a capsule containing synthesized Δ9-THC in sesame oil for the treatment of nausea and vomiting during cancer chemotherapy. A synthetic Δ9-THC analog, nabilone (Cesamet), was also approved for the treatment of nausea and vomiting. The use of Marinol was approved for the stimulation of appetite in AIDS patients. In 2018, CBD (Epidolex) was approved by the FDA for the treatment of two forms of drug-resistant epilepsy (Lennox–Gastuat and Dravet syndrome). The FDA’s approval of these cannabinoids has led to a more positive public opinion on medical marijuana.
Researchers continue to study the use of cannabinoids for medicinal purposes for a variety of ailments or diseases. In 2017, The National Academies of Sciences, Engineering and Medicine Committee for the Health Effects of Marijuana published a review of clinical studies and determined that there is substantial evidence that cannabis or cannabinoids are effective for the treatment of chronic pain in adults [19,20], chemotherapy-induced nausea and vomiting [21] and patient-reported multiple sclerosis spasticity [22]. The committee found there was a lack of good- or fair-quality systematic literature for the evidence of cannabinoid effectiveness for the treatment of cancer, anxiety, anorexia nervosa, amyotrophic lateral sclerosis (ALS), depression, Parkinson’s disease and a number of other diseases or disorders [20].
2. Pharmacokinetic Considerations
The pharmacological effects of cannabinoids are due to an affinity to two endogenous cannabinoid receptors, CB1, located in the central and peripheral neurons, and CB2, which is mostly found in the immune system [23]. Each cannabinoid receptor is important for the glutamate, dopamine and γ-GABA neurotransmitter pathways, and as a result, cannabinoids have sedative and stimulative properties depending on the dose. Low doses of Δ9-THC can result in relaxation and the impairment of short-term memory. At high doses, or with long-term use, panic, delirium and schizophrenia-like psychosis can occur [24].
In the liver, Δ9-THC undergoes rapid metabolism and more than 80 metabolites have been identified [25]. Phase I oxidation of Δ9-THC by the CYP 2C9, 2C19 and 3A4 enzymes in humans form 11-hydroxy- Δ9-THC (11-OH-Δ9-THC), which is also a CB1 agonist with the same potency as Δ9-THC [26]. A non-psychoactive metabolite, 11-nor-9-carboxy- Δ9-THC (11-COOH-Δ9-THC), is produced through the oxidation of 11-OH-Δ9-THC. The glucuronidation of 11-COOH-Δ9-THC in the kidney is the final step of the biotransformation in humans; therefore, 11-COOH-Δ9-THC is a common analyte in urine assays to detect cannabis use.
A 30–50 mg dose of Δ9-THC, which is a typical amount for a daily recreational user [27], inhaled by smoking a marijuana cigarette results in a peak Δ9-THC plasma concentration of 10–150 ng/mL within minutes after the initial dose, which falls to 0.5–2 ng/mL at the distribution equilibrium 6–8 h later [28,29,30]. In the population pharmacokinetic model of a single 9 mg inhalation dose, the Δ9-THC distribution half-life was approximately 6 min, and the elimination half-life was 22 h. The long elimination half-life results from the transfer of Δ9-THC stored in the lipids to and from the blood [31]. The active metabolite, 11-OH-Δ9-THC, can be detected in the plasma within minutes after the inhalation of Δ9-THC, and the 11-OH-Δ9-THC concentration will remain at around 10% of Δ9-THC concentrations for about 45 min until the Δ9-THC concentration rapidly declines [32]. In a study of six participants, the peak 11-OH-Δ9-THC concentration occurred 15 min after smoking a standard high dose marijuana cigarette (3.55% Δ9-THC) and dissipated after 5 h in the plasma [32]. After smoking the standard high dose marijuana cigarette, the inactive metabolite 11-COOH-Δ9-THC plasma reached a peak concentration of 54 ng/mL, plateaued within the first hour at 10 ng/mL and slowly declined to the level of detection for the assay (LOD = 0.5 ng/mL) over a period of 168 h [32]. The slow release of ∆9-THC from the lipids to the blood circulation in chronic users contributes to a long elimination half-life of 11-COOH-Δ9-THC of 12 days, but for infrequent users, the elimination half-life was reported to be 5–6 days [33].
CBD is metabolized in the liver by cytochrome P450, specifically the enzymes CPY3A and CYP2C, as well as uridine 5′-diphospho-glucuronosyltransferase. This leads to the active hydroxylated 7-OH-CBD metabolite, which is then converted to the inactive 7-COOH-CBD metabolite [12]. These metabolites are excreted in feces and, to a lesser extent, in urine. In vitro experiments in simulated gastric fluid show that CBD is converted to Δ9-THC under acidic conditions (pH = 1.0–2.5) [34]. However, the conversion does not occur from the heat during smoking, nor has it been observed in vivo [35,36].
CBD was reported to have a long elimination half-life, with a half-life of 24 h reported after intravenous administration and 31 h after inhalation [37]. The peak urinary concentrations from 100 mg of orally administered CBD were 734 ng/mL at 4.7 h in 18 healthy adults, which was higher than 100 mg of vaporized CBD with a mean peak concentration of 240 ng/mL at 1.3 h in 18 adults [38]. The order of CBD and its metabolite abundance in urine is 7-OH-CBD > CBD > 7-COOH-CBD with 7-COOH-CBD having the longest half-life in urine (30 and 52 h, respectively, for the inhaled and oral routes) [38].
Similar to Δ9-THC, Δ8-THC is oxidized at the 11th carbon in the liver to form 11-OH-Δ8-THC, though its rate of formation was found to be slower in vivo compared to the 11-OH-Δ9-THC metabolite, and this may point to less pharmacological activity. This oxidation is catalyzed by CYP2C9. The excretion of Δ8-THC has not been well documented or explored, but it has been assumed to be similar to that of Δ9-THC [10].
3. Analysis of Cannabis Plant Material and Products
The sample preparation is an important part of a successful cannabinoid analysis. For solid cannabis (including the flower, inflorescence and seeds) the solids are typically ground into a fine powder and extracted using a solid–liquid extraction. In the past, the most often reported extraction solvent was 9:1 methanol/chloroform (% v/v) based on the solubility of an internal standard for gas chromatography [39]. However, suitable cannabinoid reference standards are widely available and safer extraction solvents are used instead [40]. The solvent of choice is ethanol (EtOH) for its extraction abilities due to its high affinity for cannabinoid molecules [41]. Methanol and ethyl acetate have also been used as extraction solvents. Cannabis medical extracts (CME), which are preparations of cannabis in oil, are becoming increasingly popular. For CMEs, the available methods include refluxing the inflorescence in ethanol or olive oil at 78 and 110 °C, respectively [42].
Historically, gas chromatography with flame ionization detection (GC-FID) or high performance liquid chromatography with ultraviolet (HPLC/UV) have been used to determine cannabinoid concentrations for quality control. GC instruments use a hot injection port for the sample introduction which decarboxylates the cannabinoid acids and converts them to neutral cannabinoids. For example, Δ9-THCA is converted to Δ9-THC. While many users smoke, vape or bake cannabis, which converts the acids into the decarboxylated forms, there is a need to determine the precursor acid content, such as Δ9-THCA or CBDA, for cannabis products that are not heated when used.
The LC/UV methods do not decarboxylate the cannabinoid analytes during the analysis. The sensitivity of the LC/UV methods in cannabinoid analysis is adequate, but there can be issues with coeluting the peaks. An example of this is shown in Figure 3a. The introduction of LC coupled with electrospray ionization mass spectrometry (LC-ESI-MS or LC-MS) in the 1990s increased the sensitivity of small molecules, such as cannabinoids, and it improved the ability to discriminate between coeluting the analytes by molecular weight in the chromatograms, which was not possible with LC/UV. The LC-MS techniques using extracted ion chromatograms (XIC) or selected ion monitoring (SIM) increase the selectivity. Figure 3b shows an XIC of cannabinoids extracted from a hemp flower. The CBD and CBDA peaks are coeluted on the UV chromatogram, but they have distinct chromatograms in LCMS with the XIC. The THCA and CBC peaks can also be analyzed as separate peaks in the XIC.
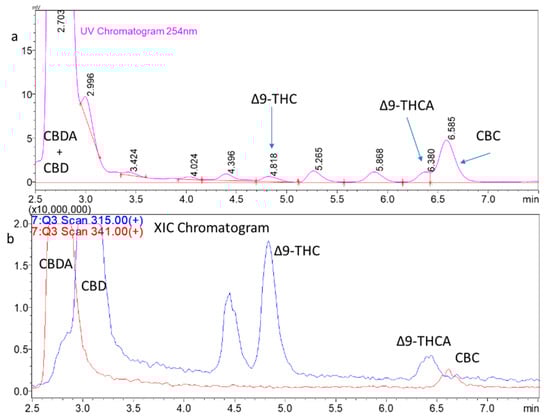
Figure 3.
Hemp flower extract chromatograms. (a) LC/UV chromatogram of a hemp flower extract. The chromatogram has the expected abundant peak for CBD and CBDA but the peaks coelute. (b) LC scan MS analysis of the same extract shown in (a) with the extracted ion chromatograms for the protonated CBD (m/z 315) and CBDA (m/z 341) molecular ions. The Y-axis has been magnified to show the low levels of THC and THCA present as well as CBC. The THCA and CBC peaks also coelute.
A selection of the published methods for the analysis of cannabinoids in the various cannabis products is shown in Table 1.

Table 1.
Representative examples of the recent studies using mass spectrometry-based analytical methods for the quality control of cannabis-based products.
Advanced mass spectrometry methods can help with the discovery of unknown cannabinoids in cannabis products. Citti et al. reported a metabolomics approach to discover new cannabinoids in CMEs with HPLC coupled with high-resolution tandem mass spectrometry (LC-ESI-HRMS) [42].
The amounts of the non-cannabinoid components, such as terpenoids, may be important for the synergistic activity with THC. Terpenoids are compounds derived from the isoprene and are found naturally in many plants. Terpenoids are responsible for the aroma of many plants, including cannabis, and they are typically analyzed using the GC or GCMS methods [49]. The complementary pharmacological effect of THC with other cannabinoids or terpenoids is known as the entourage effect [50].
In an analysis of US law-enforcement-seized recreational use cannabis, ElSohly et al. found that the amount of cannabinoids in the seized cannabis, including Δ9-THC and CBD, has increased over the years [51]. Cannabis potency is primarily measured by the amount of Δ9-THC present. The potency of cannabis will vary depending on the strain or the type of cannabis. Sinsemilla, the unfertilized female cannabis plant material, has become more mainstream in the illicit industry compared to typical marijuana and has a greater THC content than other types. In cannabis samples seized by the US Drug Enforcement Agency (DEA), the Δ9-THC content steadily increased from 3% to 12% over the years 1995 to 2014 [39]. The amounts of CBD (<5%) and CBN (2–5%) have decreased over the years in seized samples, indicating that illicit cannabis cultivators are breeding plants with a high Δ9-THC content, and as a consequence, the product may be missing some of the entourage effect provided by CBD and the other components that have been steadily reduced from cannabis over the years [39].
4. Biological Sample Analysis
4.1. Analytical Methods in Biological Matrices
There is a growing need to analyze biological samples for the concentration of cannabinoids or their metabolites. In the field of toxicology, these assays could be used to establish whether someone is unlawfully intoxicated from cannabis or if cannabis contributed to the observed toxicity in a clinical setting. The assays using GCMS to measure Δ9-THC and the metabolites in urine emerged in the early 1980s [52]. Typically, drugs of abuse do not have the required volatility for GCMS, and the analytes must be derivatized before the analysis, which adds time and costs to the sample preparation due to the need to add reagents [53]. The introduction of ESI-MS in 1989 meant that molecules of all sizes and volatilities could be ionized and analyzed, and ESI-MS could be coupled with HPLC (HPLC-MS or LC-MS) [54,55]. The early LC-MS methods used selected ion monitoring, but tandem mass spectrometry (MS/MS), especially in the form of triple quadrupole mass spectrometry, increased the selectivity and sensitivity of drug analysis with the benefit of eliminating some sample preparation steps, such as solid phase extraction, for the analysis of drugs of abuse, including cannabinoids.
For LC-MS/MS, the HPLC method is important especially when the isomers Δ8-THC and Δ9-THC are analyzed. The typical C18 reversed phase gradient method must be adjusted from the traditional linear gradients to separate the isomers. Reber et al. found success using a step gradient with shallow gradient steps that were near to the isocratic conditions [56,57].
A selection of the analytical methods for cannabinoid analysis in biological matrices is shown in Table 2.
Table 2.
Representative cannabinoid quantitation studies in biological matrices.
The body often clears drugs and other small molecules through the addition of glucuronic acid (glucuronidation) in the liver. These glucuronide conjugates are cleared by the kidney and excreted in urine. The sample preparation for the MS methods can include the hydrolysis of the conjugate glucuronide to liberate the drug for analysis. The methods that use acid or base hydrolysis are quick, but nonspecific hydrolysis may occur [67]. The enzyme hydrolysis methods have long incubation times (up to 24 h) for the reaction to occur, which may lead to an inefficient hydrolysis or stability [68]. The GCMS methods for cannabinoids (and other drugs) in urine typically include an extraction step, such as solid phase extraction, hydrolysis or a derivatization step [52].
LC-MS can ionize large molecules such as drug glucuronide conjugates for analysis, whereas the GC methods cannot since the conjugates are not volatile. The sample preparation procedures that do not include hydrolysis must analyze the drug glucuronide conjugate and the drug itself in urine. The typical methods are “dilute and shoot” (DnS) methods [69]. The DnS methods have the advantage of reducing the sample preparation time by removing the sample cleanup steps. Young et al. reported a rapid DnS LC-MS/MS method with a 5 min chromatographic run time for quantifying Δ9-THC-COOH and Δ9-THC -COO(Glu) in urine. The sample preparation involved diluting urine 1:9 with an internal standard followed by centrifugation and injection into LC-MS/MS [58]. Vikingsson et al. reported a method using a combined base and enzyme hydrolysis of urine samples followed by SPE and LC-MS/MS analysis for ∆9-THC, ∆8-THC, 11-OH-∆9-THC, ∆9-THC-COOH, ∆8-THC-COOH, ∆9-tetrahydrocannabivarin (∆9-THCV), ∆9-tetrahydrocannabivarin carboxylic acid (∆9-THCVCOOH), CBD, 7-OH-CBD and CBD-COOH [59].
4.2. Clinical Analysis
The determination of pharmacokinetics requires the quantitation of a drug and its metabolites in the blood. The sample preparation may include the removal of red blood cells from blood samples using centrifugation, resulting in the blood plasma followed by the plasma protein precipitation (PPT) with the addition of a solvent, such as acetonitrile. Plasma proteins precipitate when acetonitrile is added, and then the supernatant is analyzed. Some methods use solid phase extraction of whole blood samples to extract the analyte from the complex blood matrix and to concentrate the analyte [63]. For the GCMS methods, the analyte needs to be derivatized using methylation or another technique [70]. Currently, the LC-MS/MS methods are a better choice than the GCMS methods for cannabinoids in blood since less sample preparation is required, saving time and using fewer solvents and supplies. Commercial GC-MS/MS systems are available which have a better sensitivity than GCMS. However, the GC-MS/MS methods still require sample derivatization [71].
A 1992 study by Huestis et al. used GCMS to determine pharmacokinetics for Δ9-THC, 11-OH-∆9-THC and ∆9-THC-COOH in the blood of six human subjects who each smoked a single marijuana cigarette in a controlled setting [32]. Huestis et al. showed, for the first time, that Δ9-THC is present in the blood almost instantly after the first puff of marijuana smoke and peaks a few minutes later. Over time, the popularity of oral “edible” cannabis preparations have significantly increased compared to smoking cannabis, and Vandrey et al. presented a pharmacokinetics study of Δ9-THC, 11-OH-∆9-THC and ∆9-THC-COOH in the blood and oral fluid from healthy adults (n = 6 per dose) who were administered brownies containing 10, 25, or 50 mg of Δ9-THC [72]. The sample preparation included solid phase extraction of the analytes from the whole blood samples. In a 2022 study, Bergeria et al. reported the pharmacokinetic profiles of Δ9-THC, CBD and metabolites in a study where the participants orally ingested CBD products and inhaled a vaporized CBD product [73].
4.3. Forensic Analysis
The investigation of driving under the influence of drugs (DUID) is of increasing concern by law enforcement and the general public [74,75]. The impairment of driving caused by cannabis use, or the combined use of cannabis and alcohol, have been reported [75,76]. Urine analysis is not adequate for testing impairment from cannabis because studies have shown that the presence of ∆9-THC and ∆9-THC-COOH in urine has an extended detection time and cannot establish a valid temporal association with driving impairment [77]. Blood and oral fluids have been studied for DUID applications. For the collection of blood, there has historically been an issue with a long delay in the collection of blood from the time of an incident or police stop. Compared to on-site alcohol testing in the form of a breathalyzer, the delay in blood collection can take hours [78]. The considerations on DUID for cannabis are that non-psychoactive ∆9-THC-COOH is detected for several days in the blood in urine, depending on the dose and the mode of administration. Chronic cannabis users can have a residual level of ∆9-THC in their blood for several days, which does not correlate to driving impairment [78]. At a car crash scene or police traffic stop, there is currently no easy method for on-site blood collection. If there is a significant delay in blood collection, it will be difficult to prove a suspect was impaired due to cannabis. In Washington State, USA, there was average of 165 min between the time blood is drawn and the time an incident occurred for cannabis testing, according to a 2016 study [78].
One solution to the inherent delay in blood testing is the micro-sampling of blood in the form of dried blood spots or dried plasma spots (DPS). These methods only require a finger prick of blood, which is easier to obtain than typical blood samples drawn from the vein. DPS have an advantage over dried blood spots in that the hematocrit level in blood can cause varying blood spot sizes, which increases the sample-to-sample variability [79].
In an effort to demonstrate the feasibility of the DPS analysis, we and others have investigated the use of this method [62,80]. Figure 4a shows a single drop of blood collected from a finger prick and deposited onto a commercially available DPS card (Figure 4b) (Telimmune, West Lafayette, IN, USA). Figure 4c, the plasma spot card filters out the red blood cells leaving 3 µL of dried plasma on each circle, a process that takes about 3 min. The finger prick collection could be done on-site (accident scene, regulatory worksite setting, private school student drug testing, etc.) and then the card can be sent to a facility for analysis. Figure 4d,e shows the MRM chromatograms for a cannabinoid standard mixture along with an example chromatogram of a study participant who ingested CBD [80]. The analysis indicated that the concentration of CBD in the blood was 26 ng/mL, and there was no detectable amount of Δ9-THC, Δ8-THC and CBD.
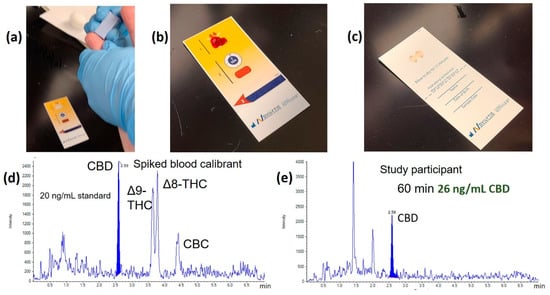
Figure 4.
Dried plasma spot (DPS) analysis example. (a) Finger prick collection for a dried plasma spot; (b) a drop of blood is filtered on the DPS card; (c) the top layer of the card is removed, revealing two dried plasma spots. Analyte is extracted from the dried plasma spots by protein precipitation and analyzed by LC-MS/MS; (d) A standard chromatogram of cannabinoids at 20 ng/mL each; (e) a chromatogram from a study participant who ingested CBD.
Recently, volumetric absorptive micro-sampling (VAMS) methods have been introduced and successfully applied to several quantitative methods [60,81]. The VAMS device allows for the collection of a fixed volume of blood (10 or 30 µL), avoiding the effect of hematocrit on the analytical performance, similar to DPS. Protti et al. reported a VAMS method for synthetic and natural cannabinoids for future applications of workplace drug testing or law enforcement [61].
In most applications, the analysis of cannabinoids in the blood and urine is preferred over an oral fluid (saliva) analysis. However, the ability to collect oral fluids for DUID enforcement through collecting samples at the scene of a traffic stop or accident to indicate recent cannabis use is an advantage of oral fluid testing since it offers simple, non-invasive observed specimen collection [82]. The concentration of ∆9-THC in oral fluid is maximal at 10 min after vaporization and rapidly declines thereafter [83]. Cannabinoids are most detectable immediately after smoking due to the high contamination in the oral cavity. After oral ingestion, ∆9-THC can also be detected. However, it is much more common to detect the presence of ∆9-THC in oral fluid after smoking rather than after ingestion [84]. Comparisons in the tests of ∆9-THC and the other cannabinoid compounds in the blood versus the oral fluid test revealed the concentration of these compounds present were different when the testing is done immediately after smoking. Minor cannabinoids, such as CBN, are less present in the smoke than in ∆9-THC, so there is a smaller window for the detection of them [83]. The typical cannabinoid metabolites, such as ∆9-THC-COOH, are not produced in the oral fluid, limiting the effectiveness of oral fluid sampling long after the initial cannabis use [83].
Currently, oral fluid test applications to determine the presence of cannabinoids include DUID, workplace safety and clinical practice. However, some questions are still being raised. In urine and blood, certain biomarkers are present to give a standard for comparison. In oral fluid, it has been difficult to establish a baseline for biomarkers [83]. The accuracy of the oral fluid tests in relation to false positives and negatives is also a concern, as well as the reliability of the tests to detect ∆9-THC after a variable amount of time has passed since the suspected cannabis consumption [85]. A recent study found that common saliva tests analyzed with LC-MS/MS for the detection of ∆9-THC are generally a good indicator of recent cannabinoid usage [85].
Cannabinoids in urine can have long elimination half-lives, so testing cannot be used to confirm recent cannabis use [86]. Urine analysis assays are best used for applications where cannabis use by the test subjects is prohibited entirely (e.g., workplace drug testing for transportation jobs, student drug testing for athletics or school attendance, family or criminal court, etc.). The collection of urine may seem less invasive than blood collection, but it requires the supervision of a trained observer in order to prevent adulteration through specimen substitution or the addition of an adulterant, which can cause anxiety and discomfort for the person providing the urine specimen [68].
In 2022, Vikingsson et al. analyzed 2000 regulated (mandated testing for jobs by government agencies) and 4000 non-regulated urine specimens from workplace drug testing for cannabinoids using a fast LC-MS/MS method with a 2.15 min runtime [59]. Using a US Health and Human Services recommended 15 ng/mL cutoff, 157 (2.6%) of specimens were positive for a ∆9-THC-related analyte, with 99% of those positive for ∆9-THC-COOH. The researchers established a 1 ng/mL cutoff and found that 98 (4.9%) regulated and 331 (8.3%) non-regulated specimens were positive for ∆9-THC-COOH. However, the ∆9-THC-COOH levels in urine could have been greater than 1 ng/mL from passive exposure to marijuana smoke [59,87]. Similarly, 59 (3.0%) regulated and 162 (4.2%) non-regulated specimens were positive for CBD or its metabolites 7-OH-CBD and CBD-COOH [59]. In 76 (1.3%) specimens, ∆8-THC-COOH was identified, but most of these samples were also positive for ∆9-THC-COOH at a higher level, indicating that ∆8-THC was present because a small amount of ∆8-THC is naturally in cannabis. The elevated ∆8-THC-COOH levels indicating the use of synthetic ∆8-THC products were found in less than 10 specimens [59].
5. Conclusions
There is no doubt that there is a growing acceptance of cannabis use in society. Historically, prohibitions of cannabis led to difficulties for researchers in conducting clinical trials and a lack of evidence for the efficacy of cannabis in treating specific diseases. Currently, 37 US states allow for the use of medical marijuana, and about 40 countries in the world have legalized medical marijuana. The number of states and countries allowing medical and recreational use continues to increase. The increasing consumer demand will lead to improvements in the technologies for quality control and regulatory enforcement, in terms of the production and sale of cannabis products, toxicology and clinical practice. Though studies have shown that cannabis can be used to treat chronic pain and other diseases, research needs to continue to provide dosage forms that limit the adverse effects of cannabis. Consumers should be able to be confident that cannabis products have the correct amount of active ingredients and that they are free from toxic and harmful substances.
However, there are certain limitations for quality control analyses. There are a numerous types of products that make the analyses difficult, and there is no accepted universal procedure for the sample preparation or analysis of the products [88]. Additionally, as many cannabinoid derivatives are highly volatile, storage is a major concern when it comes to preparing standard samples for analysis. Some cannabinoids oxidize easily in storage if not placed in sufficiently low temperatures, giving analysts a false high concentration level of the oxidized metabolites [88].
The assays for measuring the concentrations of cannabinoids in biological matrices are more standardized compared to the quality control assays for the cannabinoids in cannabis products. However, there is a patchwork of laws across nations and governments regarding the medicinal and recreational use of cannabis. The establishment of a per se level of ∆9-THC for DUID applications is important; many US states use a per se level of 5 ng/mL to establish ∆9-THC impairment. The instrumentation choice is also an important decision for biological matrices. GCMS instrumentation has a lower upfront capital cost than LC-MS/MS, but the LC-MS/MS methods tend to have simpler sample preparation procedures that allow for a higher throughput. The LC-MS/MS run times have the potential to be shorter than the standard GC-MS/MS methods, allowing for a higher throughput and cost savings to make up for the increased capital cost [59,88].
In the future, it is hoped that we will see technological advances that allow for easy point-of-care or field testing (DUID) sample collection procedures. The development of better mass spectrometers with a high selectivity and specificity will allow for reduced sample preparation procedures and improve the method robustness.
Author Contributions
Project administration, M.J.V.; writing—original draft preparation, M.J.V. and L.R.; writing—review and editing, M.J.V., A.B., G.P. and A.F. All authors have read and agreed to the published version of the manuscript.
Funding
This research received no external funding.
Data Availability Statement
All data presented are included in the article.
Acknowledgments
The authors thank John Dominic Smith, Ryan Bowen, Paige Barnes, and Rachel Crouch for reviewing the manuscript and providing constructive criticism.
Conflicts of Interest
The authors declare no conflict of interest.
References
- Van Green, T. Americans Overwhelmingly Say Marijuana Should Be Legal for Medical or Recreational Use. 2022. Available online: https://www.pewresearch.org/fact-tank/2022/11/22/americans-overwhelmingly-say-marijuana-should-be-legal-for-medical-or-recreational-use (accessed on 14 February 2023).
- North America, Europe & Asia Pacific Legal Cannabis Market Size, Share & Trends Analysis Report by Source Type, by Derivatives, by End-Use, by Region, and Segment Forecasts, 2022–2030. Available online: https://www.grandviewresearch.com/industry-analysis/legal-cannabis-market (accessed on 14 February 2023).
- Gasnier, L.J. Reefer Madness. 1936. Available online: https://en.wikipedia.org/wiki/Reefer_Madness (accessed on 14 February 2023).
- Stringer, R.J.; Maggard, S.R. Reefer Madness to Marijuana Legalization: Media Exposure and American Attitudes toward Marijuana (1975–2012). J. Drug Iss. 2016, 46, 428–445. [Google Scholar] [CrossRef]
- Pertwee, R.G. Handbook of Cannabis; Oxford University Press: Oxford, UK, 2014. [Google Scholar]
- Wood, T.B.; Spivey, W.N.; Easterfield, T.H. III.—Cannabinol. Part I. J. Chem. Soc. Trans. 1899, 75, 20–36. [Google Scholar] [CrossRef]
- Yamamoto, I.; Watanabe, K.; Kuzuoka, K.; Narimatsu, S.; Yoshimura, H. The Pharmacological Activity of Cannabinol and its Major Metabolite, 11-Hydroxycannabinol. Chem. Pharm. Bull. 1987, 35, 2144–2147. [Google Scholar] [CrossRef] [PubMed]
- Casajuana Kögel, C.; López-Pelayo, H.; Balcells-Olivero, M.M.; Colom, J.; Gual, A. Psychoactive constituents of cannabis and their clinical implications: A systematic review. Adicciones 2018, 30, 140–151. [Google Scholar]
- Corroon, J. Cannabinol and Sleep: Separating Fact from Fiction. Cannabis Cannabinoid Res. 2021, 6, 366–371. [Google Scholar] [CrossRef]
- Tagen, M.; Klumpers, L.E. Review of delta-8-tetrahydrocannabinol (Δ8-THC): Comparative pharmacology with Δ9-THC. Br. J. Pharmacol. 2022, 179, 3915–3933. [Google Scholar] [CrossRef]
- Li, N.; Taylor, L.S.; Mauer, L.J. Degradation kinetics of catechins in green tea powder: Effects of temperature and relative humidity. J. Agric. Food Chem. 2011, 59, 6082–6090. [Google Scholar] [CrossRef]
- White, C.M. A Review of Human Studies Assessing Cannabidiol’s (CBD) Therapeutic Actions and Potential. J. Clin. Pharmacol. 2019, 59, 923–934. [Google Scholar] [CrossRef]
- Russo, E.B. Cannabidiol Claims and Misconceptions. Trends Pharmacol. Sci. 2017, 38, 198–201. [Google Scholar] [CrossRef]
- Bonn-Miller, M.O.; Loflin, M.J.E.; Thomas, B.F.; Marcu, J.P.; Hyke, T.; Vandrey, R. Labeling Accuracy of Cannabidiol Extracts Sold Online. JAMA 2017, 318, 1708. [Google Scholar] [CrossRef]
- Felletti, S.; De Luca, C.; Buratti, A.; Bozza, D.; Cerrato, A.; Capriotti, A.L.; Lagana, A.; Cavazzini, A.; Catani, M. Potency testing of cannabinoids by liquid and supercritical fluid chromatography: Where we are, what we need. J. Chromatogr. A 2021, 1651, 462304. [Google Scholar] [CrossRef]
- Citti, C.; Pacchetti, B.; Vandelli, M.A.; Forni, F.; Cannazza, G. Analysis of cannabinoids in commercial hemp seed oil and decarboxylation kinetics studies of cannabidiolic acid (CBDA). J. Pharm. Biomed. Anal. 2018, 149, 532–540. [Google Scholar] [CrossRef]
- Jones, R.T. Cardiovascular system effects of marijuana. J. Clin. Pharmacol. 2002, 42, 58S–63S. [Google Scholar] [CrossRef]
- Meier, M.H.; Caspi, A.; Ambler, A.; Harrington, H.; Houts, R.; Keefe, R.S.E.; McDonald, K.; Ward, A.; Poulton, R.; Moffitt, T.E. Persistent cannabis users show neuropsychological decline from childhood to midlife. Proc. Natl. Acad. Sci. USA 2012, 109, E2657–E2664. [Google Scholar] [CrossRef]
- Whiting, P.F.; Wolff, R.F.; Deshpande, S.; Di Nisio, M.; Duffy, S.; Hernandez, A.V.; Keurentjes, J.C.; Lang, S.; Misso, K.; Ryder, S.; et al. Cannabinoids for Medical Use. JAMA 2015, 313, 2456. [Google Scholar] [CrossRef]
- National Academies of Sciences, Engineering and Medicine. The Health Effects of Cannabis and Cannabinoids: The Current State of Evidence and Recommendations for Research; The National Academies Press: Washington, DC, USA, 2017. [Google Scholar]
- Smith, L.A.; Azariah, F.; Lavender, V.T.; Stoner, N.S.; Bettiol, S. Cannabinoids for nausea and vomiting in adults with cancer receiving chemotherapy. Cochrane Database Syst. Rev. 2015, 2021, CD009464. [Google Scholar] [CrossRef]
- Koppel, B.S.; Brust, J.C.M.; Fife, T.; Bronstein, J.; Youssof, S.; Gronseth, G.; Gloss, D. Systematic review: Efficacy and safety of medical marijuana in selected neurologic disorders: Report of the Guideline Development Subcommittee of the American Academy of Neurology. Neurology 2014, 82, 1556–1563. [Google Scholar] [CrossRef]
- Pertwee, R.G. The diverse CB1 and CB2 receptor pharmacology of three plant cannabinoids: Δ9-tetrahydrocannabinol, cannabidiol and Δ9-tetrahydrocannabivarin. Br. J. Pharmacol. 2008, 153, 199–215. [Google Scholar] [CrossRef]
- Di Forti, M.; Morgan, C.; Dazzan, P.; Pariante, C.; Mondelli, V.; Marques, T.R.; Handley, R.; Luzi, S.; Russo, M.; Paparelli, A.; et al. High-potency cannabis and the risk of psychosis. Br. J. Psychiatry 2009, 195, 488–491. [Google Scholar] [CrossRef]
- Dinis-Oliveira, R.J. Metabolomics of Δ9-tetrahydrocannabinol: Implications in toxicity. Drug Metab. Rev. 2016, 48, 80–87. [Google Scholar] [CrossRef]
- Lemberger, L.; Crabtree, R.E.; Rowe, H.M. 11-Hydroxy-Δ9-tetrahydrocannabinol: Pharmacology, disposition, and metabolism of a major metabolite of marihuana in man. Science 1972, 177, 62–64. [Google Scholar] [CrossRef] [PubMed]
- Hammond, D. Communicating THC levels and ‘dose’ to consumers: Implications for product labelling and packaging of cannabis products in regulated markets. Int. J. Drug Policy 2021, 91, 102509. [Google Scholar] [CrossRef] [PubMed]
- Toennes, S.W.; Ramaekers, J.G.; Theunissen, E.L.; Moeller, M.R.; Kauert, G.F. Comparison of cannabinoid pharmacokinetic properties in occasional and heavy users smoking a marijuana or placebo joint. J. Anal. Toxicol. 2008, 32, 470–477. [Google Scholar] [CrossRef] [PubMed]
- Desrosiers, N.A.; Himes, S.K.; Scheidweiler, K.B.; Concheiro-Guisan, M.; Gorelick, D.A.; Huestis, M.A. Phase I and II cannabinoid disposition in blood and plasma of occasional and frequent smokers following controlled smoked cannabis. Clin. Chem. 2014, 60, 631–643. [Google Scholar] [CrossRef] [PubMed]
- Alvarez, J.C.; Hartley, S.; Etting, I.; Ribot, M.; Derridj-Ait-Younes, N.; Verstuyft, C.; Larabi, I.A.; Simon, N. Population pharmacokinetic model of blood THC and its metabolites in chronic and occasional cannabis users and relationship with on-site oral fluid testing. Br. J. Clin. Pharmacol. 2021, 87, 3139–3149. [Google Scholar] [CrossRef]
- Heuberger, J.A.A.C.; Guan, Z.; Oyetayo, O.-O.; Klumpers, L.; Morrison, P.D.; Beumer, T.L.; Van Gerven, J.M.A.; Cohen, A.F.; Freijer, J. Population Pharmacokinetic Model of THC Integrates Oral, Intravenous, and Pulmonary Dosing and Characterizes Short- and Long-term Pharmacokinetics. Clin. Pharmacokinet. 2015, 54, 209–219. [Google Scholar] [CrossRef]
- Huestis, M.A.; Henningfield, J.E.; Cone, E.J. Blood cannabinoids. I. Absorption of THC and formation of 11-OH-THC and THCCOOH during and after smoking marijuana. J. Anal. Toxicol. 1992, 16, 276–282. [Google Scholar] [CrossRef]
- Kelly, P.; Jones, R.T. Metabolism of tetrahydrocannabinol in frequent and infrequent marijuana users. J. Anal. Toxicol. 1992, 16, 228–235. [Google Scholar] [CrossRef]
- Merrick, J.; Lane, B.; Sebree, T.; Yaksh, T.; O’Neill, C.; Banks, S.L. Identification of Psychoactive Degradants of Cannabidiol in Simulated Gastric and Physiological Fluid. Cannabis Cannabinoid Res. 2016, 1, 102–112. [Google Scholar] [CrossRef]
- Huestis, M.A. Human Cannabinoid Pharmacokinetics. Chem. Biodivers. 2007, 4, 1770–1804. [Google Scholar] [CrossRef]
- Mechoulam, R.; Hanuš, L.R. Cannabidiol: An overview of some chemical and pharmacological aspects. Part I: Chemical aspects. Chem. Phys. Lipids 2002, 121, 35–43. [Google Scholar] [CrossRef]
- Ohlsson, A.; Lindgren, J.E.; Andersson, S.; Agurell, S.; Gillespie, H.; Hollister, L.E. Single-dose kinetics of deuterium-labelled cannabidiol in man after smoking and intravenous administration. Biomed. Environ. Mass Spectrom. 1986, 13, 77–83. [Google Scholar] [CrossRef]
- Sholler, D.J.; Spindle, T.R.; Cone, E.J.; Goffi, E.; Kuntz, D.; Mitchell, J.M.; Winecker, R.E.; Bigelow, G.E.; Flegel, R.R.; Vandrey, R. Urinary Pharmacokinetic Profile of Cannabidiol (CBD), Δ9-Tetrahydrocannabinol (THC) and Their Metabolites following Oral and Vaporized CBD and Vaporized CBD-Dominant Cannabis Administration. J. Anal. Toxicol. 2021, 46, 494–503. [Google Scholar] [CrossRef]
- Elsohly, M.A.; Mehmedic, Z.; Foster, S.; Gon, C.; Chandra, S.; Church, J.C. Changes in Cannabis Potency Over the Last 2 Decades (1995–2014): Analysis of Current Data in the United States. Biol. Psychiatry 2016, 79, 613–619. [Google Scholar] [CrossRef]
- Mudge, E.M.; Murch, S.J.; Brown, P.N. Leaner and greener analysis of cannabinoids. Anal. Bioanal. Chem. 2017, 409, 3153–3163. [Google Scholar] [CrossRef]
- Citti, C.; Braghiroli, D.; Vandelli, M.A.; Cannazza, G. Pharmaceutical and biomedical analysis of cannabinoids: A critical review. J. Pharm. Biomed. Anal. 2018, 147, 565–579. [Google Scholar] [CrossRef]
- Citti, C.; Battisti, U.M.; Braghiroli, D.; Ciccarella, G.; Schmid, M.; Vandelli, M.A.; Cannazza, G. A Metabolomic Approach Applied to a Liquid Chromatography Coupled to High-Resolution Tandem Mass Spectrometry Method (HPLC-ESI-HRMS/MS): Towards the Comprehensive Evaluation of the Chemical Composition of Cannabis Medicinal Extracts. Phytochem. Anal. 2018, 29, 144–155. [Google Scholar] [CrossRef]
- Reidel, B.; Abdelwahab, S.; Wrennall, J.A.; Clapp, P.W.; Beers, J.L.; Jackson, K.D.; Tarran, R.; Kesimer, M. Vaping additives cannabinoid oil and vitamin E acetate adhere to and damage the human airway epithelium. J. Appl. Toxicol. 2022. [Google Scholar] [CrossRef]
- Meng, Q.; Buchanan, B.; Zuccolo, J.; Poulin, M.-M.; Gabriele, J.; Baranowski, D.C. A reliable and validated LC-MS/MS method for the simultaneous quantification of 4 cannabinoids in 40 consumer products. PLoS ONE 2018, 13, e0196396. [Google Scholar] [CrossRef]
- Galant, N.; Czarny, J.; Powierska-Czarny, J.; Piotrowska-Cyplik, A. Development and Validation of the LC–MS/MS Method for Determination of 130 Natural and Synthetic Cannabinoids in Cannabis Oil. Molecules 2022, 27, 8601. [Google Scholar] [CrossRef]
- Lee, J.H.; Min, A.Y.; Han, J.H.; Yang, Y.J.; Kim, H.; Shin, D. Development and validation of LC-MS/MS method with QuEChERS clean-up for detecting cannabinoids in foods and dietary supplements. Food Addit. Contam. Part A 2020, 37, 1413–1424. [Google Scholar] [CrossRef] [PubMed]
- Brown, A.; Reynolds, L.; Vergne, M.J. What’s the 4-1-1 on 4:20? Comparison of analysis methods for THC and CBD quantitation in hemp hearts and other products derived from cannabis. In Proceedings of the 73rd Annual Meeting of the Southeastern Meeting of the American Chemical Society, San Juan, Puerto Rico, 19–22 October 2022. [Google Scholar]
- Heo, S.; Yoo, G.J.; Choi, J.Y.; Park, H.J.; Do, J.-A.; Cho, S.; Baek, S.Y.; Park, S.-K. Simultaneous Analysis of Cannabinoid and Synthetic Cannabinoids in Dietary Supplements Using UPLC with UV and UPLC–MS-MS. J. Anal. Toxicol. 2016, 40, 350–359. [Google Scholar] [CrossRef] [PubMed]
- Namdar, D.; Mazuz, M.; Ion, A.; Koltai, H. Variation in the compositions of cannabinoid and terpenoids in Cannabis sativa derived from inflorescence position along the stem and extraction methods. Ind. Crops Prod. 2018, 113, 376–382. [Google Scholar] [CrossRef]
- Russo, E.B. Taming THC: Potential cannabis synergy and phytocannabinoid-terpenoid entourage effects. Br. J. Pharmacol. 2011, 163, 1344–1364. [Google Scholar] [CrossRef] [PubMed]
- ElSohly, M.A.; Chandra, S.; Radwan, M.; Majumdar, C.G.; Church, J.C. A Comprehensive Review of Cannabis Potency in the United States in the Last Decade. Biol. Psychiatry Cogn. Neurosci. Neuroimaging 2021, 6, 603–606. [Google Scholar] [CrossRef]
- Joern, W.A. Detection of past and recurrent marijuana use by a modified GC/MS procedure. J. Anal. Toxicol. 1987, 11, 49–52. [Google Scholar] [CrossRef]
- Tai, S.-C.; Welch, M. Determination of 11-nor-Δ9-tetrahydrocannabinol-9-carboxylic acid in a urine-based standard reference material by isotope-dilution liquid chromatography-mass spectrometry with electrospray ionization. J. Anal. Toxicol. 2000, 24, 385–389. [Google Scholar] [CrossRef]
- Fenn, J.B.; Mann, M.; Meng, C.K.; Wong, S.F.; Whitehouse, C.M. Electrospray ionization for mass spectrometry of large biomolecules. Science 1989, 246, 64–71. [Google Scholar] [CrossRef]
- Banerjee, S.; Mazumdar, S. Electrospray ionization mass spectrometry: A technique to access the information beyond the molecular weight of the analyte. Int. J. Anal. Chem. 2012, 2012, 282574. [Google Scholar] [CrossRef]
- Sempio, C.; Almaraz-Quinones, N.; Jackson, M.; Zhao, W.; Wang, G.S.; Liu, Y.; Leehey, M.; Knupp, K.; Klawitter, J.; Christians, U.; et al. Simultaneous Quantification of 17 Cannabinoids by LC–MS-MS in Human Plasma. J. Anal. Toxicol. 2021, 46, 383–392. [Google Scholar] [CrossRef]
- Reber, J.D.; Karschner, E.L.; Seither, J.Z.; Knittel, J.L.; Dozier, K.V.; Walterscheid, J.P. An Enhanced LC–MS-MS Technique for Distinguishing Δ8- and Δ9-Tetrahydrocannabinol Isomers in Blood and Urine Specimens. J. Anal. Toxicol. 2022, 46, 343–349. [Google Scholar] [CrossRef]
- Young, B.L.; Victoria Zhang, Y. A rapid Dilute-and-Shoot LC-MS/MS method for quantifying THC-COOH and THC-COO(Gluc) in urine. J. Chromatogr. B 2022, 1211, 123495. [Google Scholar] [CrossRef]
- Vikingsson, S.; Winecker, R.E.; Cone, E.J.; Kuntz, D.J.; Dorsey, B.; Jacques, M.; Senter, M.; Flegel, R.R.; Hayes, E.D. Prevalence of Cannabidiol, ∆9- and ∆8-Tetrahydrocannabinol and Metabolites in Workplace Drug Testing Urine Specimens. J. Anal. Toxicol. 2022, 46, 866–874. [Google Scholar] [CrossRef]
- Mano, Y.; Kita, K.; Kusano, K. Hematocrit-independent recovery is a key for bioanalysis using volumetric absorptive microsampling devices, MitraTM. Bioanalysis 2015, 7, 1821–1829. [Google Scholar] [CrossRef] [PubMed]
- Protti, M.; Rudge, J.; Sberna, A.E.; Gerra, G.; Mercolini, L. Dried haematic microsamples and LC–MS/MS for the analysis of natural and synthetic cannabinoids. J. Chromatogr. B 2017, 1044–1045, 77–86. [Google Scholar] [CrossRef]
- Nie, B.; Henion, J.; Ryona, I. The Role of Mass Spectrometry in the Cannabis Industry. J. Am. Soc. Mass Spectrom. 2019, 30, 719–730. [Google Scholar] [CrossRef]
- Coulter, C.; Miller, E.; Crompton, K.; Moore, C. Tetrahydrocannabinol and Two of its Metabolites in Whole Blood Using Liquid Chromatography-Tandem Mass Spectrometry. J. Anal. Toxicol. 2008, 32, 653–658. [Google Scholar] [CrossRef]
- Malaca, S.; Busardò, F.P.; Gottardi, M.; Pichini, S.; Marchei, E. Dilute and shoot ultra-high performance liquid chromatography tandem mass spectrometry (UHPLC–MS/MS) analysis of psychoactive drugs in oral fluid. J. Pharm. Biomed. Anal. 2019, 170, 63–67. [Google Scholar] [CrossRef]
- Niedbala, R.S.; Kardos, K.W.; Fritch, D.F.; Kardos, S.; Fries, T.; Waga, J.; Robb, J.; Cone, E.J. Detection of marijuana use by oral fluid and urine analysis following single-dose administration of smoked and oral marijuana. J. Anal. Toxicol. 2001, 25, 289–303. [Google Scholar] [CrossRef]
- Brosius, C.R.; Caron, K.T.; Sosnoff, C.S.; Blount, B.C.; Wang, L. Rapid Development and Validation of a Liquid Chromatography-Tandem Mass Spectrometry Method to Measure Cannabinoids in Bronchoalveolar-Lavage Fluid of Patients with e-Cigarette, or Vaping, Product Use-Associated Lung Injury. ACS Omega 2022, 7, 443–452. [Google Scholar] [CrossRef]
- Scheidweiler, K.B.; Barnes, A.J. Quantification of Eight Cannabinoids Including Cannabidiol in Human Urine Via Liquid Chromatography Tandem Mass Spectrometry. In LC-MS in Drug Analysis: Methods and Protocols; Langman, L.J., Snozek, C.L.H., Eds.; Springer: New York, NY, USA, 2019; pp. 11–22. [Google Scholar]
- Kapur, B.M.; Aleksa, K. What the lab can and cannot do: Clinical interpretation of drug testing results. Crit. Rev. Clin. Lab. Sci. 2020, 57, 548–585. [Google Scholar] [CrossRef]
- Deventer, K.; Pozo, O.J.; Verstraete, A.G.; Van Eenoo, P. Dilute-and-shoot-liquid chromatography-mass spectrometry for urine analysis in doping control and analytical toxicology. TrAC, Trends Anal. Chem. 2014, 55, 1–13. [Google Scholar] [CrossRef]
- Kintz, P.; Cirimele, V. Testing human blood for cannabis by GC-MS. Biomed. Chromatogr. 1997, 11, 371–373. [Google Scholar] [CrossRef]
- Castro, A.L.; Tarelho, S.; Melo, P.; Franco, J.M. A fast and reliable method for quantitation of THC and its 2 main metabolites in whole blood by GC–MS/MS (TQD). Forensic Sci. Int. 2018, 289, 344–351. [Google Scholar] [CrossRef]
- Vandrey, R.; Herrmann, E.S.; Mitchell, J.M.; Bigelow, G.E.; Flegel, R.; LoDico, C.; Cone, E.J. Pharmacokinetic Profile of Oral Cannabis in Humans: Blood and Oral Fluid Disposition and Relation to Pharmacodynamic Outcomes. J. Anal. Toxicol. 2017, 41, 83–99. [Google Scholar] [CrossRef]
- Bergeria, C.L.; Spindle, T.R.; Cone, E.J.; Sholler, D.; Goffi, E.; Mitchell, J.M.; Winecker, R.E.; Bigelow, G.E.; Flegel, R.; Vandrey, R. Pharmacokinetic Profile of ∆9-Tetrahydrocannabinol, Cannabidiol and Metabolites in Blood following Vaporization and Oral Ingestion of Cannabidiol Products. J. Anal. Toxicol. 2022, 46, 583–591. [Google Scholar] [CrossRef]
- Logan, B.K.; D’Orazio, A.L.; Mohr, A.L.A.; Limoges, J.F.; Miles, A.K.; Scarneo, C.E.; Kerrigan, S.; Liddicoat, L.J.; Scott, K.S.; Huestis, M.A. Recommendations for Toxicological Investigation of Drug-Impaired Driving and Motor Vehicle Fatalities—2017 Update. J. Anal. Toxicol. 2017, 42, 63–68. [Google Scholar] [CrossRef]
- Lira, M.C.; Heeren, T.C.; Buczek, M.; Blanchette, J.G.; Smart, R.; Pacula, R.L.; Naimi, T.S. Trends in Cannabis Involvement and Risk of Alcohol Involvement in Motor Vehicle Crash Fatalities in the United States, 2000–2018. Am. J. Public Health 2021, 111, 1976–1985. [Google Scholar] [CrossRef]
- Lenné, M.G.; Dietze, P.M.; Triggs, T.J.; Walmsley, S.; Murphy, B.; Redman, J.R. The effects of cannabis and alcohol on simulated arterial driving: Influences of driving experience and task demand. Accid. Anal. Prev. 2010, 42, 859–866. [Google Scholar] [CrossRef]
- Hartman, R.L.; Huestis, M.A. Cannabis effects on driving skills. Clin. Chem. 2013, 59, 478–492. [Google Scholar] [CrossRef]
- Banta-Green, C.; Rowhani-Rahbar, A.; Ebel, B.E.; Andris, L.M.; Qiu, Q. Cannabis Use among Drivers Suspected of Driving under the Influence or Involved in Collisions: Analysis of Washington State Patrol Data; AAA Foundation for Traffic Safety: Washington, DC, USA, 2016. [Google Scholar]
- Ryona, I.; Henion, J. A Book-Type Dried Plasma Spot Card for Automated Flow-Through Elution Coupled with Online SPE-LC-MS/MS Bioanalysis of Opioids and Stimulants in blood. Anal. Chem. 2016, 88, 11229–11237. [Google Scholar] [CrossRef] [PubMed]
- Reynolds, L. Development of cannabinoid testing method using blood plasma cards and LC-MS/MS. In Proceedings of the 73rd Southeastern Regional ACS Meeting, San Juan, Puerto Rico, 19–22 October 2022. [Google Scholar]
- Protti, M.; Mandrioli, R.; Mercolini, L. Tutorial: Volumetric absorptive microsampling (VAMS). Anal. Chim. Acta 2019, 1046, 32–47. [Google Scholar] [CrossRef] [PubMed]
- Cone, E.J.; Presley, L.; Lehrer, M.; Seiter, W.; Smith, M.; Kardos, K.W.; Fritch, D.; Salamone, S.; Niedbala, R.S. Oral Fluid Testing for Drugs of Abuse: Positive Prevalence Rates by Intercept™ Immunoassay Screening and GC-MS-MS Confirmation and Suggested Cutoff Concentrations. J. Anal. Toxicol. 2002, 26, 541–546. [Google Scholar] [CrossRef]
- Lee, D.; Huestis, M.A. Current knowledge on cannabinoids in oral fluid. Drug Test. Anal. 2014, 6, 88–111. [Google Scholar] [CrossRef]
- Cone, E.J.; Huestis, M.A. Interpretation of Oral Fluid Tests for Drugs of Abuse. Ann. N. Y. Acad. Sci. 2007, 1098, 51–103. [Google Scholar] [CrossRef]
- Arkell, T.R.; Kevin, R.C.; Stuart, J.; Lintzeris, N.; Haber, P.S.; Ramaekers, J.G.; McGregor, I.S. Detection of Δ9THC in oral fluid following vaporized cannabis with varied cannabidiol (CBD) content: An evaluation of two point-of-collection testing devices. Drug Test. Anal. 2019, 11, 1486–1497. [Google Scholar] [CrossRef]
- Musshoff, F.; Madea, B. Review of Biologic Matrices (Urine, Blood, Hair) as Indicators of Recent or Ongoing Cannabis Use. Ther. Drug Monit. 2006, 28, 155–163. [Google Scholar] [CrossRef]
- Cone, E.J.; Bigelow, G.E.; Herrmann, E.S.; Mitchell, J.M.; LoDico, C.; Flegel, R.; Vandrey, R. Non-Smoker Exposure to Secondhand Cannabis Smoke. I. Urine Screening and Confirmation Results. J. Anal. Toxicol. 2014, 39, 1–12. [Google Scholar] [CrossRef]
- Citti, C.; Russo, F.; Sgrò, S.; Gallo, A.; Zanotto, A.; Forni, F.; Vandelli, M.A.; Laganà, A.; Montone, C.M.; Gigli, G.; et al. Pitfalls in the analysis of phytocannabinoids in cannabis inflorescence. Anal. Bioanal. Chem. 2020, 412, 4009–4022. [Google Scholar] [CrossRef]
Disclaimer/Publisher’s Note: The statements, opinions and data contained in all publications are solely those of the individual author(s) and contributor(s) and not of MDPI and/or the editor(s). MDPI and/or the editor(s) disclaim responsibility for any injury to people or property resulting from any ideas, methods, instructions or products referred to in the content. |
© 2023 by the authors. Licensee MDPI, Basel, Switzerland. This article is an open access article distributed under the terms and conditions of the Creative Commons Attribution (CC BY) license (https://creativecommons.org/licenses/by/4.0/).