Article

Digital Pharmacoepidemiology of Glucagon-like Peptide-1 Receptor Agonists in Russia: A Retrospective Search Query Analysis (2018–2026)


by
Stanislav Kotlyarov
1,* and
Anna Kotlyarova
2
1
Department of Nursing, Ryazan State Medical University, 390026 Ryazan, Russia
2
Department of Pharmacy Management and Economics, Ryazan State Medical University, 390026 Ryazan, Russia
*
Author to whom correspondence should be addressed.
Pharmacoepidemiology 2026, 5(3), 25; https://doi.org/10.3390/pharma5030025
Submission received: 10 June 2026 / Revised: 19 July 2026 / Accepted: 20 July 2026 / Published: 23 July 2026

Abstract

Background: Glucagon-like peptide-1 receptor agonists (GLP-1RAs) and GLP-1/glucose-dependent insulinotropic polypeptide (GIP) dual agonists have revolutionized the treatment of type 2 diabetes and obesity. The rapid growth in public interest, off-label use, and the emergence of counterfeit drugs underscores the need for timely monitoring of information demand. Objective: The objective of this study is to quantitatively characterize the temporal dynamics, market concentration, seasonality, and semantic structure of Russian-language search queries regarding GLP-1RAs and GLP-1/GIP dual agonists and to assess their correlation with pharmaceutical demand. Materials and Methods: This was a retrospective study of Yandex.Wordstat data from March 2018 to March 2026 (covering 97 months, 27 INNs and brand names). Time series analysis (trends, structural breaks, Seasonal-Trend decomposition based on Loess (STL decomposition)), calculation of the Herfindahl–Hirschman Index (HHI), and semantic analysis of 4562 unique formulations (bigrams, trigrams, Term Frequency–Inverse Document Frequency (TF-IDF), thematic classification, morphological normalization) were performed. Validation was conducted using DSM Group pharmacy sales data. Results: A total of 46.05 million queries were analyzed. Interest in semaglutide increased 215-fold, with the structural break point identified in January 2021. The HHI decreased from 0.311 (indicating a highly concentrated market) to 0.141 (indicating a competitive market). The share of diabetes-related queries did not exceed 0.46%, while the share of weight-loss-related queries reached 13.91%, and the share of commercial-component queries reached 41.1%. Four semantic signatures were identified: brand-dominant (Ozempic), instruction-targeted (Saxenda), dose-commercial (Tirzetta), and instruction-commercial (Trulicity). No statistically significant seasonality was confirmed after adjustment for multiple comparisons. The correlation between search interest and pharmacy sales was the strongest for Tirzetta (r = 0.976; n = 8; p < 0.001) and remained significant after trend removal (first differences: r = 0.819; p = 0.024). Conclusions: Yandex.Wordstat data provide a valuable supplementary source for digital pharmacoepidemiology. A systematic discrepancy was found between registered indications and actual information demand, a finding that has significant implications for pharmacovigilance and healthcare planning.

1. Introduction

Obesity and type 2 diabetes (T2D) are major medical and social challenges of modern society. According to the Global Burden of Disease Study, the number of deaths from T2D associated with a high body mass index rose from 238,100 in 1990 to 723,700 in 2021, while the disability-adjusted life years (DALYs) figure increased from 10.4 to 39.3 million over the same period [1,2]. This combination of conditions results in enormous economic losses. For example, a systematic review of studies showed that annual costs for treating T2D range from $87 to $9581 per patient, with a disproportionately heavy burden falling on low- and middle-income countries [3]. In the Russian Federation, the prevalence of obesity among the adult population is steadily increasing. According to instrumental measurements by Rosstat, it increased from 21.6% in 2018 to 25.4% in 2023 [4]. The prevalence of T2D among the adult population, according to the Federal Register, increased from 3989.0 per 100,000 population (3.99%) in 2023 to 4488.6 per 100,000 population (4.49%) as of early 2026 [5,6]. This trend reflects the global trend of a steady increase in the prevalence of diabetes, which, according to estimates by the International Diabetes Federation, has reached 11.11% among the world’s adult population (589 million people), with a projected increase to 12.96% (853 million) by 2050 [7]. According to the NATION national study in the Russian Federation, the prevalence of T2D among obese adults (body mass index (BMI) ≥ 30 kg/m2) is 12.0% [8], which is broadly consistent with international data: an increase in body mass index from the “underweight” category (<18.5 kg/m2) to class III obesity (≥40 kg/m2) increases the lifetime risk of T2D from 7% to 70% in men and from 12% to 74% in women [9]. Russian population data provide compelling evidence of a strong association between obesity and an increased likelihood of having T2D (2.8–4.1 times) [10]. This close association is due to the central role of visceral obesity in the development of insulin resistance and β-cell dysfunction, positioning weight loss as a key therapeutic goal alongside glycemic control [9].
Glucagon-like peptide-1 (GLP-1) receptor agonists and dual GLP-1/glucose-dependent insulinotropic polypeptide (GIP) receptor agonists (such as tirzepatide) have taken center stage in modern pharmacotherapy algorithms for type 2 diabetes and obesity [11,12,13,14]. In patients with obesity and high cardiovascular risk, as well as in cases of inadequate response to metformin, current guidelines prioritize these classes of drugs based on their proven ability to achieve significant weight loss, improve glycemic control, and reduce the risk of cardiovascular events [13,15,16,17].
The evidence base for this class of drugs has grown rapidly and has significantly shaped international clinical guidelines over the past five years. In the randomized STEP 1 study [15], the use of semaglutide 2.4 mg once weekly in combination with lifestyle modifications in patients without type 2 diabetes led to an average weight loss of 14.9% after 68 weeks of therapy. The proportion of participants who achieved a ≥5% reduction in body weight was 86.4% [15]. In the SURMOUNT program, which included individuals without type 2 diabetes, tirzepatide demonstrated an even more pronounced effect. In the SURMOUNT-1 study, weight loss at a dose of 15 mg/week was 20.9% (treatment-regimen estimate) [16]. In the SURMOUNT-5 study, a direct comparison of tirzepatide and semaglutide in obese patients without diabetes confirmed the superiority of tirzepatide: weight loss after 72 weeks was −20.2% versus −13.7%, respectively (p < 0.001) [18]. In the SELECT study [19], the use of semaglutide 2.4 mg/week in overweight or obese patients without diabetes but with established cardiovascular disease reduced the risk of major adverse cardiovascular events (3-point MACE) by 20% (HR 0.80; 95% CI 0.72–0.90; p < 0.001) [19]. Against the backdrop of these results, a clinical and social demand for this class of drugs has emerged.
The rapid growth in the use of GLP-1 receptor agonists in recent years is confirmed by real-world clinical practice data. According to Watanabe et al. [20], in the large University of California Health system, the number of patients receiving semaglutide (Ozempic) increased from 569 in 2019 to 22,891 in 2022, and tirzepatide (Mounjaro) was prescribed to 1508 patients in its first year on the market (2022) [20]. Furthermore, the GLP-1RA class has gained immense popularity in the information space, unmatched by any other prescription drug. The widespread off-label use of semaglutide (specifically, the drug “Ozempic”) for weight loss was actively promoted by posts on social media and visual content-sharing platforms [21,22,23,24]. The sharp increase in demand led to a global shortage of the drug in 2022–2024 [21,22,25] and, as a result, to the emergence of counterfeit batches on the market [22,25]. In June 2024, the World Health Organization (WHO) published Medical Product Alert No. 2/2024 regarding counterfeit Ozempic [26], underscoring the importance of timely monitoring of information demand as an early warning signal for pharmacovigilance systems. McCarthy et al. [27], based on a global analysis of Google Trends, recorded a 46-fold increase in search interest in the term “Ozempic face” (as associated with the query “Ozempic”), demonstrating the simultaneous spread of information about the drug and its aesthetic consequences [27].
Traditional data sources used in pharmacoepidemiology, such as population-based surveys, cohort studies, and registries, often provide information with a significant time lag of up to several years [28]. In addition, a substantial proportion of drug prescriptions involve off-label use [29], while the documentation of such prescriptions in electronic health records and administrative databases remains fragmentary, which severely limits the possibilities for their systematic analysis [30]. The concept of infodemics and infosurveillance, proposed by G. Eysenbach [28] and subsequently methodologically formalized by A. Mavragani et al. [31] using Google Trends data, provides an additional, timely, and inexpensive source of information on population-level information needs, including in the field of drug use. Published studies using Google Trends have demonstrated a high correlation between search interest and actual prescriptions of specific GLP-1RAs, reaching r = 0.94–0.99 [32], as well as the sensitivity of search trends to news events, regulatory decisions, and media campaigns; in particular, it was shown that a television episode of the Dr. Oz show coincided with strong spikes in search queries for semaglutide in numerous countries [22].
However, the existing international literature on digital pharmacoepidemiology of GLP-1RAs has three systemic limitations. First, it relies almost exclusively on the aggregated Google Trends metric (normalized to 100), which does not allow for the quantitative assessment of absolute volumes or the comparison of heterogeneous drugs on a single scale. Second, it is based on English-language search behavior, which limits its applicability in non-English-speaking markets with their own search infrastructure. Third, it rarely includes semantic analysis of search queries broken down by thematic clusters, which makes it impossible to distinguish users’ motives (indications, price, off-label use, safety). The Russian segment of the Internet, where the Yandex service (market share > 73% in 2025–2026) [33] provides open access to absolute search interest metrics via Wordstat [34], is a methodologically valuable research environment that has, to date, been virtually unused for patient-oriented analysis of pharmacotherapy.
The specific regulatory context in the Russian Federation adds a further layer of significance to this issue. During the period under review, semaglutide (the original drug Ozempic (Novo Nordisk, Bagsværd Denmark)) was registered in Russia only for type 2 diabetes and cardiovascular risk reduction but not for obesity, although its effectiveness in reducing body weight has been established by large randomized controlled trials (RCTs) [15,19,35]. Following Novo Nordisk’s withdrawal from the Russian market and the launch of domestic production of analogs (Semavic, Velgia, Quinsenta, and others), the information landscape has rapidly shifted. This situation makes the Russian-language segment of Yandex a unique platform for studying how information demand responds to changes in the structure of supply, dosage forms, availability, and official labeling of the drug.
The aim of this study is to quantitatively characterize the dynamics, market structure, seasonality, and semantic architecture of search queries for GLP-1-class drugs in the Russian-language segment of the Yandex search engine over the period from March 2018 to March 2026 (97 months, covering 27 INNs and brand names). In a comparative design involving four key search terms (Ozempic (the leading brand for the International Nonproprietary Name (INN) semaglutide), Saxenda (the leading brand for the INN liraglutide), Tirzetta (the leading brand for the INN tirzepatide), and Trulicity (the leading brand for the INN dulaglutide)), which differ in INN, dosing regimen, and approved indications in Russia, we aimed to compare the structure of users’ information interests with the official indications for these drugs.
The scientific novelty of this study relative to previous research based on Google Trends lies in three aspects, which, taken together, have not previously been combined in a single study of this class of drugs. First, the use of absolute search volume data from Yandex.Wordstat, instead of the Google Trends normalized 100-point scale, allows for the comparison of drugs and time periods in absolute terms rather than relative rankings. Second, the application of infodemics analysis to a non-English, morphologically rich search environment with its own infrastructure (Yandex) has not previously been systematically studied for this class of drugs. Third, multilevel semantic analysis (bigrams, trigrams, TF-IDF (Term Frequency–Inverse Document Frequency), thematic categorization, morphological normalization) allows for a substantive assessment of users’ informational interest, rather than merely measuring the total volume of interest. The text normalization methodology for languages with complex morphology and the general analytical protocol (structural breaks, Herfindahl–Hirschman Index (HHI), STL seasonality with false discovery rate (FDR) correction) are applicable beyond the Russian context to any non-English-speaking market with an open search query analytics platform.

2. Results

2.1. Quantitative Analysis of Time Series

2.1.1. Volume Metrics and Market Leaders

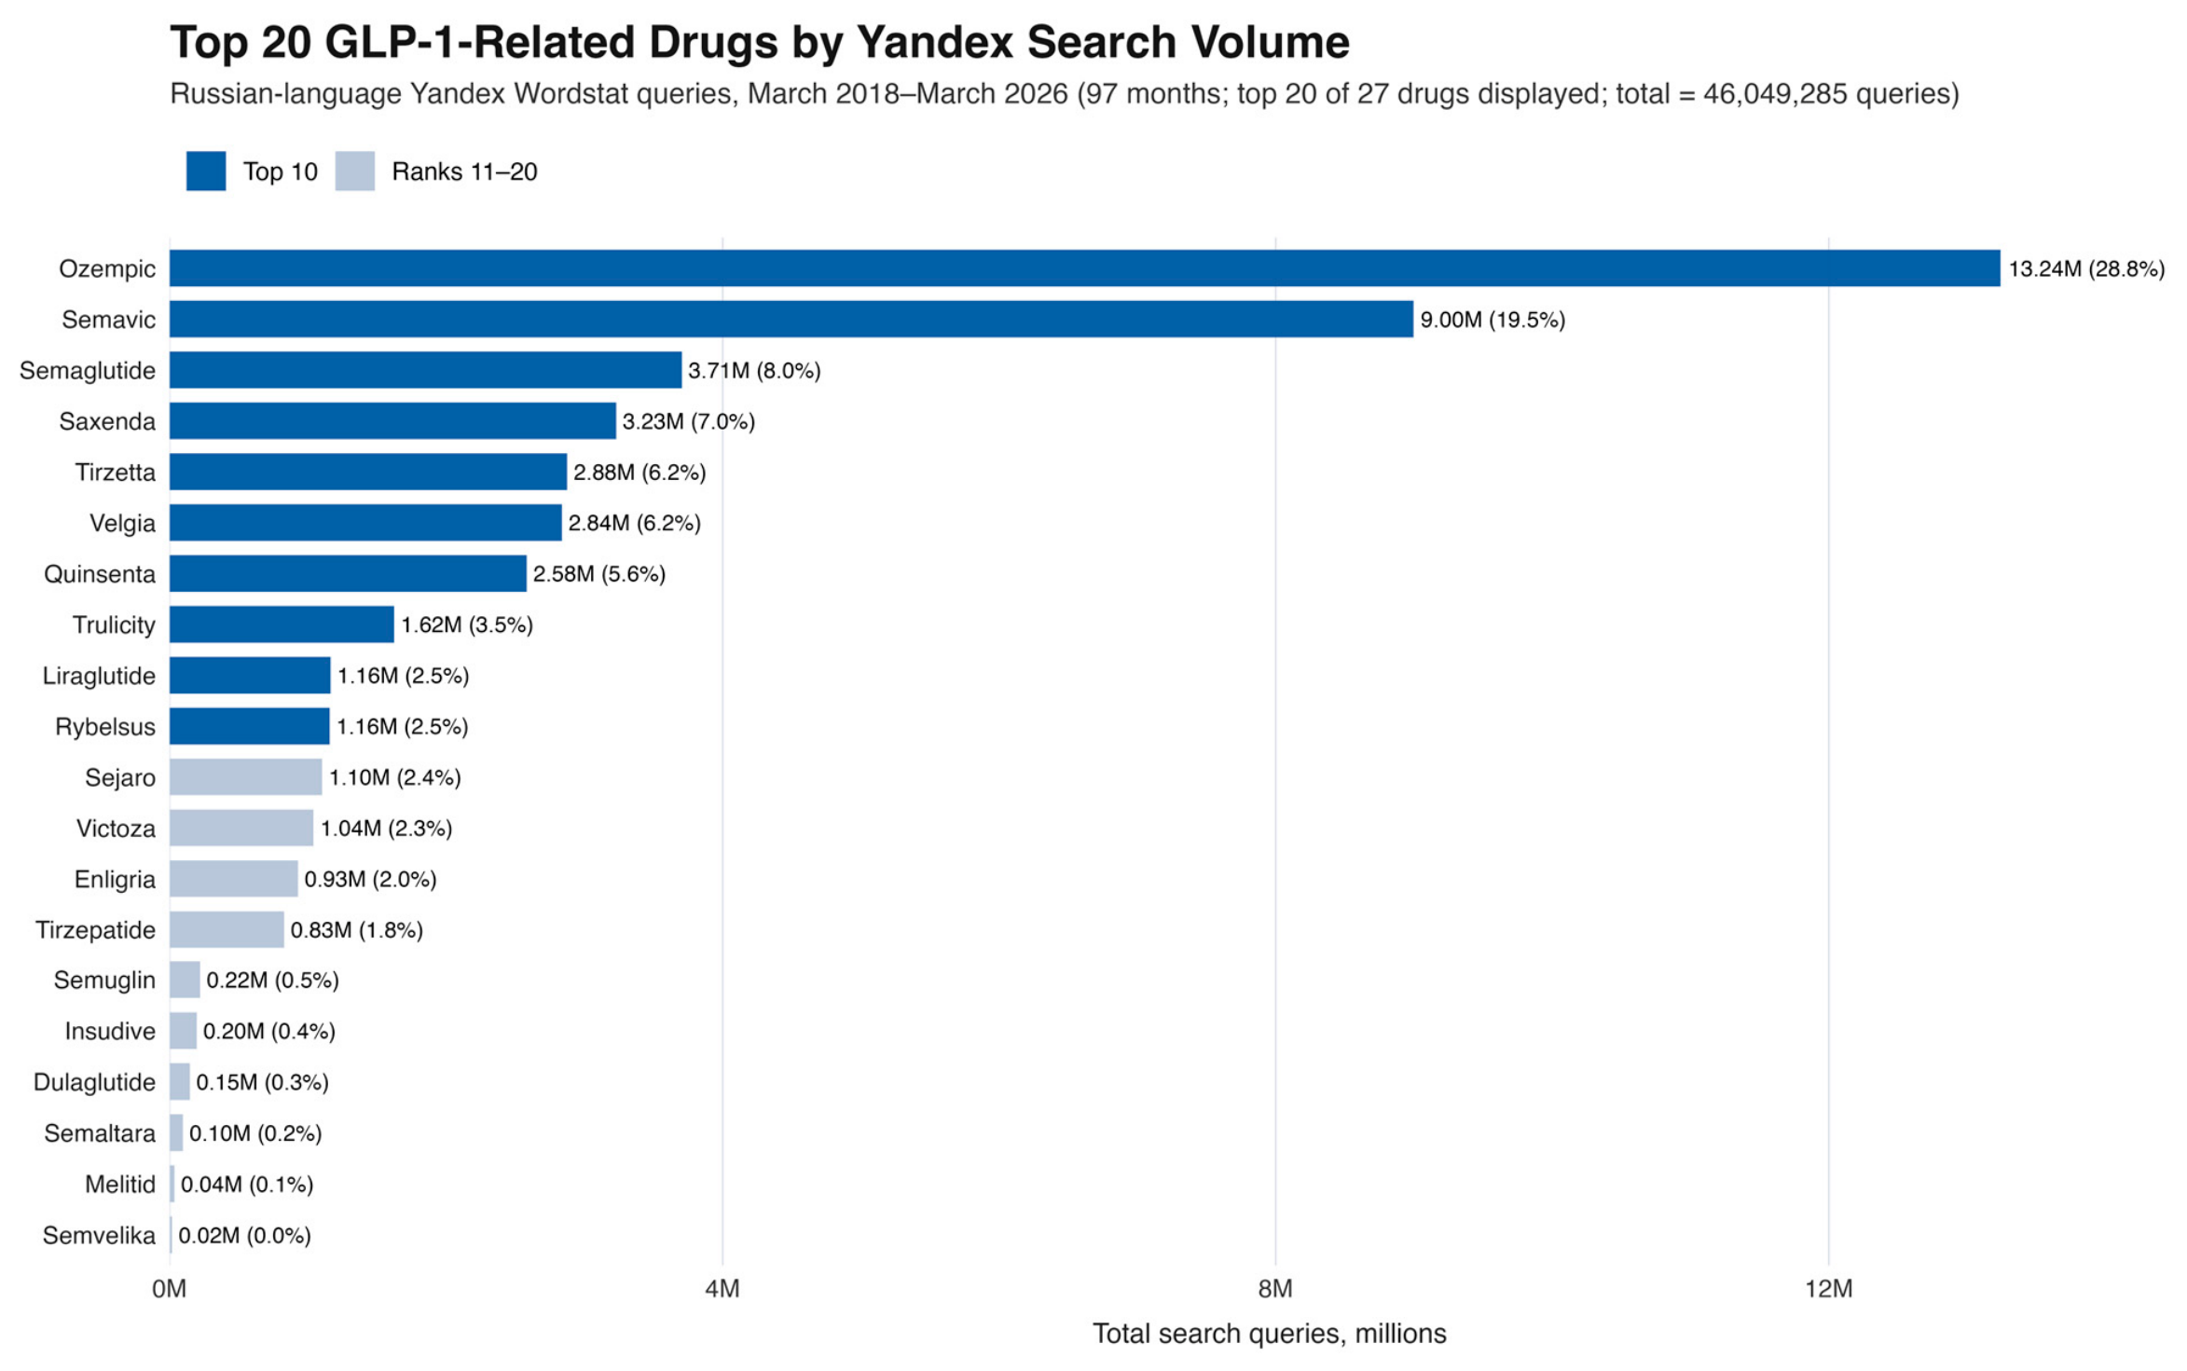
Over the 97-month observation period, the total volume of search queries for 27 GLP-1-class drugs in the Russian-language segment of Yandex was 46,049,285 (hereinafter—46.05 million) (Figure 1).
Ozempic was the clear leader (13.24 million searches), followed by Semavic (9.00 million), the INN Semaglutide (3.71 million), Saxenda (3.23 million), Tirzetta (2.88 million), Velgia (2.84 million), Quinsenta (2.58 million), Trulicity (1.62 million), the INN Liraglutide (1.16 million), and Rybelsus (1.16 million) (Table 1). The top ten accounted for 92.4% of total search interest. The growth rate of search queries over the eight-year period was 215× for semaglutide (from 757 queries in March 2018 to 162,843 in March 2026), 14,767× for Ozempic, 3.4× for Saxenda, and 1.4× for Trulicity. The 0.4× (60%) decline in queries for liraglutide reflects the drug’s displacement by newer INNs with a similar mechanism of action.
The geometric mean monthly growth rate for the INN semaglutide was 5.8% (equivalent to an average annual rate of approximately 95.7%). The arithmetic mean of monthly relative changes (MoM) was 46.3%. This high figure is explained by sharp fluctuations in the number of requests during the initial period; for example, with a small initial volume, individual monthly increases exceeded +200%, which disproportionately inflated the arithmetic mean. Since the geometric indicator is methodologically preferable for characterizing an exponential trend, it was used in the analysis, while the arithmetic MoM is presented separately as an indicator of volatility (the magnitude of monthly increases). Spearman’s rank correlation between semaglutide queries and time was ρ = 0.968 (p < 0.001).

2.1.2. Structural Inflection Points and Correlations

The PELT method identified January 2021 as the starting point for active growth of semaglutide. This point coincides with the peak of media coverage surrounding the STEP program. This coincided with the announcement of key results in 2020 and the subsequent publication of the STEP 1 study in the New England Journal of Medicine (February 2021) [15], as well as extensive coverage of the anticipated approval of Wegovy. The United States Food and Drug Administration (FDA) approval of semaglutide for the treatment of obesity (June 2021, Wegovy) [21,36] occurred five months after the structural inflection point and appears to have reinforced, rather than initiated, the growth in search interest that had already begun. For Ozempic, the structural inflection point is October 2018. This may be associated with the drug’s earlier U.S. registration (December 2017) and its entry into international markets in 2018. However, the U.S. registration precedes the break by ten months and can therefore be regarded only as an indirect, distal factor rather than a direct cause of the shift in Russian-language search behavior. Data on specific Russian regulatory or distribution milestones (the start of official sales, entry in the State Register of Medicines, inclusion in the pharmacy assortment) that could more precisely explain the October 2018 inflection were not part of the primary data. The high correlation between the time series of search queries for “Ozempic” and its most popular Russian analog, “Semavic,” was r = 0.83 (Pearson, p < 0.001) over the full 97-month series and r = 0.81 (Pearson based on log-transformed values for the period when both drugs were present on the market, n = 33). This indicates a high degree of consistency in search interest trends as perceived by users of the information space, but it does not constitute direct evidence of pharmaceutical or clinical interchangeability of the drugs.

2.1.3. Evolution of Market Concentration

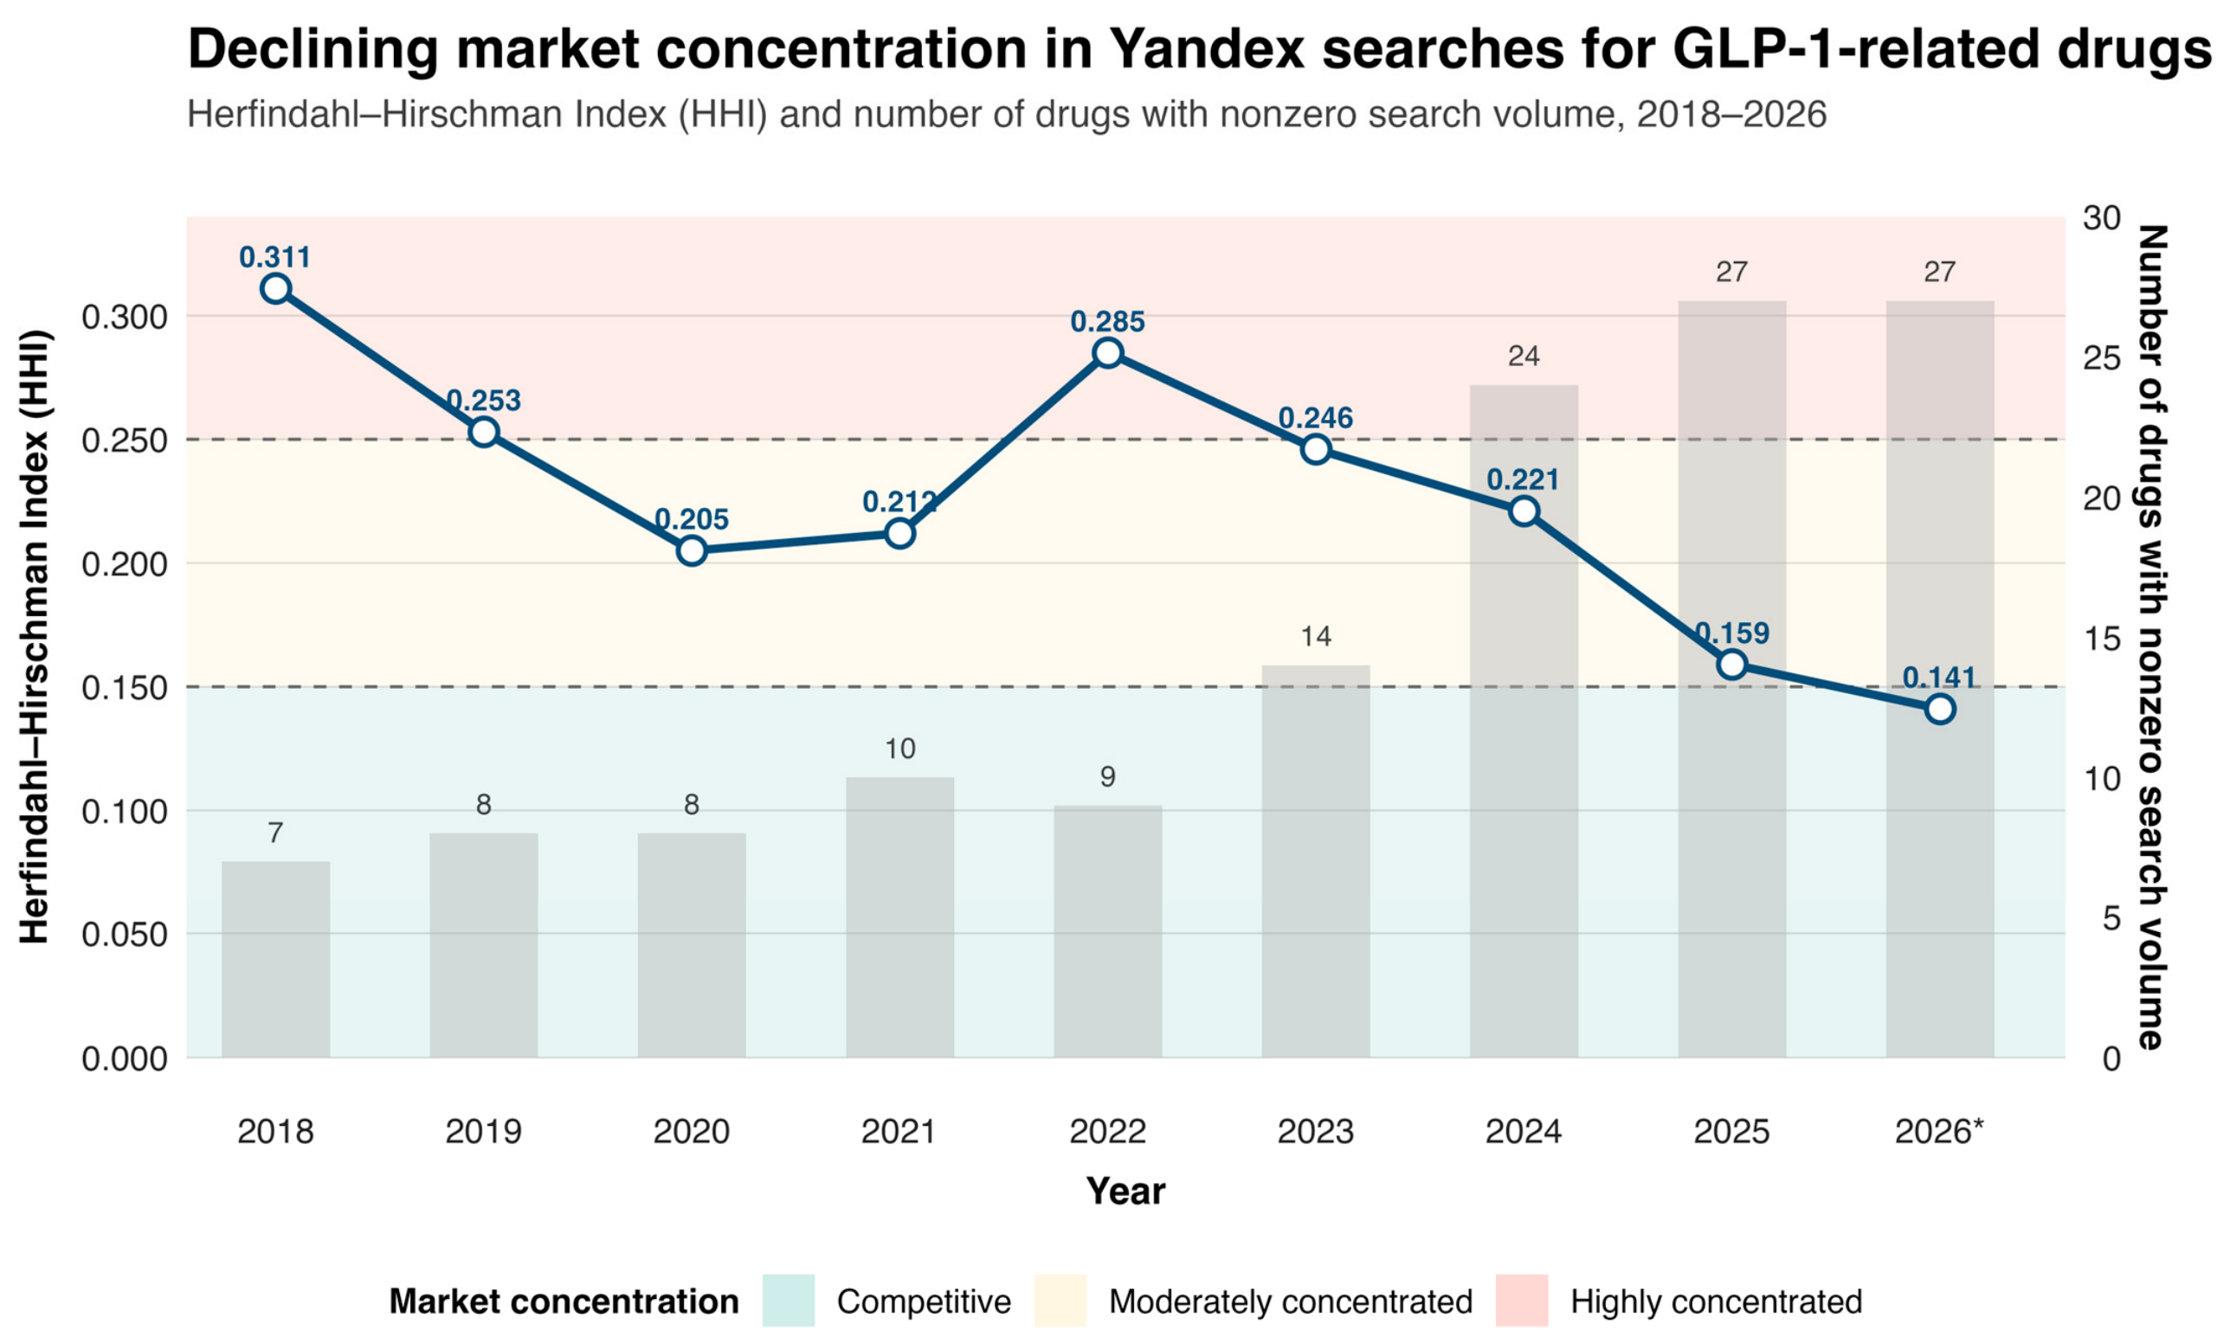
The Herfindahl–Hirschman Index (HHI) consistently declined from HHI = 0.311 in 2018 (highly concentrated market) to HHI = 0.141 in 2026 (competitive market) (Figure 2). The interim peak in 2022 (HHI = 0.285) is explained by Ozempic’s dominance and the slow response of information demand to the emergence of the first domestic analogs. Starting in 2024, a steady transition to a competitive structure is observed, driven by the distribution of demand among 24 concurrently available drugs.
The trend in the Brand/Generic ratio for the “Ozempic/semaglutide” pair followed patterns typical of a product’s life cycle. The ratio increased from 0.07 in 2018 (when INN searches outnumbered brand searches) to a peak of 12.49 in 2022 (the phase of massive brand marketing and the off-label wave), after which it declined to 2.21 in 2026 (the phase marked by the emergence of domestic analogs and a shift in demand). The sharp rise coincided with the period of mass brand marketing and the wave of off-label use of the drug, while the subsequent decline is explained by the emergence of domestic analogues on the market and a shift in demand.

2.2. Seasonality Analysis

2.2.1. Decomposition and Strength of Seasonality

Applying the STL decomposition method (Seasonal-Trend decomposition based on Loess) to the 60-month time series, we first transformed the data using the log1p(volume) function. This allowed us to decompose each series into three components: trend, seasonal, and residual. The trend component was dominant for all 27 drugs. The trend strength index ranged from 0.97 (Enligria) to 0 (Semaltara, Segluria, Ameglutar, Deglunorm, Semvelika, Selmiji). After removing the long-term trend, a pronounced seasonal component was not detected for all drugs (Tables S1–S3). The maximum values of seasonal strength were recorded for Victoza (0.560), dulaglutide (0.321), Saxenda (0.257), Trulicity (0.257), Ozempic (0.148), and tirzepatide (0.071). For series with >40% zero months or total volume <2000 queries, STL decomposition cannot reliably separate trend and seasonal components; therefore, their seasonal indices are flagged as undetermined rather than indicating true absence of seasonality If the proportion of zero/missing months in the 2021–2025 series exceeds 40% or the total number of queries over the five-year period is less than 2000, the STL algorithm is unable to reliably separate the trend and seasonal components. Based on this criterion, 18 of the 27 time series were classified as having reduced reliability of seasonal estimation, and their seasonal indices in Table S1 are marked as “undetermined”.

2.2.2. Distribution of Peak and Low Months

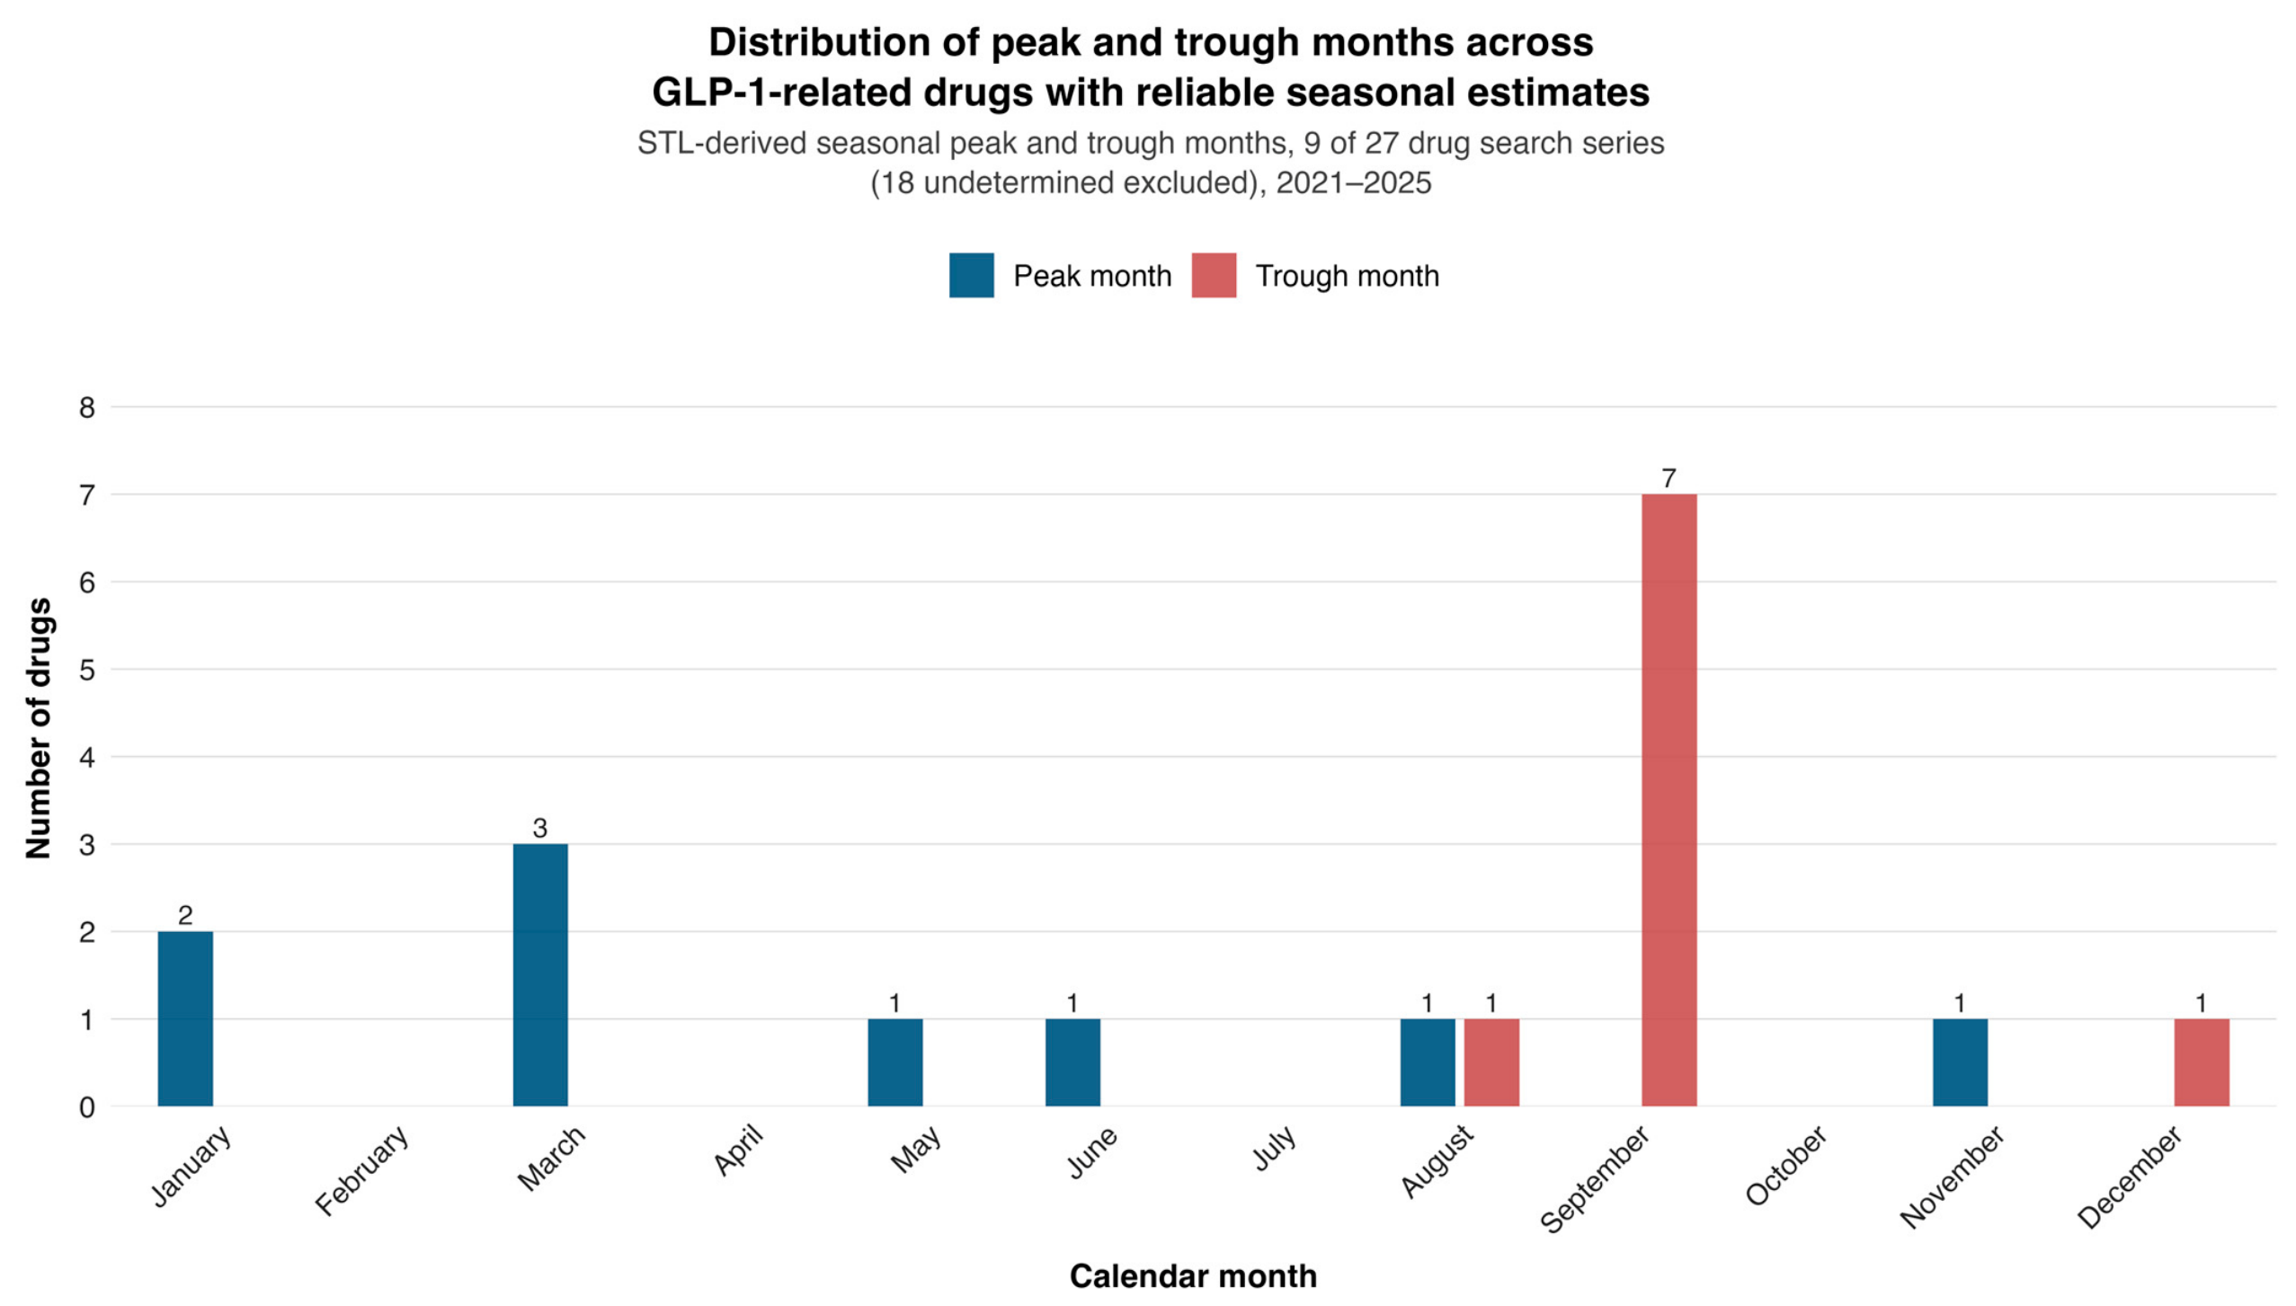
The distribution of peak and trough months was examined only for the nine drugs with reliable seasonal estimates (Section 2.2.1); the 18 drugs labeled as “undetermined” were excluded, because for newly launched or low-volume drugs the apparent peak reflects structural market entry rather than seasonality. Among these nine drugs, peak months clustered in spring (March–May: 4 of 9; March alone in 3 of 9), whereas trough months were concentrated in September (7 of 9) (Figure 3). This spring-peak/September-trough pattern is descriptive only: after Benjamini–Hochberg correction, none of the drugs reached statistical significance (Section 2.2.1, Tables S1–S3).

2.3. Comparative Semantic Analysis of Four Key Drug Names

2.3.1. The Drug Ozempic (INN Semaglutide)

Bigram Analysis
The bigram analysis revealed the dominance of two functional categories of queries—the target category (weight loss) and the commercial category. The bigram “for weight loss,” with 135,155 queries, ranked first. The bigrams “ozempic reviews” (52,469), “buy ozempic” (43,224), “ozempic price” (41,898), “ozempic instructions” (31,903), “Ozempic alternative” (31,063), and “Ozempic analogue” (30,752) formed the subsequent trends (Table 2).
Trigram Analysis
The leader of the trigram analysis was “Ozempic for weight loss” (99,854 queries), followed by “Ozempic medication instructions” (20,122), “instructions for use” (18,778), “weight loss reviews” (16,074), and “ozempic in Russia” (12,733). The trigrams confirm that the central focus of queries is the use of the drug for weight reduction, while there remains significant interest in instructions and reviews.
Thematic Categorization
The primary classification (Table 3) (mutually exclusive categories, total 100%) shows the following distribution: “drug comparison/brand core”—62.31% (1089 unique phrases), “weight loss/body weight”—13.91%, “instructions/dosage regimen”—5.80%, “purchase/availability”—5.53%, “price”—5.04%, “analogs/substitutes”—4.71%, “safety/side effects”—2.44%, “diabetes/glycemia”—0.25% (Table 3). According to the multi-label classification (a single query may belong to several categories), the shares are redistributed as follows: weight loss—14.21%, reviews—10.50%, price—8.47%, purchase—6.79%, analogs—6.66%, instructions—5.88%, safety—2.44%, diabetes—0.25%. The aggregate commercial component (the sum of “price,” “purchase/availability,” and “accessibility”) in multi-label analysis reaches 14.8%, which is effectively equal to the share of queries about weight loss.
TF-IDF Analysis
The most characteristic words for Ozempic, specific to the general background of GLP-1RAs, are “Ozempic” (TF-IDF = 156.4), “buy” (149.9), “weight loss” (125.3), “price” (117.6), “reviews” (108.4), “Ozempic” (83.9), “medication” (67.9), “tablets” (67.3), “generic” (58.8), and “instructions” (55.1). The word “diabetes” ranked 37th (TF-IDF = 23.2; volume = 801; number of unique phrases = 14), which is consistent with the extremely low representation of the official indication in the overall structure of search queries. One possible explanation is that the primary approved indication for this group of drugs is the treatment of diabetes, so users may have included the word “diabetes” less frequently in their search queries. To test this hypothesis, queries for the brand name “Ozempic” and the INN “semaglutide” (a less brand-specific term) were additionally compared for the same period (April 2026, n = 2000 and n = 1849 unique queries, respectively). The proportion of diabetes-related queries was statistically indistinguishable for both terms (0.24–0.25% for “Ozempic” versus 0.30% for “semaglutide.” Two-proportion chi-square test, χ2 = 0.97, p = 0.33). This means that the low proportion of diabetes-related queries cannot be explained solely by the fact that the brand name itself implies the indication. It reflects the actual structure of users’ interests. However, the influence of the “linguistic” factor cannot be completely ruled out.
As of 2026, among the four analyzed GLP-1 receptor agonists (Ozempic/semaglutide, Saxenda/liraglutide 3.0 mg, Tirzetta/tirzepatide, Trulicity/dulaglutide), two of them, namely Saxenda and Tirzetta, have the officially registered indication in the Russian Federation of “weight correction in cases of obesity or overweight with risk factors” [40,41]. In contrast, Ozempic and Trulicity are registered exclusively for the treatment of type 2 diabetes [42,43].
Morphological Normalization
Search queries for Ozempic were processed using a combined procedure of morphological normalization and Levenshtein clustering of typos (threshold ≤ 2) and reduced to a single, standard (dictionary) form of the word. Spelling normalization was performed in two stages. The first (main) stage involved reducing the various inflected forms of the same word to a single dictionary form (for example, “ozempika,” “ozempike,” and “ozempikom” were reduced to the single dictionary form “ozempik”). The second stage involved correcting typos in the drug name itself based on string similarity (Levenshtein distance with a threshold of ≤2; for example, “ozepmik” → “ozempik”). In total, 56.3% of all queries (577,730 out of 1,026,152) contained such spelling variations. The majority of this share is accounted for by the first stage—the standardization of case endings throughout the query text. The contribution of actual typo corrections in the name is small and consistent: 6.5%, 6.6%, and 6.7% at thresholds 1, 2, and 3, respectively, and in no case were different brands (“Sejaro,” “Velgia,” “Quinsenta,” etc.) erroneously merged.

2.3.2. The Drug Saxenda (INN Liraglutide)

Saxenda is one of two drugs among the four analyzed drug names that has the registration indication in the Russian Federation of “weight correction in cases of obesity or overweight with risk factors” [40]. A semantic analysis of 320 unique query formulations (total volume 44,679 after filtering out service lines) revealed a structure consistent with the drug’s regulatory positioning (Table 4).
Top Bigrams
The top positions were occupied by the bigrams “Saxenda instructions” (8572), “Saxenda for weight loss” (6554 in the forms “for weight loss” + “Saxenda for”), “Saxenda price” (3829), “buy Saxenda” (2940), and “Saxenda reviews” (2850). Saxenda’s bigram profile demonstrates the most rational and consistent structure of search interest among the four analyzed search terms, aligning with its official registration. Instructional and goal-oriented (weight loss) queries predominate accompanied by a moderate commercial component, indicating the correct positioning of the drug in the information space and a minimal level of off-label search motivation.
Top Trigrams
The trigram analysis revealed the convergence of three key information needs: instructional, goal-oriented (weight loss), and commercial. The leading positions, with nearly equal search volumes, were occupied by the queries “Saxenda for weight loss” (3966) and “Saxenda instructions for use” (3942), which directly reflects the alignment of search interest with the drug’s registered indication. These are followed by “Saxenda for weight loss price” (1738) and “Saxenda instructions for use for weight loss” (1352). These data indicate that the commercial motive (price) among users is closely linked to the drug’s intended use, and the instructional query is specifically framed in the context of weight loss. Thus, Saxenda’s trigram profile is characterized by an instructional, goal-oriented pattern with a moderate commercial component, which qualitatively distinguishes it from the predominantly commercial and dosage-related queries identified for other analyzed search terms.
Thematic Categorization (Primary Classification)
The distribution of search queries across mutually exclusive categories was as follows: umbrella category “drug comparison”—47.90%, instructions/dosage regimen—23.18% (the highest share among all analyzed search terms, comparable only to Trulicity), weight loss/body weight—9.98%, price—9.51%, purchase/availability—6.82%, analogs/substitutes—2.33%, safety—0.21%, diabetes/glycemia—0.07%. Thus, the total commercial load (price + purchase/availability) does not exceed 16.3% in the primary scheme, which is significantly lower than that of Tirzetta (17.5%) and Trulicity (25.3%).
Saxenda’s semantic profile is characterized by a combination of three features unique to this sample, namely: (1) the dominance of instructional queries (23.18%), reflecting the need for careful mastery of the daily regimen of subcutaneous injections with stepwise dose titration—in contrast to weekly medications; (2) a pronounced focus on weight loss (9.98%), consistent with the official indication of “weight management.” Finally, the third feature of Saxenda’s semantic profile is the minimal proportion of diabetes-oriented queries (0.07%), despite the fact that liraglutide, as the INN, is also registered for the treatment of T2D. This finding indicates that Saxenda is consistently associated with weight management.

2.3.3. The Drug Tirzetta (INN Tirzepatide)

Tirzetta is the Russian brand name for tirzepatide, which entered the market in 2024–2025. By April 2026, the drug had become the leader among all analyzed drug names in terms of absolute search interest (1,786,742 queries, 2000 unique query formulations). Semantic analysis revealed a pronounced dose-related and commercial nature of the queries. This is entirely understandable for the early phase of a new drug’s market launch with stepwise dose titration (Table 5).
Distribution of search queries by primary classification into the following categories: umbrella category “drug comparison”—69.67%, purchase/availability—11.05%, instructions/dosage regimen—8.26%, price—6.46%, weight loss/body weight—3.18%, safety—0.99%, analogs—0.31%, diabetes—0.08%. The total commercial load (price + purchase) is 17.51%—the highest figure among all core terms, with the exception of Trulicity, reflecting active searches for the drug in the pharmacy network amid limited availability. It is important to note that 17.51% is not a separate metric but simply the sum of the two primary categories already mentioned: “price” (6.46%) and “purchase/availability” (11.05%). In Table 5, these same categories are presented separately (in the multi-label scheme, the share of “purchase/availability” is 11.35%).
A bigram analysis confirms the dominance of commercial and dosage-related queries. The top positions were held by “buy tirzetta” (113,285), “tirzetta 5” (112,049), “tirzetta reviews” (109,677), “tirzetta price” (102,885), and “Tirzetta instructions” (92,660), “5 mg” (78,685), “Tirzetta 2” (59,454), “Tirzetta medication” (54,739), and “for weight loss” (54,384). Trigrams show a clear interest in dosages, for example, “Tirzetta 2.5” (49,386), “Tirzetta 5 mg” (47,476), “Tirzetta 7.5” (25,921), and “buy 5 mg” (23,496) and “Tirzetta reviews from people losing weight” (22,389). High interest in specific dosages may indicate that users are actively learning the titration regimen, often combining it with commercial intentions (searches for “buy 5 mg”).
The share of queries clearly related to diabetes was only 0.08%, which is the lowest value among all four search terms (even lower than for Saxenda). However, unlike Ozempic and Trulicity, Tirzetta is approved in the Russian Federation for “weight management,” and 3.18% of weight-loss-related queries align with the official prescribing information. Nevertheless, the dominance of commercial and dosage-related queries over goal-oriented ones indicates that, during the drug’s active market entry phase, informational priorities are shifted toward accessibility and usage guidelines rather than therapeutic goals.

2.3.4. The Drug Trulicity (INN: Dulaglutide)

An analysis of search queries for Trulicity revealed the strongest commercial focus among all the drugs studied. The main topics were distributed as follows: commercial queries (price, purchase, availability)—25.28%, instructions and use—24.24%, general queries mentioning the drug name—20.37%, and dosage and administration—12.08%. The remaining topics (reviews, analogs, weight loss, comparison with other drugs, diabetes, safety) together did not exceed 18% (Table 6).
According to the multi-label classification, a single query could relate to several topics at once. The combined share of the three commercial categories (price, purchase/availability, prescription) reached 41.1%. This is the highest value among all drugs studied. This result indirectly points to possible difficulties with the physical availability of Trulicity in pharmacies. Another feature of queries about Trulicity is interest in specific dosages of 1.5 mg and 0.75 mg and in the pen device. This is confirmed by the following trigrams: “trulicity 1 5” (8306), “trulicity 1 5 mg” (3500), “1.5 instructions” (1944), “Trulicity 1.5 price” (1184), “Trulicity 0.75” (828), “Trulicity pen” (59), “Trulicity syringe” (66), and “Trulicity injection” (229). The number of unique formulations and total volumes vary significantly among the four drugs (Ozempic n = 2000/1,026,152; Saxenda n = 320/44,679; Tirzetta n = 2000/1,786,742; Trulicity n = 242/37,859). Therefore, the percentages for each drug were calculated relative to its own total volume rather than the overall pool, which is appropriate for comparing structure; however, categories with a small absolute volume within a drug (primarily “diabetes/glycemia” for Trulicity, volume 145–169 out of 37,859) are associated with greater uncertainty in the estimate of the share. The binomial 95% confidence interval for the share of the “diabetes/glycemia” category for Trulicity is 0.33–0.45% (primary, 145/37,859) and 0.38–0.52% (multi-label, 169/37,859). Since this is not a sample estimate but a complete count of all queries over the period, the interval reflects only the formal statistical uncertainty associated with low frequencies, rather than sampling error, and is presented as an indicator of the estimate’s robustness.

2.3.5. Comparison of Search Query Structures

A comparison of the primary category share across four search terms (Table 7) revealed four distinct semantic signatures. The first is “brand-dominant with informational interest in weight loss” (Ozempic). Ozempic had the highest share of weight loss queries. The second is “instructional and goal-oriented, consistent with the approved indication” (Saxenda). Saxenda had the highest share of instructional queries (23.18%) and a significant share of weight loss queries (9.98%), which corresponds to the approved indication “weight management”. The third is “dose-commercial with comparative interest” (Tirzetta). This drug had a high proportion of commercial queries, detailed interest in the 2.5/5/7.5 mg doses, and the highest proportion of comparisons with other GLP-1 drugs among the analyzed drug names, reflecting the early phase of market penetration. The fourth category is “instructional and commercial with dosage details” (Trulicity). This drug is characterized by the highest total commercial interest and a high proportion of queries regarding specific dosages. In all four cases, the proportion of diabetes-oriented queries did not exceed 0.46%, demonstrating a systemic discrepancy between users’ informational interest and the registered indication (T2D). These data characterize the structure of information demand but do not allow for direct conclusions about the actual use, prescription, or purchase of the drugs, as the assessment of these aspects requires independent validation based on the analysis of pharmacy sales data.

2.4. Comparison of Search Interest with Pharmacy Sales Data Based on DSM Group Reports

Of the 27 INNs and brand names analyzed for search interest, seven GLP-1RA drugs appeared consistently in the DSM Group (Moscow, Russia) reports for 2025–2026: the original Ozempic (Novo Nordisk, prior to the company’s withdrawal from the Russian market); domestic semaglutide generics—Semavic (Geropharm, Saint Petersburg, Russia), Velgia (Promomed Rus, Moscow, Russia), Quinsenta (Promomed Rus), Semuglin (Pharmasyntez, Irkutsk, Russia), Insudive (PSK Pharma, Moscow Region, Russia); tirzepatide preparations—Tirzetta (Promomed Rus) and Sejaro (Geropharm). Other domestic analogs (Semaltara, Semvelika, Ameglutar, Deglunorm, Segluria, Selmiji, Enligria, etc.) had either not yet achieved commercially significant sales volumes in the retail network or were undergoing state registration at the time of reporting. Liraglutide preparations (Victoza, Saxenda) and Trulicity (dulaglutide) do not appear in the DSM rankings of the TOP-20 commercial segment for 2025–2026 (sales volumes were below the threshold for inclusion in the TOP-300), which in itself is an informative result and is consistent with the search interest profile described above.

2.4.1. Overall Dynamics of the GLP-1RA Market in 2025

According to the DSM Group’s annual report, in 2025, retail sales of all A10 group drugs (diabetes treatments) increased by 83.1% compared to 2024. The main drivers of growth were precisely the GLP-1RA drugs we analyzed: Semavic (+190.1% compared to 2024), Quinsenta (+67.5%), and three “newcomers”—Tirzetta (6.2 billion rubles in annual sales, launched in February 2025), Velgia (5.9 billion rubles, launch in March 2025), and Sejaro (2.7 billion rubles, launch in May 2025). Total sales of drugs with the INN semaglutide in 2025 amounted to 29.2 billion rubles (a 4.7% share of the entire vital and essential drugs (VED) segment and a 204.1% increase compared to 2024), which propelled the INN semaglutide to first place in the ranking of all VEDs in Russia. For the first time in the history of the Russian retail market, Semavic became the leading brand in the TOP-20 commercial segment with a 1.0% share of the total retail market (volume of 18.1 billion rubles for the year), displacing the previous leaders, Eliquis and Xarelto. The annual retail sales data for GLP-1RA drugs reported by DSM Group are summarized in Table 8.

2.4.2. Monthly Trends for 2025–2026 and the Launch of New Generics

A comparison of monthly trends in pharmacy sales by value (in millions of rubles) with monthly trends in search interest on Yandex.Wordstat (number of queries) for the period June 2025–April 2026 revealed a close correspondence in both content and magnitude. Table 9 presents the summary trends. Semavic rose to first place in the commercial segment’s TOP-20 by the summer of 2025 and held that position until the launch of Tirzetta in February 2026. As of April 2026, Tirzetta accounted for 1.80% of the total retail market for prescription drugs. Concurrently, search interest in Tirzetta grew from 126,200 to 482,700 queries per month—a 3.82-fold increase—which is comparable in magnitude to the growth in pharmacy sales from 432.9 million rubles in July 2025 to 3100.4 million rubles in April 2026 (a 7.16-fold increase). A formal analysis of lagged cross-correlation for Tirzetta (lags ranging from −2 to +2 months, n = 6–8 pairs of observations) showed that the strongest correlation between search interest and sales is observed at a zero lag (r = 0.976), whereas when search interest was shifted 1 and 2 months ahead of sales, the coefficient was numerically lower (r = 0.889 and r = 0.806, respectively). Thus, the available data do not support a consistent 1–2-month lead of search interest over sales and should be interpreted as a predominantly contemporaneous relationship between the two indicators. For the remaining three brands, a formal lag analysis was not performed due to insufficient time series length (n ≤ 7).

2.4.3. Correlation Analysis of Search Interest and Sales

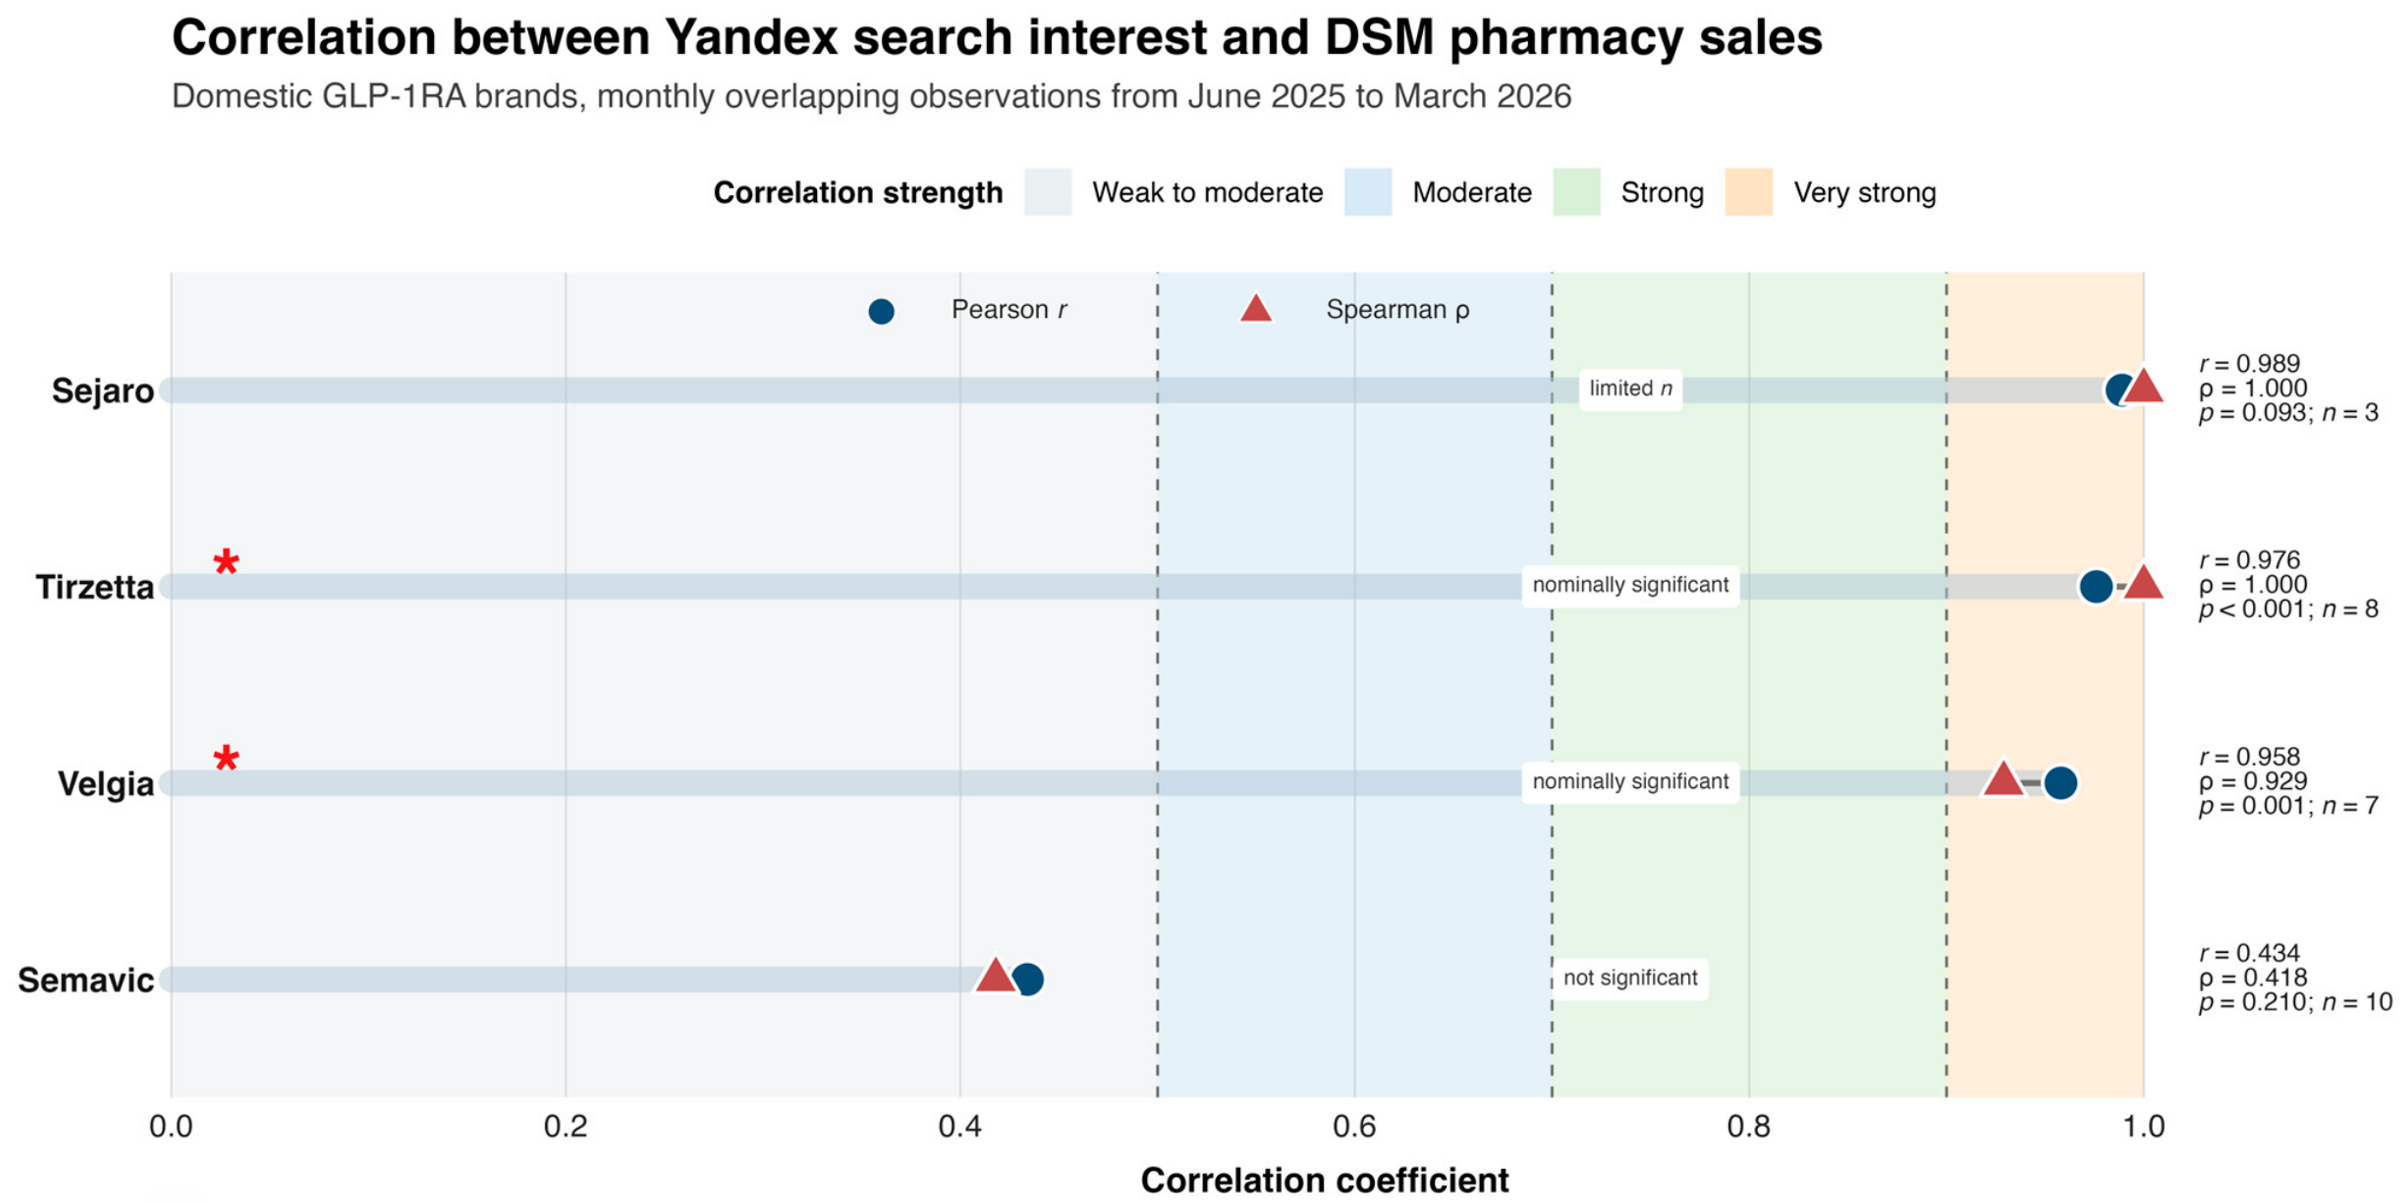
Monthly correlations between the number of search queries and the value of pharmacy sales for four key domestic GLP-1RA brands during the overlapping observation period were found to be high and consistent. For Tirzetta, the Pearson correlation coefficient was r = 0.976 (p < 0.001; n = 8 months), and the Spearman rank correlation was ρ = 1.000. For Velgia, r = 0.958 (p = 0.001; n = 7), ρ = 0.929. For Sejaro, the Pearson correlation coefficient between search queries and sales was r = 0.989 (p = 0.093). However, this result is based on only three months of observations, so its statistical power is limited. For Semavic, the correlation was moderate, with r = 0.434 (p = 0.210; n = 10) and Spearman’s coefficient ρ = 0.418. The correlation coefficients are visualized in Figure 4. This is explained by the fact that search interest in the drug had already plateaued in 2024, while sales volume continued to grow. To quantify the uncertainty of the reported coefficients, 95% confidence intervals were calculated (Fisher’s z-transformation): Tirzetta—0.976 (95% CI 0.867–0.996); Velgia—0.958 (95% CI 0.734–0.994); Semavic—0.434 (95% CI from −0.269 to 0.835; the interval includes zero, which is consistent with the lack of statistical significance). For Sejaro (n = 3), a robust confidence interval cannot be calculated due to the insufficient number of observations. Since the time series for Tirzetta, Velgia, and Sejaro showed a monotonically increasing trend over the short observation period, the high correlation coefficients by level may have partly reflected a general upward trend rather than month-to-month covariance. To verify this, the correlation based on first differences (month-to-month changes) was additionally calculated. For Tirzetta, the correlation remained statistically significant (r = 0.819; p = 0.024; n = 7 differences), whereas for Velgia, the significance was lost (r = 0.233; p = 0.657; n = 6)—that is, the high initial correlation for Velgia is largely due to the common upward trend in both time series, whereas for Tirzetta, the relationship persists even after removing the trend. For Sejaro and Semavic, the short-duration/plateau series does not allow for a meaningful interpretation of the correlation of the first differences. Correction for multiple comparisons using the Benjamini–Hochberg method, applied to the four sales–search correlation coefficients, did not alter the conclusions regarding statistical significance. The FDR-corrected p-values were 0.0001 (Tirzetta), 0.0014 (Velgia), 0.124 (Sejaro), and 0.210 (Semavic); that is, statistical significance is maintained only for Tirzetta and Velgia. Finally, sales in this comparison are expressed in value terms (million rubles), which conflates the effects of price and physical sales volume. Data on sales by package were not available in the DSM Group’s reports, and this is noted as a limitation on the interpretation of the strength of the relationship between search interest and physical consumption volume.

2.4.4. Market Share of GLP-1 RAs in Group [A10] and in the Overall Retail Market

The combined market share of the four domestic GLP-1 RA brands in the retail pharmaceutical market began to change in the summer of 2025 and reached a qualitatively new level by the spring of 2026. In June 2025, four of the 27 analyzed drugs accounted for less than 1.1% of the total commercial pharmaceutical market (only Semavic had a 1.1% share; Velgia had just entered the market and did not make the Top 20). In April 2026, the combined share of Tirzetta (1.80%), Semavic (1.12%), Sejaro (0.87%), and Velgia (0.61%) reached 4.40% of the total retail pharmaceutical market in the Russian Federation and approximately 19% of the [A] “Digestive Tract and Metabolism” category. This means that over 10 months, the combined market share of the four domestic analogs of the original GLP-1RAs in the retail segment increased more than fourfold.

3. Discussion

To the best of our knowledge, this study is the first systematic quantitative-semantic analysis of search queries regarding GLP-1-class drugs in the Russian-language segment of the Internet, conducted based on absolute values from Yandex.Wordstat over an eight-year period. The total volume of analyzed information demand (46.05 million queries for 27 INNs and brand names; 2.90 million search queries and 4562 unique formulations in the semantic analysis of four key drug names) is comparable in scale to major published infodemiological studies of GLP-1RAs [22,44,45].
The recorded average monthly increase in search interest in semaglutide of 46.3% and a 215-fold growth rate from March 2018 to March 2026 are consistent with international trends. For example, in the U.S. between 2019 and 2023, the number of patients without diabetes who initiated GLP-1 receptor agonist therapy for the first time to treat obesity or overweight increased by more than 700% (from approximately 21,000 to more than 174,000 people) [46]. The structural inflection point in growth that we identified (January 2021) coincides chronologically with the publication of the STEP 1 results in the New England Journal of Medicine (NEJM) (February 2021) and the preceding international media coverage of Wegovy’s expected approval [21,36], whereas the U.S. FDA approval for the treatment of obesity (June 2021) followed later. This confirms the sensitivity of infodemics metrics to global regulatory and informational events. This is consistent with Eysenbach’s conceptual model [28] and Mavragani’s empirical data on the role of information cascades in shaping search demand [31].
The decline in the Herfindahl–Hirschman Index from 0.311 in 2018 to 0.141 in 2026 (on a scale with a maximum of 1.0) reflects the transition of the information GLP-1RA market from the “highly concentrated” category to the “competitive” category according to the interpretive matrix [37,38,39]. The parallel evolution of the brand/generic ratio from values < 1 (0.07) in 2018–2019 to a peak of 12.5 in 2022, followed by normalization to 2.2 in 2026, describes the typical life cycle of a drug from the perspective of user search behavior. During the early adoption phase, INN queries predominate; then, during the maturity and mass marketing phase, brand queries predominate; and finally, during the phase in which analogs and generics appear, the ratio returns to equilibrium. The novelty of our observation lies in the fact that this pattern has been quantitatively documented for the first time at the level of search queries in the context of rapid replacement of the original drug with domestic analogues following the manufacturer’s exit from the market.
The high correlation between the time series of queries for “Ozempic” and “Semavic” (Pearson r = 0.83; p < 0.001 on the full series of 97 observations; r = 0.81 on log-transformed data for the period when both drugs were present on the market) indicates that the dynamics of search interest in the original drug and its domestic analogs are closely linked. This may reflect both general informational drivers (news, shortages) and the possible perception of the drugs as interchangeable; however, additional data are required for a definitive conclusion. This is consistent with international observations regarding the high degree of perceived interchangeability of semaglutide during the global Ozempic shortage of 2022–2024. At the same time, this correlation reflects the general perception of drugs among users of the information space and cannot replace formal bioequivalence studies. It merely indicates the potential applicability of digital pharmacoepidemiology tools as a supplementary, indicative source of information on the perceived interchangeability of drugs, which requires confirmation by pharmacological and clinical data.
The most clinically significant descriptive finding of the study is the structural mismatch between the semantic profile of search queries and official registration indications. The share of queries clearly related to T2D (a registered indication for three of the four search terms) did not exceed 0.46% (range 0.08–0.38% according to the primary classification), whereas the share of queries regarding weight loss ranges from 0.73% (Trulicity) to 13.91% (Ozempic), and the total commercial component ranged from 10.57% (Ozempic) to 25.28% (Trulicity in the primary classification; and up to 41.1% in the multi-label classification). Saxenda is an important exception. For this drug, the relatively high proportion of queries regarding weight loss (9.98%) and instructions (23.18%) aligns with the drug’s official positioning for weight management. A systematic infodemiological analysis of Google Trends in 27 countries conducted by Raubenheimer et al. [22] showed that search queries related to weight loss were the dominant topic in virtually all countries, while the topic of diabetes was virtually absent or extremely weak in search queries regarding semaglutide. When interpreting these data, it is important to emphasize that search queries reflect informational interest and do not prove actual drug use, off-label prescribing, self-purchase, self-medication, or actual pharmacoeconomic demand. Confirmation of these aspects requires comparison with pharmacy sales data, an approach that represents a promising area for future research.
In the Russian context, our study is particularly significant. During the observation period, two of the four drugs studied (Ozempic and Trulicity) did not have an official indication for use in obesity. Therefore, the high proportion of weight-loss-related queries directed at these medications reflects the public’s strong interest in their potential off-label use. The extremely low proportion of diabetes-related search queries should not automatically be interpreted as a lack of interest in the official indication. One possible explanation is that users are aware that this group of drugs is primarily indicated for the treatment of diabetes, and as a result, they may have used the word “diabetes” less frequently in their search queries, assuming it was implied. The high proportion of commercial queries, combined with the low proportion of diabetes-related queries, is consistent with the hypothesis that users are independently selecting medications without a doctor’s prescription. It is impossible to confirm this definitively based on search analytics data, and we identify self-selection of medications as one of several possible hypotheses requiring independent verification, rather than an established fact. If this presumed self-medication is indeed occurring, it could potentially increase the risk of irrational use and uncontrolled dose adjustments.
A comparative analysis identified four consistent patterns of search queries that reflect a drug’s life cycle stage, dosing regimen, and official indications. Ozempic exhibits brand-dominated search behavior. Queries containing the brand name account for 62.31% (primary classification). The share of queries related to weight loss is the highest among all drugs studied—13.91%. At the same time, queries regarding instructions and dosages are relatively rare. This pattern is typical for a mature market leader when user interest is high, but it does not fully align with the registered indications. Saxenda exhibits a profile of queries focused on instructions and intended use. The share of queries regarding instructions is the highest among all the drugs studied (23.18%). The share of weight loss queries is also significant (9.98%). This structure aligns with the registered indication of “weight management” and reflects the need to master daily subcutaneous injections. This profile indirectly indicates that the alignment of official indications with users’ actual interests fosters more rational search behavior. The topic of instructions predominates in queries, rather than commercial aspects (price, purchase).
Tirzetta exhibits a dosage-commercial search profile with a noticeable interest in comparisons. This reflects the early stage of the drug’s entry into the Russian market (2024–2025). Users frequently search for information on the drug’s price and availability, as well as instructions for its use. Particular attention is paid to specific dosages. The top search terms are “Tirzetta 2.5,” “Tirzetta 5 mg,” and “Tirzetta 7.5.” Users also actively compare Tirzetta with semaglutide. Since tirzepatide requires a gradual dose increase every four weeks, the data obtained from the semantic analysis can be explained by increased interest in the titration regimen.
Trulicity exhibits an informational-commercial search profile with dosage details. The drug is administered weekly using a special pen, and fixed doses of 0.75 and 1.5 mg are available. The drug exhibits a unique pattern with the highest total commercial load among all studied drugs (25.28–41.1%). The high proportion of commercial queries may indirectly reflect issues with the physical availability of the drug in pharmacy chains.
Previously in the U.S., a strong correlation was demonstrated between the volume of search queries on Google Trends and actual prescriptions for GLP-1 receptor agonists, including specific brand names. Specifically, for semaglutide (Wegovy), the correlation coefficient reached r = 0.97, and for tirzepatide (Zepbound), r = 0.90 [47]. Our results and the semantic analysis of queries complement these data by providing a quantitative comparison across drugs, rather than relying on the normalized Google Trends scale.
Seasonality analysis did not reveal significant seasonal differences, but possible small-amplitude seasonal effects with spring peaks require further observation over a larger number of annual cycles for statistical verification. Search interest in GLP-1RAs in 2021–2025 is in a phase of exponential growth (trend strength from 0 to 0.97), and any rhythmic fluctuations of small amplitude are lost against the backdrop of the dominant trend. The power achieved by the regression test over a five-year observation period and at the standard significance level adjusted by the Benjamini–Hochberg correction indicates that a negative result does not rule out the presence of true seasonality with a small effect size but requires further observation (≥8–10 annual cycles) for its reliable verification. For Tirzetta, which entered the market in 2024–2025, the long pre-market zero period further limits the interpretability of seasonal indices. Formal seasonal values may reflect not seasonality but the structural emergence of the drug in the information field. This result demonstrates the importance of a rigorous statistical protocol in infodemiology.
The proportion of grammatically variable queries—56.3%—that we systematically identified represents a significant methodological finding for all languages with a developed morphology. In the English-language infodemiological literature, this issue is typically underestimated due to the fixed form of English nouns. In the Russian-language context, ignoring case and punctuation variability leads to a systematic underestimation of the volume of each thematic category by an average of 50%. The proposed normalization protocol is applicable to other non-English-language pharmacoepidemiological studies and can be recommended for infodemiological studies in languages with rich morphology.
The study results have at least four practical implications. First, for pharmacovigilance systems: the low proportion of queries with explicit patient-reported symptoms (safety/side effects categories—0.21–2.44%) alongside an extremely high proportion of commercial queries and interest in weight loss indicates a risk profile of irrational self-medication. This is particularly important in light of ongoing global reports of semaglutide counterfeiting [26] and reports of rare but clinically significant adverse reactions, such as acute pancreatitis, which continue to emerge [48]. There are also legitimate concerns regarding the potential risk of serious gastrointestinal complications, including diabetic gastroparesis, particularly with long-term off-label use [49]. It would be advisable to integrate search query monitoring into national early warning systems for adverse drug reactions or similar tools used in the analysis of spontaneous reports.
The imbalance between official indications and users’ actual information interests (for two of the four drug names analyzed) indicates a shortage of scientific and educational materials in the open information environment. The high proportion of commercial queries for Trulicity (25.3–41.1%) combined with a low clinical component may indicate a potential problem with the physical availability of the drug; the high proportion of queries regarding Tirzetta titration may indicate a need for clinically validated dose calculators and infographics. The correlation between search interest and actual prescriptions [47] provides grounds for considering our Yandex.Wordstat quantitative data as a timely, low-cost concurrent proxy for the demand for GLP-1-class drugs in the Russian Federation—particularly valuable where pharmacy-sales data are delayed or unavailable. However, directly extrapolating search interest to sales requires independent validation.
Comparing our search interest metrics with independent data from the DSM Group’s pharmacy audit for 2025–2026 provides a rare opportunity to empirically test the hypothesis that infodemiological metrics can serve as indicators of actual pharmacoepidemiological demand. The correlations between monthly search volume and pharmacy sales value for domestic GLP-1RA brands in the early market entry phase (Tirzetta, r = 0.976, p < 0.001; Velgia, r = 0.958, p = 0.001) were strong and comparable to those reported in the literature [47]. However, the robustness of this relationship to trend removal was inconsistent. For Tirzetta, the correlation remained significant even after accounting for first differences (r = 0.819; p = 0.024), whereas for Velgia, it lost significance (r = 0.233; p = 0.657), indicating that the original relationship was predominantly trend-driven. Therefore, we consider Tirzetta a confirmed example of the predictive value of search interest while interpreting the result for Velgia with caution. Taken together, these findings suggest that, in the context of the Russian market and using Russian-language Yandex.Wordstat data, search interest closely tracks pharmaceutical demand, moving predominantly contemporaneously with pharmacy sales (strongest association at lag 0), at least for brands in the early market entry phase. Because Yandex.Wordstat data are available in near-real time and at no cost, this finding may have direct practical relevance for regional procurement planning, manufacturers’ marketing strategies, and pharmacovigilance systems: monthly monitoring of search-query dynamics can serve as a timely concurrent indicator of demand for GLP-1RA drugs, especially where pharmacy-sales data are delayed or unavailable.
Of particular note is the observation regarding the “saturation effect” of information demand. For Semavic—a mature market leader for which public interest has already passed the phase of exponential growth—the correlation between search queries and sales was only moderate (r = 0.434; p = 0.210). At the same time, Semavic’s sales by value continued to grow (from 1539.8 million rubles in June 2025 to 2060.4 million rubles in March 2026; +33.8%), while search interest has plateaued (from 386,500 to 468,900 queries/month, +21.3%). In essence, this can be interpreted as the drug transitioning from the “active information-seeking” phase to the “habitual consumption” phase. Users no longer need extensive search-based “education” but are actually consuming the drug in increasing volumes.
Data from the DSM Group confirms that the shift in the GLP-1RA market from a highly concentrated to a competitive structure (HHI from 0.311 to 0.141), which we identified based on search interest, is accompanied by a similar structural shift in actual sales. Novo Nordisk’s exit from the Russian market and the subsequent granting of licenses to Russian manufacturers created conditions for the emergence and rapid growth of seven domestic semaglutide analogs and two tirzepatide products. As a result, ATC subgroup [A10B] became the main growth driver for the entire [A] (“Digestive Tract and Metabolism”) category with a growth rate of +68% in 2025, while Group [A] itself topped the retail ranking of level I ATC categories with a 20.6% share of the total commercial pharmaceutical market. For the first time in the history of the domestic pharmaceutical market, Semavic became the leading brand in the TOP-20 commercial segment, capturing a 1.0% share of the total retail market; its retail sales volume in 2025 grew by 190.1% compared to 2024. However, by April 2026, Semavic had been displaced from the top spot by Tirzetta, a tirzepatide-based product manufactured by Promomed Rus.
The combined market share of the four domestic GLP-1RA brands in the retail market rose from less than 1.1% in June 2025 to 4.40% in April 2026—more than a fourfold increase over 10 months. This structural transformation represents a case of rapid formation of a new pharmacotherapeutic cluster in the domestic retail market and confirms that the nonlinear exponential growth in search interest coincided with a structural inflection point marked by the mass entry of domestic analogs into the market.
Liraglutide preparations (Victoza, Saxenda) and Trulicity (dulaglutide) do not appear in the DSM Top 20 rankings for the commercial segment in 2025–2026, which is consistent with the information profile described above, namely a low share of search interest within the overall GLP-1RA structure. The marked predominance of instructional queries about Saxenda corresponds to its registered indication of “weight management.” The maximum commercial load for Trulicity, given the drug’s absence from the retail Top 20, can be interpreted as an indicator of limited availability of the drug in the pharmacy network and requires confirmation in future studies. Thus, two independent data sources—search queries and pharmacy sales—paint a consistent picture of the GLP-1RA pharmaceutical niche in the Russian Federation in 2025–2026.
The current study has several methodological advantages. First, the use of absolute search query values from Yandex.Wordstat, as opposed to the 100-point scale of Google Trends [50,51], allows for quantitative comparisons between drugs and time periods. Second, the long observation period (97 months) and the substantial volume of data (over 46 million queries) provide high statistical power for identifying long-term trends and structural shifts. Third, the combination of time series analysis (STL, Mann–Kendall test, PELT method), market concentration indices (HHI, Brand/Generic ratio), bigram and trigram analysis, TF-IDF weighting, semantic categorization, and clustering using the Levenshtein metric ensures the comprehensiveness of conclusions based on independent analytical approaches.
The generalizability of the results beyond Russia deserves separate discussion. The methodology itself is the universal element of the proposed approach. The use of absolute query volumes instead of a normalized scale, multilevel semantic analysis, and morphological normalization are, in principle, transferable to other morphologically rich non-English languages and to any search engine with an open application programming interface (API) for query analytics. Specific to this study are the quantitative indicators (shares of thematic categories, HHI values, growth rates) that reflect the characteristics of the Russian pharmaceutical market, the regulatory environment, and the Yandex audience. These cannot be directly extrapolated to Google users or to other countries. The behavior of Yandex and Google users likely differs in terms of demographic composition and search motivation, which further limits the direct transferability of quantitative results. Verifying this assumption would require a comparative cross-platform study.

3.1. Study Limitations

This study has several limitations that must be understood for the correct interpretation of the results. A key limitation is the use of a single search engine (Yandex). Although Yandex holds a dominant share of the Russian search market (~67% in 2024–2026) [33], extrapolating the results to users of Google and other search engines requires additional validation. Furthermore, search queries do not identify the user category (patient, doctor, pharmacist, marketer, researcher), which limits direct extrapolation to patient behavior. This limitation is common to infodemiology. The use of regular expressions inevitably leads to a trade-off between sensitivity and specificity.
Furthermore, search queries reflect informational interest and do not allow for direct inferences about the actual use, prescription, purchase, or consumption of medications. Assessing these aspects requires independent validation using pharmacy sales data. A high proportion of commercial queries indicates interest in purchasing but does not confirm actual purchase. The semantic analysis was performed on data from a single month (April 2026), which limits conclusions about the temporal stability of semantic signatures; the April data may skew estimates toward “aesthetic-weight-related” motivation. A negative seasonality result does not rule out the presence of true seasonality of a less pronounced nature. For Tirzetta, a significant portion of the 2021–2023 period contains zero values, which technically limits the accuracy of the STL decomposition and seasonal indices. Given these limitations, comparing the data with independent sources (pharmacy sales, etc.) is a priority for further work.
An additional limitation is that Section 3 and the results of the semantic analysis did not consider separately the influence of external information triggers, such as media publications and reports, advertising campaigns, and mentions by celebrities, which, according to the international literature, can cause sharp, short-term spikes in search interest regardless of changes in clinical practice. No quantitative identification of such spikes was performed in the Yandex.Wordstat data, and this has been identified as an area for further research. The demographic composition of the Yandex audience (specifically, the ratio of urban to rural populations, age structure, and internet penetration rates by region) was not available for assessment at the level of individual search queries, which limits the ability to assess the representativeness of the obtained data for the entire adult population of the country, rather than just for active internet users. The one-time nature of the semantic analysis (April 2026) is due to the fact that it is technically impossible to retrospectively obtain the exact wording of search queries for earlier months, since the Yandex.Wordstat interface provides a breakdown of a query into specific phrases only for the current period (at the time of the query) and does not maintain an archive of search query phrases from previous months. Only aggregated volumes for the keyword as a whole are available on a monthly basis but not their semantic structure. We checked whether April 2026 was anomalous in terms of volume relative to the individual growth trajectories of each of the four key drugs: the z-score deviation from the average for the preceding 12 months was −0.05 (Ozempic), −1.52 (Saxenda), +2.61 (Tirzetta), and +0.02 (Trulicity); that is, for three of the four drugs, April’s volume falls within the range of normal annual variability, and the elevated value for Tirzetta is fully consistent with its phase of rapid growth rather than a one-time surge in media coverage. Nevertheless, the semantic structure (and not just the volume) may have changed over time, and this remains a limitation requiring prospective, multi-month data collection in future studies. The “No data” cells in Table 8 and Table 9 indicate that the corresponding metric had not been published in the DSM Group’s public reports at the time of their compilation; when calculating correlations, such months were excluded in pairs. It cannot be ruled out that the absence of data for certain months is partly non-random and related to sales volumes falling below the threshold for inclusion in the DSM Group’s published rankings, which could introduce a systematic bias toward overestimating the strength of the association for months with already sufficiently high sales. It was impossible to verify this in the present study without access to DSM Group’s non-public data; this is noted as a limitation on the interpretation of the correlation results and will be the subject of further research. For the same reason, despite Ozempic’s central role in the semantic analysis, independent pharmacy validation is not available, as the drug is not included in DSM Group reports following the manufacturer’s withdrawal from the Russian market. Accordingly, the correlation analysis with sales in this study applies only to the four new domestic brands, while the conclusions regarding Ozempic remain descriptive and based exclusively on search interest data.

3.2. Future Directions

Promising areas for future research include validating the obtained data against actual pharmacy sales, drug procurement data, and registries of the Russian Federal Service for Surveillance in Healthcare (Roszdravnadzor). Another promising direction is the application of machine learning models for the Russian language to perform comprehensive semantic and thematic analysis, including the detection of hidden clusters and emotional tone. Additionally, a cross-platform comparison of Yandex with Google and Russian messaging apps is of interest, and geographic segmentation of queries will also be of interest. Integration with pharmacovigilance systems is also relevant for assessing the predictive value of search signals regarding emerging adverse reactions. Extending the observation period for seasonal analysis to 8–10 annual cycles to achieve adequate statistical power is another important direction.

4. Materials and Methods

4.1. Study Design

We conducted an observational, retrospective, analytical study of search interest data from the Yandex search engine. This study was based on the general principles of infodemiology and relevant elements of existing guidelines. This study complies with the STROBE guidelines for observational epidemiological studies [52,53] and the methodological guide for conducting infodemiological studies using Google Trends [31].

4.2. Data Source and Drug Selection

The primary data source was Yandex.Wordstat (Yandex LLC, Moscow, Russia) [34], an open search interest analytics service. For each drug, monthly time series of absolute search query counts were extracted for the period from March 2018 to March 2026 (97 months), along with a complete list of unique query phrases and their corresponding volumes for April 2026. The analysis included 27 INNs and brand names of drugs in the GLP-1 receptor agonists/incretin-based therapies group (Table 10). The inclusion criteria for INNs and brand names were their classification within the pharmacotherapeutic group of GLP-1 receptor agonists and dual GIP/GLP-1 receptor agonists, as well as their registration and/or actual availability for sale on the Russian market (or, for the originator drug Ozempic, prior availability before the manufacturer’s withdrawal) during the analysis period (March 2018–March 2026). The list was compiled based on the Russian State Register of Medicines and retail audit data from the DSM Group.
The procedure for extracting data from Yandex.Wordstat consisted of the following steps. Step 1. For each product name, a search query was generated in the Wordstat service [34], with the search query trends recorded manually by month for the entire observation period (March 2018–March 2026). Step 2. For April 2026, a complete list of search phrases associated with the query was additionally downloaded, along with their individual search volumes (“Searches with Words,” standard sections of the Wordstat interface). Step 3. The downloaded data was checked for completeness (no missing months) and correct date formatting. Preprocessing included removing service rows (totals, legends), excluding duplicate phrases and phrases with zero volume, and filtering out uninformative common words that could artificially inflate the frequency of certain categories.
The monthly time series cover March 2018 through March 2026 (97 months; for seasonality analysis, the subperiod is 2021–2025). The semantic analysis and comparison with DSM Group data use a snapshot from April 2026; that is, they are cross-sectional relative to that date rather than part of the monthly time series. The dictionary of thematic categories and the regular expressions used for normalization are presented in the Supplementary Materials (Tables S4 and S5).

4.3. Analysis of Time Series and Market Structure

For each drug, volume indicators were calculated (total, mean, median, maximum, and growth rate). Trends were assessed using linear regression, Pearson and Spearman correlations with a time index, and the nonparametric Mann–Kendall test. Structural breaks points of were identified using the PELT (Pruned Exact Linear Time) method. Market concentration was assessed using the Herfindahl–Hirschman Index (HHI), calculated as the sum of the squares of the shares of drug requests for each calendar year: HHI = Σ si2, where si is the share of drug i in the total annual volume. The HHI was interpreted on a scale normalized to 1.0: values below 0.15 indicate a competitive market, values between 0.15 and 0.25 indicate a moderately concentrated market, and values above 0.25 indicate a highly concentrated market [37,38,39]. HHI thresholds were developed to analyze the concentration of market shares in terms of sales or revenue. Applying these thresholds to the structure of search (information) demand constitutes a methodological analogy, not an exact equivalence. In this study, the HHI is used as a descriptive index of the concentration of users’ information interest, rather than as an indicator of pharmaceutical market concentration in the antitrust sense; the limitations of this analogy are discussed in the Limitations Section. Additionally, the brand/generic ratio was calculated using annual samples. A correlation analysis of time series was performed for the top 5 drugs, with Pearson’s and Spearman’s correlation coefficients calculated on both the original and logarithmic scales.

4.4. Seasonality Analysis

To assess seasonal patterns, regular monthly time series were formed with a frequency of 12 observations per year for the period 2021–2025 (60 months). Prior to analysis, the data were checked for correct dates, missing months, duplicates, and negative values. Seasonality was analyzed with mandatory removal of the long-term trend, since search interest in GLP-1RA was characterized by pronounced exponential growth capable of mimicking a seasonal effect when comparing raw monthly averages.
To decompose the time series into trend, seasonal, and residual components, we applied STL decomposition [54,55,56] on a logarithmic scale (log1p(volume)) with robust fitting and a periodic seasonal window. Seasonal indices were calculated as the ratio of observed values to the trend component. Peak and trough months were determined based on the maximum and minimum values of queries and the index. Seasonal strength was assessed using a variance criterion: seasonal strength = max(0, 1 − Var(remainder)/Var (seasonal + remainder)), where values close to zero indicate the absence of or weak seasonality, while higher values indicate pronounced recurring seasonality. The statistical significance of the seasonal effect was assessed using linear regression and the nonparametric Kruskal–Wallis test. For all 27 drugs, a correction for multiple comparisons was performed using the Benjamini–Hochberg method (FDR), and the seasonal effect was considered statistically significant at an FDR-adjusted p < 0.05. Additionally, the achieved statistical power was calculated.

4.5. Semantic Analysis of Search Queries

A semantic analysis was performed on 4562 unique search query phrases (totaling 2,895,432 queries) for April 2026 across four search terms: Ozempic (2000 unique queries, 1,026,152 total queries), Saxenda (n = 320, 44,679 total queries), Tirzetta (n = 2000, 1,786,742 total queries), and Trulicity (n = 242, 37,859 total queries). Five complementary methods were applied, including frequency bigram analysis, frequency trigram analysis, keyword-based categorization, TF-IDF weighting, and normalization of morphological variants [57,58,59,60,61,62,63].

4.5.1. Frequency Bigram Analysis

After normalizing each query, all consecutive word pairs (bigrams) were extracted using sliding window method that moved through the text from beginning to end in one-word increments. For each resulting bigram, three metrics were determined: the number of unique query formulations in which it appeared, the total weighted volume of queries, and the rank by frequency. To avoid artificially inflating the frequency, each bigram was counted no more than once within a single formulation. The analysis was conducted in two variants—with and without informative stopwords (“how,” “for,” “or”)—to assess how these words influence the structure of the most frequent word combinations.

4.5.2. Frequency Trigram Analysis

Trigrams (sequences of three consecutive words) were derived from normalized queries using the same sliding window method as for bigrams but with a window width of three words. The same metrics were calculated as for bigrams. The trigram analysis served as a refinement tool. It allowed for a more precise determination of user intent, since three words often indicate a specific context, such as a specific dosage, a direct drug comparison, or the method of administration.

4.5.3. Thematic Categorization (Keyword-Based)

To systematize search queries, a classification of 10–13 thematic categories was developed. The number of categories varied depending on the drug. Each category corresponded to one of the main information queries from users: “core_brand” (brand core), “commercial” (commercial queries—price, purchase, availability), “weight_loss” (weight loss/body weight), “diabetes” (diabetes/glycemia), “side_effects_safety” (safety/side effects), “dosage_regimen” (dosage/administration regimen), “instruction_use” (instructions/use), “efficacy_reviews” (efficacy/reviews), “analogs_substitutes” (analogs/substitutes), “comparisons_glp1” (comparison with other GLP-1RAs), “availability” (availability), “price_reimbursement” (prescription/reimbursement), “generic” (INN). When compiling the dictionary, overly general single words (such as “medication,” “weight,” or “or”) were not used. Such words appear in queries on almost any topic, so including them in the rule would result in the same query being incorrectly counted in multiple categories at once, thereby artificially inflating their shares. Only topic-specific markers were included in the dictionary (for example, for the “weight loss” category—“weight loss,” “weight reduction,” and “excess weight” but not the standalone word “weight”). Two classification variants were applied. The first variant was multi-label, where a single query can belong to several categories simultaneously (sum of shares > 100%), reflecting the inherent ambiguity of search behavior. The second variant was primary, where each query was assigned a single dominant category according to a priority rule (sum of shares = 100%), used to calculate the structural shares. A priority rule was applied for primary classification. A specific thematic motif (e.g., “safety/side effects,” “diabetes,” “weight loss”) took priority over a commercial one (price, purchase/availability), and both took priority over the general umbrella category “brand essence/drug comparison.” For example, the query “Ozempic side effects buy” fell under the “safety/side effects” category rather than “purchase/availability,” while the query “Ozempic for weight loss price” fell under the “weight loss/body weight” category rather than “price,” since the specific topic takes precedence over the commercial one. Categorization was performed automatically using a fixed, predefined dictionary of regular expressions; therefore, the classification is deterministic and fully reproducible from the dictionary. The category dictionary and prioritization rule are provided in the Supplementary Materials (Table S4).

4.5.4. TF-IDF Weighting

To identify the most characteristic words in the corpus for each drug, the Term Frequency × Inverse Document Frequency (TF-IDF) score was calculated, reflecting the specificity of a word for a particular drug relative to the general background corpus of all GLP-1RAs.

4.5.5. Normalization of Morphological Variants

Russian is a highly inflected language in which the same noun can appear in multiple case forms (e.g., nominative, genitive, prepositional) with different endings, substantially inflating the number of unique query strings and fragmenting search volumes across lexical variants. To correct for this systematic underestimation, a two-component combined normalization procedure was applied. The first component, which makes the main contribution to the final normalization share, involves reducing the case and inflectional endings of the query’s content words to a common base (for example, “ozempika,” “ozempike,” and “ozempikom” are reduced to the form “ozempik”). The second component involves clustering brand/INN spellings based on the Levenshtein distance with a threshold of edit distance ≤ 2, designed to correct typos (e.g., “ozepmik” → “ozempik”). Both components standardize each query variant to a single canonical (dictionary) form, which allows for a correct assessment of the aggregate share of each topic. The robustness of the Levenshtein component to threshold selection and the risk of false merging with other analyzed brands have been tested separately.

4.6. Data Validation

To independently validate the patterns obtained from Yandex.Wordstat data, a comparative analysis was performed using aggregated data from the DSM Group’s pharmacy audit (DSM Group, monthly retail monitoring of the pharmaceutical market in the Russian Federation and the 2025 annual report) [64]. The data sources were the annual report “The Russian Pharmaceutical Market in 2025”; monthly reviews of the commercial segment of medicinal products for June–December 2025; monthly reviews for January–April 2026; DSM-Group-Pharma-market reviews for February, March, and April 2026, with a breakdown by Anatomical Therapeutic Chemical (ATC) group [A10] “Antidiabetics”.

4.7. Ethical Considerations

The study was conducted using fully anonymized aggregated data provided via open access by the Yandex.Wordstat service without identifying individual users. No personal data, identifiable medical information, or data on actual medical prescriptions or sales to specific individuals were used. In accordance with the provisions of the Declaration of Helsinki and national regulations governing the ethical review of biomedical research, working with such data did not require approval from a local ethics committee. This study used aggregated, anonymized data that does not allow for the direct or indirect identification of any individual. This study does not fall under the definition of personal data as set forth in Article 3 of Russian Federal law No 152-FZ of 27 July 2006 “On personal data”, which further justifies the lack of need for an ethics review for this study design. There are no conflicts of interest.

4.8. Software Environment

All processing steps were performed in R version 4.5.2 (Build 2026.04.0 + 526) (R Foundation for Statistical Computing, Vienna, Austria) [65] using the following packages readxl (version 1.5.0) [66], dplyr (version 1.2.1) [67], tidyr (version 1.3.2) [68], stringr (version 1.6.0) [69], openxlsx (version 4.2.8.1), writexl (version 1.5.4) [70,71], ggplot2 (version 4.0.3) [72], RColorBrewer (version 1.1-3) [73], scales (version 1.4.0) [74], forecast (version 9.0.2) [75], trend (version 1.1.7) [76], stringdist (version 0.9.17) [77], and tidytext (version 0.4.3) [78].

5. Conclusions

This eight-year retrospective digital pharmacoepidemiological study of the GLP-1 class, based on 46.05 million search queries from Russia’s largest search engine, yielded several key findings.
The information market for GLP-1 drugs in the Russian Federation has undergone a structural transformation from highly concentrated (HHI = 0.311 in 2018) to competitive (HHI = 0.141 in 2026), accompanied by exponential growth in total demand (a 215-fold increase in searches for the INN semaglutide over 97 months). The structural inflection point in growth (January 2021) coincides in time with the publication of the STEP 1 trial (February 2021) and the surrounding media coverage of the anticipated approval of Wegovy, whereas the U.S. FDA approval of semaglutide for obesity (June 2021) followed the break by five months. The high correlation between the time series for Ozempic and the most popular Russian analog, Semavic (r = 0.83, p < 0.001), may indicate consistency in users’ interest in the two drugs but does not constitute direct evidence of their pharmaceutical or clinical interchangeability.
A comparative semantic analysis of four key drug names (Ozempic, Saxenda, Tirzetta, Trulicity) revealed a structural discrepancy between the official approved indications and users’ information interests for two of the four names. The share of queries clearly related to T2D did not exceed 0.46% (range 0.07–0.38%), whereas the share of queries regarding weight loss ranged from 0.73% (Trulicity) to 13.91% (Ozempic). Saxenda is an exception: its official indication—“weight management”—aligns with a high proportion of weight loss queries (9.98%) and the highest proportion of instructional queries (23.18%). Four distinct semantic signatures were identified: brand-dominant (Ozempic), instruction-targeted and aligned with the indication (Saxenda), dose-commercial with comparative interest (Tirzetta), and instruction-commercial with dose-specific details (Trulicity).
Seasonality analysis did not confirm the presence of statistically significant seasonal fluctuations after adjustment for multiple comparisons for any of the drugs. The dominance of an exponential growth trend and the insufficient statistical power of the 60-month series limit the ability to reliably detect seasonal effects of small amplitude. This result demonstrates the importance of a rigorous statistical protocol in infodemiological research.
The methodological contribution of this study lies in demonstrating the need for grammatical normalization of queries in infodemiological research conducted in languages with complex morphology. In the Russian-language context, 56.3% of queries regarding the drug Ozempic require normalization of case endings and correction of typographical errors. The proposed normalization protocol can be recommended for infodemiological studies in other non-English-speaking markets.
The high correlation between search interest and pharmacy sales during a drug’s early market entry phase is most convincingly demonstrated for Tirzetta (r = 0.976, n = 8; the correlation persists even after adjusting for the trend (r = 0.819, p = 0.024)). For Velgia, the initially high correlation (r = 0.958) is largely due to the general upward trend in both data series. For Sejaro, the numerically higher correlation coefficient (r = 0.989) is based on only three months of observation (p = 0.093) and is not considered a standalone result. For a mature market leader (Semavic, registered in 2023), the correlation was moderate (r = 0.434), which can be interpreted as a saturation effect of information demand against the backdrop of continued sales growth.
The results obtained can be used by pharmacovigilance systems to monitor signals of inappropriate use, by manufacturers and pharmacy chains to forecast demand, and by clinical and educational institutions to study the population’s medical information needs. Further research should focus on validating search data by comparing them with pharmacy sales data, integrating digital pharmacoepidemiology tools into national pharmacovigilance systems, and extending the observation period to achieve adequate statistical power for seasonal analysis.

Supplementary Materials

The following supporting information can be downloaded at: https://www.mdpi.com/article/10.3390/pharma5030025/s1, Table S1: Seasonality strength, peak and trough months for Top GLP-1 drugs (2021–2025, log-STL decomposition with trend correction); Table S2: Comparison of absolute peak and trough months by number of queries; Table S3: Statistical tests for all 27 drugs; Table S4. Thematic-category dictionary used for keyword-based classification of search queries; Table S5. Normalization of spellings—canonical forms and collapsed variants for brand names, INNs, drug-class terms, and units.

Author Contributions

Conceptualization, A.K. and S.K.; methodology, A.K. and S.K.; validation, S.K. and A.K.; formal analysis, S.K.; resources, A.K. and S.K.; data curation, A.K. and S.K.; writing—original draft preparation, A.K. and S.K.; writing—review and editing, A.K. and S.K.; visualization, S.K. and A.K.; supervision, S.K.; project administration, S.K.; funding acquisition, S.K. and A.K. All authors have read and agreed to the published version of the manuscript.

Funding

This research received no external funding.

Institutional Review Board Statement

The primary data source was Yandex.Wordstat (Yandex LLC, Moscow, Russia), an open search interest analytics service. The use of data does not require Institutional Review Board Approval.

Informed Consent Statement

The primary data source was Yandex.Wordstat (Yandex LLC, Moscow, Russia), an open search interest analytics service. The use of data does not require any written informed consent from patients.

Data Availability Statement

All primary data underlying this study are publicly available and can be retrieved directly by any user. The monthly search-query volumes and the query formulations are openly accessible through the Yandex.Wordstat service (https://wordstat.yandex.ru) (accessed on 8 April 2026) for the keywords listed in Table 10, and the pharmacy-sales figures are taken from the publicly available DSM Group retail-audit reports (https://dsm.ru) (accessed on 5 May 2026). The complete thematic-category dictionary and the spelling-normalization rules (regular expressions and canonical forms) are provided in Supplementary Tables S4 and S5, and all software packages used are listed in Section 4.8. Additional data can be provided by the authors upon request.

Conflicts of Interest

The authors declare no conflicts of interest.

References

  1. Ding, Y.; Deng, A.; Qi, T.; Yu, H.; Wu, L.; Zhang, H. Burden of Type 2 Diabetes Due to High Body Mass Index in Different SDI Regions and Projections of Future Trends: Insights from the Global Burden of Disease 2021 Study. Diabetol. Metab. Syndr. 2025, 17, 23. [Google Scholar] [CrossRef] [Scilit] [PubMed]
  2. Huang, X.; Wu, Y.; Ni, Y.; Xu, H.; He, Y. Global, Regional, and National Burden of Type 2 Diabetes Mellitus Caused by High BMI from 1990 to 2021, and Forecasts to 2045: Analysis from the Global Burden of Disease Study 2021. Front. Public Health 2025, 13, 1515797. [Google Scholar] [CrossRef] [Scilit] [PubMed]
  3. Butt, M.D.; Ong, S.C.; Rafiq, A.; Kalam, M.N.; Sajjad, A.; Abdullah, M.; Malik, T.; Yaseen, F.; Babar, Z.-U.-D. A Systematic Review of the Economic Burden of Diabetes Mellitus: Contrasting Perspectives from High and Low Middle-Income Countries. J. Pharm. Policy Pract. 2024, 17, 2322107. [Google Scholar] [CrossRef] [Scilit] [PubMed]
  4. Yusenko, S.R.; Zubkova, T.S.; Sorokin, A.S.; Khaltourina, D.A. Obesity in Russia: Prevalence dynamics and sex and age structure since the end of the 20th century. Public Health 2024, 4, 17–29. [Google Scholar] [CrossRef] [Scilit]
  5. Dedov, I.; Shestakova, M.; Vikulova, O.; Zheleznyakova, A.; Isakov, M.; Sazonova, D.; Mokrysheva, N. Diabetes Mellitus in the Russian Federation: Dynamics of Epidemiological Indicators According to the Federal Register of Diabetes Mellitus for the Period 2010–2022. Diabetes Mellit. 2023, 26, 104–123. [Google Scholar] [CrossRef] [Scilit]
  6. Dedov, I.; Shestakova, M.; Mokrysheva, N.; Vikulova, O.; Zheleznyakova, A.; Shamkhalova, M.; Galstyan, G.; Korchuganova, E.; Isakov, M.; Serkov, A. Clinical and Epidemiological Analysis of Diabetes Mellitus Indicators in the Russian Federation, Updated January 1, 2026. Diabetes Mellit. 2026, 29, 104–136. [Google Scholar] [CrossRef] [Scilit]
  7. Genitsaridi, I.; Salpea, P.; Salim, A.; Sajjadi, S.F.; Tomic, D.; James, S.; Thirunavukkarasu, S.; Issaka, A.; Chen, L.; Basit, A.; et al. 11th Edition of the IDF Diabetes Atlas: Global, Regional, and National Diabetes Prevalence Estimates for 2024 and Projections for 2050. Lancet Diabetes Endocrinol. 2026, 14, 149–156. [Google Scholar] [CrossRef] [Scilit] [PubMed]
  8. Dedov, I.; Shestakova, M.; Benedetti, M.M.; Simon, D.; Pakhomov, I.; Galstyan, G. Prevalence of Type 2 Diabetes Mellitus (T2DM) in the Adult Russian Population (NATION Study). Diabetes Res. Clin. Pract. 2016, 115, 90–95. [Google Scholar] [CrossRef] [Scilit] [PubMed]
  9. Chamarthi, V.S.; Garg, C.; Daley, S.F. Obesity and Type 2 Diabetes. In StatPearls [Internet]; StatPearls Publishing: Treasure Island, FL, USA, 2025. [Google Scholar]
  10. Kholmatova, K.; Krettek, A.; Dvoryashina, I.V.; Malyutina, S.; Kudryavtsev, A.V. Assessing the Prevalence of Obesity in a Russian Adult Population by Six Indices and Their Associations with Hypertension, Diabetes Mellitus and Hypercholesterolaemia. Int. J. Circumpolar Health 2024, 83, 2386783. [Google Scholar] [CrossRef] [Scilit] [PubMed]
  11. Liu, Z.; Yu, S.; Jin, X.; Sheng, L.; YanMu, M.R.; Gao, J.; Lu, J.; Lei, T. The Clinical Application of GLP-1RAs and GLP-1/GIP Dual Receptor Agonists Based on Pharmacological Mechanisms: A Review. Drug Des. Dev. Ther. 2025, 19, 10383–10409. [Google Scholar] [CrossRef] [Scilit] [PubMed]
  12. American Diabetes Association Professional Practice Committee. 9. Pharmacologic Approaches to Glycemic Treatment: Standards of Care in Diabetes—2025. Diabetes Care 2024, 48, S181–S206. [Google Scholar] [CrossRef] [Scilit]
  13. Samson, S.L.; Vellanki, P.; Blonde, L.; Christofides, E.A.; Galindo, R.J.; Hirsch, I.B.; Isaacs, S.D.; Izuora, K.E.; Low Wang, C.C.; Twining, C.L.; et al. American Association of Clinical Endocrinology Consensus Statement: Comprehensive Type 2 Diabetes Management Algorithm—2023 Update. Endocr. Pract. 2023, 29, 305–340. [Google Scholar] [CrossRef] [Scilit] [PubMed]
  14. Liu, Q.K. Mechanisms of Action and Therapeutic Applications of GLP-1 and Dual GIP/GLP-1 Receptor Agonists. Front. Endocrinol. 2024, 15, 1431292. [Google Scholar] [CrossRef] [Scilit] [PubMed]
  15. Wilding, J.P.H.; Batterham, R.L.; Calanna, S.; Davies, M.; Van Gaal, L.F.; Lingvay, I.; McGowan, B.M.; Rosenstock, J.; Tran, M.T.; Wadden, T.A.; et al. Once-Weekly Semaglutide in Adults with Overweight or Obesity. N. Engl. J. Med. 2021, 384, 989–1002. [Google Scholar] [CrossRef] [Scilit] [PubMed]
  16. Jastreboff, A.M.; Aronne, L.J.; Ahmad, N.N.; Wharton, S.; Connery, L.; Alves, B.; Kiyosue, A.; Zhang, S.; Liu, B.; Bunck, M.C.; et al. Tirzepatide Once Weekly for the Treatment of Obesity. N. Engl. J. Med. 2022, 387, 205–216. [Google Scholar] [CrossRef] [Scilit] [PubMed]
  17. American Diabetes Association Professional Practice Committee for Diabetes. Summary of Revisions: Standards of Care in Diabetes—2026. Diabetes Care 2025, 49, S6–S12. [Google Scholar] [CrossRef] [Scilit] [PubMed]
  18. Aronne, L.J.; Horn, D.B.; le Roux, C.W.; Ho, W.; Falcon, B.L.; Valderas, E.G.; Das, S.; Lee, C.J.; Glass, L.C.; Senyucel, C.; et al. Tirzepatide as Compared with Semaglutide for the Treatment of Obesity. N. Engl. J. Med. 2025, 393, 26–36. [Google Scholar] [CrossRef] [Scilit] [PubMed]
  19. Lincoff, A.M.; Brown-Frandsen, K.; Colhoun, H.M.; Deanfield, J.; Emerson, S.S.; Esbjerg, S.; Hardt-Lindberg, S.; Hovingh, G.K.; Kahn, S.E.; Kushner, R.F.; et al. Semaglutide and Cardiovascular Outcomes in Obesity without Diabetes. N. Engl. J. Med. 2023, 389, 2221–2232. [Google Scholar] [CrossRef] [Scilit] [PubMed]
  20. Watanabe, J.H.; Kwon, J.; Nan, B.; Reikes, A. Trends in Glucagon-like Peptide 1 Receptor Agonist Use, 2014 to 2022. J. Am. Pharm. Assoc. 2024, 64, 133–138. [Google Scholar] [CrossRef] [Scilit] [PubMed]
  21. Han, S.H.; Safeek, R.; Ockerman, K.; Trieu, N.; Mars, P.; Klenke, A.; Furnas, H.; Sorice-Virk, S. Public Interest in the Off-Label Use of Glucagon-like Peptide 1 Agonists (Ozempic) for Cosmetic Weight Loss: A Google Trends Analysis. Aesthet. Surg. J. 2023, 44, 60–67. [Google Scholar] [CrossRef] [Scilit] [PubMed]
  22. Raubenheimer, J.E.; Myburgh, P.H.; Bhagavathula, A.S. Sweetening the Deal: An Infodemiological Study of Worldwide Interest in Semaglutide Using Google Trends Extended for Health Application Programming Interface. BMC Glob. Public Health 2024, 2, 63. [Google Scholar] [CrossRef] [Scilit] [PubMed]
  23. Butuca, A.; Dobrea, C.M.; Arseniu, A.M.; Frum, A.; Chis, A.A.; Rus, L.L.; Ghibu, S.; Juncan, A.M.; Muntean, A.C.; Lazăr, A.E.; et al. An Assessment of Semaglutide Safety Based on Real World Data: From Popularity to Spontaneous Reporting in EudraVigilance Database. Biomedicines 2024, 12, 1124. [Google Scholar] [CrossRef] [Scilit] [PubMed]
  24. Campos-Rivera, P.A.; Alfaro-Ponce, B.; Ramírez-Pérez, M.; Bernal-Serrano, D.; Contreras-Loya, D.; Wirtz, V.J. Quality of Information and Social Norms in Spanish-Speaking TikTok Videos as Levers of Commercial Practices: The Case of Semaglutide. Soc. Sci. Med. 2025, 366, 117646. [Google Scholar] [CrossRef] [Scilit] [PubMed]
  25. Thomsen, R.W.; Mailhac, A.; Løhde, J.B.; Pottegård, A. Real-world Evidence on the Utilization, Clinical and Comparative Effectiveness, and Adverse Effects of Newer GLP-1RA-based Weight-loss Therapies. Diabetes Obes. Metab. 2025, 27, 66–88. [Google Scholar] [CrossRef] [Scilit] [PubMed]
  26. Medical Product Alert N°2/2024: Falsified OZEMPIC (Semaglutide). Available online: https://www.who.int/news/item/19-06-2024-medical-product-alert-n-2-2024--falsified-ozempic-(semaglutide) (accessed on 29 May 2026).
  27. McCarthy, A.D.; Durairaj, K.; Linneman-Heath, J.; Sajic, D.; Dacso, M.; Durkin, A. Rising Public Interest in Weight Loss Medications and Growing Awareness of Their Aesthetic Sequelae: An Infodemiologic Google Trends Analysis and Clinical Diagnostic Patterning. J. Cosmet. Dermatol. 2026, 25, e70670. [Google Scholar] [CrossRef] [Scilit] [PubMed]
  28. Eysenbach, G. Infodemiology and Infoveillance: Framework for an Emerging Set of Public Health Informatics Methods to Analyze Search, Communication and Publication Behavior on the Internet. J. Med. Internet Res. 2009, 11, e11. [Google Scholar] [CrossRef] [Scilit] [PubMed]
  29. Blankart, K.E.; Lichtenberg, F.R. Prevalence and Relationship with Health of Off-Label and Contraindicated Drug Use in the United States: A Cross-Sectional Study. J. Pharm. Policy Pract. 2025, 18, 2472221. [Google Scholar] [CrossRef] [Scilit] [PubMed]
  30. Schiffer, K.; Choi, Y.A.; Weng, C. Hierarchical Concept Relations Improve Detection of Off-Label Drug Use in Electronic Health Records Data. AMIA Jt. Summits Transl. Sci. Proc. 2023, 2023, 458–466. [Google Scholar] [PubMed]
  31. Mavragani, A.; Ochoa, G. Google Trends in Infodemiology and Infoveillance: Methodology Framework. JMIR Public Health Surveill. 2019, 5, e13439. [Google Scholar] [CrossRef] [Scilit] [PubMed]
  32. Dzaye, O.; Berning, P.; Razavi, A.C.; Adhikari, R.; Jha, K.; Nasir, K.; Ayers, J.W.; Mortensen, M.B.; Blaha, M.J. Online Searches for SGLT-2 Inhibitors and GLP-1 Receptor Agonists Correlate with Prescription Rates in the United States: An Infodemiological Study. Front. Cardiovasc. Med. 2022, 9, 936651. [Google Scholar] [CrossRef] [Scilit] [PubMed]
  33. Search Engine Market Share Russian Federation. Available online: https://gs.statcounter.com/search-engine-market-share/all/russian-federation (accessed on 29 May 2026).
  34. Yandex.Wordstat. Available online: https://wordstat.yandex.ru/ (accessed on 8 April 2026).
  35. Ryan, D.H.; Lingvay, I.; Deanfield, J.; Kahn, S.E.; Barros, E.; Burguera, B.; Colhoun, H.M.; Cercato, C.; Dicker, D.; Horn, D.B.; et al. Long-Term Weight Loss Effects of Semaglutide in Obesity without Diabetes in the SELECT Trial. Nat. Med. 2024, 30, 2049–2057. [Google Scholar] [CrossRef] [Scilit] [PubMed]
  36. Ng, C.D.; Divino, V.; Wang, J.; Toliver, J.C.; Buss, M. Real-World Weight Loss Observed With Semaglutide and Tirzepatide in Patients with Overweight or Obesity and Without Type 2 Diabetes (SHAPE). Adv. Ther. 2025, 42, 5468–5480. [Google Scholar] [CrossRef] [Scilit] [PubMed]
  37. Evren, A.; Tuna, E.; Ustaoglu, E.; Sahin, B. Some Dominance Indices to Determine Market Concentration. J. Appl. Stat. 2021, 48, 2755–2775. [Google Scholar] [CrossRef] [Scilit] [PubMed]
  38. Deng, C.; Pan, J. Hospital Competition and the Expenses for Treatments of Acute and Non-Acute Common Diseases: Evidence from China. BMC Health Serv. Res. 2019, 19, 739. [Google Scholar] [CrossRef] [Scilit] [PubMed]
  39. Kvålseth, T.O. Relationship between Concentration Ratio and Herfindahl-Hirschman Index: A Re-Examination Based on Majorization Theory. Heliyon 2018, 4, e00846. [Google Scholar] [CrossRef] [Scilit] [PubMed]
  40. Saxenda: Prescribing Information, Dosing, Adverse Effects, Analogues, and Drug Description: Solution for Subcutaneous Injection, 6 mg/mL. Available online: https://www.rlsnet.ru/drugs/saksenda-75258#pokazaniia (accessed on 3 June 2026).
  41. Tirzetta: Prescribing Information, Dosing, Adverse Effects, Analogs, and Drug Description: Solution for Subcutaneous Injection, 15 Mg. Available online: https://www.rlsnet.ru/drugs/tirzetta-91036 (accessed on 3 June 2026).
  42. Ozempic: Prescribing Information, Dosing, Adverse Effects, Analogs, and Drug Description: Solution for Subcutaneous Injection, 0.25/0.5 Mg/Dose. Available online: https://www.rlsnet.ru/drugs/ozempik-81517 (accessed on 3 June 2026).
  43. Trulicity: Prescribing Information, Dosing, Adverse Effects, Analogs, and Drug Description: Solution for Subcutaneous Injection, 1.5 Mg/0.5 mL. Available online: https://www.rlsnet.ru/drugs/trulisiti-77021 (accessed on 3 June 2026).
  44. Shareef, L.G.; Khalid, S.S.; Raheem, M.F.; Al-Hussainy, A.F.; Al-Khayyat, N.S.; Al Arajy, A.Z.; Noori, M.M.; Qasim, M.A.; Jasim, H.H. Population-Level Interest in Glucagon-Like Peptide-1 Receptor Agonists for Weight Loss Using Google Trends Statistics in a 12-Month Retrospective Analysis: An Infodemiology and Infoveillance Study. Cureus 2024, 16, e71569. [Google Scholar] [CrossRef] [Scilit] [PubMed]
  45. Momeni, P.; Laverghetta, G.; Ligatti, J.; Li, L. Topic and Sentiment Trends in Semaglutide Discussions on X: Subpopulation-Based Longitudinal Analysis. Online J. Public Health Inf. 2026, 18, e80660. [Google Scholar] [CrossRef] [Scilit] [PubMed]
  46. Mahase, E. GLP-1 Agonists: US Sees 700% Increase over Four Years in Number of Patients without Diabetes Starting Treatment. BMJ 2024, 386, q1645. [Google Scholar] [CrossRef] [Scilit] [PubMed]
  47. Berning, P.; Adhikari, R.; Schroer, A.E.; Jelwan, Y.A.; Razavi, A.C.; Blaha, M.J.; Dzaye, O. Longitudinal Analysis of Obesity Drug Use and Public Awareness. JAMA Netw. Open 2025, 8, e2457232. [Google Scholar] [CrossRef] [Scilit] [PubMed]
  48. Lo, S.C.; Yeh, H.J. Acute Pancreatitis Associated With Semaglutide in a Patient With Multimorbidity: A Case Report. Cureus 2026, 18, e101908. [Google Scholar] [CrossRef] [Scilit] [PubMed]
  49. Pillarisetti, L.; Agrawal, D.K. Semaglutide: Double-Edged Sword with Risks and Benefits. Arch. Intern. Med. Res. 2025, 8, 1–13. [Google Scholar] [CrossRef] [Scilit] [PubMed]
  50. Walker, A.; Hopkins, C.; Surda, P. Use of Google Trends to Investigate Loss-of-smell–related Searches during the COVID-19 Outbreak. Int. Forum Allergy Rhinol. 2020, 10, 839–847. [Google Scholar] [CrossRef] [Scilit] [PubMed]
  51. Liu, K. The Measurement Errors of Google Trends Data. Discov. Data 2024, 2, 7. [Google Scholar] [CrossRef] [Scilit]
  52. von Elm, E.; Altman, D.G.; Egger, M.; Pocock, S.J.; Gøtzsche, P.C.; Vandenbroucke, J.P. Strengthening the Reporting of Observational Studies in Epidemiology (STROBE) Statement: Guidelines for Reporting Observational Studies. BMJ 2007, 335, 806–808. [Google Scholar] [CrossRef] [Scilit] [PubMed]
  53. Cuschieri, S. The STROBE Guidelines. Saudi J. Anaesth. 2019, 13, S31–S34. [Google Scholar] [CrossRef] [Scilit] [PubMed]
  54. Trull, O.; García-Díaz, J.C.; Peiró-Signes, A. Multiple Seasonal STL Decomposition with Discrete-Interval Moving Seasonalities. Appl. Math. Comput. 2022, 433, 127398. [Google Scholar] [CrossRef] [Scilit]
  55. Hu, S.; Wang, Y.; Cai, W.; Yu, Y.; Chen, C.; Yang, J.; Zhao, Y.; Gao, Y. A Combined Method for Short-Term Load Forecasting Considering the Characteristics of Components of Seasonal and Trend Decomposition Using Local Regression. Appl. Sci. 2024, 14, 2286. [Google Scholar] [CrossRef] [Scilit]
  56. Seto, H.; Toki, H.; Kitora, S.; Oyama, A.; Yamamoto, R. Seasonal Variations of the Prevalence of Metabolic Syndrome and Its Markers Using Big-Data of Health Check-Ups. Environ. Health Prev. Med. 2024, 29, 2. [Google Scholar] [CrossRef] [Scilit] [PubMed]
  57. Poomagal, S.; Malar, B.; Ranganayaki, E.M.; Deepika, K.; Dheepak, G. Sentiment Thesaurus, Synset and Word2Vec Based Improvement in Bigram Model for Classifying Product Reviews. SN Comput. Sci. 2022, 3, 422. [Google Scholar] [CrossRef] [Scilit] [PubMed]
  58. Juluru, K.; Shih, H.-H.; Keshava Murthy, K.N.; Elnajjar, P. Bag-of-Words Technique in Natural Language Processing: A Primer for Radiologists. Radiographics 2021, 41, 1420–1426. [Google Scholar] [CrossRef] [Scilit] [PubMed]
  59. Albalawi, R.; Yeap, T.H.; Benyoucef, M. Using Topic Modeling Methods for Short-Text Data: A Comparative Analysis. Front. Artif. Intell. 2020, 3, 42. [Google Scholar] [CrossRef] [Scilit] [PubMed]
  60. Lavin, M.J. Analyzing Documents with TF-IDF. Program. Hist. 2019. [Google Scholar] [CrossRef] [Scilit]
  61. Kapusta, J.; Drlik, M.; Munk, M. Using of N-Grams from Morphological Tags for Fake News Classification. PeerJ Comput. Sci. 2021, 7, e624. [Google Scholar] [CrossRef] [Scilit] [PubMed]
  62. Yu, X.; Chen, X.; Yan, X.; Wu, X.; Zhang, Y.; Luo, X.; Ma, W.; Fu, H.; Zhang, Y. Research on Strategies for Enhancing Drug Knowledge Dissemination on Chinese Social Media WeChat Public Accounts Based on Text Mining Technology. Front. Pharmacol. 2025, 16, 1569863. [Google Scholar] [CrossRef] [Scilit] [PubMed]
  63. Li, G.; Li, B.; Huang, L.; Hou, S. Automatic Construction of a Depression-Domain Lexicon Based on Microblogs: Text Mining Study. JMIR Med. Inf. 2020, 8, e17650. [Google Scholar] [CrossRef] [Scilit] [PubMed]
  64. DSM Group—Pharmaceutical Market Analytics. Available online: https://dsm.ru/news-reports/ (accessed on 4 June 2026).
  65. R: The R Project for Statistical Computing. Available online: https://www.r-project.org/ (accessed on 9 June 2026).
  66. Wickham, H.; Bryan, J.; Posit, P.B.C.; Kalicinski, M.; Valery, K.; Leitienne, C.; Colbert, B.; Hoerl, D.; Miller, E. R Package, version 1.5.0. Readxl: Read Excel Files. CRAN (Comprehensive R Archive Network): Vienna, Austria, 2026.
  67. Wickham, H.; François, R.; Henry, L.; Müller, K.; Vaughan, D. R Package, version 1.2.1. PBC Dplyr: A Grammar of Data Manipulation. CRAN (Comprehensive R Archive Network): Vienna, Austria, 2026.
  68. Wickham, H.; Vaughan, D.; Girlich, M.; Ushey, K. R Package, version 1.3.2. PBC Tidyr: Tidy Messy Data. CRAN (Comprehensive R Archive Network): Vienna, Austria, 2025.
  69. Wickham, H. Stringr, version 1.6.0. Stringr: Simple, Consistent Wrappers for Common String Operations. CRAN (Comprehensive R Archive Network): Vienna, Austria, 2025.
  70. Ooms, J. Writexl, Version. 1.5.4. Writexl: Export Data Frames to Excel “xlsx” Format. CRAN (Comprehensive R Archive Network): Vienna, Austria, 2025.
  71. Schauberger, P.; Walker, A.; Braglia, L.; Sturm, J.; Garbuszus, J.M.; Barbone, J.M.; Zimmermann, D.; Kainhofer, R. R Package, version 4.2.8.1. Openxlsx: Read, Write and Edit Xlsx Files. CRAN (Comprehensive R Archive Network): Vienna, Austria, 2025.
  72. Wickham, H. Ggplot2, version 4.0.3. Elegant Graphics for Data Analysis. Springer: New York, NY, USA, 2016.
  73. Neuwirth, E. R Package, version 1.1-3. RColorBrewer: ColorBrewer Palettes. CRAN (Comprehensive R Archive Network): Vienna, Austria, 2022.
  74. Wickham, H.; Pedersen, T.L.; Seidel, D. R Package, version 1.4.0. Scales: Scale Functions for Visualization. CRAN (Comprehensive R Archive Network): Vienna, Austria, 2025.
  75. Hyndman, R.; Athanasopoulos, G.; Bergmeir, C.; Caceres, G.; Chhay, L.; O’Hara-Wild, M.; Petropoulos, F.; Razbash, S.; Wang, E.; Yasmeen, F. R Package, version 9.0.2. Forecast: Forecasting Functions for Time Series and Linear Models. CRAN (Comprehensive R Archive Network): Vienna, Austria, 2025.
  76. Pohlert, T. R Package, version 1.1.7. Trend: Non-Parametric Trend Tests and Change-Point Detection. CRAN (Comprehensive R Archive Network): Vienna, Austria, 2023.
  77. van der Loo, M. R Package, version 0.9.17. Stringdist: Approximate String Matching, Fuzzy Text Search, and String Distance Functions. CRAN (Comprehensive R Archive Network): Vienna, Austria, 2024.
  78. Silge, J.; Robinson, D. Tidytext: Text Mining and Analysis Using Tidy Data Principles in R. JOSS 2016, 1, 37. [Google Scholar] [CrossRef] [Scilit]
Figure 1. Top 20 GLP-1RA and GIP/GLP-1-Related Drug Search Terms by Cumulative Yandex.Wordstat Query Volume in Russia, March 2018–March 2026. Note: Bars show cumulative Yandex.Wordstat query volumes for the top 20 of 27 analyzed INNs and brand names. Labels indicate total query counts and the share of the overall 27-drug search volume. Abbreviations: GLP-1RA—glucagon-like peptide-1 receptor agonist; GIP—glucose-dependent insulinotropic polypeptide; INN—International Nonproprietary Name.
Pharmacoepidemiology 05 00025 g001
Figure 2. Dynamics of Yandex search-market concentration for GLP-1-related drugs by the Herfindahl–Hirschman Index, 2018–2026. Note: The line shows the Herfindahl–Hirschman Index (HHI), and the bars show the number of drugs with nonzero search volume. Shaded zones indicate a competitive market (HHI < 0.15), moderate concentration (0.15–0.25), and high concentration (HHI > 0.25) [37,38,39]; 2026 includes January–March only. * 2026 includes January–March only.
Pharmacoepidemiology 05 00025 g002
Figure 3. Distribution of peak and trough months in Yandex search interest for GLP-1-related drugs with reliable seasonal estimates (n = 9 of 27 series), 2021–2025. Note: Peak and trough months were defined using STL-derived seasonal indices after long-term trend correction. Only the nine drugs meeting the reliability criterion are shown. The 18 drugs flagged as “undetermined” are excluded. Peaks clustered in spring (most often March) and troughs in September; after FDR correction, no series reached statistical significance.
Pharmacoepidemiology 05 00025 g003
Figure 4. Correlation between Yandex.Wordstat search interest and DSM Group pharmacy sales for domestic GLP-1RA brands. Note: Blue circles indicate Pearson’s correlation coefficients, and red triangles indicate Spearman’s rank correlation coefficients; shaded zones show correlation strength. Red asterisks denote nominally significant Pearson correlations at p < 0.05.
Pharmacoepidemiology 05 00025 g004
Table 1. Top 10 GLP-1 drugs by total volume of search queries on Yandex, March 2018–March 2026 (97 months).
ProductTotal QueriesMonthly AverageMonthly MaximumGrowth Rate
Ozempic13,241,424136,510426,38814,767×
Semavic8,997,45692,757468,946— *
Semaglutide (INN)3,705,48238,201192,828215×
Saxenda3,230,21233,301103,0983.4×
Tirzetta2,875,12029,640482,666— *
Velgia2,837,23529,250278,905— *
Quinsenta2,582,99526,629148,231— *
Trulicity1,624,26016,745122,9851.4×
Liraglutide (INN)1,163,08611,99178,7410.4× **
Rybelsus1,156,63611,924128,727— *
* The drug entered the Russian market in 2022–2024; calculating the growth multiple from a zero baseline is irrelevant. ** Decline compared to the peak in 2018–2020.
Table 2. Top 10 bigrams in queries for Ozempic, April 2026.
No.BigramUnique PhrasesTotal Volume Dominant Category
1for weight loss219135,155Weight loss/body weight
2Ozempic for115101,688Brand core
3Ozempic reviews5952,469Reviews/effectiveness
4buy Ozempic14443,224Purchase/availability
5Ozempic price8141,898Price
6Ozempic instructions3731,903Instructions/use
7Ozempic alternative8631,063Alternatives/substitutes
8Ozempic equivalent2430,752Alternatives/substitutes
9Ozempic in9929,997Localization
10Ozempic medication5126,250Clarification
Table 3. Thematic categorization of queries about Ozempic, April 2026 (n unique = 2000, total volume = 1,026,152).
CategoryVolumeCategoryVolumeCategory
Brand Overview/Product Comparison1,026,152100.00639,35862.31
Weight Loss/Body Weight145,77114.21142,70513.91
Reviews/Effectiveness107,72210.50
Price86,8908.4751,7675.04
Purchase/Availability69,7056.7956,7445.53
Alternatives/Substitutes68,3026.6648,3724.71
Instructions/Dosage60,3475.8859,5645.80
Safety/Side Effects25,0352.4425,0352.44
Diabetes/Blood Sugar26070.2526070.25
Note: Multi-label—a single query may fall into multiple categories, with the total percentage exceeding 100%. Primary—each query is assigned a single dominant category (priority: specific topic > commercial > general), with the total percentage equaling 100%.
Table 4. Thematic categorization of queries about Saxenda, April 2026 (n unique = 320, total volume = 44,679).
CategoryVolume
(Multi-Label)
%
(Multi-Label)
Volume
(Primary)
%
(Primary)
Brand Core/Product Comparison (umbrella)44,679100.0021,40047.90
Instructions/Dosage10,35523.1810,35523.18
Price909920.3742509.51
Weight Loss/Body Weight681015.2444609.98
Reviews/Effectiveness679215.21
Purchase/Availability35047.8430456.82
Generics/Alternatives33127.4110422.33
Safety/Side Effects960.21960.21
Diabetes/Blood Sugar310.07310.07
Note: The % values for “multi-label” and ‘primary’ have been recalculated based on a corpus of 44,679 queries (excluding a service line of 44,679 characters separated by the algorithm). The share of the commercial group in the “multi-label” analysis is 28.21%.
Table 5. Thematic categorization of queries about Tirzetta, April 2026 (n unique = 2000, total volume = 1,786,742).
CategoryVolume
(Multi-Label)
%
(Multi-Label)
Volume
(Primary)
%
(Primary)
Brand Core/Product Comparison (umbrella)1,786,742100.001,244,74769.67
Purchase/Availability202,80311.35197,44411.05
Price162,4559.09115,5076.46
Reviews/Effectiveness151,7468.49
Instructions/Dosage147,6508.26147,6048.26
Weight Loss/Body Weight60,1263.3756,8393.18
Safety/Side Effects17,6830.9917,6830.99
Generics/Alternatives58110.3354770.31
Diabetes/Blood Sugar14410.0814410.08
Note: The trigram analysis revealed a distinct “dose signature”, 2.5/5/7.5 mg, as well as consistent comparative trigrams with other GLP-1 receptor agonists. The em-dash (—) is not missing data; it indicates that the category ("Reviews/Effectiveness") was not the primary (dominant) label for any query.
Table 6. In-depth thematic categorization of queries about Trulicity/dulaglutide, April 2026 (n unique = 242, total volume = 37,859).
CategoryVolume
(Multi-Label)
%
(Multi-Label)
Volume
(Primary)
%
(Primary)
Commercial Inquiries14,64338.68957125.28
Instructions/Usage11,01329.09917724.24
Brand Core771020.37771020.37
Dosage/Administration466912.33457212.08
Otheraa37809.98
Reviews/Effectiveness685418.1016504.36
Generics/Alternatives6191.646191.64
Availability6041.60bb
Weight Loss/Weight Management2780.732780.73
Comparison with Other GLP-1s1820.481820.48
Diabetes/Blood Sugar1690.451450.38
Safety/Side Effects1000.261000.26
Prescription/Benefits/Reimbursement590.16590.16
INN/dulaglutide160.04160.04
Note: For Trulicity, an adapted classification with 13 categories was used, reflecting the specific doses of 0.75 and 1.5 mg and the pen device. Multi-label—a query may belong to several categories (sum of shares > 100%); primary—each query is assigned one dominant category under the priority rule, so the primary shares sum to 100% (37,859 queries). a “Other” is a primary-only residual (fallback) category—queries matching no specific keyword are assigned to it only in the single-label pass; it has no counterpart in the multi-label scheme, hence “—”. b the em-dash denotes that the category was not the primary (dominant) label for any query (Availability queries were absorbed by the higher-priority “Commercial Inquiries” group); their genuine co-occurrence frequency is shown in the multi-label columns (604; 1.60%).
Table 7. Comparison of primary shares of four key GLP-1RA search terms, April 2026 (% of total search volume).
CategoryOzempic (%)Saxenda (%)Tirzetta (%)Trulicity (%)
Brand Core/Drug Comparison (umbrella)62.3147.9069.6720.37
Instructions/Dosage Regimen5.8023.188.2624.24
Price5.049.516.46— *
Purchase/Availability5.536.8211.05— *
Commercial Inquiries (total)10.5716.3317.5125.28
Dosage/administration— **— **— **12.08
Weight loss/body weight13.919.983.180.73
Analogs/substitutes4.712.330.311.64
Comparison with other GLP-1s— ***— ***— ***0.51
Safety/side effects2.440.210.990.26
Diabetes/glycemia0.250.070.080.38
Reviews/effectiveness— **— **— **4.36
Note: Values in bold (“Commercial Inquiries (total)”) are the aggregated commercial subtotal (price + purchase/availability). * For Trulicity, “price” and “purchase/availability” are combined into the composite category “commercial queries”. ** In the standard scheme, these are not identified as separate primary categories; they are included within the core or commercial group. *** In the standard scheme, these are included in the “brand core/product comparison (umbrella)” category.
Table 8. Sales volume of GLP-1RA drugs in the Russian retail segment according to DSM Group data, 2025.
BrandINNManufacturerDate of Market LaunchSales Volume 2025
(Million Rubles)
Growth Compared to 2024
SemavicsemaglutideGeropharmRegistered in 202318,107+190.1%
TirzettatirzepatidePromomed RusFebruary 20256208.1new (market launch)
VelgiasemaglutidePromomed RusMarch 2025≈5900new (market launch)
SejarotirzepatideGeropharmMay 20252728.7new (market launch)
QuinsentasemaglutidePromomed RusRegistered in 2024No data *+67.5%
SemuglinsemaglutidePharmasyntezMarch 2025468.1new (market launch)
InsudivesemaglutidePSK PharmaUnder subsidy programs+1825.4%Under subsidy programs
OzempicsemaglutideNovo NordiskWithdrew from the marketNo data *not available in commercial retail
Note: Data from the DSM Group’s annual report “The Russian Pharmaceutical Market in 2025” and the DSM Group’s monthly retail audits for 2025. “No data” *—no publicly available data for this specific line item. Total sales of the INN semaglutide in 2025 amounted to 29.2 billion rubles (1st place in the VED ranking).
Table 9. Comparison of monthly trends in pharmacy sales (DSM Group, million rubles) and search interest (Yandex.Wordstat, thousand queries), June 2025–April 2026.
MonthSemavic: Sales, Million Rubles
(DSM Group)
Semavic: Search Queries, Thousand
(Yandex.Wordstat)
Tirzetta:
Sales, Million Rubles (DSM Group)
Tirzetta: Search Queries, Thousand
(Yandex.Wordstat)
Velgia: Sales, Million Rubles
(DSM Group)
Velgia: Search Queries, Thousand
(Yandex.Wordstat)
Sejaro: Sales, Million Rubles (DSM Group)Sejaro: Search Queries, Thousand
(Yandex.Wordstat)
June 20251539.8386.5No data126.3475.7172.5No data38.3
July 20251573.5425.2432.9153.9552.8168.1No data58.3
August 20251615.5419.3No data153.6619.1185.4No data72.3
September 20251598.6394.0727.2154.1No data173.7No data80.6
October 20251654.6432.6979.9232.6734.7191.2No data100.1
November 20251620.3432.41161.1244.9732.1215.3No data115.2
December 20251815.7366.31496.4260.4No data223.4No data114.3
January 20261554.3416.91566.6278.4852.2240.5731.6134.2
February 20261582.3394.71811.5326.2No data219.3870.5145.3
March 20262060.4468.92586.2482.71007.4278.91229.8214.5
April 20261918.9No data3100.4No data1045.1No data1504.3No data
Sum/Average for the Period18,533.9414.3 *13,862.2241.1 *6019.1208.7 *4336.2107.3 *
Note: “No data” indicates that no data is available from open sources for the corresponding month. Search queries refer to the total monthly number of searches on Yandex.Wordstat for the corresponding normalized form of the brand. *—Average across available months.
Table 10. List of INNs and brand names of GLP-1-class drugs included in the analysis.
International Nonproprietary Name (INN)Brand Names (Country of Registration/Manufacture)
SemaglutideOzempic (Denmark), Rybelsus (Denmark), Velgia (Russia), Quinsenta (Russia), Semavic (Russia), Insudive (Russia), Semuglin (Russia), Semaltara (Russia), Semvelika (Russia), Ameglutar (Russia), Deglunorm (Russia), Segluria (Russia), Selmiji (Russia)
LiraglutideVictoza (Denmark), Saxenda (Denmark), Enligria (Russia), Vesfol (Russia), Quinliro (Russia), Sugales (Russia), Melitid (Russia)
TirzepatideSejaro (Russia), Tirzetta (Russia)
DulaglutideTrulicity (Russia)
Note: A total of 27 INNs and brand names are included in the analysis for the period March 2018–March 2026 (97 months). In addition to brand names localized for the Russian market, the list includes Ozempic (Novo Nordisk, Denmark), which was not available on the Russian market at the time of the study. The inclusion of this drug reflects the actual supply structure of the Russian market, where the drug was physically available for sale and accounted for the bulk of search interest.
Disclaimer/Publisher’s Note: The statements, opinions and data contained in all publications are solely those of the individual author(s) and contributor(s) and not of MDPI and/or the editor(s). MDPI and/or the editor(s) disclaim responsibility for any injury to people or property resulting from any ideas, methods, instructions or products referred to in the content.