Communication

Effects of Congenital Adrenal Hyperplasia (CAH) and Biological Sex on Brain Size

1
Department of Women’s and Children’s Health, Uppsala University, 75237 Uppsala, Sweden
2
Swedish Collegium for Advanced Study (SCAS), 75238 Uppsala, Sweden
3
School of Psychology, University of Auckland, Auckland 1010, New Zealand
4
Laboratory of Neuro Imaging, School of Medicine, University of Southern California, Los Angeles, CA 90033, USA
5
Department of Neurology, Jena University Hospital, 07747 Jena, Germany
6
Department of Psychiatry and Psychotherapy, Jena University Hospital, 07747 Jena, Germany
7
Department of Psychology, University of Cambridge, Cambridge CB2 3RQ, UK
8
Department of Paediatrics, Addenbrooke’s Hospital, University of Cambridge, Cambridge CB2 0QQ, UK
9
Weston Centre for Paediatric Endocrinology & Diabetes, Addenbrooke’s Hospital, University of Cambridge, Cambridge CB2 0QQ, UK
10
Department of Endocrinology and Diabetes, University College Hospital London, London NW1 2BU, UK
11
Queen Elizabeth Hospital, Birmingham B15 2WB, UK
12
Department of Diagnostic and Interventional Radiology, Jena University Hospital, 07747 Jena, Germany
*
Author to whom correspondence should be addressed.
Anatomia 2024, 3(3), 155-162; https://doi.org/10.3390/anatomia3030012
Submission received: 15 April 2024 / Revised: 9 July 2024 / Accepted: 15 July 2024 / Published: 18 July 2024
(This article belongs to the Special Issue From Anatomy to Clinical Neurosciences)

Abstract

:
Congenital Adrenal Hyperplasia (CAH) has been reported to involve structural alterations in some brain regions. However, it remains to be established whether there is also an impact on the size of the brain as a whole. Here, we compiled the largest CAH sample to date (n = 53), matched pair-wise to a control group (n = 53) on sex, age, and verbal intelligence. Using T1-weighted brain scans, we calculated intracranial volume (ICV) as well as total brain volume (TBV), which are both common estimates for brain size. The statistical analysis was performed using a general linear model assessing the effects of CAH (CAH vs. controls), sex (women vs. men), and any CAH-by-sex interaction. The outcomes were comparable for ICV and TBV, i.e., there was no significant main effect of CAH and no significant CAH-by-sex interaction. However, there was a significant main effect of sex, with larger ICVs and TBVs in men than in women. Our findings contribute to an understudied field of research exploring brain anatomy in CAH. In contrast to some existing studies suggesting a smaller brain size in CAH, we did not observe such an effect. In other words, ICV and TBV in women and men with CAH did not differ significantly from those in controls. Notwithstanding, we observed the well-known sex difference in brain size (12.69% for ICV and 12.50% for TBV), with larger volumes in men than in women, which is in agreement with the existing literature.
Keywords:
androgens; CAH; MRI; ICV; sex; TBV

1. Introduction

Congenital Adrenal Hyperplasia (CAH) is a genetic disorder that affects the adrenal glands and involves alterations in glucocorticoids and androgens [1]. CAH has also been reported to be associated with structural changes in some brain regions [2,3]. However, it is not clear yet whether brain size per se is different in individuals with CAH.
Out of eleven CAH studies based on structural neuroimaging [2], at least four assessed brain size [1,4,5,6], measured as intracranial volume (ICV), total brain volume (TBV), or “total cerebral volume” (which resembles TBV). Two of these studies [4,5] seem to suggest that CAH is accompanied by a smaller brain size: The first study [4] examined TBV and included 27 children and adolescents with CAH (16 females/11 males) and 35 healthy controls (20 females/15 males), aged 8–18 years. The second study [5] examined ICV and included a larger and slightly older cohort, aged 16–33 years, consisting of 37 individuals with CAH (21 females/16 males) and 43 healthy controls (26 females/17 males). In contrast, the two other studies [1,6] measuring TBV (or “total cerebral volume”) in 19 women with CAH and 19 control women, aged 18–50 years [6], and in 27 children with CAH and 47 control children, aged 6–16 years [1], reported a lack of significant differences in brain size in CAH. Interestingly though, the latter study [1] observed a trend toward decreased cerebral volumes in girls with CAH compared to control girls but not in boys with CAH compared to control boys.
To further advance an understudied field of research we examined ICV as well as TBV in a large cohort of individuals with CAH. In addition to testing for a significant main effect of CAH and a significant CAH-by-sex interaction, we tested for a significant main effect of sex because prior research indicated smaller brain volumes in females than males, independent of CAH [7,8,9,10].

2. Materials and Methods

2.1. Study Sample

The sample consisted of 53 individuals (33 women and 20 men) with classic CAH [11], aged between 18 and 46 years (mean ± SD: 30.15 ± 7.92 years), and 53 controls (33 women and 20 men), aged between 18 and 45 years (mean ± SD: 30.34 ± 7.71 years). Of the 53 individuals with CAH, 29 presented with a salt-wasting phenotype and 18 with a simple virilizing phenotype; the remaining 6 individuals with CAH did not have information on the form of the condition. Individuals with CAH were pair-wise matched to controls with respect to sex, age, and education, as well as verbal skills (as a proxy for general intelligence), as determined using the Advanced Vocabulary Test [12]. All participants were required to be free from neurological or psychiatric disorders and to have no contraindications to magnetic resonance imaging (MRI). The study was approved by a National Health Service Research Ethics Committee and the Health Research Authority in the United Kingdom (15/EM/0532) as well as the Ethics Committee at the University of Auckland in New Zealand (020825). All participants provided their informed consent.

2.2. Image Acquisition and Processing

Structural T1-weighted images of the brain were acquired from each participant on a Siemens 3.0 Tesla Skyra system with a 32-channel head coil using the following parameters: TR = 2300 ms, TE = 2.98 ms, flip angle = 9°, matrix size = 256 × 240, 176 sagittal sections, and voxel size = 1 × 1 × 1 mm3. All brain images were processed via the CAT12 toolbox [13], version 12.6, and SPM12, version r7771, as detailed elsewhere [13,14,15,16]. More specifically, images were first denoised by a spatially adaptive non-local means filter [17], corrected for magnetic field inhomogeneities, and then skull-stripped [18]. This was followed by an adaptive maximum a posteriori tissue segmentation [19], which also included a partial volume estimation [20]. Finally, the resulting tissue segments, including gray matter (GM), white matter (WM), and cerebrospinal fluid (CSF), were used to calculate both ICV (GM + WM + CSF) and TBV (GM + WM).

2.3. Statistical Analysis

The statistical analysis was performed using a general linear model to assess the effects of CAH (CAH vs. controls), sex (female vs. male), and any CAH-by-sex interaction. ICV and TBV constituted the dependent variables, whereas CAH status, sex, and the CAH-by-sex interaction were the independent variables. Significance was established at p ≤ 0.05 using Monte Carlo simulations with 10,000 permutations to avoid relying on assumptions for parametric testing. In addition, we conducted supplementary analyses, separately for ICV and TBV, testing for a significant main effect of CAH or any CAH-by-sex interactions when splitting CAH by phenotype: salt-wasting form vs. simple virilizing form.

3. Results

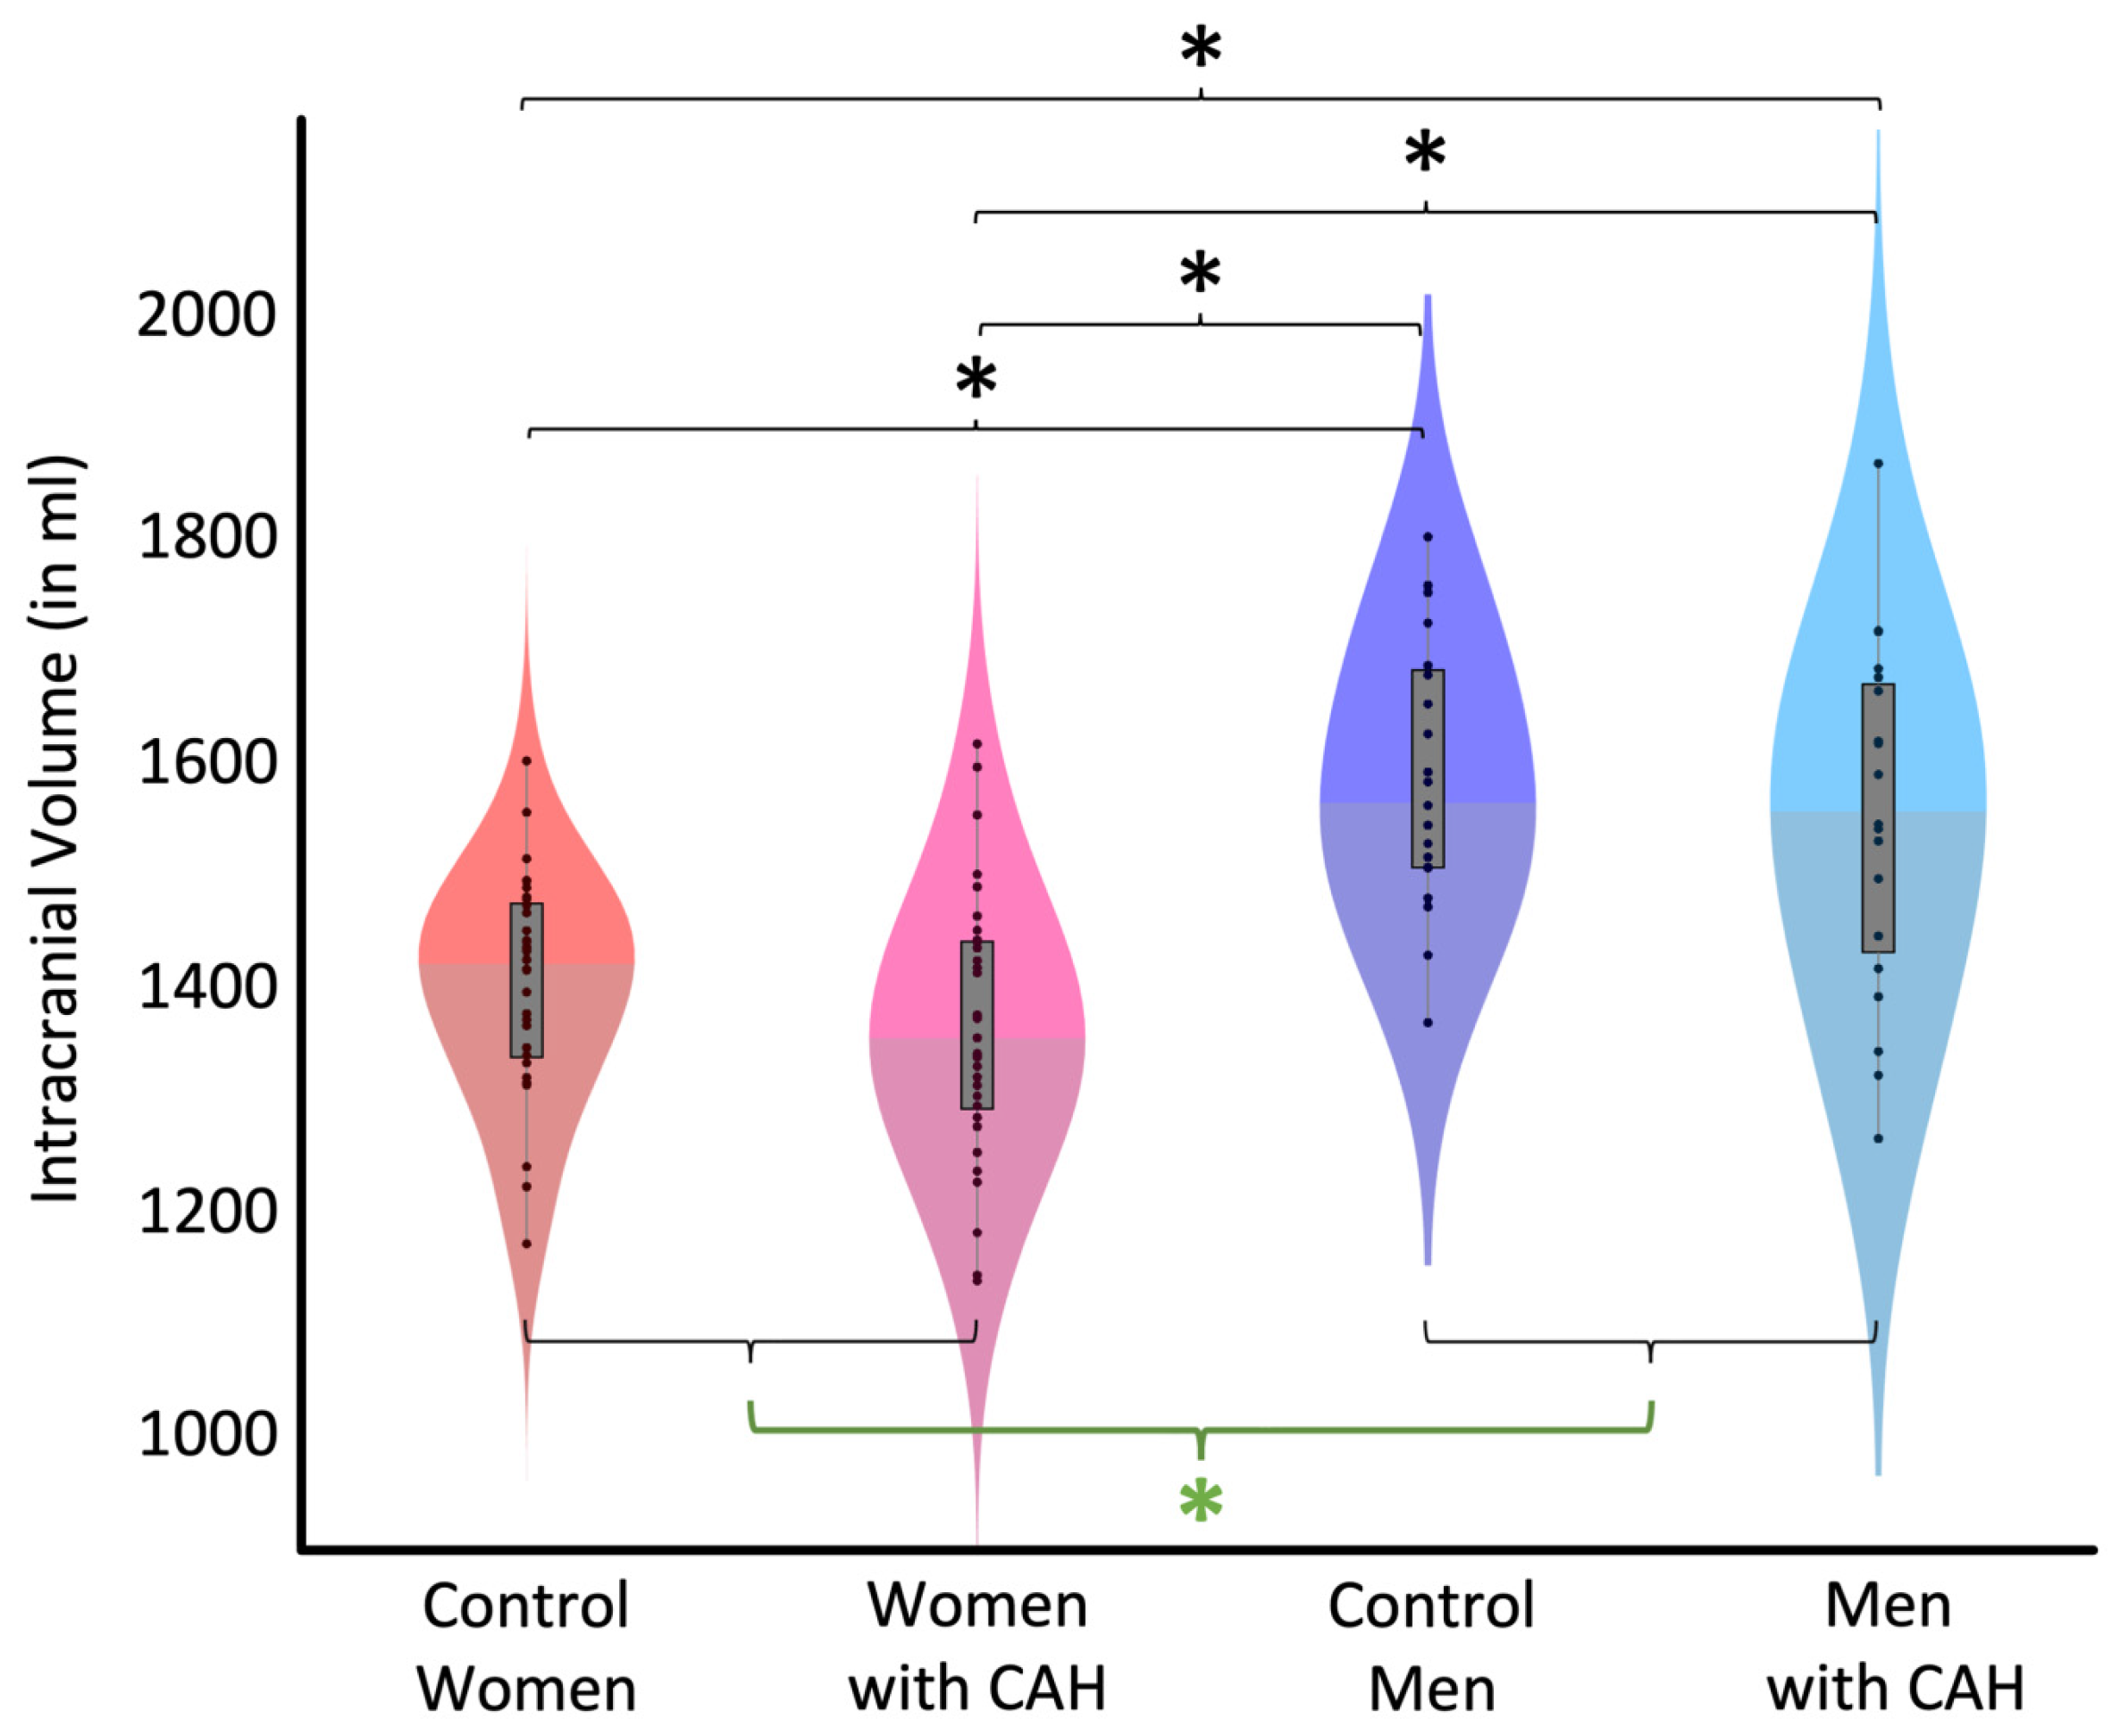
3.1. Intracranial Volume (ICV)

There was no significant CAH-by-sex interaction (p = 0.983; F(1,102) < 0.01) and also no significant main effect of CAH (p = 0.127; F(1,102) = 2.35). In contrast, there was a significant main effect of sex (p < 0.001; F(1,102) = 60.17), with larger ICVs in men compared to women. The magnitude of the sex difference was 12.69%. Table 1 provides group-specific means and standard deviations. Figure 1 illustrates the group-specific volumes and the significant group differences (main effect of sex as well as post hoc effects).
Given the lack of a significant CAH-by-sex interaction, post hoc tests were not required. Notwithstanding, their results are provided in Table 2 (for ICV) and in Table 4 (for TBV) to provide a reference against which findings can be compared in future studies.

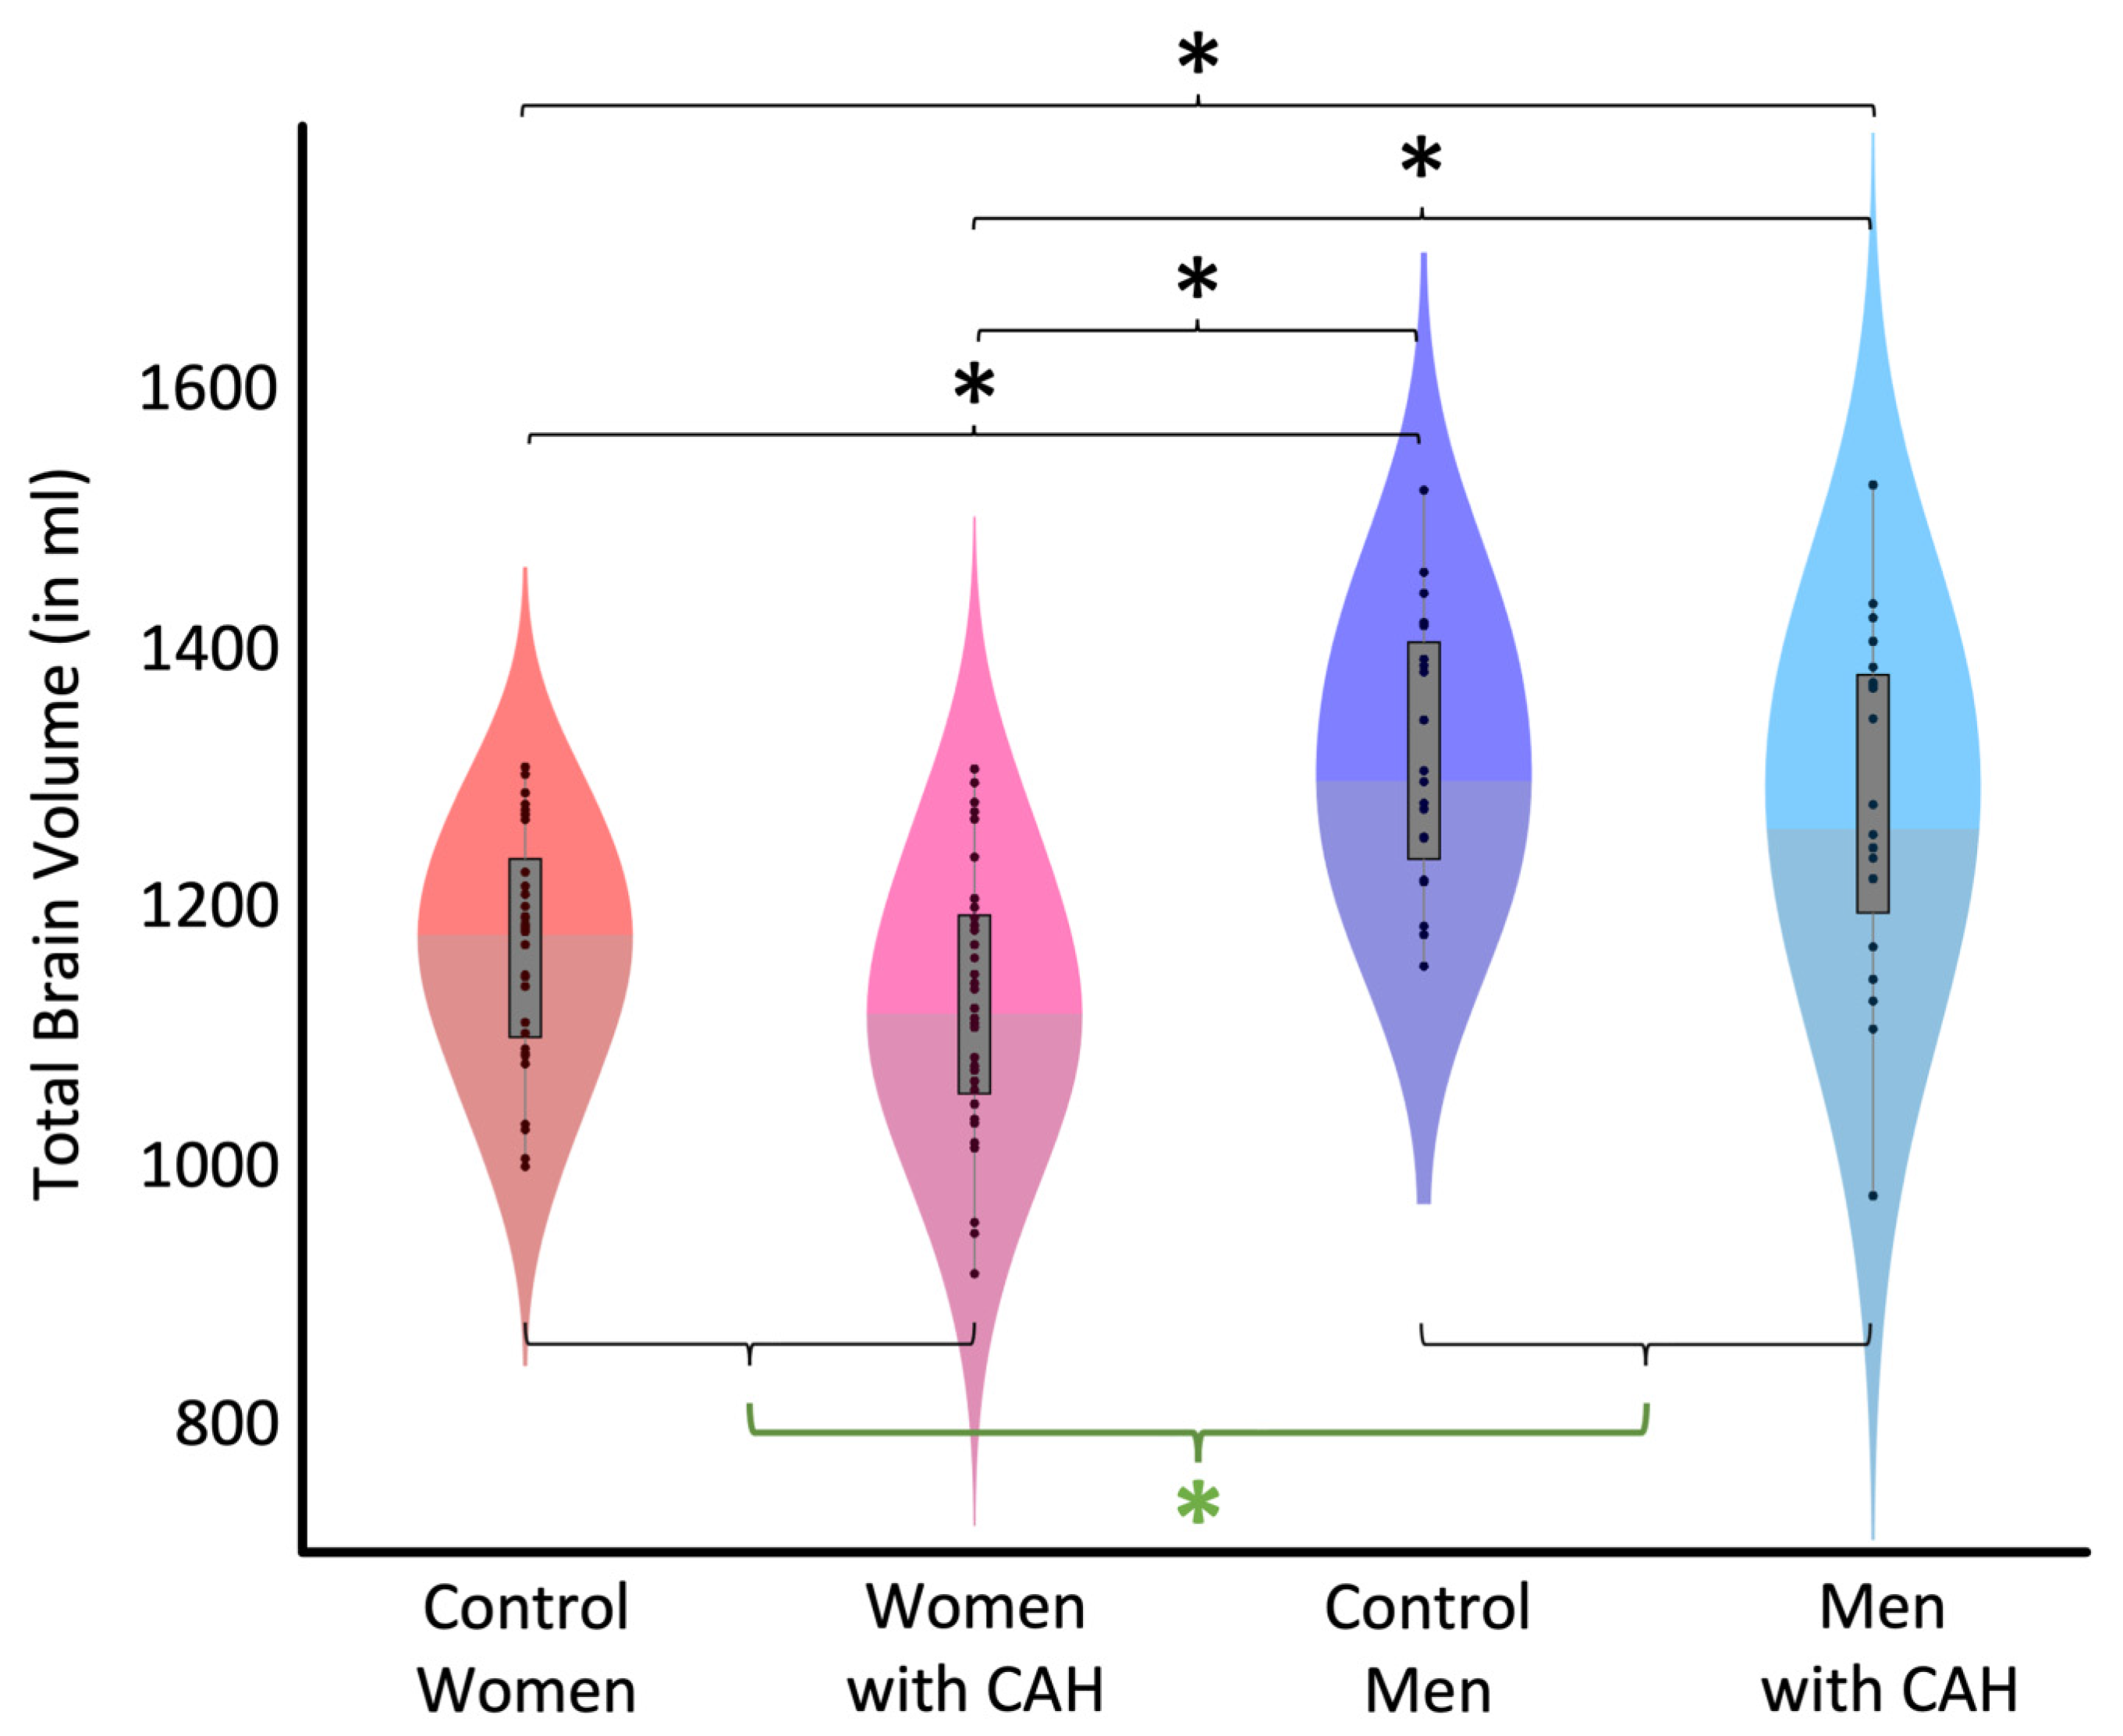
3.2. Total Brain Volume (TBV)

There was no significant CAH-by-sex interaction (p = 0.877 F(1,102) = 0.02) and also no significant main effect of CAH (p = 0.058; F(1,102) = 3.66). In contrast, there was a significant main effect of sex (p < 0.001; F(1,102) = 52.17), with larger TBVs in men compared to women. The magnitude of the sex difference was 12.5%. Table 3 provides group-specific means and standard deviations. Figure 2 illustrates the group-specific volumes and the significant group differences (main effect of sex as well as post hoc effects). Table 4 provides the statistics for the post hoc tests.

3.3. Supplementary Analyses (Effect of CAH Phenotype)

In accordance with the results reported above, there was no significant main effect of CAH (neither for ICV nor for TBV) when taking into account the CAH phenotype. In other words, there were no significant differences between individuals with the salt-wasting form and controls, between individuals with the simple virilizing form and controls, or between individuals with the salt-wasting form and individuals with the simple virilizing form. There was also no significant CAH-by-sex interaction.

4. Discussion

Our findings contribute to an understudied field of research exploring brain size—by means of ICV and TBV—in 53 individuals with CAH and 53 matched controls, the largest CAH sample to date. We did not detect a significant main effect of CAH or a CAH-by-sex interaction. However, we observed a significant main effect of sex.

4.1. No Significant CAH Effect

We did not detect a significant main effect of CAH. In other words, there were no differences in brain size between individuals with CAH and controls, which is in agreement with the outcomes of two other studies [1,6]. A significant main effect of CAH would suggest influences of CAH (e.g., endogenous decreases in glucocorticoids) and/or treatment of CAH (e.g., exogenous increases in glucocorticoids). Interestingly, there are two previous studies that reported a smaller ICV [4] or TBV [5] in CAH. However, the mean age in those latter two studies was considerably lower (12.8 years and 21.7 years, respectively) than in the present study (30.2 years). Thus, it is possible that any brain size deviations in CAH in earlier stages of life normalize later. However, more research is needed to confirm (or deny) if smaller brain sizes are typical for CAH in earlier stages of life at all. For example, in one of the aforementioned studies where brain size was not significantly reduced in children with CAH compared to control children [1], the mean age was even lower (9.8 years). Longitudinal developmental studies would be useful to provide more definitive information but do not exist (yet).

4.2. No Significant CAH-by-Sex Interaction

We did not detect a significant CAH-by-sex interaction. The presence of a CAH-by sex interaction (e.g., differences between women with CAH and control women, but not between men with CAH and control men) would suggest influences of increased prenatal androgens in female brains because classic CAH causes elevated androgen levels in females but not males [3]. While prenatal androgens or sex steroids in general, among other factors [21,22,23], have been proposed to play a significant role in determining (sexually dimorphic) brain features [24], their impact might be more enhanced on the regional level affecting certain brain structures (e.g., the amygdala) with a high density of sex steroid receptors [25], rather than brain size as a whole. Follow-up studies will further enhance this field of research by focusing on the volumes of selected brain regions or by exploring other brain features (e.g., local gray matter or cortical thickness) using morphometric measures that cover the entire brain/cortex with a high regional specificity (e.g., voxel-wise or vertex-wise).

4.3. Significant Sex Effect

We detected a significant main effect of sex effect, with larger brain sizes in men compared to women. The magnitude of the sex difference (12.69% for ICV and 12.50% for TBV) is comparable with what has been reported in the normative literature [8,26]. The observed effect suggests influences of genes located on the sex chromosomes, influences of sex steroids, or influences of the environment [22]. As discussed elsewhere [23], genes on the sex chromosomes are likely to contribute to the brain’s sexually dimorphic phenotype in two ways: directly by acting in the brain itself (differentiating XX and XY brain cells) and indirectly by acting on the gonads (regulating gonadal secretions that have sex-specific effects on the brain). Sex differences in global brain and tissue volumes are present already in neonates and infants [27,28]. So, in theory, genes and prenatal sex steroids may have an impact on brain size. However, given that the impact of sex steroids, specifically prenatal androgens, seems to be minute (as there were no differences between women with CAH and control women, see Section 4.2), genes might play the more dominant role in determining brain size, at least early in life [29,30]. Later in life, environmental influences (e.g., the differential effect of sex-specific social environments; see [22]) as well as postnatal sex steroids may exert additional effects. This is supported by studies reporting a widening of the sex difference over time for various brain measures, including brain size [31,32,33,34,35,36,37].

Author Contributions

Conceptualization, E.L. and M.H.; methodology, E.L., F.K., C.G. and M.H.; data acquisition, D.S., A.T., I.H., U.S., H.G. and M.H.; formal analysis, F.K. and E.L.; writing—original draft, E.L. and F.K.; writing—review and editing, E.L., C.G., D.S., A.T., I.H., U.S., H.G., M.H. and F.K.; funding acquisition, E.L. and M.H. All authors have read and agreed to the published version of the manuscript.

Funding

The study was funded by a grant from the Eunice Kennedy Shriver National Institute of Child Health & Human Development (NICHD) of the National Institutes of Health (NIH) to E.L. and M.H. (R01HD081720).

Institutional Review Board Statement

The study was conducted in accordance with the Declaration of Helsinki. Approval for the study was obtained from an NHS Research Ethics Committee and the Health Research Authority in the UK (REC reference 15/EM/0532) and from the University of Auckland Human Participants Ethics Committee in New Zealand (protocol number 020825).

Informed Consent Statement

Informed consent was obtained from all participants involved in the study.

Data Availability Statement

The data are not publicly available due to ethical restrictions imposed by the signed consent.

Acknowledgments

The research was supported by the NIHR Cambridge Biomedical Research Centre at the University of Cambridge (Cambridge, UK), the Centre for eResearch at the University of Auckland (Auckland, New Zealand), the Swedish Collegium for Advanced Study (Uppsala, Sweden), as well as the Erling-Persson Family Foundation. The authors are also grateful for the contributions of Carlo L. Acerini, who passed away before the completion of the study.

Conflicts of Interest

The authors declare no conflicts of interest. The funders had no role in the design of the study; in the collection, analyses, or interpretation of data; in the writing of the manuscript; or in the decision to publish the results.

References

  1. Merke, D.P.; Fields, J.D.; Keil, M.F.; Vaituzis, A.C.; Chrousos, G.P.; Giedd, J.N. Children with classic congenital adrenal hyperplasia have decreased amygdala volume: Potential prenatal and postnatal hormonal effects. J. Clin. Endocrinol. Metab. 2003, 88, 1760–1765. [Google Scholar] [CrossRef]
  2. Khalifeh, N.; Omary, A.; Cotter, D.L.; Kim, M.S.; Geffner, M.E.; Herting, M.M. Congenital Adrenal Hyperplasia and Brain Health: A Systematic Review of Structural, Functional, and Diffusion Magnetic Resonance Imaging (MRI) Investigations. J. Child. Neurol. 2022, 37, 758–783. [Google Scholar] [CrossRef]
  3. Beltz, A.M.; Demidenko, M.I.; Wilson, S.J.; Berenbaum, S.A. Prenatal androgen influences on the brain: A review, critique, and illustration of research on congenital adrenal hyperplasia. J. Neurosci. Res. 2023, 101, 563–574. [Google Scholar] [CrossRef]
  4. Herting, M.M.; Azad, A.; Kim, R.; Tyszka, J.M.; Geffner, M.E.; Kim, M.S. Brain Differences in the Prefrontal Cortex, Amygdala, and Hippocampus in Youth with Congenital Adrenal Hyperplasia. J. Clin. Endocrinol. Metab. 2020, 105, 1098–1111. [Google Scholar] [CrossRef]
  5. Van’t Westeinde, A.; Karlsson, L.; Thomsen Sandberg, M.; Nordenstrom, A.; Padilla, N.; Lajic, S. Altered Gray Matter Structure and White Matter Microstructure in Patients with Congenital Adrenal Hyperplasia: Relevance for Working Memory Performance. Cereb. Cortex 2020, 30, 2777–2788. [Google Scholar] [CrossRef]
  6. Webb, E.A.; Elliott, L.; Carlin, D.; Wilson, M.; Hall, K.; Netherton, J.; Reed, J.; Barrett, T.G.; Salwani, V.; Clayden, J.D.; et al. Quantitative Brain MRI in Congenital Adrenal Hyperplasia: In Vivo Assessment of the Cognitive and Structural Impact of Steroid Hormones. J. Clin. Endocrinol. Metab. 2018, 103, 1330–1341. [Google Scholar] [CrossRef]
  7. Luders, E.; Toga, A.W. Sex differences in brain anatomy. Prog. Brain Res. 2010, 186, 2–12. [Google Scholar]
  8. Luders, E.; Kurth, F. Structural differences between male and female brains. Handb. Clin. Neurol. 2020, 175, 3–11. [Google Scholar] [CrossRef]
  9. Salminen, L.E.; Tubi, M.A.; Bright, J.; Thomopoulos, S.I.; Wieand, A.; Thompson, P.M. Sex is a defining feature of neuroimaging phenotypes in major brain disorders. Hum. Brain Mapp. 2022, 43, 500–542. [Google Scholar] [CrossRef]
  10. Kaczkurkin, A.N.; Raznahan, A.; Satterthwaite, T.D. Sex differences in the developing brain: Insights from multimodal neuroimaging. Neuropsychopharmacol. Off. Publ. Am. Coll. Neuropsychopharmacol. 2019, 44, 71–85. [Google Scholar] [CrossRef]
  11. Merke, D.P.; Auchus, R.J. Congenital Adrenal Hyperplasia Due to 21-Hydroxylase Deficiency. N. Engl. J. Med. 2020, 383, 1248–1261. [Google Scholar] [CrossRef] [PubMed]
  12. Ekstrom, R.B.; French, J.W.; Harman, H.H.; Dermen, D. Manual for Kit of Factor Referenced Cognitive Tests; Educational Testing Service: Princeton, NJ, USA, 1976. [Google Scholar]
  13. Gaser, C.; Dahnke, R.; Thompson, P.M.; Kurth, F.; Luders, E. CAT—A Computational Anatomy Toolbox for the Analysis of Structural MRI Data. bioRxiv 2022. [Google Scholar] [CrossRef]
  14. Kurth, F.; Thompson, P.M.; Luders, E. Investigating the differential contributions of sex and brain size to gray matter asymmetry. Cortex 2018, 99, 235–242. [Google Scholar] [CrossRef] [PubMed]
  15. Luders, E.; Gaser, C.; Narr, K.L.; Toga, A.W. Why sex matters: Brain size independent differences in gray matter distributions between men and women. J. Neurosci. 2009, 29, 14265–14270. [Google Scholar] [CrossRef] [PubMed]
  16. Luders, E.; Kurth, F.; Gingnell, M.; Engman, J.; Yong, E.L.; Poromaa, I.S.; Gaser, C. From baby brain to mommy brain: Widespread gray matter gain after giving birth. Cortex A J. Devoted Study Nerv. Syst. Behav. 2020, 126, 334–342. [Google Scholar] [CrossRef] [PubMed]
  17. Manjon, J.V.; Coupe, P.; Marti-Bonmati, L.; Collins, D.L.; Robles, M. Adaptive non-local means denoising of MR images with spatially varying noise levels. J.Magn. Reson. Imaging 2010, 31, 192–203. [Google Scholar] [CrossRef] [PubMed]
  18. Ashburner, J.; Friston, K.J. Unified segmentation. Neuroimage 2005, 26, 839–851. [Google Scholar] [CrossRef] [PubMed]
  19. Rajapakse, J.C.; Giedd, J.N.; Rapoport, J.L. Statistical approach to segmentation of single-channel cerebral MR images. IEEE Trans. Med. Imaging 1997, 16, 176–186. [Google Scholar] [CrossRef]
  20. Tohka, J.; Zijdenbos, A.; Evans, A. Fast and robust parameter estimation for statistical partial volume models in brain MRI. Neuroimage 2004, 23, 84–97. [Google Scholar] [CrossRef]
  21. Arnold, A.P. The organizational-activational hypothesis as the foundation for a unified theory of sexual differentiation of all mammalian tissues. Horm. Behav. 2009, 55, 570–578. [Google Scholar] [CrossRef]
  22. McCarthy, M.M.; Arnold, A.P. Reframing sexual differentiation of the brain. Nat. Neurosci. 2011, 14, 677–683. [Google Scholar] [CrossRef]
  23. Arnold, A.P. Sex chromosomes and brain gender. Nat. Rev. Neurosci. 2004, 5, 701–708. [Google Scholar] [CrossRef]
  24. Phoenix, C.H.; Goy, R.W.; Gerall, A.A.; Young, W.C. Organizing action of prenatally administered testosterone propionate on the tissues mediating mating behavior in the female guinea pig. Endocrinology 1959, 65, 369–382. [Google Scholar] [CrossRef]
  25. Goldstein, J.M.; Seidman, L.J.; Horton, N.J.; Makris, N.; Kennedy, D.N.; Caviness, V.S., Jr.; Faraone, S.V.; Tsuang, M.T. Normal Sexual Dimorphism of the Adult Human Brain Assessed by In Vivo Magnetic Resonance Imaging. Cereb. Cortex 2001, 11, 490–497. [Google Scholar] [CrossRef]
  26. Hines, M. Neuroscience and Sex/Gender: Looking Back and Forward. J. Neurosci. 2020, 40, 37–43. [Google Scholar] [CrossRef]
  27. Gilmore, J.H.; Lin, W.; Prastawa, M.W.; Looney, C.B.; Vetsa, Y.S.; Knickmeyer, R.C.; Evans, D.D.; Smith, J.K.; Hamer, R.M.; Lieberman, J.A.; et al. Regional gray matter growth, sexual dimorphism, and cerebral asymmetry in the neonatal brain. J. Neurosci. 2007, 27, 1255–1260. [Google Scholar] [CrossRef]
  28. Benavides, A.; Metzger, A.; Tereshchenko, A.; Conrad, A.; Bell, E.F.; Spencer, J.; Ross-Sheehy, S.; Georgieff, M.; Magnotta, V.; Nopoulos, P. Sex-specific alterations in preterm brain. Pediatr. Res. 2019, 85, 55–62. [Google Scholar] [CrossRef]
  29. Carruth, L.L.; Reisert, I.; Arnold, A.P. Sex chromosome genes directly affect brain sexual differentiation. Nat. Neurosci. 2002, 5, 933–934. [Google Scholar] [CrossRef]
  30. De Vries, G.J.; Rissman, E.F.; Simerly, R.B.; Yang, L.Y.; Scordalakes, E.M.; Auger, C.J.; Swain, A.; Lovell-Badge, R.; Burgoyne, P.S.; Arnold, A.P. A model system for study of sex chromosome effects on sexually dimorphic neural and behavioral traits. J. Neurosci. 2002, 22, 9005–9014. [Google Scholar] [CrossRef]
  31. Giedd, J.N.; Raznahan, A.; Mills, K.L.; Lenroot, R.K. Review: Magnetic resonance imaging of male/female differences in human adolescent brain anatomy. Biol. Sex Differ. 2012, 3, 19. [Google Scholar] [CrossRef]
  32. Gur, R.E.; Gur, R.C. Sex differences in brain and behavior in adolescence: Findings from the Philadelphia Neurodevelopmental Cohort. Neurosci. Biobehav. Rev. 2016, 70, 159–170. [Google Scholar] [CrossRef] [PubMed]
  33. Herting, M.M.; Sowell, E.R. Puberty and structural brain development in humans. Front. Neuroendocrinol. 2017, 44, 122–137. [Google Scholar] [CrossRef] [PubMed]
  34. Vijayakumar, N.; Op de Macks, Z.; Shirtcliff, E.A.; Pfeifer, J.H. Puberty and the human brain: Insights into adolescent development. Neurosci. Biobehav. Rev. 2018, 92, 417–436. [Google Scholar] [CrossRef] [PubMed]
  35. Kurth, F.; Gaser, C.; Luders, E. Development of sex differences in the human brain. Cogn. Neurosci. 2021, 12, 155–162. [Google Scholar] [CrossRef] [PubMed]
  36. Chavarria, M.C.; Sanchez, F.J.; Chou, Y.Y.; Thompson, P.M.; Luders, E. Puberty in the corpus callosum. Neuroscience 2014, 265, 1–8. [Google Scholar] [CrossRef]
  37. Lenroot, R.K.; Gogtay, N.; Greenstein, D.K.; Wells, E.M.; Wallace, G.L.; Clasen, L.S.; Blumenthal, J.D.; Lerch, J.; Zijdenbos, A.P.; Evans, A.C.; et al. Sexual dimorphism of brain developmental trajectories during childhood and adolescence. Neuroimage 2007, 36, 1065–1073. [Google Scholar] [CrossRef]
Figure 1. Group-specific intracranial volume (ICV). The violin plots depict ICV for each of the four groups. The black dots show individual volume estimates, the gray boxes show the group-specific interquartile ranges, the whiskers show the group-specific 1.5 interquartile ranges, and the difference in shading indicates the median. The main effect of sex (green asterisk) was significant, with larger ICVs in all males (control men + men with CAH) compared to all females (control women + women with CAH). In addition, male and female subgroups differ significantly from each other (black asterisks).
Anatomia 03 00012 g001
Figure 2. Group-specific total brain volume (TBV). The violin plots depict TBV for each of the four groups. The black dots show individual volume estimates, the gray boxes show the group-specific interquartile ranges, the whiskers show the group-specific 1.5 interquartile ranges, and the difference in shading indicates the median. The main effect of sex (green asterisk) was significant, with larger TBVs in all males (control men + men with CAH) compared to all females (control women + women with CAH). In addition, male and female subgroups differ significantly from each other (black asterisks).
Anatomia 03 00012 g002
Table 1. Descriptive statistics for ICV (in mL): mean ± standard deviation.
Control WomenWomen
with CAH
Control
Men
Men
with CAH
All
Women
All
Men
1399.061361.531585.521549.071380.291567.30
±99.05±117.84±118.74±153.96±109.65±136.96
Table 2. Post hoc group comparisons for ICV.
Effect Size (Cohen’s d)t (df)Significance (p)
Control Women
vs. Control Men
−1.08−5.47 (102)<0.001
Control Women
vs. Women with CAH
0.251.27 (102)0.166
Women with CAH
vs. Men with CAH
−1.09−5.50 (102)<0.001
Control Men
vs. Men with CAH
0.190.96 (102)0.407
Women with CAH
vs. Control Men
−1.30−6.57 (102)<0.001
Control Women
vs. Men with CAH
−0.87−4.40 (102)<0.001
Table 3. Descriptive statistics for TBV (in mL): mean ± standard deviation.
Control WomenWomen
with CAH
Control
Men
Men
with CAH
All
Women
All
Men
1167.091123.431316.611279.371145.261297.99
±88.08±102.30±104.44±134.87±97.24±120.55
Table 4. Post hoc group comparisons for TBV.
Effect Size (Cohen’s d)t (df)Significance (p)
Control Women
vs. Control Men
−0.99−5.00 (102)<0.001
Control Women
vs. Women with CAH
0.331.68 (102)0.166
Women with CAH
vs. Men with CAH
−1.03−5.21 (102)<0.001
Control Men
vs. Men with CAH
0.221.12 (102)0.407
Women with CAH
vs. Control Men
−1.28−6.46 (102)<0.001
Control Women
vs. Men with CAH
−0.74−3.75 (102)<0.001
Disclaimer/Publisher’s Note: The statements, opinions and data contained in all publications are solely those of the individual author(s) and contributor(s) and not of MDPI and/or the editor(s). MDPI and/or the editor(s) disclaim responsibility for any injury to people or property resulting from any ideas, methods, instructions or products referred to in the content.

