Article

Multi-Platform Expression Analyses Reveal a Putative INHBA-SERPINE2-SDF2L1 Co-Regulated Module in the Bovine Cumulus–Oocyte Complex


by
Beatriz Elena Castro-Valenzuela
1,
Tannia Janeth Vega-Montoya
2,
Blanca Sánchez-Ramírez
2,
Álvaro Vargas-Cázares
1,
Moisés Armides Franco-Molina
3 and
M.Eduviges Burrola-Barraza
2,*
1
Facultad de Zootecnia y Ecología, Universidad Autónoma de Chihuahua (UACH), Perif. Fco. R. Almada Km. 1, Chihuahua 31453, Mexico
2
Facultad de Ciencias Químicas, Universidad Autónoma de Chihuahua (UACH), Circuito Universitario s/n, Campus II, Chihuahua 31125, Mexico
3
Facultad de Ciencias Biológicas, Universidad Autónoma de Nuevo León (UANL), San Nicolás de los Garza 66455, Mexico
*
Author to whom correspondence should be addressed.
Appl. Biosci. 2026, 5(2), 26; https://doi.org/10.3390/applbiosci5020026
Submission received: 28 January 2026 / Revised: 11 March 2026 / Accepted: 27 March 2026 / Published: 2 April 2026

Abstract

Bidirectional communication between the oocyte and surrounding follicular cells coordinates follicle growth, meiotic maturation, and the acquisition of competence. We aimed to identify genes related to follicular crosstalk and the secretory pathway as candidate mediators of cumulus–oocyte complex (COC) crosstalk in cattle. Expressed sequence tags (ESTs) from bovine COCs were retrieved from databases and screened for genes related to secretion and the secretory pathway using SignalP and SecretomeP, and transmembrane proteins were removed, yielding 13 candidate genes. Candidate expression was examined in two GEO RNA-seq datasets to assess enrichment in oocytes versus cumulus cells. RT–qPCR profiling across tissues and reproductive cell types enabled principal component analysis and correlation/network analysis, visualized as heatmaps and Cytoscape, revealing an INBHA-SERPINE2-SDF2L1 co-expression pattern. INHBA and SERPINE2 protein products are secreted, whereas SDF2L1 protein is a secretory pathway-associated, endoplasmic reticulum-resident chaperone. Promoter sequences of INHBA, SERPINE2, and SDF2L1 were scanned with FIMO using JASPAR motifs, identifying shared SMAD-associated motifs and FSH/cAMP-related motif families. The data support a co-regulation model in which endocrine FSH/cAMP and activin/TGF-β–SMAD inputs converge on a shared transcriptional program consistent with a putative INHBA–SERPINE2–SDF2L1 co-regulated module, linking cumulus extracellular matrix remodeling/protease control with oocyte ER protein folding capacity during COC maturation.

1. Introduction

Oocyte developmental competence is progressively established during folliculogenesis and relies on the coordinated function of the follicle as an integrated cellular niche, rather than on the oocyte functioning independently. This process involves the formation of a highly coordinated cellular consortium. In this system, granulosa/cumulus cells and the oocyte work as an integrated unit. At the core of this process lies bidirectional communication between the oocyte and its surrounding granulosa/cumulus cells, which synchronizes growth, metabolic support, chromatin remodeling, and the timing of meiotic progression with follicle cell differentiation and endocrine responsiveness [1,2]. Although the structural basis of this dialog by transzonal projections, gap junctional coupling, and dynamic remodeling of cell–cell interfaces is well recognized [3,4,5], further work is required to delineate the extracellular signaling landscape and how these cues are integrated across follicle stages to drive the gradual acquisition of oocyte competence. One of the main reasons for the effectiveness of this communication is that it is mediated by multiple complementary mechanisms.
Direct contact between the oocyte and granulosa/cumulus cells enables the rapid exchange of small molecules and second messengers, aligning the follicular physiological state to function as a coordinated unit [6]. In parallel, paracrine signaling provides an instructional mechanism of control in which secreted ligands shape compartment-specific transcriptional programs, remodel the extracellular matrix (ECM), and tune metabolic specialization, thereby supporting oocyte developmental potential [7,8]. Classic examples of oocyte-derived paracrine factors include members of the TGF-β superfamily, such as GDF9, BMP15, and cumulin, which act on granulosa/cumulus cells via SMAD-mediated pathways and promote functional programs associated with proliferation, glycolysis, and cholesterol biosynthesis [9,10,11]. In addition, the granulosa/cumulus cells display a paracrine system towards the oocyte that provides regulatory control, including the activin signaling axis, which operates in autocrine–paracrine modes within the follicle and contributes to follicle formation/activation and steroidogenic programming [12].
As follicles advance, endocrine cues of follicle-stimulating hormone (FSH) and luteinizing hormone (LH) become increasingly integrated with local paracrine networks, and competence emerges from the timing and coordination of multiple signaling modules rather than from a single pathway. In the periovulatory window, EGFR-dependent signaling in granulosa/cumulus cells is a central switch that links gonadotropin stimulation to functional changes in the cumulus–oocyte complex (COC), including signaling events associated with meiotic resumption [13]. In particular, EGFR-mediated signaling controls the CNP/NPR2 pathway, which maintains transzonal projections and meiotic arrest in oocytes in antral follicles as a transition toward ovulation [14,15]. Thus, throughout folliculogenesis, bidirectional communication is an essential and complex mechanism in which multiple signaling systems converge to produce an oocyte competent to be fertilized.
In this context, strengthening our understanding of follicular crosstalk within the COC requires not only prioritizing secretion-related candidates implicated in local communication but also identifying coordinated expression programs that integrate extracellular cues with intracellular capacity for secretion and protein homeostasis. Therefore, the present study focused on identifying genes related to follicular crosstalk and the secretory pathway as candidate mediators of cumulus–oocyte complex (COC) crosstalk in cattle. Accordingly, our strategy combines in silico prioritization of secretion/secretory pathway-related candidate genes with cross-dataset expression integration and co-expression network analyses to detect robust, reproducible patterns of coordinated regulation. In parallel, promoter-level analyses are used to explore whether such patterns are compatible with shared upstream transcriptional inputs. Together, this framework enables a mechanistically informed view of COC communication that goes beyond single-factor paracrine models and provides a focused basis for subsequent functional testing.

2. Materials and Methods

2.1. Bioinformatic Analysis

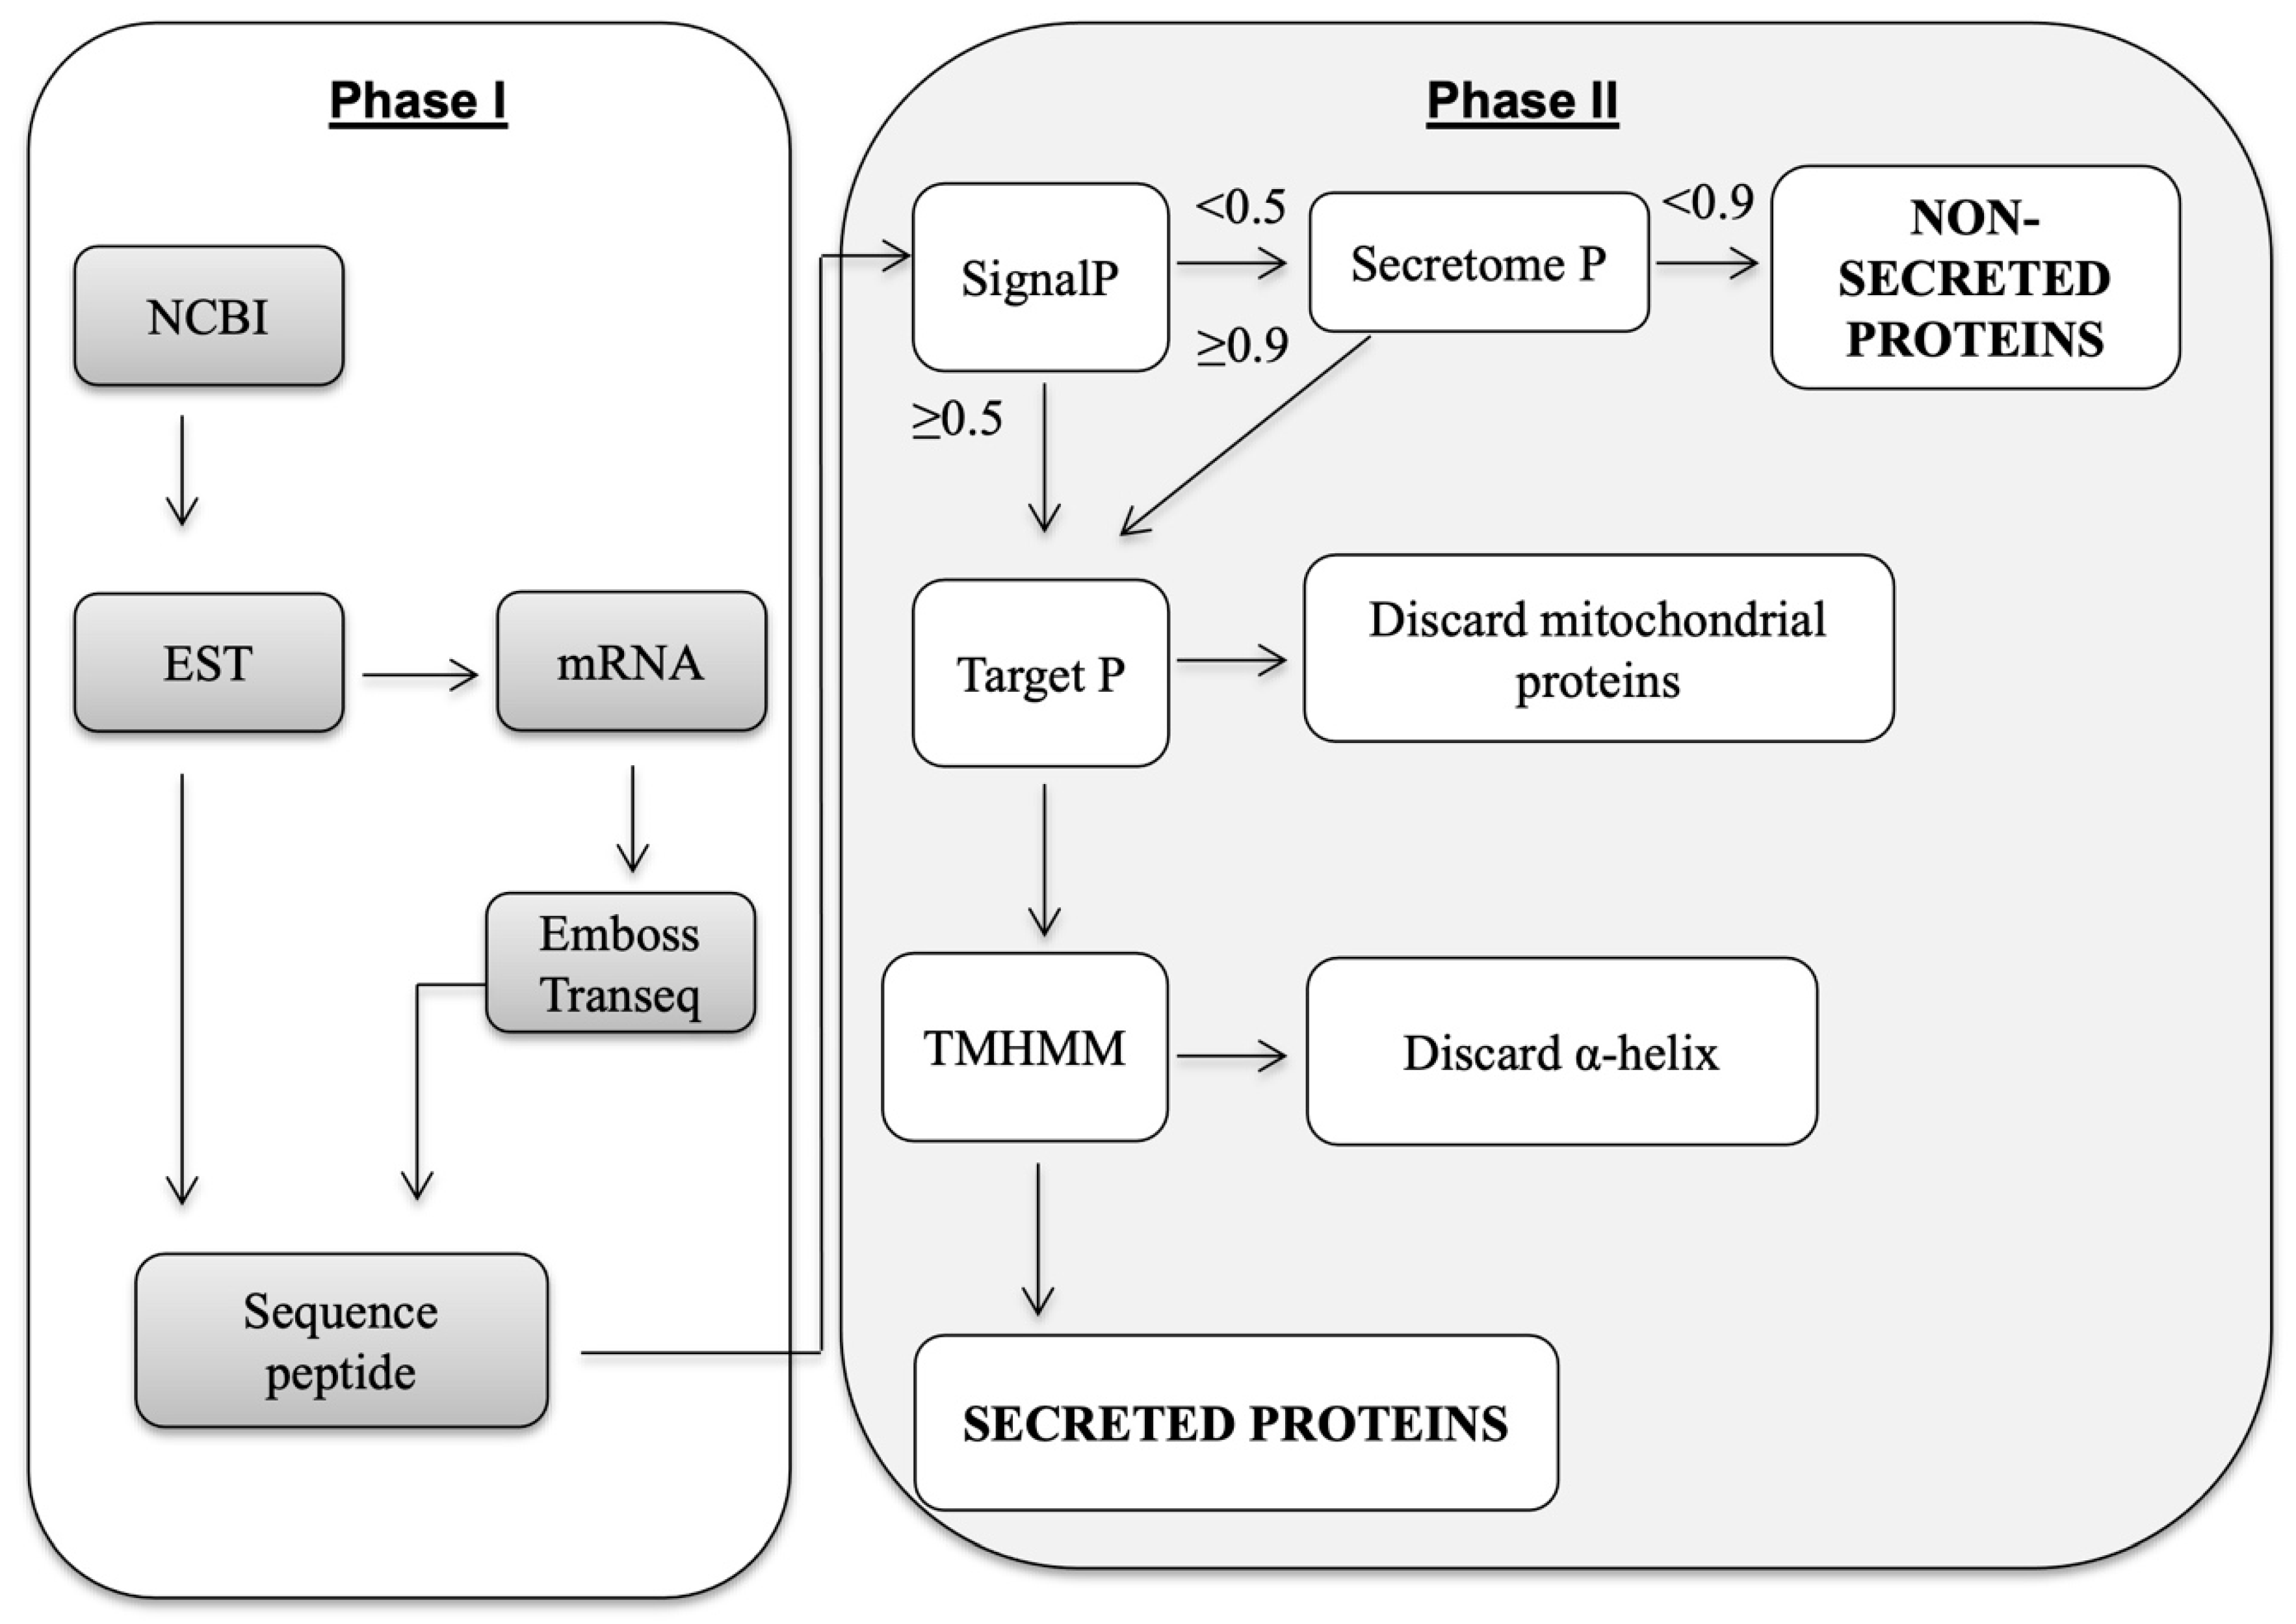
The bioinformatics analysis was performed in two phases (Figure 1). The first phase consisted of retrieving bovine cumulus–oocyte complex (COC) expressed sequence tags (ESTs), while the second phase focused on predicting secreted proteins [16]. Expressed sequence tags were selected for their suitability in identifying and characterizing transcripts in bovine COCs, as they represent experimentally derived cDNA sequences that capture both abundant and rare transcripts. This approach facilitates the discovery of novel or previously uncharacterized genes, including those encoding secreted proteins. The EST database was used because it contains first-pass single-read cDNA sequences derived from mRNA, providing a snapshot of gene expression in the bovine ovary at a specific developmental stage. Bovine COC ESTs were obtained from the National Center for Biotechnology Information (NCBI) database, using sequences reported for the ovary and COC in the bovine model (Table 1). For ESTs lacking associated protein annotations, peptide sequences were predicted from the mRNA sequences using the EMBOSS Transeq v6.6.0.0 server. At the time of data retrieval and analysis, the NCBI EST resource was accessible. However, the EST database has since been retired from NCBI/Entrez following its integration into the Nucleotide database. Consequently, the original EST records are no longer directly searchable, which may limit the precise replication of the retrieval step using the current interface. To clarify the rationale and ensure reproducibility, the initial retrieval step used NCBI dbEST, which, at the time of study initiation, was the most direct public resource for accessing transcript sequences derived from bovine cumulus–oocyte complexes. Although dbEST has since been retired, the pipeline did not treat EST accessions as final identifiers. Each EST-derived candidate was subsequently mapped and validated against the current Bos taurus reference genome and annotation available at NCBI (ARS-UCD2.0), thereby confirming correspondence to an annotated gene model. The resulting genome-anchored gene identifiers and candidate list, presented in Table 2, enable full traceability of all secreted protein candidates within the current reference framework, even though the original EST-retrieval step cannot be repeated directly via NCBI. Proteins obtained from the EST database and those predicted with EMBOSS Transeq were analyzed with SignalP version 4.1 [17] to identify classically secreted proteins. The analysis was performed using the “eukaryotic organism” setting and truncating protein sequences to 70 amino acids to optimize neural network performance. Proteins with a D-score ≥ 0.5 were considered classically secreted, balancing a low false-positive rate with maximum sensitivity. Proteins with a D-score < 0.5 were analyzed using SecretomeP version 1.0 [18] to predict non-classical secretory proteins. Proteins with a neural network (NN) score ≥ 0.9 were classified as non-classical secretory proteins to ensure reliability, whereas those with a score of <0.9 were considered non-secreted. The combined set of classical and non-classical secretory proteins was then analyzed with TargetP version 1.1 [19] to identify mitochondrial proteins, using a specificity of 95% (prediction cut-off of 0.78 for mitochondrial and 0.73 for other locations) and default non-plant settings. Predicted mitochondrial proteins were excluded. The remaining proteins were evaluated with TMHMM [20] using default parameters to predict transmembrane domains from alpha-helical regions. Proteins lacking predicted transmembrane helices were classified as secreted proteins.

2.2. Cross-Study Targeted Expression Analysis of Secretion/Secretory Pathway Genes Using Public GEO Datasets

A targeted analysis was performed using two independent bovine oocyte–cumulus RNA-seq studies available in NCBI GEO (GSE99678 and GSE199210), focusing on 14 candidate genes identified as secretion/secretory pathway proteins. GSE99678 [21] generated transcriptomes from 16 individual COCs collected ex vivo from abattoir-derived ovaries. Each COC was chemically dissected into outer cumulus cells, inner cumulus cells, and a denuded oocyte via trypsin treatment and gentle pipetting, followed by SMART-seq2 whole-transcriptome amplification (16 PCR cycles), Nextera XT library preparation, and paired-end 100-nt sequencing on an Illumina HiSeq 2500. Expression was quantified as FPKM using Cufflinks with Ensembl UMD3.1.87 annotations, and the original study applied an inclusion rule of FPKM > 0.5 in at least eight samples per compartment. GSE199210 [22] profiled matched oocytes and surrounding cumulus cells obtained post-mortem from abattoir-derived ovaries; COCs were aspirated from antral follicles (3–8 mm diameter) and classified by Brilliant Cresyl Blue (BCB) staining, where BCB+ (blue-retaining; low G6PDH activity) represents fully grown, developmentally competent oocytes and BCB− (decolorized; higher G6PDH activity) represents oocytes still in the growing phase. For the present analysis, BCB+ and BCB− samples were combined so that all cumulus cell samples were analyzed together and all oocyte samples were analyzed together, providing a compartment-level comparison independent of developmental competence. This dataset comprised 38 RNA-seq libraries (19 oocytes and 19 corresponding cumulus cell samples) sequenced as paired-end 150-nt reads on an Illumina HiSeq 2500, aligned to the Bos taurus ARS-UCD1.2 assembly. It quantified against Ensembl ARS-UCD1.2.98 annotations using featureCounts, with lowly expressed genes filtered in the original workflow using CPM/TPM thresholds. Raw RNA-seq reads corresponding to GSE99678 were downloaded from the NCBI Sequence Read Archive (SRA) using the run accessions linked to the GEO record. Transcript abundance was quantified using Salmon v1.10.3 (quasi-mapping mode) against the Bos taurus Ensembl transcriptome (ARS-UCD1.2 assembly, Ensembl release-110). Gene-level counts were generated by importing transcript-level estimates with tximport (v1.38.2). All downstream analyses were performed in R (v4.5.2) using the following packages: DESeq2 (v1.50.2) for differential expression modeling, tximport (v1.38.2) for transcript-to-gene summarization, biomaRt (v2.66.0) for Ensembl-based gene annotation, apeglm (v1.32.0) for log2 fold-change shrinkage, and tidyverse-related packages, including dplyr (v1.2.0), tidyr (v1.3.2), readr (v2.1.6), and ggplot2 (v4.0.2) for data manipulation and visualization. Differential expression analysis was conducted using DESeq2, comparing cumulus cells (CC) versus oocytes, with the contrast specified as log2(CC/oocyte). Lowly expressed genes were filtered prior to modeling. Statistical significance was assessed using the Wald test, and multiple testing correction was performed using the Benjamini–Hochberg procedure. Adjusted p-values are reported as false discovery rate (FDR, padj). Genes with FDR < 0.05 were considered statistically significant. Effect sizes are presented as log2 fold changes (log2FC), and 95% confidence intervals were calculated from the model-based standard error (log2FC ± 1.96 × lfcSE). For GSE199210, the GEO “unfiltered” FPKM matrix was filtered to retain genes with FPKM > 0.5 in ≥8/16 samples across at least one compartment, while retaining all target genes, and values were transformed as log2(FPKM + 0.5). Gene-level counts were converted to CPM and transformed as log2(CPM + 0.5). For each candidate gene, compartment differences were tested using an unpaired Welch’s t-test on transformed values, and statistical significance was defined as p < 0.05. For the present study, all processing, filtering, statistical testing, and visualization were implemented in RStudio (Posit Software, PBC; version 2026.01.00+392) using readr (v2.1.6), dplyr (v1.2.0), tidyr (v1.3.2), stringr (v1.6.0), readxl (v1.4.5), ggplot2 (v4.0.2), and stats libraries (v4.5.2).

2.3. Tissue Collection

Adult tissues from seven organs (heart, lung, kidney, liver, spleen, muscle, and ovary) were collected from 30 cows, together with testicular tissue from one adult bull and two fetal tissues (ovary and testis). All samples were obtained from a local slaughterhouse, placed in cryovials, and immediately immersed in liquid nitrogen for storage at −196 °C until total RNA extraction.

2.4. RNA Extraction and cDNA Synthesis

Total RNA was isolated from tissues using TRIzol reagent (Invitrogen, Carlsbad, CA, USA) according to the manufacturer’s instructions. RNA was eluted in nuclease-free water and stored at −80 °C until cDNA synthesis. RNA concentration was determined by measuring absorbance at 260 nm with a NanoDrop spectrophotometer (Thermo Scientific, Waltham, MA, USA), and purity was assessed from the A260/280 ratio. The cDNA synthesis was performed using the High-Capacity kit RNA-to-cDNA (Applied Biosystems, Foster City, CA, USA) according to the manufacturer’s protocol, with 2 μg of total RNA per reaction. Reactions were run in a thermocycler (Corbett, Research, San Francisco, CA, USA) under the following conditions: 60 min at 37 °C, 5 min at 95 °C for enzyme inactivation, and hold at 4 °C. The concentration and purity of cDNA were measured at 260 nm and using the A260/280 ratio, respectively. The resulting cDNA was stored at −20 °C until further use.

2.5. Gene Detectability Presence/Absence Analysis

To identify robust, tissue co-detection (co-occurrence) relationships, genes showing consistently detectable patterns across a broad panel of bovine tissues were evaluated. Presence/absence analyses were performed using a StepOne Real-Time PCR System (Applied Biosystems, Carlsbad, CA, USA). Reactions contained TaqMan Universal Master Mix II and specific TaqMan Gene Expression Assays with FAM-labeled probes (Applied Biosystems, Carlsbad, CA, USA) for SDF2L1 (Bt03228468_m1), CARTPT (Bt03417236_m1), OOSP1 (Bt03233531_g1), TIMP1 (Bt03223272_m1), PTGS2 (Bt03214492_m1), POSTN (Bt03237767_m1), P4HA3 (Bt03210072_m1), CTSK (Bt03221200_m1), PTX3 (Bt03249011_m1), SRGN (Bt03225146_m1), PSAP (Bt03213000_m1), SERPINE2 (Bt03232952_m1), and INHBA (Bt03259358_m1). The 18S rRNA gene was included as an endogenous control. Each sample was analyzed in three biological replicates. Each reaction contained 50 ng of cDNA and was performed in triplicate following the manufacturer’s protocol. No-template control (NTC) reactions were included for each probe. Because the goal of the tissue survey was to screen detectability across tissues (co-occurrence), rather than estimating fold-changes, a transcript was classified as present (1) when amplification was consistently detected in all replicates with Ct < 35; otherwise, it was classified as absent (0) when Ct ≥ 35. In addition, for Supporting Information, normalized quantitative expression values for the evaluated genes’ mRNAs were calculated using the log2−ΔΔCt method described by Livak et al. [23].

2.6. Multivariate and Network Analysis

Principal Component Analysis (PCA) and Pearson correlation coefficients were calculated in XLSTAT 2024.3 (Addinsoft, Paris, France) using expression levels of the analyzed genes across tissues. Hierarchical cluster analysis was performed using the correlation value in MetScape 3 Correlation Calculator Version 1.0 [24]. Moreover, the results were visualized as a heatmap. To represent correlations among expressed genes, a genetic interaction network was constructed with Cytoscape version 3.6.0 [25]. Pearson correlations were computed from the binary detectability matrix (present = 1; absent = 0) across tissues. The correlation network was visualized in Cytoscape using the MetScape correlation calculator output, where edge attributes included Corr.pcor (correlation coefficient), Corr.pval (nominal p-value), and Corr.adj.pval (multiple-testing-adjusted p-value). For interpretative purposes, correlations with |Corr.pcor| ≥ 0.30 were considered moderate-to-strong. Nominal statistical support was assessed using Corr.pval < 0.05. Network topology metrics were computed in Cytoscape on the full network, and node-level degree and betweenness centrality were extracted from the Cytoscape Node Table.

2.7. Promoter Scanning for Activin/SMAD and FSH/cAMP-Responsive Transcription Factor Motifs

Using the ARS-UCD2.0 bovine reference assembly, promoter regions were defined uniformly as −1000 to +100 bp relative to the transcription start site (TSS; +1). For INHBA, the promoter sequence was retrieved as NC_037331.1:79287496–79288596, with the TSS located at 79288496. For SDF2L1, the promoter sequence was retrieved in reverse orientation as NC_037344.1:c72112797–72111697, with the TSS located at 72112697. For SERPINE2, which is annotated on the reverse strand, the promoter sequence was obtained using reverse-complement coordinates, NC_037329.1:c112159698–112158598, with the TSS at 112158698. These promoter sequences were analyzed for transcription factor binding sites using FIMO from MEME Suite v5.5.9 (https://meme-suite.org/meme/doc/fimo.html; accessed on 13 November 2025). Motifs were obtained from the JASPAR database in MEME format (https://jaspar.elixir.no/; accessed on 13 November 2025) as position weight matrices (PWMs) and compiled into a MEME format library comprising SMAD3 (MA0795.1), SMAD2 (MA1964.2), SMAD4 (MA1153.2), SP1 (MA0079.5), SP2 (MA0516.3), SP3 (MA0746.3), and TBP (MA0108.3), NR5A1 (MA1540.2), ATF2 (MA1632.2), JUN (MA0489.3), CREB1 (MA0018), CREM (MA0609.3), FOS (MA0476.2), AP-1 (MA0099.4), JUNB (MA0490.3), and FOXL2 (MA1607.2). For all promoters, the FASTA sequences were indexed so that the TSS corresponded to position 1001, enabling motif coordinates to be reported both as absolute positions within the input sequence and as distances relative to the TSS (approximately −1000 to +100). Motif occurrences were called using a significance threshold of p ≤ 1 × 10⁻³. In addition to FIMO site-level motif scanning, we performed motif enrichment testing using AME (MEME Suite v5.5.9). The promoter sequences of INHBA, SERPINE2, and SDF2L1 were used as the foreground set (n = 3). As controls, AME-generated dinucleotide-preserving shuffled sequences were used (n = 1002). Motif enrichment was evaluated using Fisher’s exact test with the “average odds score” sequence scoring method and a fractional hit score threshold of 0.25.

3. Results

3.1. Bioinformatics Analysis

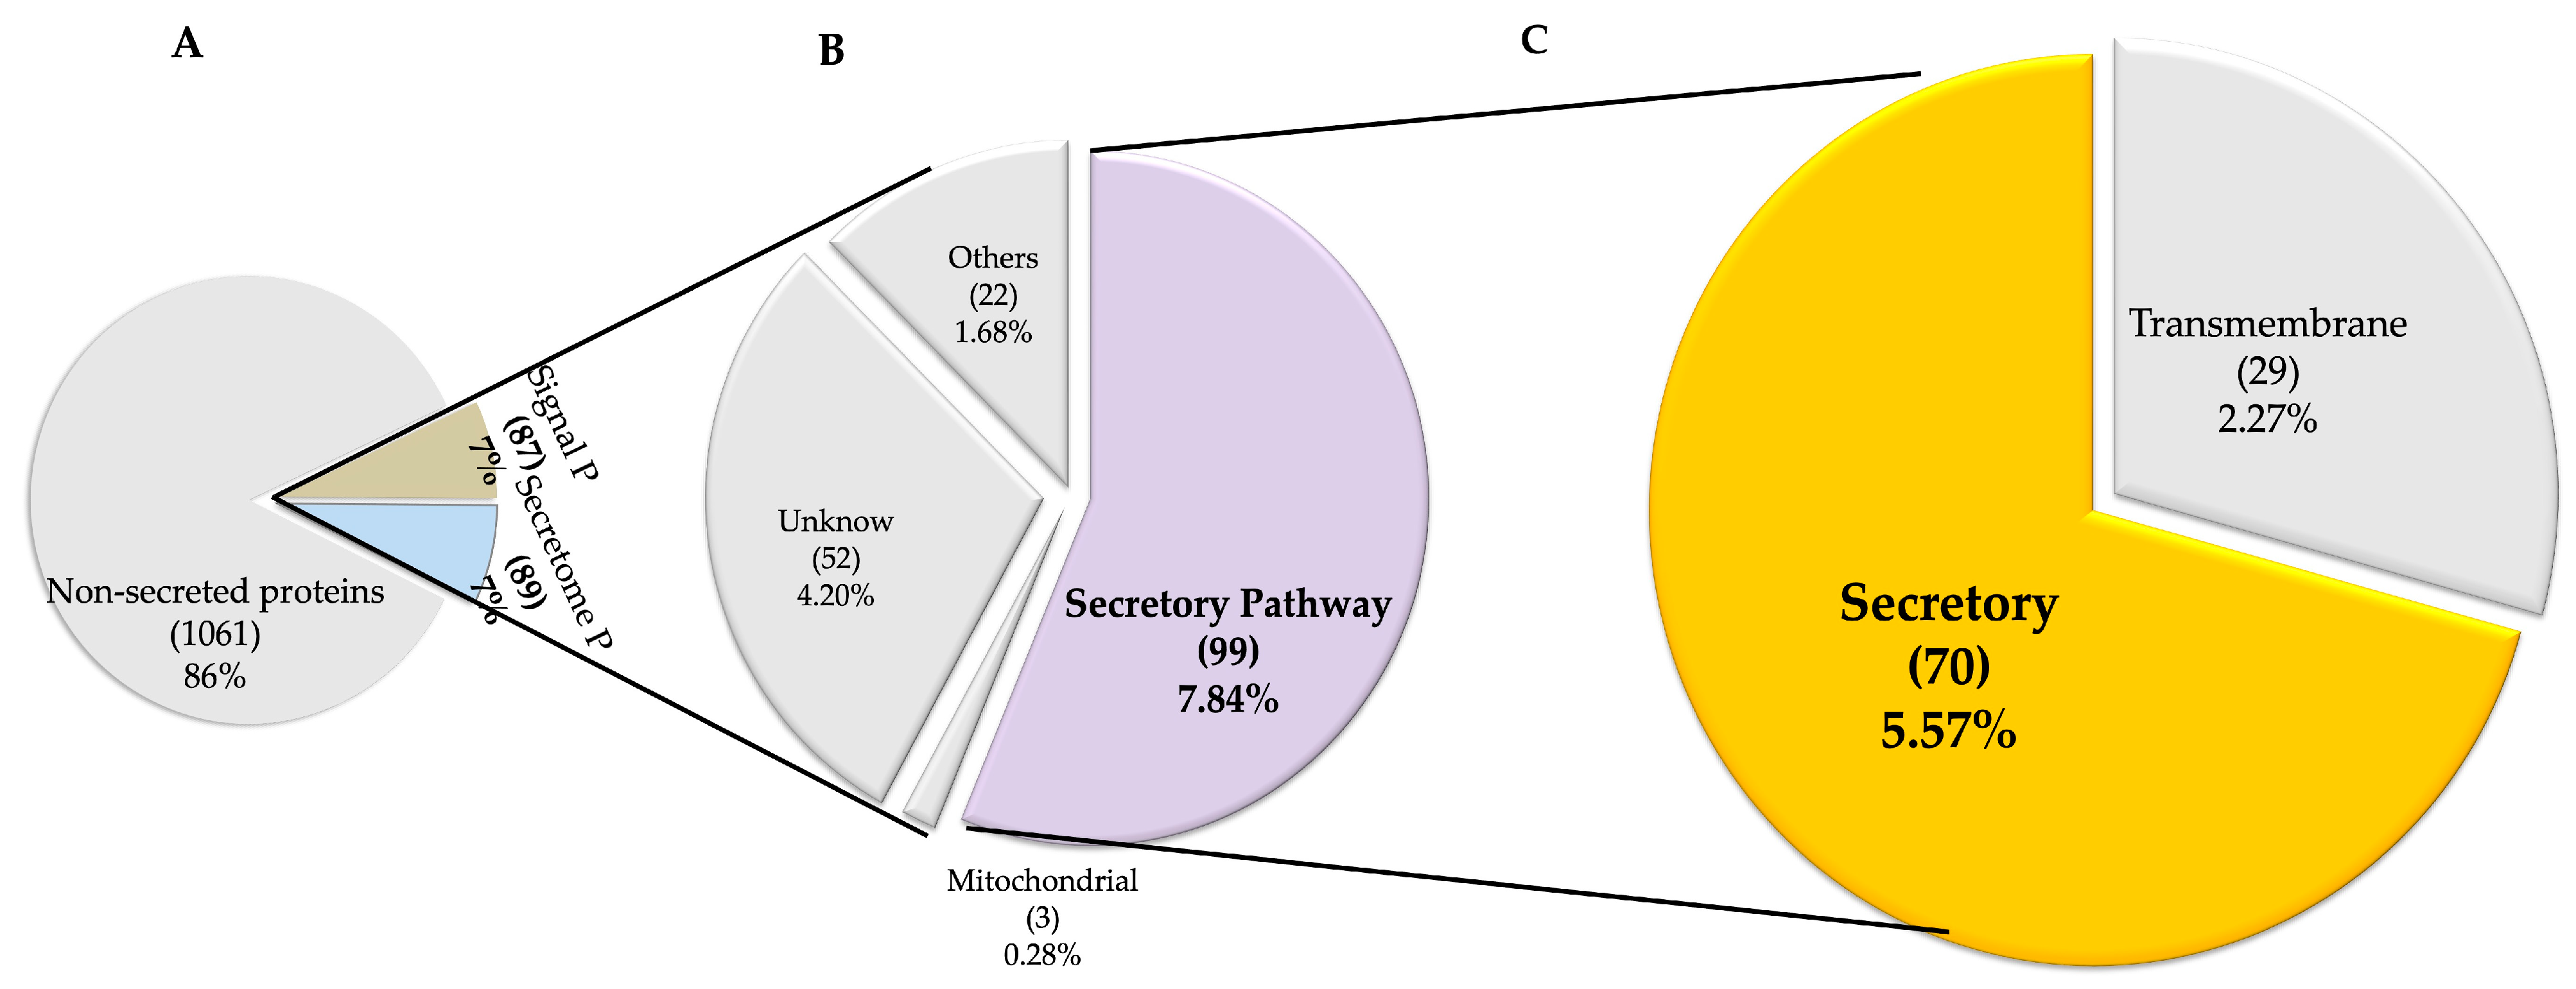
From 2166 bovine oocyte ESTs reported in the NCBI database, 1238 distinct proteins were identified, which were evaluated for predicted secretion (Table S7). Among these, 86% were predicted to be non-secreted proteins, 7% were predicted as secreted proteins by SignalP, and another 7% were predicted as secreted proteins by SecretomeP (Figure 2A). TargetP confirmed 99 proteins as secreted. Among these, three were predicted to have mitochondrial localization, 22 had other predicted localizations, and 52 had no predicted localization (Figure 2B). TMHMM analyzed the remaining 99 proteins to predict transmembrane proteins. Twenty-nine proteins were predicted to contain one or more transmembrane helices, while 70 were confirmed as secreted proteins (Figure 2C). Among the predicted secreted proteins, those without confirmed annotation were discarded. The final set comprised 13 proteins prioritized as secreted or secretory pathway-associated candidates, identified by reference in NCBI: CTSK, TIMP1, SRGN, P4HA3, POSTN, PTX3, SERPINE2, CARTPT, PTGS2, INHBA, SDF2L1, PSAP, and OOSP1 (Table S1). The cellular functions and chromosomal locations of these proteins are presented in Table 2.
Table 2. Cellular functions and chromosomal locations of the 13 candidate secretion/secretory pathway proteins identified by the bioinformatic pipeline in Bos taurus.
Protein Bank (NCBI Accession No.)Name (Abbreviation)FunctionARS-UCD2.0 Genome: Chromosome, LocationReference
NP_001029607.1Cathepsin K (CTSK) Cysteine protease. Degrades ECM (collagen type I and elastin).3, 119953196..19966059[26]
NP_001007821.1Cocaine- and amphetamine-regulated transcript protein (CARTPT) Reduces granulosa cell viability by promoting apoptosis.20, 9865310..9868125[27]
NP_777094.1Glia-derived nexin (SERPINE2) Serin protease inhibitor. Inhibits ECM degradation.2, 112087763..1121586983 [28]
NP_776788.1Inhibin beta A chain (INHBA) βA subunit of the activin/inhibin protein complex, which functions as a ligand triggering via ACVR2/ALK4.4, 79279914..79304488[29]
NP_776896.1Metalloproteinase inhibitor 1 precursor (TIMP1) Metalloendopeptidase inhibitor activity. Inhibits ECM degradation by inhibiting matrix metalloproteinases.X, 85939719..85943558[30]
NP_001033776.1Oocyte-secreted protein 1 isoform 1 (OOSP1) Function remains poorly defined, but it has been proposed to act as an autocrine/paracrine factor that disrupts oocyte–granulosa cell communication.15, 83095368..83103258 [31]
NP_001069727.1Pentraxin 3 (PTX3) ECM formation that is required for hyaluronan-rich matrix assembly.1, 110158197..110164262[32]
NP_001035569.1Periostin (POSTN) ECM protein.12, 24219371..24254425[33]
NP_001001598.1Prolyl 4-hydroxylase subunit alpha-3 (P4HA3) Contributes to ECM formation by hydroxylating collagen prolines to stabilize the collagen triple helix.15, 53609484..53681795,[34]
NP_776586.1Prosaposin (PSAP) Extracellular ligand for the G-protein coupled receptor (GPCR) activating cell survival and growth programs.28, 27965186..27997649 [35]
NP_776870.1Prostaglandin G/H synthase 2 (PTGS2) Also known as COX-2, it participates in the biosynthesis of prostaglandin E2.16, 67728006..67735629[36]
NP_001020497.1Serglycin (SRGN) Secretory-granule proteoglycan that packages and regulates the extracellular availability of bioactive mediators, including chemokines and proteases.28, 25474775..25490574[37]
NP_001030400.1Stromal cell-derived factor 2-like protein 1 (SDF2L1) Endoplasmic Reticulum resident chaperone cofactor that supports the BiP folding cycle and helps maintain ER proteostasis and homeostasis under secretory stress.17, 72112697..72114638[38]

3.2. Targeted Validation of Compartment-Specific Expression Patterns in Public Bovine COC RNA-Seq Datasets

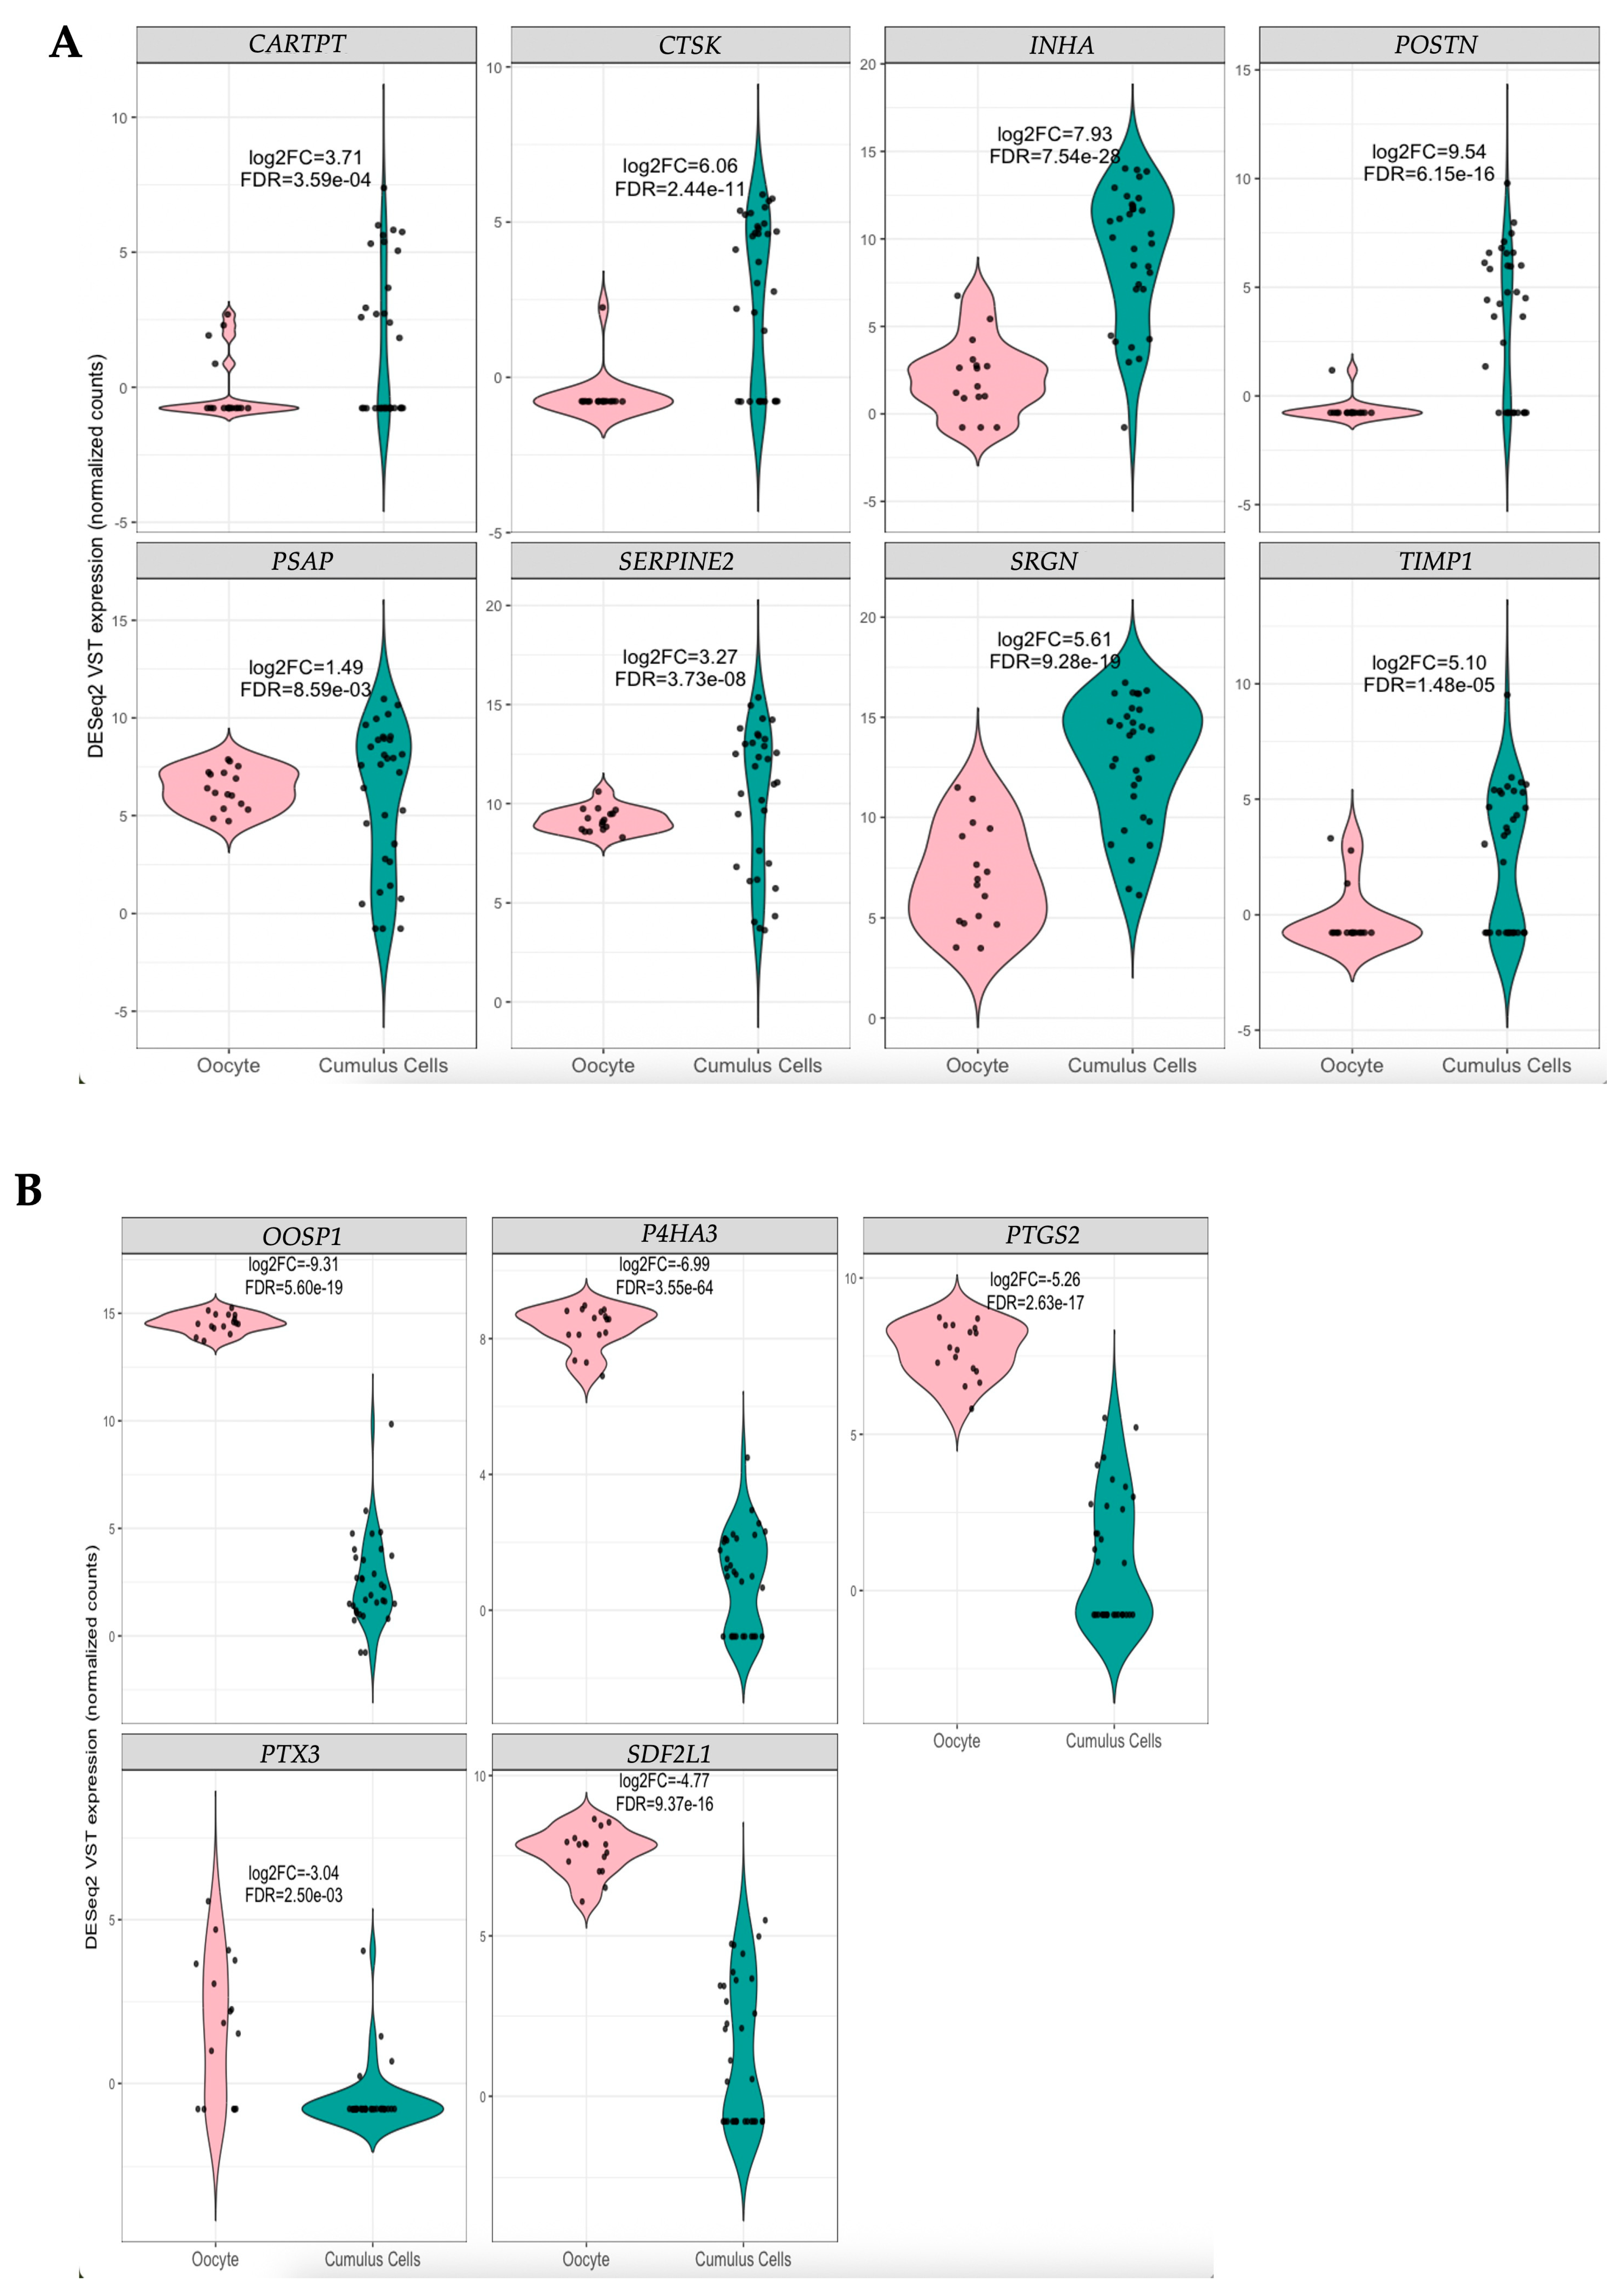
Analysis of GSE99678 using DESeq2-normalized counts revealed a distinct compartmentalized expression pattern among the selected candidates (Figure 3). CARTPT, CTSK, INHBA, POSTN, PSAP, SERPINE2, SRGN, and TIMP1 were significantly enriched in cumulus cells (all FDR < 0.05), with INHBA exhibiting one of the most pronounced increases. Conversely, OOSP2, P4HA3, PTGS2, PTX3, and SDF2L1 were significantly higher in oocytes (FDR < 0.05). The same compartmental contrast was assessed in the independent dataset GSE199210 (log2CPM) (Figure S2), and the overall trend was highly consistent: POSTN, CTSK, SRGN, PSAP, SERPINE2, INHBA, and CARTPT remained significantly enriched in cumulus cells (p < 0.0001), while SDF2L1, PTGS2, and OOSP1 were significantly higher in oocytes (p < 0.0001). PTX3 was the primary exception, showing no significant difference between compartments in GSE199210 (p = 0.2209), despite being oocyte-enriched in GSE99678.

3.3. Gene Detectability Presence/Absence Profiling Across Tissues

Because this tissue survey was designed as a detectability screen, the main text reports presence/absence (Table 3); normalized quantitative RT–qPCR outputs are provided as Supporting Information (Figure S1) to document expression trends. Several transcripts were broadly detected in most organs, including TIMP1, POSTN, CTSK, SRGN, and PSAP, which were present in all tissues examined except the spleen. In contrast, CARTPT and PTGS2 showed the most restricted patterns: CARTPT was detected only in the lung, kidney, testicle, and ovary, whereas PTGS2 was detected only in the liver, fetal testicle, and ovary. For its part, P4HA3 was detected in heart and reproductive tissues but absent from lung, kidney, liver, spleen, and muscle. SERPINE2 and SDF2L1 were widely detected but were consistently absent from the spleen and kidney, and INHBA was detected in the heart, lung, liver, muscle, and gonadal tissues but not in the kidney and spleen. OOSP1 was detected in the lung, kidney, spleen, muscle, fetal testicle, and ovary, but was absent in the heart, liver, testicle, and fetal ovary.

3.4. Association Between Gene Expression and Tissues

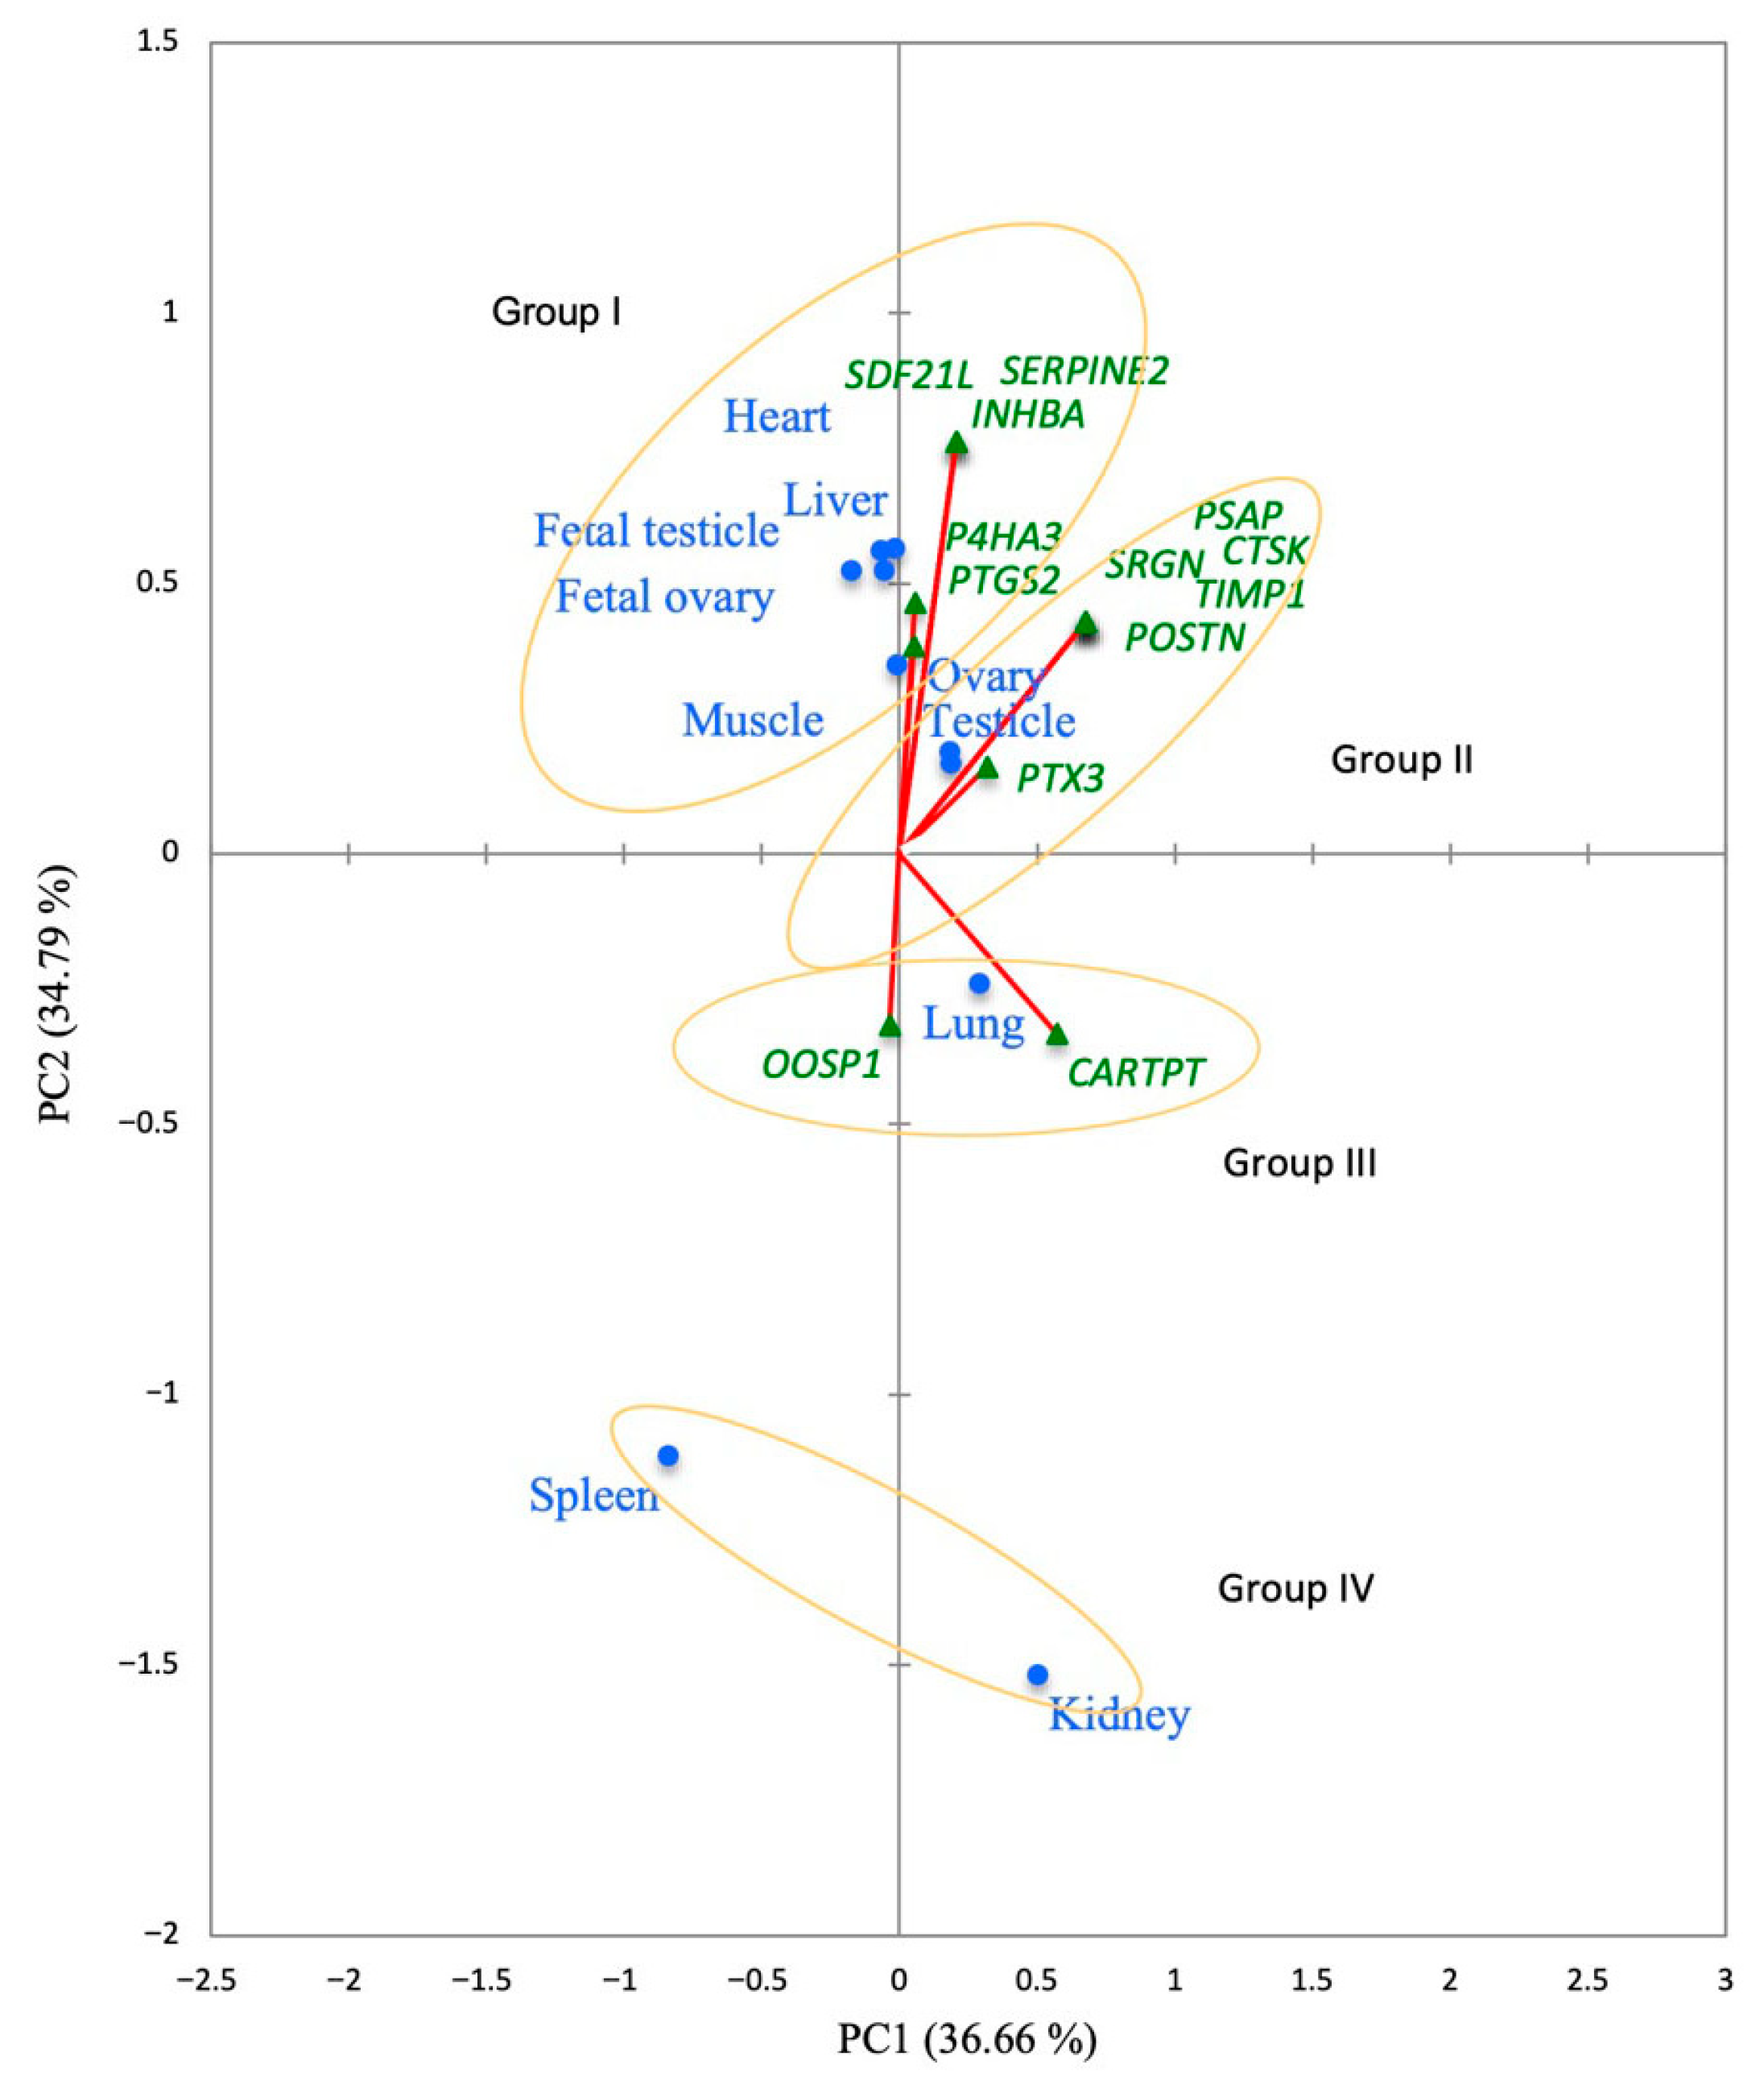
The relationship between the expression patterns of the 13 analyzed genes and the evaluated tissues was examined through principal component analysis (PCA). The first and the second PCA components explained 36.66 and 34.79% of the total variance, respectively, accounting for 71.45% of the overall data variation (Figure 4). These results indicate sufficient information for meaningful interpretation of the dataset. The PCA grouped tissue–gene expression patterns into four clusters: Group I included muscle, liver, heart, fetal testicle, and fetal ovary; Group II included adult ovary and testis; Group III included lung; and Group IV included spleen and kidney. The genes SDF2L1, SERPINE2, INHBA, P4HA3, and PTGS2 were projected near Group I, while PSAP, SRGN, CTSK, TIMP1, POSTN, and PTX3 were associated with Group II. OOSP1 and CARTPT were projected near Group III, whereas all genes showed expression patterns distinct from Group IV.

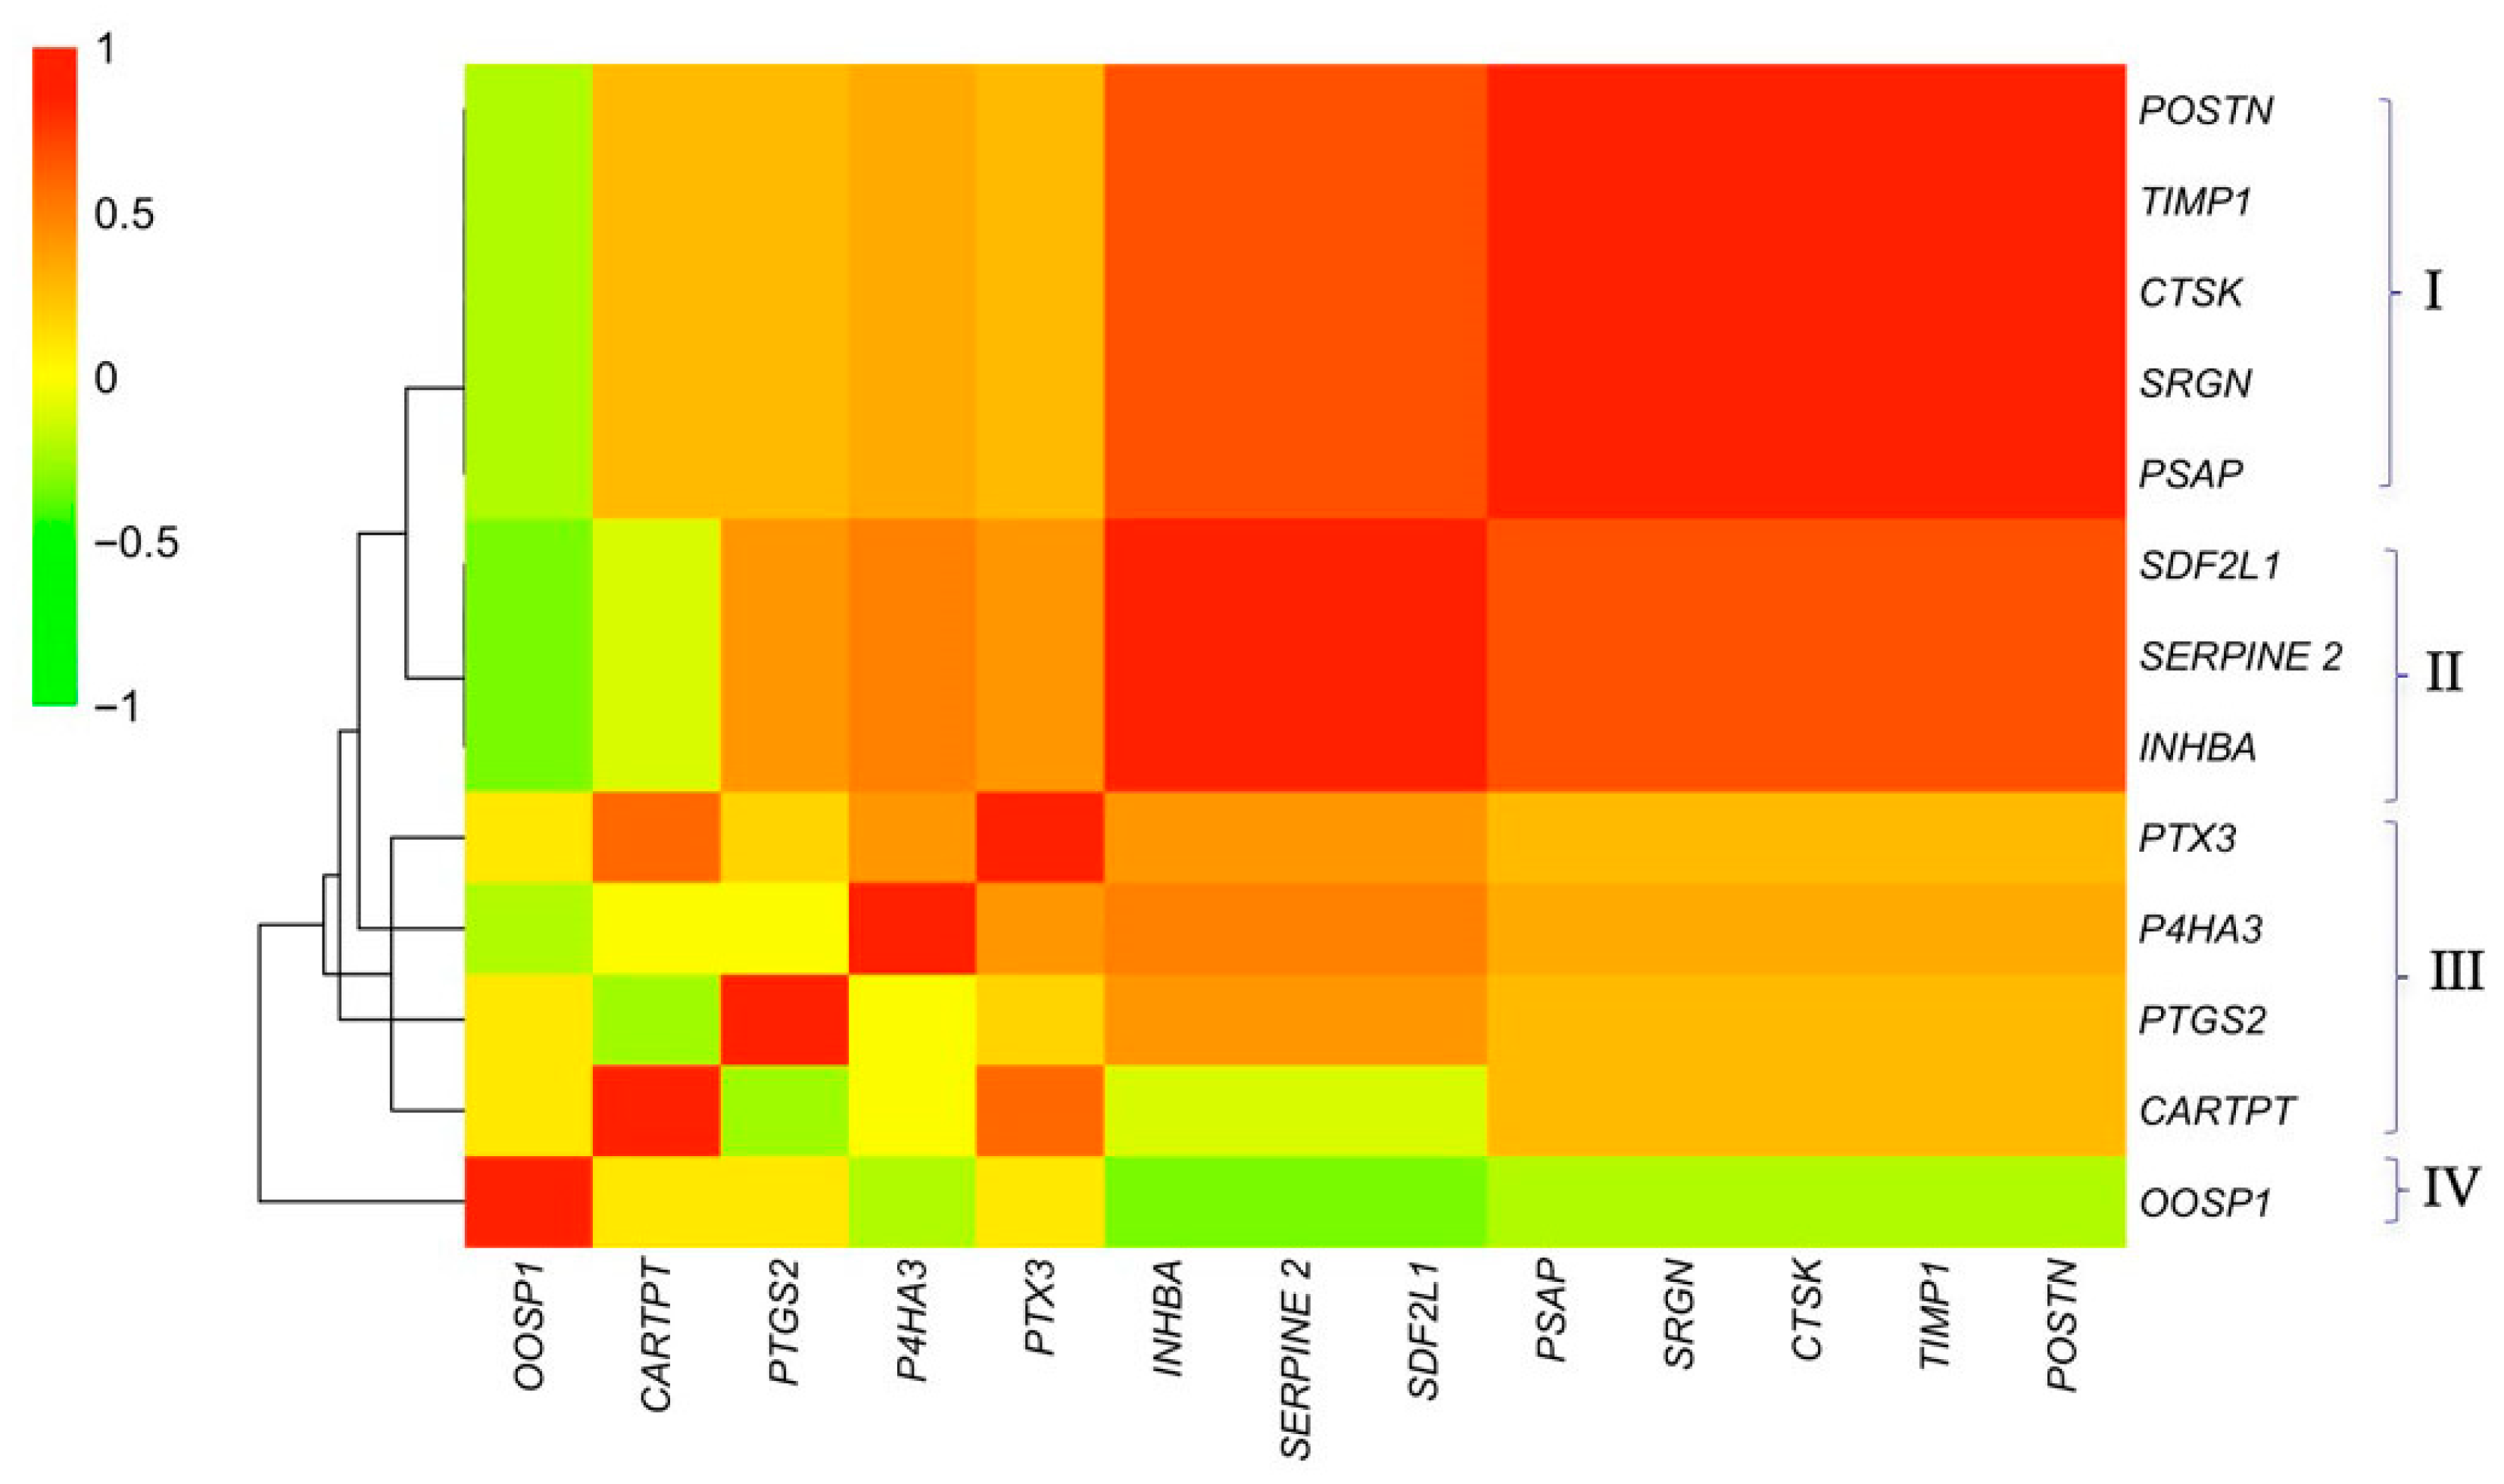
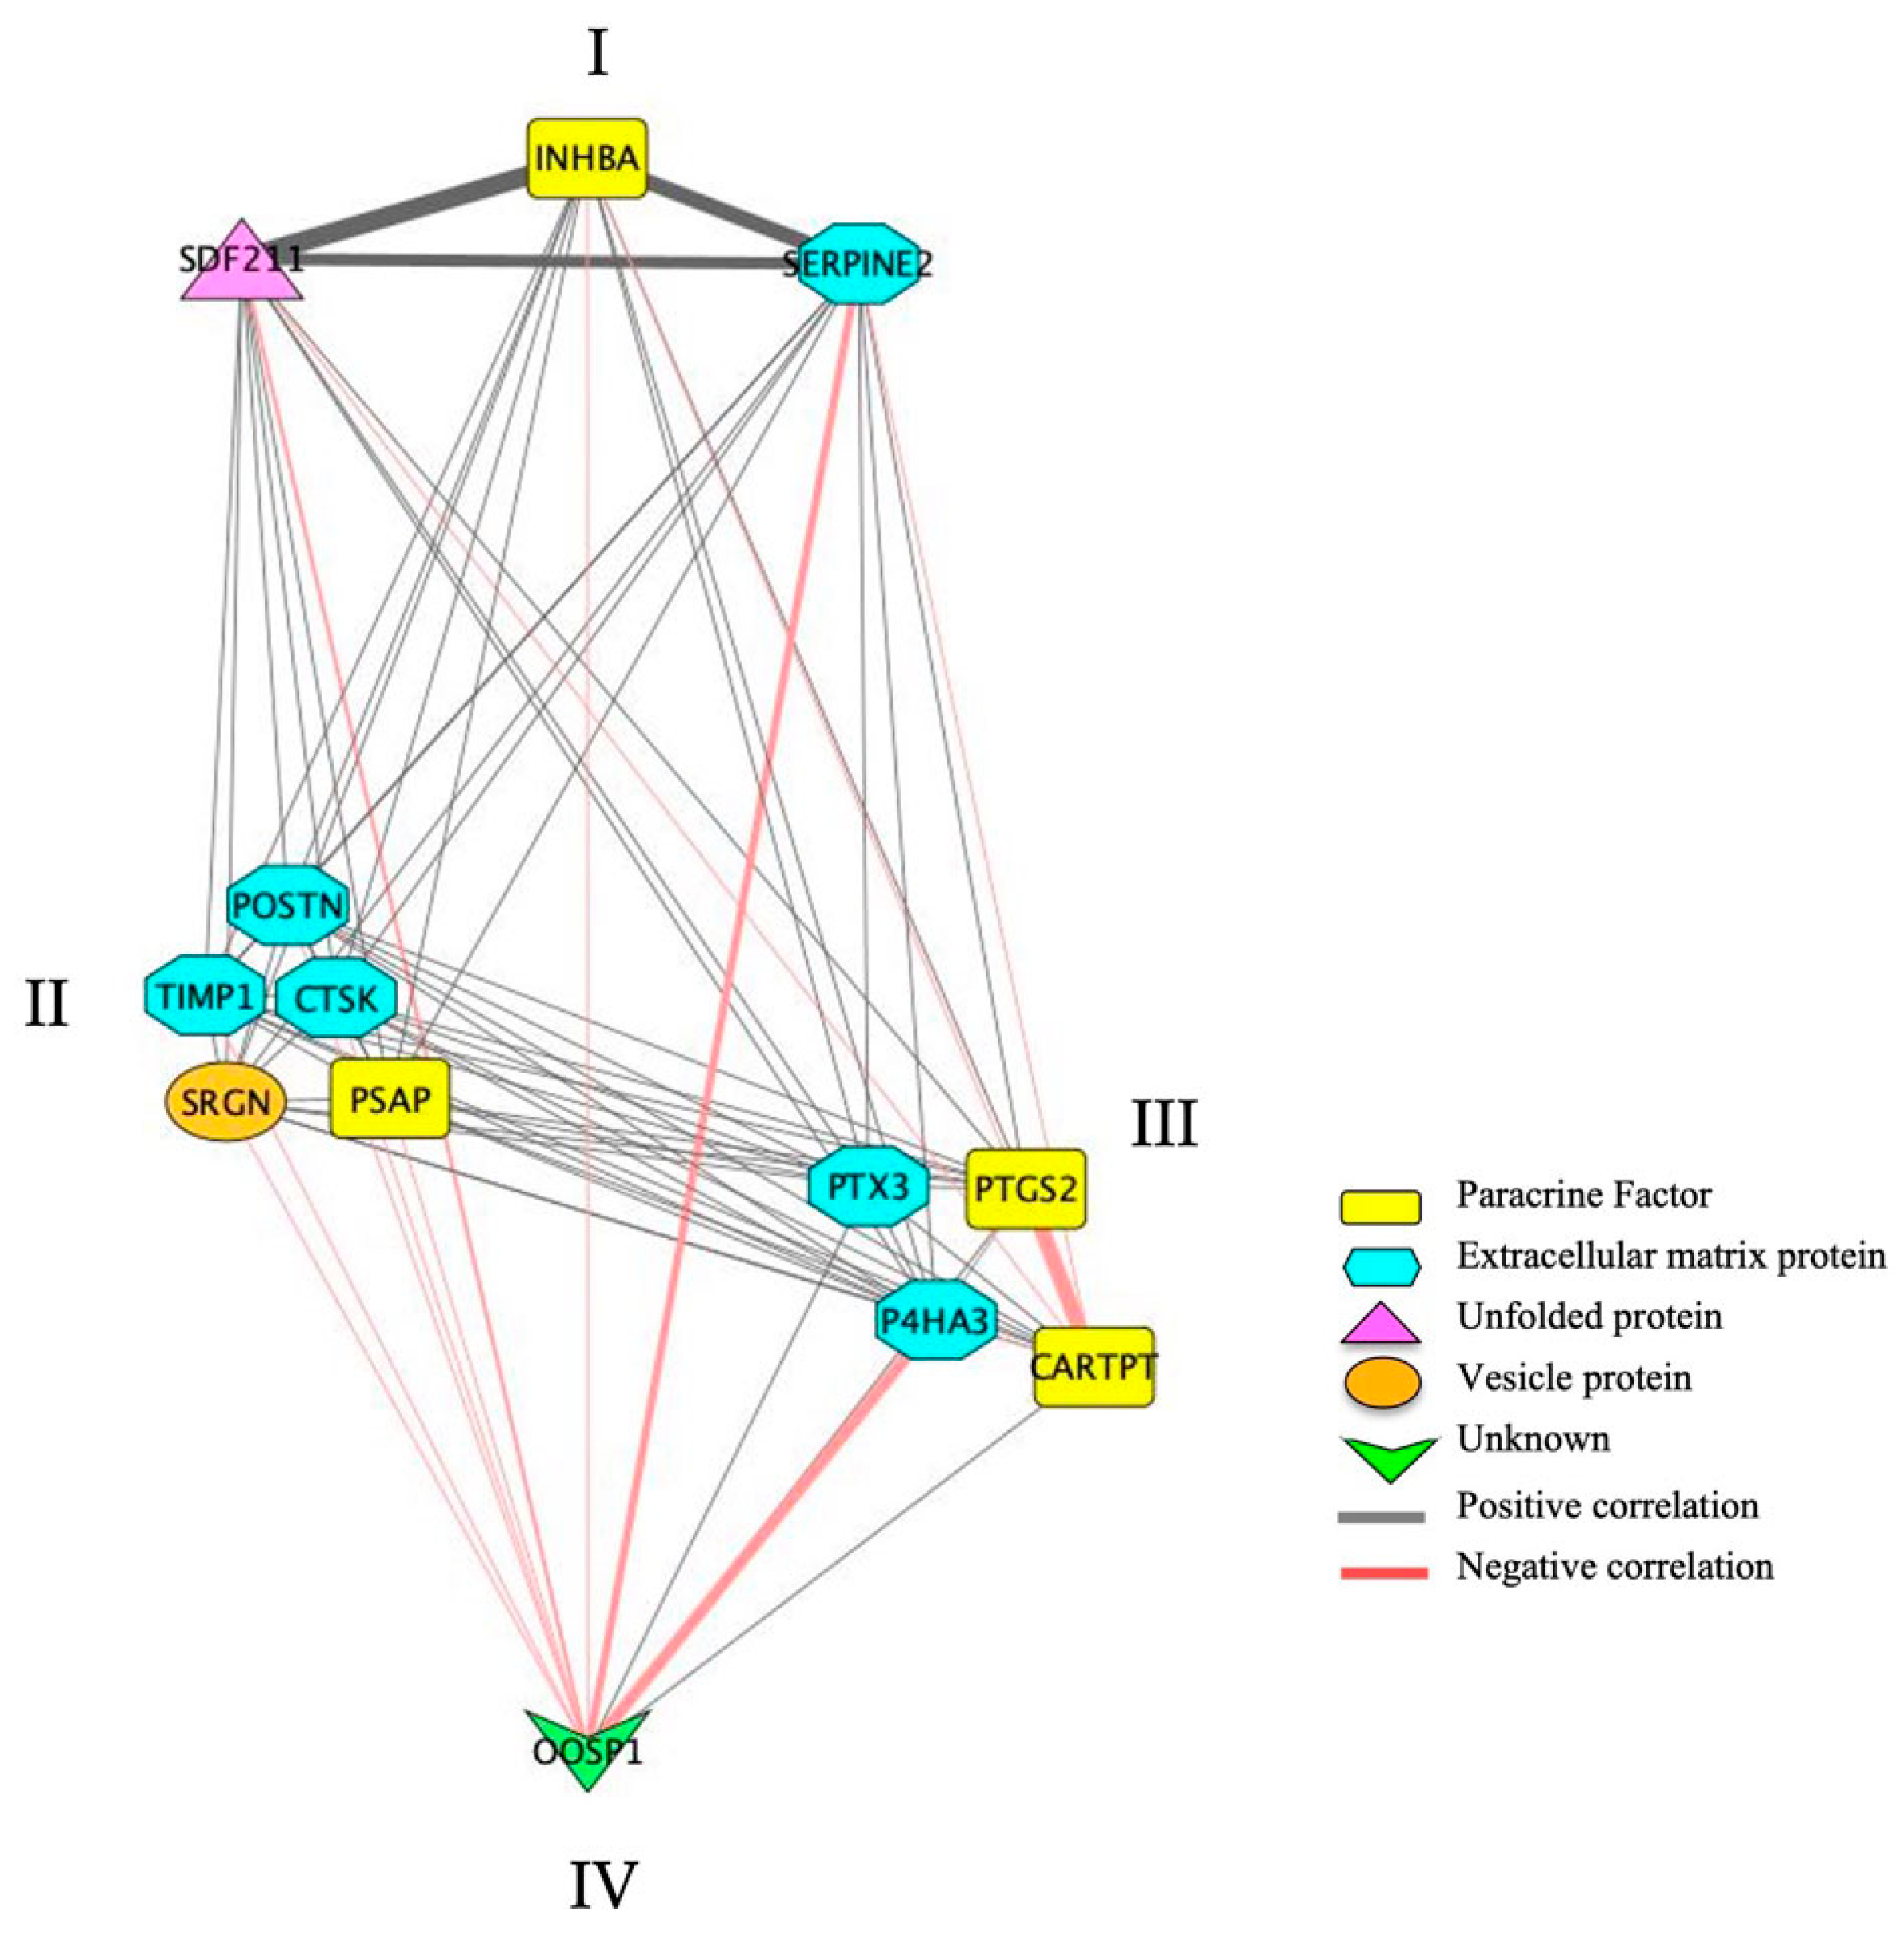
3.5. Gene Expression Correlations Across Tissues

To visualize relationships in gene expression patterns across tissues, a hierarchically clustered heatmap was generated from a Pearson’s correlation matrix (Figure 5). The analysis resolved four main co-expression groups. Cluster I comprised POSTN, TIMP1, CTSK, SRGN, and PSAP, indicating a broadly coordinated expression profile. Cluster II included SDF2L1, SERPINE2, and INHBA, whereas Cluster III grouped PTX3, P4HA3, PTGS2, and CARTPT. Consistent with this structure, the Cytoscape correlation network revealed a strongly connected module within the candidate secretion/secretory pathway gene set, with prominent positive associations among INHBA, SERPINE2, and SDF2L1. Additional extracellular matrix-associated genes TIMP1, POSTN, CTSK, TNC, PTX3, and P4HA3 formed a densely connected cluster with predominantly positive correlations, whereas OOSP1 segregated from the main network and displayed negative correlations with several core genes, indicating an inverse expression pattern (Figure 6). The three edges corresponding to the INHBA–SDF2L1–SERPINE2 module demonstrated nominal statistical significance (minimum Corr.pval = 0.0195). However, none of these edges remained significant following multiple-testing correction (minimum Corr.adj.pval = 0.682). Consequently, statistical support for these associations should be regarded as exploratory. Nonetheless, their potential biological relevance is highlighted by the strong and coherent correlation pattern observed within this module. Network topology analysis of the complete graph using Cytoscape NetworkAnalyzer revealed a fully connected network comprising 15 nodes, each with a degree of 14. Betweenness centrality was zero for every node, indicating the absence of a topological hub according to centrality metrics.

3.6. Activin/SMAD and FSH/cAMP Pathway Promoter Scanning for Regulatory Motifs

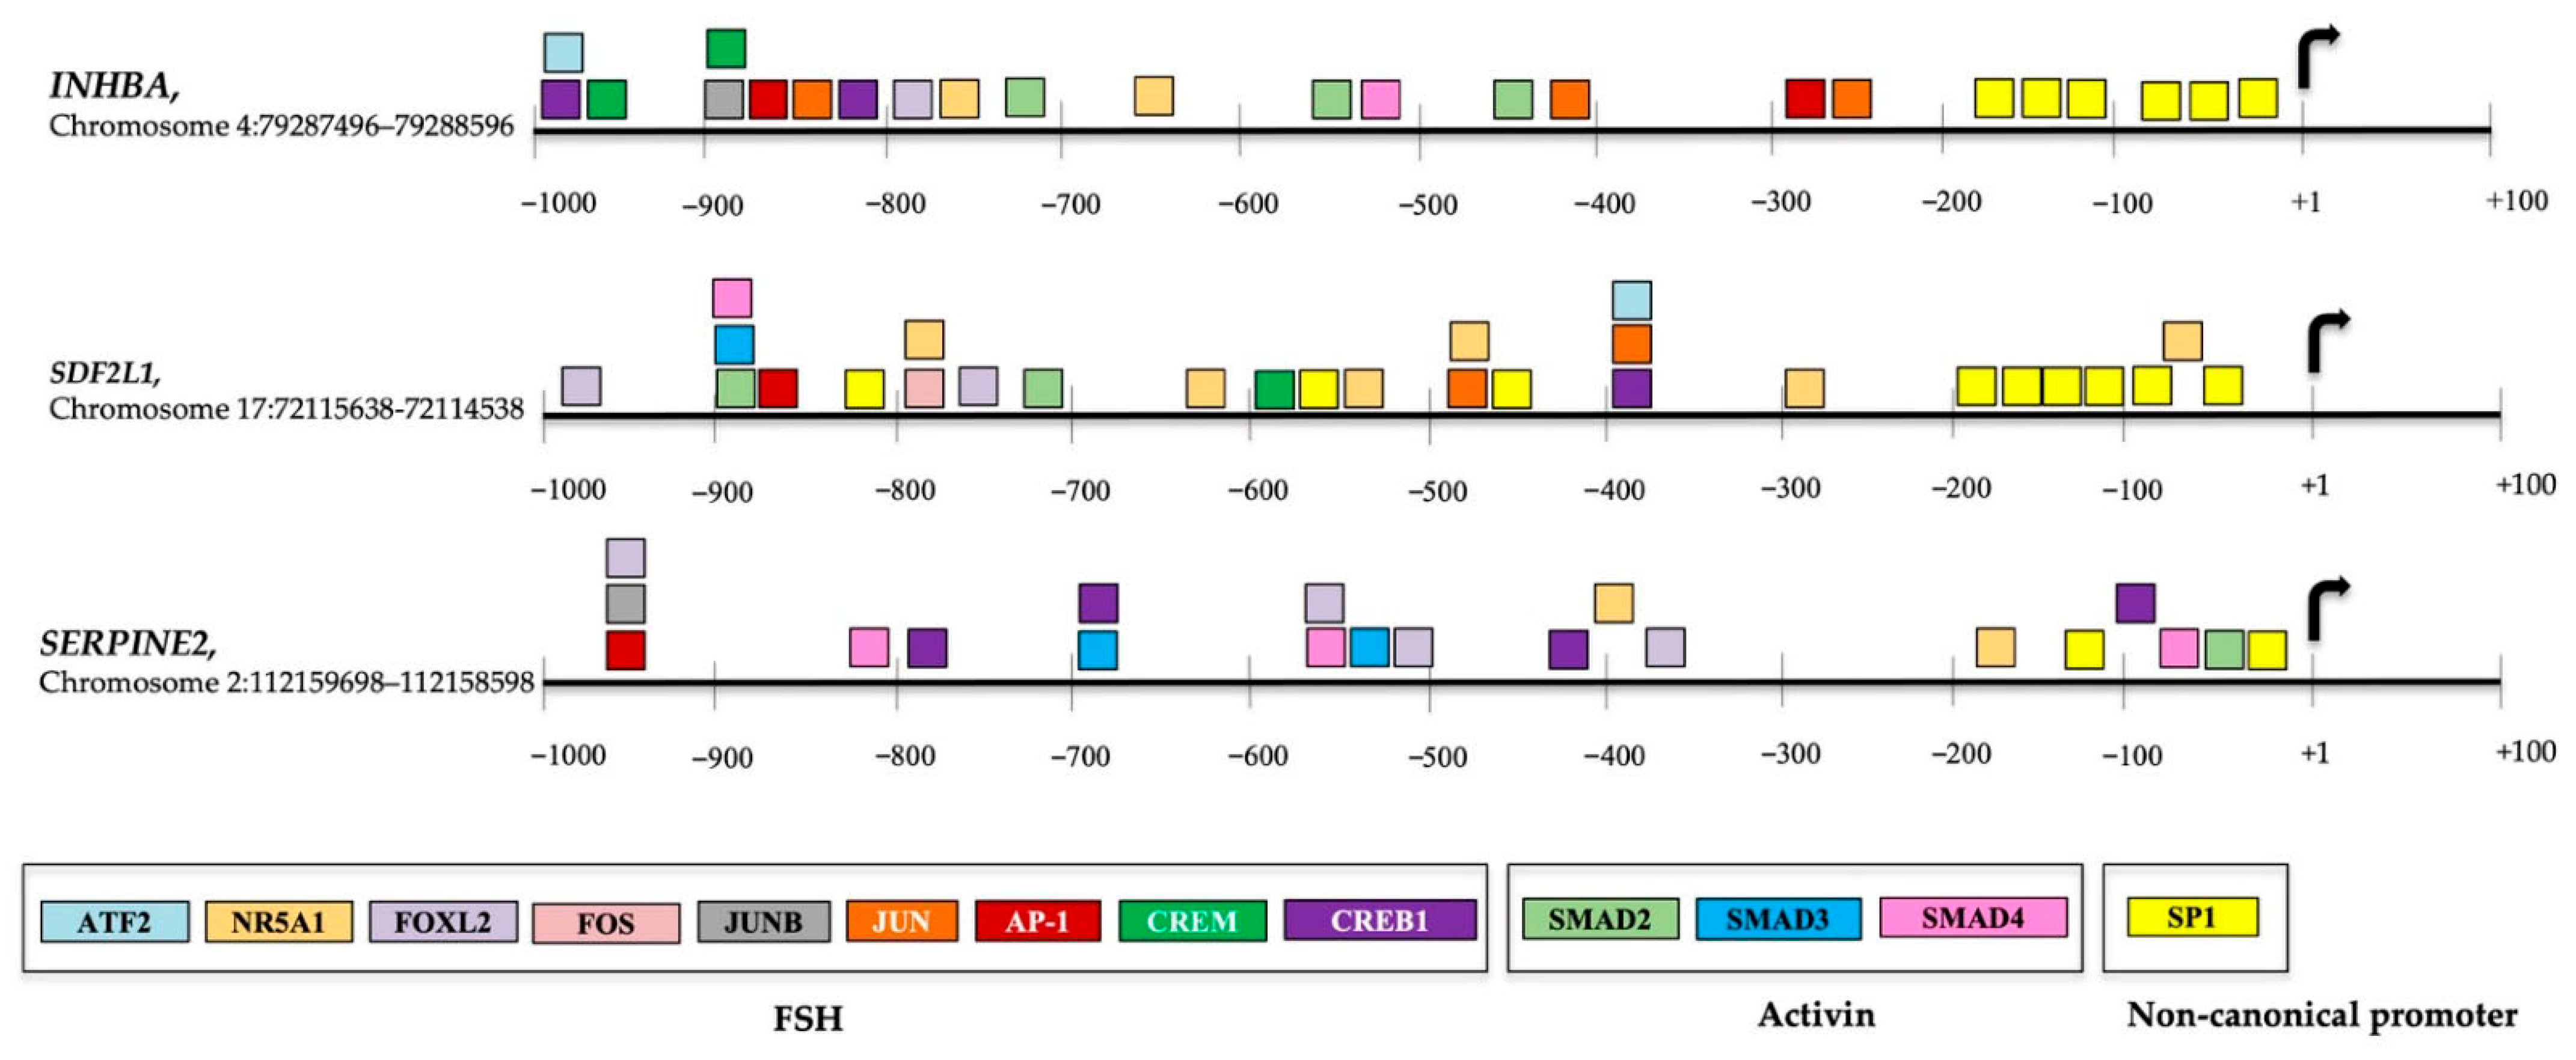
Putative activin- and FSH-related motifs (p ≤ 1 × 10⁻³) were identified across the −1000 to +100 promoter windows of INHBA, SDF2L1, and SERPINE2 (Figure 7). In the INHBA promoter, SMAD-associated motifs were mainly distributed in the distal-to-intermediate region (approximately −710 to −440), including a SMAD4 site around −548, whereas SP1 motifs were strongly enriched in the proximal promoter, forming a dense cluster upstream of the TSS; the complete list of INHBA motif occurrences is provided in Table S3. In addition to SMAD/SP1, INHBA showed the highest density of FSH-linked regulatory motifs, with multiple predicted sites for CREB/CREM and AP-1 pathway effectors spread across the distal promoter (approximately −990 to −720), including several AP-1 family motifs (FOS/JUN/JUNB/AP-1) concentrated in the −900 to −760 interval, and further FSH-related motifs occurring in mid-promoter segments (approximately −650 to −430) and again closer to the −300 region (Figure 7; Table S3). In SDF2L1, SMAD motifs showed a distribution with distal sites near the −1000 region, with a prominent set around ~−899 to −715, while SP1 motifs were detected both in mid-promoter segments and in the proximal region near the TSS; all SDF2L1 motif hits are reported in Table S4. FSH-related motifs in SDF2L1 appeared as isolated sites across the distal promoter (approximately ~−990 to −600) and mid/proximal regions (~−530 to −200), in addition to motifs located near the TSS, where SP1 sites were also evident (Figure 7; Table S4). In SERPINE2, SMAD3/SMAD4 motifs were detected in distal and intermediate regions (around ~−800, ~−700, and ~−550), with additional proximal SMAD-associated motifs close to the TSS, including an SMAD2 site at approximately −50 to −45 and an SMAD4 site at approximately −40 to −34, together with SP1 sites located close to the TSS. Additionally, it contained several FSH-linked motifs distributed across the promoter, including distal sites near the −1000 region and additional motifs spanning approximately −820 to −500, with further predicted hits in mid-to-proximal segments (approximately −430 to −110) (Figure 7). The whole SERPINE2 motif output is provided in Table S5. The AME results indicated that, when the INHBA, SDF2L1, and SERPINE2 promoters were evaluated as a foreground set against dinucleotide-preserving shuffled controls, FOXL2 and NR5A1/SF1 showed the strongest nominal signals within the FSH/cAMP-related motif collection, with predicted occurrences in two of the three promoters. The AME output also supported recurrent detection of SMAD- and SP-family motifs across the promoter set, consistent with the FIMO positional motif maps. Although no motif reached the predefined significance threshold after multiple-testing correction (Table S6)

4. Discussion

This study refines the identification of secretion-related candidates within the bovine cumulus–oocyte complex (COC) by integrating compartment enrichment with multi-tissue co-expression, thereby prioritizing co-regulated modules that may support follicular crosstalk.
Guided by this framework, we prioritized candidates predicted to be secreted or to participate in secretory pathway function, and we used compartment enrichment as an initial criterion consistent with potential roles in follicular crosstalk. This approach yielded a focused set of 13 candidate secretion/secretory pathway genes, which are compatible with follicular crosstalk and were prioritized based on coordinated expression patterns. Because paracrine mediators must arise from defined cellular sources within the COC, we next evaluated whether these candidates exhibit consistent compartment-specific expression between cumulus cells and oocytes using two independent bovine COC RNA-seq datasets (GSE199210 and GSE99678). Several transcripts were consistently higher in granulosa/cumulus cells across both studies, including TIMP1, POSTN, CTSK, SERPINE2, SRGN, PSAP, INHBA, and CARTPT, supporting a cumulus-dominant program characterized by extracellular matrix remodeling [26,28,30,33], secretion/vesicle-associated processes [37], together with signaling features compatible with follicular crosstalk. In contrast, SRPX, P4HA3, SDF2L1, PTGS2, and OOSP1 were consistently enriched in oocytes, indicating that the oocyte transcriptome also contributes to extracellular matrix remodeling [34,39,40], protein folding in the endoplasmic reticulum (ER) [38], prostaglandin E2 synthesis [36], and disruption of oocyte granulosa/cell communications [31].
Once the compartment-specific expression within the COC was established, we next examined whether the candidate genes form consistent expression groups across different tissue types. PCA revealed two prominent groupings: Group I included P4HA3 (ECM remodeling), PTGS2 (prostaglandin synthesis), INHBA (activin/intra-follicular signaling), SERPINE2 (ECM remodeling), and SDF2L1 (protein folding), while Group II was dominated by ECM turnover and proteolysis control genes TIMP1, POSTN, CTSK, and PSAP. These coordinated patterns led to correlation-based analyses to identify the most tightly linked modules. To refine these PCA-defined groupings at higher resolution, we next examined the pairwise co-expression structure using hierarchical clustering. The resulting heatmap partitioned the gene set into seven correlated clades, reinforcing the same coordinated expression patterns observed in the PCA. In particular, clade I is composed of POSTN, TIMP1, CTSK, SRGN, and PSAP, and clade II is shaped by INHBA, SERPINE2, and SDF2L1, the strongest within-group correlation signals in the heatmap, indicating that the PCA-defined modules are not only spatially co-localized in the PC1-PC2 projection but also represent the most robustly correlated gene groups in the pairwise gene–gene correlation structure revealed by the heatmap and network analyses. After constructing the Cytoscape correlation network, clade II emerged as the most prominent positive co-expression unit, supporting the interpretation that these genes track together across tissues more tightly than any other grouping identified in the hierarchical clustering and PCA. This result is striking because it implies a tightly coupled regulatory module whose co-expression persists across diverse tissues, consistent with a shared regulatory process rather than a single gene tissue-specific marker.
INHBA encodes the βA subunit of activin and inhibin proteins, members of the TGF-β superfamily. The homodimerization of two βA subunits produces activin A, while heterodimerization with βB or αC subunits yields activin AB and inhibin A, respectively [41]. Activins and inhibins act in an antagonistic manner: activins stimulate pituitary FSH secretion, whereas inhibins suppress it [42]. At the ovarian level, Activin A also regulates intraovarian processes, including follicle assembly, by stimulating granulosa cell proliferation and upregulating FSH receptor expression, reinforcing FSH responsiveness in an autocrine feedback loop [43]. Also, it is well established that FSH markedly induces INHBA transcription in granulosa cells, thereby increasing activin A synthesis during follicular growth. This interplay produces a self-reinforcing signaling circuit in which FSH activates INHBA expression via the cAMP/PKA pathway. At the same time, the resulting activin A amplifies SMAD2/3–SMAD4 transcriptional activity, thereby sustaining a growth-promoting granulosa phenotype [41].
SERPINE2 encodes a serine protease inhibitor that inhibits the plasminogen activator system, reducing plasmin generation and thereby ECM degradation [28], which regulates proteolysis during ovarian tissue remodeling [44]. In humans, SERPINE2 expression was higher in granulosa/cumulus cells surrounding immature oocytes than in those surrounding mature oocytes [45]. Also, it is differentially expressed in granulosa cells of dominant bovine follicles [46]. Lu et al. [47] demonstrated that SERPINE2 protein supplementation during IVM improved mouse COC compaction and reduced HAS2 expression, leading to decreased hyaluronan content and the maintenance of bidirectional communications between granulosa/cumulus cells and the oocyte. Notably, the FSH stimulates SERPINE2 expression in bovine granulosa cell cultures [47]. Functionally, the anti-proteolytic effects of SERPINE2 help maintain follicular ECM architecture during the antral growth phase but must be attenuated near ovulation to permit cumulus expansion and follicle rupture [45].
SDF2L1 encodes a secretory pathway-associated, endoplasmic reticulum (ER)-resident chaperone involved in the BiP folding cycle and in maintaining ER homeostasis under secretory stress [38]. SDF2L1 protein was initially captured by us in silico in a secretome filter because it carries an N-terminal signal peptide that routes the protein into the classical secretory pathway. However, curated observations indicate that SDF2L1 protein is predominantly an endoplasmic reticulum (ER) luminal protein, retained via a C-terminal ER retrieval/retention motif (HDEL) (Table S1), and therefore is not generally reported as a soluble secreted factor under physiological conditions. Despite this, SDF2L1 gene remains highly relevant to our biological question because its most substantial value in our dataset is its exceptionally stable co-expression with INHBA and SERPINE2, rather than its predicted secretion.
INHBA, SERPINE2, and SDF2L1 consistently functioned as a tightly coordinated unit across multi-tissue analyses, forming the strongest positive co-expression module. This pattern suggests that their coupling may reflect, at least in part, shared transcriptional control. Consequently, there is a clear rationale for examining promoter architecture for common transcription factor binding motifs that could mechanistically explain their coordinated expression, particularly within signaling pathways relevant to COC function, such as the activin/TGF-β (SMAD-mediated) and FSH/cAMP transcriptional programs. Activin/TGF-β signals classically converge on SMAD2/3 phosphorylation and SMAD4-mediated nuclear complexes, which regulate target promoters either directly through SMAD-binding elements or indirectly via cooperation with cofactors such as SP1/Sp-family proteins and AP-1 components (JUN/FOS) that help shape context-specific responses [48,49,50]. In parallel, FSH signaling primarily activates the cAMP/PKA axis, leading to CREB/ATF family activity on CRE-like elements [51], and can also engage GC-box/Sp1 regulation [52] and steroidogenic transcription factors NR5A1/SF-1 [53]. Within this framework, promoter regions were examined to assess the presence of motifs corresponding to pathway-responsive factors in both proximal and distal regulatory regions of the three genes. Promoter analyses revealed a non-random co-occurrence of activin/SMAD- and FSH/cAMP-associated motif families at all three promoters. In INHBA, SMAD-related motifs were distributed from the distal to intermediate segments. This promoter also exhibited a high density of SP1 motifs near the transcription start site (TSS). Multiple FSH/cAMP-linked motifs were detected, including CREB and CREM family motifs in the distal region and steroidogenic factor motifs (NR5A1/SF-1 and FOXL2) and AP-1-related motifs (FOS/JUN/JUNB) in the intermedia region. In SDF2L1, SMAD-associated motifs were located in the distal promoter region, while SP1 motifs were prominent near the TSS along with NRA5A1/SF-1. Predicted FSH/cAMP-associated motifs, including CREB, CREM, ATF, and AP-1 family motifs, appeared in distal to intermediate regions. SERPINE2 exhibited SMAD-associated motifs in distal, intermediate, and proximal regions. SMAD motifs were also identified along multiple SP1 sites near the TSS. FSH/cAMP-associated motifs spanned the mid-to-proximal segments and included CREB, FOXL2, and AP-1 family motifs, as well as NR5A1/SF-1- and FOXL2-like sites. Additionally, NR5A1/SF-1 and CREB were detected close to the TSS in proximity to SP1 motifs. The enrichment of SP1 motifs near the TSS across all three promoters is consistent with a shared TATA-less, GC-rich (non-canonical) core promoter architecture. In line with this interpretation, we explicitly searched for a canonical TATA box in the −50 to 1 bp region preceding the TSS but did not detect a clear TATA motif in any of the three sequences. The identification of SMAD-linked motifs, SP1-enriched proximal regions, and recurring FSH/cAMP-responsive motif families in INHBA, SERPINE2, and SDF2L1 indicates a mechanistic basis for their coordinated expression. The identification of SMAD-linked motifs, SP1-enriched proximal regions, and recurring FSH/cAMP-responsive motif families in INHBA, SERPINE2, and SDF2L1 indicates a mechanistic basis for their coordinated expression. These findings support the idea that the cooperative action between activin and FSH regulates this gene triad.
Integrating these strands supports a coherent stage-based model in which endocrine FSH/cAMP signaling, together with activin/TGF-β-SMAD inputs, converges on shared upstream regulatory mechanisms that are consistent with the INHBA-SERPINE2-SDF2L1 co-regulated module. The antral-to-preovulatory phase is strongly driven by FSH signaling in granulosa cells [54]. Because FSH is the dominant endocrine driver during this phase, an important next question is how local paracrine cues modulate the magnitude and persistence of FSH responses. The promoter architecture of INHBA, which is enriched for both SMAD-associated motifs and FSH/cAMP-responsive elements, aligns with a feed-forward endocrine–paracrine loop in granulosa/cumulus cells. In this framework, locally produced activin A activates canonical SMAD signaling, a process reported to increase follicle-stimulating hormone receptor (FSHR) expression and thereby sensitize granulosa cells to FSH [43]. Following FSH binding to FSHR, the cAMP/PKA pathway is activated, leading to CREB/ATF-mediated transcriptional outputs [55] that may further enhance INHBA transcription in a promoter-permissive context. Increased INHBA expression would elevate activin A availability, providing additional SMAD-dependent reinforcement and maintaining FSH responsiveness. As follicles near ovulation, the system shifts toward spatially restricted tissue remodeling and proteolysis to enable follicular rupture and luteinization, processes that require ECM reorganization [56]. In this context, FSH, in conjunction with activin A, may prevent premature or excessive proteolytic ECM degradation by inducing SERPINE2. Increased SERPINE2 is expected to limit protease activation and regulate cumulus expansion, while a coordinated decrease or spatial restriction of SERPINE2 facilitates the peri-ovulatory remodeling cascade [46]. Concurrently, SDF2L1, which is primarily expressed in the oocyte and serves as an endoplasmic reticulum (ER)-resident folding factor [38], may support the increased protein synthesis and processing required for oocyte maturation. These findings suggest that the INHBA–SERPINE2–SDF2L1 module constitutes a co-regulation framework supported by consistent co-expression and promoter motif convergence, rather than evidence of a purely paracrine signaling cascade, that integrates endocrine signals (FSH), paracrine reinforcement (activin/SMAD), regulation of matrix remodeling (SERPINE2), and proteostasis capacity (SDF2L1).

5. Conclusions

Integrated transcriptomic, co-expression, and promoter analyses support the proposed model of INHBA, SERPINE2, and SDF2L1 regulation during the antral-to-peri-ovulatory transition in the bovine cumulus–oocyte complex. Follicle-stimulating hormone signaling in cumulus and granulosa cells, mediated by the cAMP/PKA–CREB pathway, acts in concert with locally produced activin A to reinforce SMAD-dependent transcriptional responses. These results suggest that endocrine and paracrine signals may converge on a shared upstream transcriptional control module involving INHBA, SERPINE2, and SDF2L1. In cumulus and granulosa cells, the coordinated regulation of INHBA and SERPINE2 facilitates controlled extracellular matrix remodeling by limiting premature protease activation, thereby modulating cumulus expansion. In the oocyte, SDF2L1 expression reflects the integration of follicular crosstalk cues with increased endoplasmic reticulum protein folding and processing capacity required for oocyte maturation. This mechanistic framework now requires direct experimental validation in future studies.

Supplementary Materials

The following supporting information can be downloaded at: https://www.mdpi.com/article/10.3390/applbiosci5020026/s1, Figure S1: Normalized quantitative RT–qPCR expression profiling of the candidate secretion/secretory pathway genes across bovine tissues; Figure S2: Differential expression of candidate secretion/secretory pathway genes between cumulus cells and oocytes in GSE199210; Table S1: Sequence information for candidate secretion/secretory pathway proteins; underlined residues indicate the predicted signal peptide; Table S2: Differential expression analysis of selected genes between cumulus cells (CC) and oocytes in GSE99678 using DESeq2; Table S3: FIMO output of predicted FSH/cAMP-, SMAD-, and SP-family motif matches in the INHBA promoter sequence; Table S4: FIMO output of predicted FSH/cAMP-, SMAD-, and SP-family motif matches in the SDF2L1 promoter sequence; Table S5: FIMO output of predicted FSH/cAMP-, SMAD-, and SP-family motif matches in the SERPINE2 promoter sequence; Table S6: Analysis of Motif Enrichment (AME) results for the combined promoter set of INHBA, SDF2L1, and SERPINE2; Table S7: Protein sequences of all screened gene-derived candidates, with stepwise filtering outcomes used to define the final putative secreted proteins.

Author Contributions

Conceptualization, M.B.-B., B.E.C.-V. and T.J.V.-M.; methodology and software, Á.V.-C.; validation, B.S.-R.; formal analysis, M.A.F.-M.; investigation, M.B.-B.; resources, B.E.C.-V. and T.J.V.-M.; data curation, B.E.C.-V. and M.B.-B.; writing—original draft preparation, B.S.-R.; writing—review and editing, M.B.-B.; funding acquisition, M.B.-B. All authors have read and agreed to the published version of the manuscript.

Funding

This research was supported by Grant CB-2011-01-168981 from the Consejo Nacional de Ciencia y Tecnología (CONACyT), Mexico. B. E. Castro-Valenzuela and T.J. Vega-Montoya were CONACYT scholarship recipients in Mexico, with registration numbers 292704 and 2081566, respectively.

Institutional Review Board Statement

Not applicable.

Informed Consent Statement

Not applicable.

Data Availability Statement

The original contributions presented in this study are included in the article and Supplementary Materials. Further inquiries can be directed to the corresponding author.

Conflicts of Interest

The authors declare no conflicts of interest.

Abbreviations

The following abbreviations are used in this manuscript:
BCBBrilliant cresyl blue
COCCumulus–oocyte complex
ECMExtracellular matrix
EREndoplasmic reticulum
ESTsExpressed sequence tags
FSHFollicle-stimulating hormone
GPCRG-protein coupled receptor
LHLuteinizing hormone
NCBINational Center for Biotechnology Information
NTCNo-template control
PCAPrincipal component analysis
TSSTranscription start site

References

  1. Orozco-Galindo, B.V.; Sánchez-Ramírez, B.; González-Trevizo, C.L.; Castro-Valenzuela, B.; Varela-Rodríguez, L.; Burrola-Barraza, M.E. Folliculogenesis: A Cellular Crosstalk Mechanism. Curr. Issues Mol. Biol. 2025, 47, 113. [Google Scholar] [CrossRef]
  2. Xie, J.; Xu, X.; Liu, S. Intercellular Communication in the Cumulus–Oocyte Complex during Folliculogenesis: A Review. Front. Cell Dev. Biol. 2023, 11, 1087612. [Google Scholar] [CrossRef] [PubMed]
  3. Andrade, G.M.; del Collado, M.; Meirelles, F.V.; da Silveira, J.C.; Perecin, F. Intrafollicular Barriers and Cellular Interactions during Ovarian Follicle Development. Anim. Reprod. 2019, 16, 485–496. [Google Scholar] [CrossRef] [PubMed]
  4. Kaushik, T.; Mishra, R.; Singh, R.K.; Bajpai, S. Role of Connexins in Female Reproductive System and Endometriosis. J. Gynecol. Obstet. Hum. Reprod. 2020, 49, 101705. [Google Scholar] [CrossRef]
  5. Alam, M.H.; Miyano, T. Interaction between Growing Oocytes and Granulosa Cells In Vitro. Reprod. Med. Biol. 2020, 19, 13–23. [Google Scholar] [CrossRef]
  6. Marchais, M.; Gilbert, I.; Bastien, A.; Macaulay, A.; Robert, C. Mammalian Cumulus-Oocyte Complex Communication: A Dialog through Long and Short Distance Messaging. J. Assist. Reprod. Genet. 2022, 39, 1011–1025. [Google Scholar] [CrossRef] [PubMed]
  7. Strączyńska, P.; Papis, K.; Morawiec, E.; Czerwiński, M.; Gajewski, Z.; Olejek, A.; Bednarska-Czerwińska, A. Signaling Mechanisms and Their Regulation during In Vivo or In Vitro Maturation of Mammalian Oocytes. Reprod. Biol. Endocrinol. 2022, 20, 37. [Google Scholar] [CrossRef] [PubMed]
  8. Kidder, G.; Vanderhyden, B. Biderctional communication between oocytes and follicle cells: Ensuring oocyte developmentlal competence. Can. J. Physiol. Pharmacacol. 2010, 88, 399–413. [Google Scholar] [CrossRef]
  9. Mottershead, D.G.; Ritter, L.J.; Gilchrist, R.B. Signalling Pathways Mediating Specific Synergistic Interactions between GDF9 and BMP15. Mol. Hum. Reprod. 2012, 18, 121–128. [Google Scholar] [CrossRef] [PubMed]
  10. Sugiura, K.; Su, Y.Q.; Diaz, F.J.; Pangas, S.A.; Sharma, S.; Wigglesworth, K.; O’Brien, M.J.; Matzuk, M.M.; Shimasaki, S.; Eppig, J.J. Erratum: Oocyte-Derived BMP15 and FGFs Cooperate to Promote Glycolysis in Cumulus Cells (Development Vol. 134 (2593-2603)). Development 2008, 135, 786. [Google Scholar] [CrossRef]
  11. Mottershead, D.G.; Sugimura, S.; Al-Musawi, S.L.; Li, J.J.; Richani, D.; White, M.A.; Martin, G.A.; Trotta, A.P.; Ritter, L.J.; Shi, J.; et al. Cumulin, an Oocyte-Secreted Heterodimer of the Transforming Growth Factor-β Family, Is a Potent Activator of Granulosa Cells and Improves Oocyte Quality. J. Biol. Chem. 2015, 290, 24007–24020. [Google Scholar] [CrossRef] [PubMed]
  12. Pangas, S.A.; Rademaker, A.W.; Fishman, D.A.; Woodruff, T.K. Localization of the Activin Signal Transduction Components in Normal Human Ovarian Follicles: Implications for Autocrine and Paracrine Signaling in the Ovary. J. Clin. Endocrinol. Metab. 2002, 87, 2644–2657. [Google Scholar] [CrossRef]
  13. Wang, Y.; Kong, N.; Li, N.; Hao, X.; Wei, K.; Xiang, X.; Xia, G.; Zhang, M. Epidermal Growth Factor Receptor Signaling-Dependent Calcium Elevation in Cumulus Cells is Required for NPR2 Inhibition and Meiotic Resumption in Mouse Oocytes. Endocrinology 2013, 154, 3401–3409. [Google Scholar] [CrossRef] [PubMed]
  14. Tsuji, T.; Kiyosu, C.; Akiyama, K.; Kunieda, T. CNP/NPR2 Signaling Maintains Oocyte Meiotic Arrest in Early Antral Follicles and Is Suppressed by EGFR-Mediated Signaling in Preovulatory Follicles. Mol. Reprod. Dev. 2012, 79, 795–802. [Google Scholar] [CrossRef] [PubMed]
  15. Xu, R.; Pan, M.; Yin, L.; Zhang, Y.; Tang, Y.; Lu, S.; Gao, Y.; Wei, Q.; Han, B.; Ma, B. C-Type Natriuretic Peptide Pre-Treatment Improves Maturation Rate of Goat Oocytes by Maintaining Transzonal Projections, Spindle Morphology, and Mitochondrial Function. Animals 2023, 13, 3880. [Google Scholar] [CrossRef] [PubMed]
  16. Garg, G.; Ranganathan, S. Helminth Secretome Database (HSD): A Collection of Helminth Excretory/Secretory Proteins Predicted from Expressed Sequence Tags (ESTs). BMC Genom. 2012, 13, S8. [Google Scholar] [CrossRef]
  17. Bendtsen, J.D.; Nielsen, H.; Von Heijne, G.; Brunak, S. Improved Prediction of Signal Peptides: SignalP 3.0. J. Mol. Biol. 2004, 340, 783–795. [Google Scholar] [CrossRef]
  18. Bendtsen, J.D.; Kiemer, L.; Fausbøll, A.; Brunak, S. Non-Classical Protein Secretion in Bacteria. BMC Microbiol. 2005, 5, 58. [Google Scholar] [CrossRef]
  19. Emanuelsson, O.; Brunak, S.; von Heijne, G.; Nielsen, H. Locating Proteins in the Cell Using TargetP, SignalP and Related Tools. Nat. Protoc. 2007, 2, 953–971. [Google Scholar] [CrossRef]
  20. Krogh, A.; Larsson, B.; Von Heijne, G.; Sonnhammer, E.L.L. Predicting Transmembrane Protein Topology with a Hidden Markov Model: Application to Complete Genomes. J. Mol. Biol. 2001, 305, 567–580. [Google Scholar] [CrossRef] [PubMed]
  21. Biase, F.H.; Kimble, K.M. Functional Signaling and Gene Regulatory Networks between the Oocyte and the Surrounding Cumulus Cells. BMC Genom. 2018, 19, 351. [Google Scholar] [CrossRef] [PubMed]
  22. Walker, B.N.; Nix, J.; Wilson, C.; Marrella, M.A.; Speckhart, S.L.; Wooldridge, L.; Yen, C.N.; Bodmer, J.S.; Kirkpatrick, L.T.; Moorey, S.E.; et al. Tight Gene Co-Expression in BCB Positive Cattle Oocytes and Their Surrounding Cumulus Cells. Reprod. Biol. Endocrinol. 2022, 20, 119. [Google Scholar] [CrossRef]
  23. Livak, K.J.; Schmittgen, T.D. Analysis of Relative Gene Expression Data Using Real-Time Quantitative PCR and the 2−ΔΔCT Method. Methods 2001, 25, 402–408. [Google Scholar] [CrossRef] [PubMed]
  24. Deyneko, I.V.; Kel, A.E.; Kel-Margoulis, O.V.; Deineko, E.V.; Wingender, E.; Weiss, S. MatrixCatch—A Novel Tool for the Recognition of Composite Regulatory Elements in Promoters. BMC Bioinform. 2013, 14, 241. [Google Scholar] [CrossRef]
  25. Shannon, P.; Markiel, A.; Ozier, O.; Baliga, N.S.; Wang, J.T.; Ramage, D.; Amin, N.; Schwikowski, B.; Ideker, T. Cytoscape: A Software Environment for Integrated Models of Biomolecular Interaction Networks. Genome Res. 2003, 13, 2498–2504. [Google Scholar] [CrossRef]
  26. Mijanović, O.; Jakovleva, A.; Branković, A.; Zdravkova, K.; Pualic, M.; Belozerskaya, T.A.; Nikitkina, A.I.; Parodi, A.; Zamyatnin, A.A. Cathepsin K in Pathological Conditions and New Therapeutic and Diagnostic Perspectives. Int. J. Mol. Sci. 2022, 23, 13762. [Google Scholar] [CrossRef]
  27. Yang, C.; Zheng, H.; Amin, A.; Faheem, M.S.; Duan, A.; Li, L.; Xiao, P.; Li, M.; Shang, J. Follicular Atresia in Buffalo: Cocaine- and Amphetamine-Regulated Transcript (CART) and the Underlying Mechanisms. Animals 2024, 14, 2138. [Google Scholar] [CrossRef] [PubMed]
  28. Wu, S.; Yang, Y.; Zhang, M.; Khan, A.U.; Dai, J.; Ouyang, J. Serpin Peptidase Inhibitor, Clade E, Member 2 in Physiology and Pathology: Recent Advancements. Front. Mol. Biosci. 2024, 11, 1334931. [Google Scholar] [CrossRef]
  29. Bao, Y.; Li, X.; El-Samahy, M.A.; Yang, H.; Wang, Z.; Yang, F.; Yao, X.; Wang, F. Exploration the Role of INHBA in Hu Sheep Granulosa Cells Using RNA-Seq. Theriogenology 2023, 197, 198–208. [Google Scholar] [CrossRef] [PubMed]
  30. Nikolov, A.; Popovski, N.; Hristova, I. Collagenases Mmp-1, Mmp-13, and Tissue Inhibitors Timp-1, Timp-2: Their Role in Healthy and Complicated Pregnancy and Potential as Preeclampsia Biomarkers—A Brief Review. Appl. Sci. 2020, 10, 7731. [Google Scholar] [CrossRef]
  31. Tang, J.; Wu, Z.; Liu, M.; Xu, L.; Cheng, J.; Wang, C.; Zhu, X.; Zhou, X.; Yang, L.; Davis, J.S.; et al. Hypo-Glycosylated FSH Enhances the Ovarian Microenvironment for Follicular Development Compared to Fully Glycosylated FSH. Cell Commun. Signal. 2025, 24, 15. [Google Scholar] [CrossRef] [PubMed]
  32. Pan, J.; Zhou, C.; Zhou, Z.; Yang, Z.; Dai, T.; Huang, H.; Jin, L. Elevated Ovarian Pentraxin 3 in Polycystic Ovary Syndrome. J. Assist. Reprod. Genet. 2021, 38, 1231–1237. [Google Scholar] [CrossRef] [PubMed]
  33. Abudureyimu, G.; Wu, Y.; Wang, L.; Hao, G.; Chen, Y.; Yu, J.; Wu, Z.; Huang, J.; Lin, J. POSTN Promotes Granulosa Cell Proliferation in Sheep Follicles through Focal Adhesion. Gene Rep. 2024, 35, 101890. [Google Scholar] [CrossRef]
  34. Chen, Z.; Lin, Y.; Huang, Y.; Chen, Z.; Gong, Y.; Hou, Z.; Lin, L. TGF-Β1 Promotes Collagen Synthesis in Systemic Sclerosis via Upregulating P4HA3. J. Transl. Autoimmun. 2025, 11, 100323. [Google Scholar] [CrossRef] [PubMed]
  35. Fuyuki, A.; Yamamoto, S.; Sohel, M.S.H.; Homma, T.; Kitamura, K.; Onouchi, S.; Saito, S. Expression of Prosaposin and Its G Protein-Coupled Receptor (GPR) 37 in Mouse Cochlear and Vestibular Nuclei. J. Vet. Med. Sci. 2023, 85, 266. [Google Scholar] [CrossRef] [PubMed]
  36. Park, C.J.; Lin, P.C.; Zhou, S.; Barakat, R.; Bashir, S.T.; Choi, J.M.; Cacioppo, J.A.; Oakley, O.R.; Duffy, D.M.; Lydon, J.P.; et al. Progesterone Receptor Serves the Ovary as a Trigger of Ovulation and a Terminator of Inflammation. Cell Rep. 2020, 31, 107496. [Google Scholar] [CrossRef] [PubMed]
  37. Tellez-Gabriel, M.; Tekpli, X.; Reine, T.M.; Hegge, B.; Nielsen, S.R.; Chen, M.; Moi, L.; Normann, L.S.; Busund, L.T.R.; Calin, G.A.; et al. Serglycin Is Involved in TGF-β Induced Epithelial-Mesenchymal Transition and Is Highly Expressed by Immune Cells in Breast Cancer Tissue. Front. Oncol. 2022, 12, 868868. [Google Scholar] [CrossRef] [PubMed]
  38. Sasako, T.; Ohsugi, M.; Kubota, N.; Itoh, S.; Okazaki, Y.; Terai, A.; Kubota, T.; Yamashita, S.; Nakatsukasa, K.; Kamura, T.; et al. Hepatic Sdf2l1 Controls Feeding-Induced ER Stress and Regulates Metabolism. Nat. Commun. 2019, 10, 947. [Google Scholar] [CrossRef]
  39. Thant, L.; Dobashi, A.; Kitami, M.; Phyu, H.P.; Kobayashi, M.; Ono, Y.; Kakihara, Y.; Matsumoto, M.; Kaku, M. Chemical Digestion-Assisted Proteomics Reveals the Extracellular Matrix Profile of Human Periodontal Ligament and Its Alterations in Cultured Cell-Derived Extracellular Matrix. Mol. Cell. Proteom. 2025, 24, 101460. [Google Scholar] [CrossRef]
  40. Dipali, S.S.; King, C.D.; Rose, J.P.; Burdette, J.E.; Campisi, J.; Schilling, B.; Duncan, F.E. Proteomic Quantification of Native and ECM-Enriched Mouse Ovaries Reveals an Age-Dependent Fibro-Inflammatory Signature. Aging 2023, 15, 10821. [Google Scholar] [CrossRef]
  41. Knight, P.; Glister, C. Potential Local Regulatory Functions of Inhibins, Activins and Follistatin in the Ovary. Reproduction 2001, 121, 503–512. [Google Scholar] [CrossRef] [PubMed]
  42. Welt, C.; Schneyer, A. Inhibin, Activin, and Follistatin in Ovarian Physiology, 3rd ed.; Elsevier Inc.: Amsterdam, The Netherlands, 2019; ISBN 9780128132098. [Google Scholar]
  43. Knight, P.G.; Satchell, L.; Glister, C. Intra-Ovarian Roles of Activins and Inhibins. Mol. Cell. Endocrinol. 2012, 359, 53–65. [Google Scholar] [CrossRef]
  44. Lu, C.H.; Lee, R.K.K.; Hwu, Y.M.; Chu, S.L.; Chen, Y.J.; Chang, W.C.; Lin, S.P.; Li, S.H. SERPINE2, a Serine Protease Inhibitor Extensively Expressed in Adult Male Mouse Reproductive Tissues, May Serve as a Murine Sperm Decapacitation Factor. Biol. Reprod. 2011, 84, 514–525. [Google Scholar] [CrossRef] [PubMed]
  45. Cao, M.; Nicola, E.; Portela, V.M.; Price, C.A. Regulation of Serine Protease Inhibitor-E2 and Plasminogen Activator Expression and Secretion by Follicle Stimulating Hormone and Growth Factors in Non-Luteinizing Bovine Granulosa Cells In Vitro. Matrix Biol. 2006, 25, 342–354. [Google Scholar] [CrossRef] [PubMed]
  46. Bédard, J.; Brûlé, S.; Price, C.A.; Silversides, D.W.; Lussier, J.G. Serine Protease Inhibitor-E2 (SERPINE2) Is Differentially Expressed in Granulosa Cells of Dominant Follicle in Cattle. Mol. Reprod. Dev. 2003, 64, 152–165. [Google Scholar] [CrossRef] [PubMed]
  47. Lu, C.H.; Lee, R.K.K.; Hwu, Y.M.; Lin, M.H.; Yeh, L.Y.; Chen, Y.J.; Lin, S.P.; Li, S.H. Involvement of the Serine Protease Inhibitor, SERPINE2, and the Urokinase Plasminogen Activator in Cumulus Expansion and Oocyte Maturation. PLoS ONE 2013, 8, e74602. [Google Scholar] [CrossRef] [PubMed]
  48. Zhang, Y.; Feng, X.H.; Derynck, R. Smad3 and Smad4 Cooperate with C-Jun/c-Fos to Mediate TGF-Beta-Induced Transcription. Nature 1998, 394, 909–913. [Google Scholar] [CrossRef]
  49. Feng, X.H.; Lin, X.; Derynck, R. Smad2, Smad3 and Smad4 Cooperate with Sp1 to Induce P15Ink4B Transcription in Response to TGF-β. EMBO J. 2000, 19, 5178–5193. [Google Scholar] [CrossRef] [PubMed]
  50. Liu, C.; Chang, H.M.; Yi, Y.; Fang, Y.; Zhao, F.; Leung, P.C.K.; Yang, X. ALK4-SMAD2/3-SMAD4 Signaling Mediates the Activin A-Induced Suppression of PTX3 in Human Granulosa-Lutein Cells. Mol. Cell. Endocrinol. 2019, 493, 110485. [Google Scholar] [CrossRef]
  51. Rice, S.; Elia, A.; Jawad, Z.; Pellatt, L.; Mason, H.D. Metformin Inhibits Follicle-Stimulating Hormone (FSH) Action in Human Granulosa Cells: Relevance to Polycystic Ovary Syndrome. J. Clin. Endocrinol. Metab. 2013, 98, E1491–E1500. [Google Scholar] [CrossRef] [PubMed]
  52. Anjali, G.; Kaur, S.; Lakra, R.; Taneja, J.; Kalsey, G.S.; Nagendra, A.; Shrivastav, T.G.; Gouri Devi, M.; Malhotra, N.; Kriplani, A.; et al. FSH Stimulates IRS-2 Expression in Human Granulosa Cells through CAMP/SP1, an Inoperative FSH Action in PCOS Patients. Cell. Signal. 2015, 27, 2452–2466. [Google Scholar] [CrossRef] [PubMed]
  53. Law, N.C.; Weck, J.; Kyriss, B.; Nilson, J.H.; Hunzicker-Dunn, M. Lhcgr Expression in Granulosa Cells: Roles for PKA-Phosphorylated β-Catenin, TCF3, and FOXO1. Mol. Endocrinol. 2013, 27, 1295–1310. [Google Scholar] [CrossRef]
  54. Hayes, E.; Winston, N.; Stocco, C. Molecular Crosstalk between Insulin-like Growth Factors and Follicle-Stimulating Hormone in the Regulation of Granulosa Cell Function. Reprod. Med. Biol. 2024, 23, e12575. [Google Scholar] [CrossRef] [PubMed]
  55. Hunzicker-Dunn, M.; Maizels, E.T. FSH Signaling Pathways in Immature Granulosa Cells That Regulate Target Gene Expression: Branching out from Protein Kinase A. Cell. Signal. 2006, 18, 1351–1359. [Google Scholar] [CrossRef]
  56. Zaniker, E.J.; Zhang, J.; Russo, D.; Huang, R.; Suritis, K.; Drake, R.S.; Barlow-Smith, E.; Shalek, A.K.; Woodruff, T.K.; Xiao, S.; et al. Follicle-Intrinsic and Spatially Distinct Molecular Programs Drive Follicle Rupture and Luteinization during Ex Vivo Mammalian Ovulation. Nature 2024, 7, 1374. [Google Scholar] [CrossRef] [PubMed]
Figure 1. Two-phase bioinformatic workflow for identifying candidate secretion/secretory pathway proteins from bovine cumulus–oocyte complex (COC) transcript resources. The arrows indicate the direction of the workflow and decision steps in the bioinformatic pipeline. Phase I: COC-associated expressed sequence tags (ESTs) were retrieved from NCBI, linked to their corresponding mRNA sequences, and translated into predicted peptides with EMBOSS Transeq. Phase II: Peptides were screened for classical secretion using SignalP (D-score > 0.5). If the D-score was ≤0.5, SecretomeP was used to screen for non-classical secretion (NN-score ≥ 0.9). Sequences failing these criteria were classified as non-secreted. Predicted mitochondrial proteins (TargetP) and proteins with transmembrane α-helices (TMHMM) were excluded to generate the final set of candidate secretion/secretory pathway proteins.
Applbiosci 05 00026 g001
Figure 2. Stepwise identification of candidate secretion/secretory pathway proteins using the bioinformatics pipeline. (A) Proteins predicted as secreted by SignalP (classical secretion) and SecretomeP (non-classical secretion). (B) TargetP-based subcellular localization of proteins assigned to the secretory pathway, including exclusion of mitochondrial and other non-secretory predictions. (C) TMHMM filtering to remove proteins with predicted transmembrane helices, yielding the final set of candidates secreted or secretory pathway-associated proteins.
Applbiosci 05 00026 g002
Figure 3. Differential expression of candidate secretion/secretory pathway genes between cumulus cells and oocytes in GSE99678. (A) displays the genes with the highest expression in cumulus cells, whereas (B) displays the genes with the highest expression in oocytes. Violin plots show DESeq2 variance-stabilized (VST) normalized expression values in cumulus cells (teal) and oocytes (pink) from individual bovine cumulus–oocyte complexes (COCs); points represent individual samples. The width of each violin reflects the density of observations at a given expression level. Differential expression statistics (log2 fold change and FDR-adjusted p-values) were obtained using DESeq2 (Wald test) based on Salmon-derived raw counts summarized at the gene level with tximport. Log2 fold changes represent the contrast between cumulus cells versus oocytes (log2(CC/oocyte)). Genes with FDR < 0.05 were considered statistically significant.
Applbiosci 05 00026 g003
Figure 4. PCA biplot showing the relationship between bovine tissues and the expression patterns of candidate secretion/secretory pathway genes identified from cumulus–oocyte complex (COC) ESTs. Tissues are shown as blue points and genes as green triangles; red vectors represent gene loadings, indicating the direction and magnitude of each gene’s contribution to separation along PC1 and PC2.
Applbiosci 05 00026 g004
Figure 5. Hierarchical clustering heatmap of Pearson correlation coefficients computed from the binary presence/absence matrix (present = 1; absent = 0) for the 13 candidate secretion/secretory pathway genes across bovine tissues, illustrating co-detection (co-occurrence) relationships. Correlations are displayed as a color gradient, with warmer colors indicating stronger positive correlations; more red indicates higher correlation values. Genes are grouped by unsupervised hierarchical clustering to reveal co-expression patterns.
Applbiosci 05 00026 g005
Figure 6. Cytoscape network based on correlations computed from binary presence/absence calls across tissues (present = 1; absent = 0) of candidate secretion/secretory pathway genes across bovine tissues. Nodes represent genes, and edges represent pairwise associations computed by the MetScape correlation calculator, with edge attributes including Corr.pcor (correlation coefficient), Corr.pval (nominal p-value), and Corr.adj.pval (multiple-testing–adjusted p-value). Edge color indicates the sign of the association (positive vs. negative), and edge width reflects correlation strength (larger |Corr.pcor| values). For interpretative purposes, moderate-to-strong associations were defined as |Corr.pcor| ≥ 0.30; nominal support was assessed using Corr.pval < 0.05.
Applbiosci 05 00026 g006
Figure 7. Distribution of predicted activin/SMAD- and FSH/cAMP-associated transcription factor binding motifs across the bovine INHBA, SDF2L1, and SERPINE2 promoter regions. Promoters were defined as −1000 to +100 bp relative to the transcription start site (TSS; +1) using the ARS-UCD2.0 assembly (INHBA: NC_037331.1:79287496–79288596; SDF2L1: NC_037344.1:c72112797–72111697; SERPINE2: NC_037329.1:c112159698–112158598). Colored boxes indicate the positions of significant motif occurrences (p ≤ 0.001) identified with FIMO using JASPAR PWMs for activin pathway mediators (SMAD2, SMAD3, and SMAD4), FSH/cAMP-related regulators (ATF2, NR5A1, FOXL2, FOS, JUNB, JUN, AP-1, CREM, and CREB1), and SP1 (GC-box/Sp-family; TATA-less/non-canonical promoter indicator). The horizontal axis shows distance to the TSS, and the curved arrow marks the transcription start site at +1 and the direction of transcription.
Applbiosci 05 00026 g007
Table 1. Bovine EST libraries used for bioinformatic analysis, including library accession numbers, number of cDNAs per library, and cell source.
Library (Access No.)No. of cDNAs in LibrarySource
LIBEST_015638230Oocyte
LIBEST_0281211Oocyte
LIBEST_0173308Oocyte
LIBEST_00552113Oocyte
LIBEST_01679031Oocyte
LIBEST_0281201Oocyte and pre-implantation embryo
LIBEST_0157373Oocyte
LIBEST_0283121Oocyte
LIBEST_0154061724Oocyte, embryonic, placental, and reproductive tract cell types
LIBEST_0141875Cumulus–oocyte complex
LIBEST_0051246Cumulus–oocyte complex
LIBEST_00512513Cumulus–oocyte complex
LIBEST_02055091Granulosa and oocyte
LIBEST_01694825Granulosa and oocyte
LIBEST_0145937Granulosa and oocyte
LIBEST_0144847Granulosa and oocyte
Table 3. Binary detectability matrix of RT–qPCR outcomes across bovine tissues. Values indicate transcript detection status (1 = present; 0 = absent), defined using a Ct threshold (present, Ct < 35; absent/undetermined, Ct ≥ 35).
Gene/TissueHeartLungKidneyLiverSpleenMuscleTesticle Fetal TesticleOvaryFetal Ovary
TIMP11111011111
PTX30100001110
POSTN1111011111
P4HA31000001111
CTSK1111011111
SERPINE 21101011111
SRGN1111011111
CARTPT0110001010
SDF2L11101011111
PTGS20001010110
PSAP1111011111
INHBA1101011111
OOSP10110110111
Disclaimer/Publisher’s Note: The statements, opinions and data contained in all publications are solely those of the individual author(s) and contributor(s) and not of MDPI and/or the editor(s). MDPI and/or the editor(s) disclaim responsibility for any injury to people or property resulting from any ideas, methods, instructions or products referred to in the content.