Abstract
The exploration of alternative sources of extracellular matrix (ECM) is driven by increasing demand and the need for sustainable biomaterials. Tuna (Thunnus albacares) bones, a by-product of the fishing industry, represent a potential ECM source due to their abundance, collagen-rich composition, and biocompatibility. This study investigated the effects of demineralization using hydrochloric acid (HCl) at concentrations of 0.5 M and 1.0 M for varying durations (0.5, 1, 6, 12, and 24 h), and decellularization using sodium dodecyl sulfate (SDS) and Triton X-100 (TX100) at concentrations of 0.1%, 0.5%, and 1.0%. Demineralization effectively reduced inorganic content, with residual calcium levels dropping below 5% after 6 h. Kinetic analysis indicated a second-order reaction, and ATR–FTIR spectra confirmed the disappearance of phosphate and carbonate peaks alongside the preservation of amide bands. Demineralized bone matrix (dBM) retained good thermal stability and mechanical properties. Decellularization efficiency was assessed through H&E staining, dsDNA quantification, and SDS-PAGE analysis. Decellularized extracellular bone matrix (dEBM) treated with 1.0% SDS showed the lowest dsDNA levels (14.00 ± 7.94 ng/mg) and absence of cellular material. SDS-PAGE confirmed type I collagen preservation, particularly in samples treated with ≤0.5% SDS or TX100. This study establishes that tuna fish bones can be effectively processed into ECM, supporting their potential as a sustainable biomaterial for advanced biomedical applications.
1. Introduction
Extracellular matrix (ECM)-derived biomaterials have gained significant interest due to their wide application in the biomedical and nutraceutical fields, particularly in tissue remodeling, repair, and regeneration [1,2,3,4,5,6]. As a natural scaffold, ECM contains biomolecules such as collagen, renowned for its excellent biocompatibility [7,8,9,10]. However, most ECM biomaterials are currently sourced from mammalian tissues, raising concerns about the potential transmission of prions and viruses to the host [11,12]. Additionally, the use of mammalian tissues as a source for ECM biomaterials may face religious restrictions, thereby limiting accessibility for certain individuals [13].
Given the challenges with the current sources and the rising demand, exploring new and sustainable sources for ECM production becomes increasingly important. Fish by-products, often regarded as waste—particularly those from tuna—represent an underutilized yet abundant source of bioactive compounds [14,15]. Tuna (Thunnus albacares), one of the most commercially important fish species, yields an estimated 7.5 million tons annually, generating large amounts of processing waste—50–70% of the total mass—including bones and skin [14,15,16]. Tuna bones alone account for about 6% of these by-products, yet their utilization remains limited despite the presence of valuable ECM proteins, including type I collagen [17,18]. Although ECM extraction from fish bones is feasible, key challenges persist due to processing steps such as demineralization and decellularization, which risk damaging ECM integrity.
The utilization of bones as a source for ECM is significantly impeded by the presence of hydroxyapatite (Ca5(PO4)3OH2), which surrounds and shields the collagen fibrils, thereby hindering access to the organic matrix [19]. Effective demineralization is therefore essential to dissolve the mineral phase and expose the underlying ECM components. Removal of calcium-rich hydroxyapatite not only liberates type I collagen but also reveals bone morphogenetic proteins, growth factors, and other bioactive molecules embedded in the matrix that promote mesenchymal stem cell differentiation into osteoblasts. This process generates a three-dimensional collagenous framework that supports cellular and vascular ingrowth (osteoconduction) while delivering osteoinductive cues [20,21]. However, overly aggressive demineralization may damage ECM proteins and compromise their functional integrity. Previous studies have shown that hydrochloric acid (HCl) is an efficient demineralizing agent that can preserve collagen structures when applied under optimized conditions. In a study conducted by Pang et al. (2021), various agents were tested for demineralizing cortical bones, and it was found that hydrochloric acid (HCl) was the most effective while preserving the collagen structure [22]. Nonetheless, bone properties differ across species and tissue types, requiring the identification of appropriate demineralization conditions specific to tuna bone [19].
The presence of residual cellular components also limits the direct use of bone-derived ECM due to the potential immunogenicity of allogeneic or xenogeneic antigens [23]. Decellularization addresses this by removing cells while retaining the ECM’s structural, biochemical, and mechanical features [24]. Various methods, such as physical, enzymatic, or chemical approaches, can be used to achieve decellularization [25]. In example, acid demineralization is followed with chemical treatments ionic and nonionic, surfactants, alkaline (NaOH/KOH) and oxidizing (H2O2) [26,27]. In many studies, detergents like sodium dodecyl sulfate (SDS) and Triton X-100 (TX100) have been commonly used as decellularization agents [28,29,30,31]. Triton X-100 has shown promising results in cell lysis for various tissues, with effective outcomes achieved using different concentrations [12]. In contrast, SDS is a potent ionic detergent that removes cellular components more thoroughly but may damage ECM structure and induce cytotoxicity if not adequately washed out [32,33]. Thus, it is necessary to carefully assess the effects of both the concentration and type of decellularizing agent on the resulting biomaterial.
This study aimed to evaluate the effects of demineralization and decellularization on the development of a decellularized bone matrix (dEBM) derived from tuna bone. Specifically, the study aimed to establish the demineralization kinetics by investigating the influence of HCl concentration and demineralization duration on residual calcium content as well as the resulting physico-chemical and thermal properties of the demineralized bone matrix (dBM). Additionally, to assess how varying concentrations of SDS and TX100 affect cellular removal and ECM preservation, based on histological and physico-chemical analyses relevant to dEBM development, as illustrated in Figure 1. Finally, residual detergent levels in the dEBM were quantified to assess washing efficiency and to determine the material’s suitability for biomedical applications.
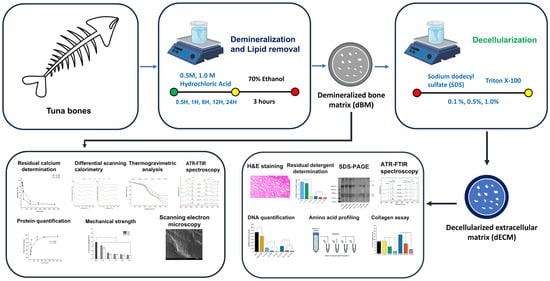
Figure 1.
Overview of demineralization and decellularization conditions for tuna (Thunnus albacares) bones. Demineralization conditions were assessed based on the physico-chemical and thermal characterization of dBM. Decellularization conditions were evaluated based on the physico-chemical, thermal and histological characterization of dEBM.
2. Materials and Methods
2.1. Bone Demineralization
Fresh tuna bones were obtained from a local fish landing in Tambacan, Iligan City, Philippines, and processed on the same day. The bones were carefully cleaned with the intent to remove all residual tissues and washed with distilled water. A phosphate-buffered saline (PBS) solution was prepared, and the bones were soaked in 10× PBS for 1 h to facilitate further preparation for demineralization [34]. After this step, the bones were sectioned into 1 cm segments for subsequent demineralization.
For the demineralization of tuna bones, hydrochloric acid solutions were prepared from 37% HCl (Scharlau, Sentmenat, Barcelona, Spain) to final concentrations of 0.5 M and 1.0 M. The durations were pre-determined at 0.5, 1, 6, 12, 24 h except for calcium content and protein content determination which were at 5, 10, 30, 60, 360, 720 and 1440 min to determine the demineralization kinetics and protein content changes. The demineralization process involved a solvent ratio of 25 mL/g and stirring at a speed of 300 rpm at room temperature. A total of three samples, each weighing 30 g, were prepared for every demineralization condition.
The bones were thoroughly rinsed with distilled water until the washing liquid reached a neutral pH. In addition, a native sample was prepared as a control for comparison. Subsequently, all the samples, including the rinsed bones and the native sample, were stored in an ultra-low temperature (ULT) freezer (Haier, Qingdao, China) at −80 °C for a minimum of 24 h prior to the lyophilization process. To facilitate lyophilization, the samples were freeze-dried at −55 °C under vacuum conditions using a freeze-dryer (Gyrozen, Gimpo, Republic of Korea) for a duration of 24 h.
2.2. Bone Decellularization
The processed tuna bones were first demineralized using 0.5 M hydrochloric acid (Scharlau, Sentmenat, Barcelona, Spain) (HCl) for 12 h as a pretreatment step prior to decellularization. Following demineralization, lipid extraction was carried out to remove residual fats from the demineralized bone matrix (dBM). The tissue was immersed in a 70% ethanol solution and stirred continuously for 1 h at room temperature. The tissue was then separated by decantation and thoroughly rinsed multiple times with distilled water to ensure the complete removal of residual ethanol. Subsequent decellularization was performed using either sodium dodecyl sulfate (85% SDS; Loba Chemie, Mumbai, India) or Triton X-100 (Extra Pure TX100; Loba Chemie, Mumbai, India) at concentrations of 0.1%, 0.5%, and 1.0%, yielding six decellularization conditions. A total of three samples, each weighing 20 g, were prepared for every demineralization condition.
After decellularization, the samples underwent three washes, with each wash consisting of stirring with distilled water for a day. The resulting materials were identified as decellularized extracellular bone matrix (dEBM). Subsequently, the dEBM samples were stored in an ultra-low temperature (ULT) refrigerator (Haier, Qingdao, China) for 24 h before undergoing lyophilization using a freeze-dryer (Gyrozen, Gimpo, Republic of Korea) for another 24 h. The parameters used for the ULT refrigerator and lyophilization process were the same as the ones used previously. The resulting dEBM samples were characterized and compared to the control sample based on their amino acid composition, dsDNA content, residual detergent content and histological characteristics.
2.3. X-Ray Fluorescence (XRF)
The residual calcium of dBM (n = 3) was determined using XRF. The bone samples were powdered and pelletized into disks suitable for the equipment. Helium was used as a purge gas in the sample chamber. Measurements were carried out using Epsilon1 Spectrometer (Malvern PAnalytical, Westborough, MA, USA). The acquired spectra were analyzed using the Epsilon software version 1.1 provided with the equipment.
2.4. Demineralization Kinetics
The variations in residual calcium content at different demineralization times, using different concentrations of hydrochloric acid, with respect to time enabled the determination of the kinetics profile of the demineralization process. To generate the data plots, the calcium concentration of the control sample was considered as the initial concentration. The order and reaction constant for demineralization were determined using the rate equation given as [35]:
where is the rate constant, is the concentration of the reactant (), and is the order of the reaction. Consequently, the order of demineralization was determined by plotting for zero order reaction, for first order reaction and for second order reaction as a function of time.
2.5. Protein Content Quantification
The protein content of the dBM was assessed using the following method. A 0.1 g sample (n = 3) was solubilized in 5 mL of 0.1 M hydrochloric acid at 4 °C, along with 10 mg of pepsin (Merk, St Louis, MO, USA). The solubilization process was carried out for 2 days using a magnetic stirrer set at 300 rpm. To quantify the protein content, the samples were analyzed using the Qubit BR Protein Assay Kit (Thermo Fischer Scientific, Waltham, MA, USA) and measured using a Qubit Fluorometer (Thermo Fischer Scientific, MA, USA). The tests were conducted in accordance with the manufacturer’s user manuals.
2.6. Attenuated Total Reflectance—Fourier Transform Infrared Spectroscopy (ATR-FTIR)
The changes in the relevant chemical bonds and functional groups present in the dBM and dEBM were evaluated using QATR-10 single reflection FTIR Spectrometer (Shimadzu, Kyoto, Japan) equipped with an ATR accessory and LabSolutions IR software version 2.3. The generated spectra were recorded using 128 scans with a resolution of 4 cm−1 in the absorbance range of 4000 to 400 cm−1. To reduce spectral noise, the obscuring fluctuations were smoothed.
2.7. Thermogravimetric Analysis (TGA)
The thermal properties of dBM were characterized using a TGA 4000 thermogravimetric analyzer (Perkin Elmer, Waltham, MA, USA). For the analysis, approximately 20–30 mg of size-reduced samples were weighed and placed in an alumina pan. The pan was placed on the furnace of the analyzer where it was then heated at a rate of 10 °C/min, and the mass of the samples was recorded over a temperature range of 30 °C to 750 °C.
2.8. Differential Scanning Calorimetry
Differential scanning calorimetry (DSC) was conducted using a DSC 4000 instrument (Perkin Elmer, Waltham, MA, USA) for the dBM. Prior to analysis, about 5 mg of the samples were weighed and placed in an alumina pan. The analysis was conducted for both dBM and dEBM at a heating rate of 10 °C/min over a temperature range of 30 °C to 300 °C using air as a purge gas.
2.9. Mechanical Strength
Compressive strength of the dBM samples were determined by adapting the method of Liu et al., (2023) [21]. Samples with the dimensions of approximately 5 mm (n = 3) in diameter were fixed on the platform and crushed using a universal testing machine (Autograph AGS-X, Shimadzu, Japan) at room temperature with the rate of 2 mm/min until breaking point was detected in the software.
2.10. Scanning Electron Microscopy
Micrographs of dBM samples were captured employing a scanning electron microscope (JSM-IT200, Tokyo, Japan). Before microscopy, the samples were mounted in aluminum holders and coated with a layer of fine-grained gold using a sputter coater (JEOL Smart Coater, Tokyo, Japan). The images were acquired with an accelerating voltage of 5–15 kV.
2.11. Histological Staining
Hematoxylin and eosin (H&E) protocols for histological staining were adapted from the study of Ijima et al., (2019) [36]. The dEBM were prepared for histological analysis by initially cutting the samples into 0.5 × 0.5 cm2 section and then fixed using a 10% buffered formalin solution for 72 h. The samples were subsequently dehydrated using an increasing series of alcohol concentration (70%, 90%, and 100%). The fixed samples were embedded into blocks measuring 2 × 2 cm2 and were then sectioned using a microtome (SLEE medical GmbH, Nieder-Olm, Germany) in order to create 4 µm thick ribbons with cross-sectional segments of the samples.
The ribbons were placed on glass slides and subsequently stained using H&E solution (Biognost®, Zagreb, Croatia). This staining procedure allows for the visualization of different cellular and structural components of the tissue. Specifically, any cellular components of the cells were stained blue or purple by hematoxylin, while structural proteins of the tissue were stained pink by eosin. The stained tissues were imaged using a CX43 laboratory microscope (Olympus, Tokyo, Japan).
2.12. Double-Stranded DNA (dsDNA) Quantification
The DNA extraction was conducted using DNeasy Blood and Tissue Kit (Qiagen®, Valencia, CA, USA). Consequently, the quantification for the amount of double-stranded DNA present in the dEBM samples (n = 3) was carried out using Qubit™ 1X dsDNA HS Assay Kit (Thermo Fisher Scientific, Waltham, MA, USA). The DNA extraction and quantification protocols were carried out in accordance with the manufacturer’s instructions.
2.13. Amino Acid Analysis
The dEBM samples underwent amino acid profiling through high-performance liquid chromatography system (Prominence-I Plus System, Shimadzu, Japan), using a C18 column and a fluorescence detector. Prior to analysis, the dEBM samples were hydrolyzed using a method adopted by Toppe et al., (2007) [19]. For further purification, hydrolysates were diluted and filtered with a 0.22 μm pore size syringe filter and transferred to their corresponding vials.
Hydroxyproline content was quantified using an assay kit (MAK008, Sigma, Burlington, MA, USA) following the manufacturer’s instructions. Approximately 10 mg of each dEBM sample was hydrolyzed at 120 °C for 3 h. A 10 µL aliquot of the hydrolyzed solution was then transferred to a microplate well and analyzed as directed by the kit protocol.
2.14. Residual Detergent Concentration Determination
The amount of residual detergent in the dEBM samples were determined using UV-VIS spectrophotometry. In the determination of detergent in the samples decellularized using TX100, the method used by Pavlovi’c et al. (2016) with modifications on the concentrations used to establish the standard curve [37]. For the determination of residual SDS, the method used by Alizadeh et al. (2019) was used with modifications on the concentrations of methylene Blue [38].
2.15. Sodium Dodecyl-Sulfate Polyacrylamide Gel Electrophoresis (SDS-PAGE)
SDS-PAGE analysis was performed following the method described by Zhang et al. [39], with modifications. Solubilized dEBM samples were mixed with a sample buffer composed of 0.5 M Tris-HCl (pH 6.8), 25% (v/v) glycerol (Promega, Madison, WI, USA), 2% (w/v) SDS, 5% (v/v) β-mercaptoethanol (Sigma-Aldrich, St. Louis, MO, USA), and 0.1% (w/v) bromophenol blue (Sigma-Aldrich, St. Louis, MO, USA).
Electrophoresis was carried out using a mini vertical protein electrophoresis system (omniPAGE CVS10DSYSCU, Cleaver Scientific, Warwickshire, UK). The gel was run at 200 V and 20 mA for 1 h. After electrophoresis, the gels were stained with Coomassie Brilliant Blue (Abcam, Cambridge, MA, USA) to visualize protein bands, including collagen components.
2.16. Soluble Collagen Assay
Collagen content was quantified using the Soluble Collagen Quantification Assay Kit (CS0006, Merck, Rahway, NJ, USA) in accordance with the manufacturer’s instructions. Approximately 100 mg of each dEBM sample was solubilized in 1 mL of ice-cold 0.5 M acetic acid. The solubilized samples were then analyzed following the kit protocol (n = 2).
2.17. Statistical Analysis
The results are presented as the mean ± standard deviation. Data analysis was conducted using two-way ANOVA, followed by Tukey’s multiple comparison test. Significance was determined by a p-value of less than 0.05.
3. Results and Discussion
3.1. Characterization of dBM
3.1.1. Demineralization Kinetics
The demineralization kinetics of tuna bone samples were analyzed by measuring the residual calcium content using X-ray fluorescence (XRF). The control samples had an initial calcium content of 18.49 ± 0.49%, which progressively decreased with increasing demineralization duration. Figure 2A shows the decline in calcium content over time for samples treated with different HCl concentrations.
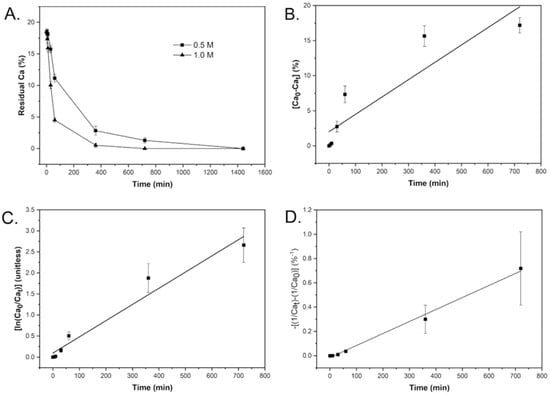
Figure 2.
(A) Residual calcium content in tuna bone under varying demineralization conditions. (B) Zero-order plot: [Ca]0 − [Ca]ₜ vs. time. (C) First-order plot: ln([Ca]0/[Ca]ₜ) vs. time. (D) Second-order plot: −[(1/[Ca]ₜ) − (1/[Ca]0)] vs. time for 0.5 M HCl at 25 °C.
To determine the reaction kinetics, data from partially demineralized samples were fitted to zero-, first-, and second-order kinetic models. The plots of for zero order reaction, for first order reaction and for the second-order reaction as a function of time at a concentration of 0.5 M are shown in Figure 2B–D, respectively. The plot with the highest linearity indicates the reaction order. The slope of the linear plot represents the average rate constant of demineralization. As shown in Figure 2D, the data best fit the second-order model. This suggests that the demineralization of fish bones follows a second-order kinetic profile, consistent with findings from other studies involving bones from different fish species [40].
The calculated rate constants (k) and R2 values for each kinetic model at 0.5 M and 1.0 M HCl are summarized in Table 1. The second-order model yielded the highest R2 values (>0.99), confirming it as the most appropriate kinetic description. Table 1 also shows that doubling the HCl concentration during demineralization resulted in an approximate fivefold increase in the average rate constant. This increase can be explained by the interaction between calcium ions and chloride ions, as shown in Equation (1). According to collision theory, the reaction rate is proportional to the frequency of effective collisions between reactant molecules. Higher reactant concentrations increase the likelihood of such collisions [35,41]. In this case, increasing HCl concentration enhances the rate of demineralization.

Table 1.
Calculated rate constants (k) and coefficients of determination (R2) for zero-, first-, and second-order reaction models under different HCl concentrations.
Understanding the kinetics of demineralization is essential for controlling the extent of mineral removal, which in turn governs the physical and functional characteristics of the resulting matrix. Adequate demineralization is critical to expose and recover the valuable organic extracellular matrix (ECM) components for biomedical applications. This process eliminates hydroxyapatite, thereby uncovering type I collagen along with bone morphogenetic proteins (BMPs) and other osteoinductive factors that play pivotal roles in directing osteogenesis and bone remodeling. [21]. For highly calcified tissues, a residual calcium content below ~5% is typically taken to indicate effective decalcification of collagen fibrils while levels near ~2% have been associated with enhanced osteoinductive potential, a desirable attribute for bone allografts [42,43,44].
Among the conditions evaluated, 0.5–1.0 M HCl for greater than 6 h met most criteria for effective demineralization. This dwell time is longer than the ~1 h reported for tilapia (Oreochromis niloticus) in 0.5 M HCl [40], but contrasts with halibut bone, which required higher acid concentrations to achieve comparable demineralization within the same 6 h period [21]. In comparison, bovine bone decalcified with 10% EDTA required soaking for up to 4 weeks [26]. Mammalian bone—being denser—often relies on chelator-based (EDTA) or low-acid protocols that require multi-day exposures (≈7 days or longer) to reach similar endpoints. Relative to porcine epiphyseal and cortical bones used in producing demineralized bone matrix, tuna bone demineralized substantially faster and at lower acid concentrations, whereas published methods for those larger, denser bones often employ more than 0.6 M acid with soaking periods exceeding five days [20].
3.1.2. Protein Content Quantification
The changes in protein content were monitored over the demineralization time as depicted in Figure 3. Initially, the protein content of tuna bone was measured at 476.00 ± 6.97 mg/g, progressively increasing with extended demineralization time up to 1440 min. This changes in protein content were consistent across demineralization processes employing varying concentrations of acid, albeit at different rates.
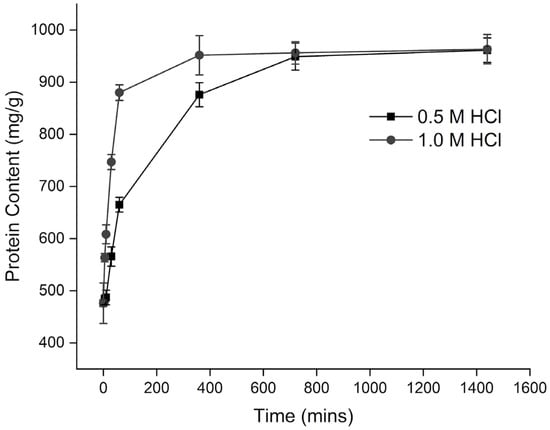
Figure 3.
Protein content of dBM samples as a function of demineralization duration.
Tuna bone samples demineralized with an acid concentration of 0.5 M showed peak protein contents of 961.33 ± 23.46 mg/g and 963.33 ± 28.29 mg/g after 24 h of treatment, with no significant difference between these values. The increase in protein concentration during demineralization is primarily due to the reaction between hydroxyapatite crystals and the acid as it diffuses through the matrix. Additionally, the acid interacts with proteins at their binding sites, which can lead to partial denaturation and some loss of extracellular matrix (ECM) proteins. However, this loss has only a minor impact on overall protein levels compared to the more substantial reduction in inorganic content as hydroxyapatite is dissolved.
Moreover, the demineralization process involves the removal of the tissue’s inorganic components, leading to a relative increase in the organic fraction over time. After complete demineralization of the demineralized bone matrix (dBM) samples, the protein content continues to increase as the acid further penetrates the exposed matrix. This results in an apparent rise in protein content once a certain calcium level is reached, as non-protein components are progressively removed from the matrix.
3.1.3. Attenuated Total Reflectance—Fourier Transform Infrared Spectroscopy (ATR-FTIR)
ATR-FTIR analysis was conducted to detect collagen-related band markers in the dBM and to observe spectral changes under different demineralization conditions. Figure 4 presents the key spectral bands found in both the control and demineralized samples. In the control, distinct phosphate bands appeared at ~560 cm−1 and ~600 cm−1, along with a peak at ~1030 cm−1 and a shoulder at ~960 cm−1, corresponding to the vibrational modes of phosphate groups in hydroxyapatite. A carbonate band was also observed near 870 cm−1.
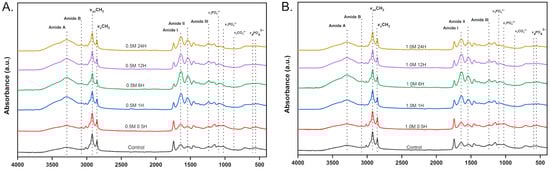
Figure 4.
ATR-FTIR spectra of control and demineralized tuna bone samples under varying conditions: (A) dBM treated with 0.5 M HCl; (B) dBM treated with 1.0 M HCl.
In samples treated with 0.5 M HCl, phosphate and carbonate band intensities decreased and exhibited peak shifts after 60 min. After 360 min, only residual signals remained. Similarly, in the 1.0 M HCl-treated samples, a marked reduction in phosphate and carbonate bands was observed after just 60 min. These changes are consistent with calcium quantification results, where both treatment groups had less than 3% residual calcium after 360 min. The decreasing intensities are shown in Figure 5B,D. Additionally, the dBM treated with 1.0 M HCl for 60 min had a calcium content below 5%, matching the ATR-FTIR profile with only residual phosphate and carbonate peaks.
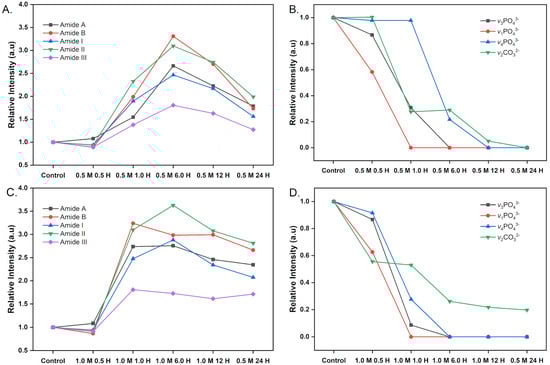
Figure 5.
Relative intensity of amide, phosphate, and carbonate bands in control and dBM under varying conditions. (A) Amide bands in samples treated with 0.5 M HCl; (B) Phosphate and carbonate bands in samples treated with 0.5 M HCl; (C) Amide bands in samples treated with 1.0 M HCl; (D) Phosphate and carbonate bands in samples treated with 1.0 M HCl.
Amide A (3115–3705 cm−1), amide B (3030–3115 cm−1), vsCH2 (2880–2990 cm−1), vasCH2 (2760–2880 cm−1), amide I (1583–1715 cm−1), amide II (1485–1587 cm−1) and amide III (1207–1323 cm−1) are FTIR spectral bands associated with collagen and other organic ECM components that constitute the tuna dBM. These markers were present in the control and preserved across all dBM. The amide A and amide I regions retained their band shapes compared to the control, indicating minimal matrix alterations at lower concentrations.
In both 0.5 M and 1.0 M HCl treatments, peak intensities increased with longer demineralization times, particularly for amide bands A, B, I, II, and III. This increase is due to the progressive removal of mineral content, mainly hydroxyapatite, which enhances the freedom of amide bond vibrations by disrupting hydrogen bonds between ECM proteins and inorganic components [22,40,45].
However, peak intensities decreased after 6 h of demineralization with 0.5 M HCl and after just 1 h with 1.0 M HCl, as shown in Figure 5A,C. This reduction likely indicates structural damage to the ECM from prolonged or overly aggressive demineralization
Slight shifts in the amide band wavenumbers were observed with increasing demineralization time. These bands reflect ECM protein conformation, and reduced structural order corresponds to lower peak frequencies [46]. At 0.5 M HCl, minor shifts appeared after 12 h and became more pronounced at 24 h. In contrast, for 1.0 M HCl, shifts emerged as early as 6 h and intensified after 12 h. Under both conditions, the amide I peak shifted from 1647 cm−1 in the control to ~1633 cm−1. Amide II also shifted by approximately 10 cm−1. These spectral changes indicate that excessive demineralization alters ECM protein conformation and may compromise the structural integrity of the tissue.
The ATR-FTIR spectra of the samples closely resembled collagen-based scaffolds and mammalian demineralized matrices which confirms the preservation of organic content of the samples (osteoid) [27,47]. Compared with demineralization of other tissues—such as porcine epiphyseal and cortical bone—which typically requires more than 14 days under low reagent concentrations, the present protocol achieved a marked attenuation of phosphate and carbonate band intensities in less than 12 h using higher HCl concentrations (0.5–1.0 M) [27,48]. Importantly, the amide I, II, and III bands were preserved with peak positions retained, and the overall matrix architecture remained comparable to the native structure, indicating that the extracellular matrix (ECM) was maintained. Such structural preservation not only retains the collagenous framework but also exposes matrix-associated proteins, which may function as bioactive signaling cues upon implantation, thereby enhancing osteogenic responses.
3.1.4. Thermogravimetric Analysis (TGA)
The thermal stability and residual mineral content of the control and dBM samples were assessed using TGA, as illustrated in Figure 6. The residue after heating the samples to 750 °C represents the remaining mineral fraction [22]. According to the theoretical weight percentage of calcium in hydroxyapatite, the residue in the control sample was roughly 47%, which corresponds to a calcium content of about 18%. This value is aligned with XRF results.
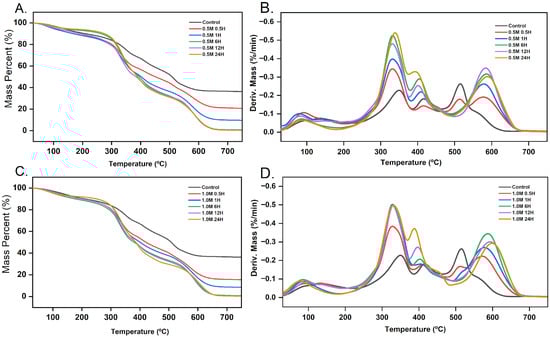
Figure 6.
TGA and DTG thermograms of control and dBM treated with different HCl concentrations: (A) TGA curves at 0.5 M HCl; (B) DTG curves at 0.5 M HCl; (C) TGA curves at 1.0 M HCl; (D) DTG curves at 1.0 M HCl.
Demineralization significantly reduced the mineral residue. After 6 h of treatment, residue levels nearly reached 0%. Even after just 1 h of demineralization, both 0.5 M and 1.0 M HCl treatments reduced the mineral residue to below 10% of the total sample mass. The 1.0 M HCl-treated samples consistently showed lower residue compared to the 0.5 M HCl-treated samples at the same time points. This result reflects the higher demineralization rate associated with stronger acid concentration, supported by previously determined kinetic data.
Derivative thermogravimetry (DTG) was used to identify the thermal degradation characteristics of the bone matrix. The DTG thermograms showed characteristic features of bones with high organic content [49]. Both control and demineralized samples exhibited four distinct peaks associated with specific thermal degradation events and are summarized in Table 2, along with their corresponding mass losses.
Table 2.
Peak temperatures and corresponding mass losses associated with the thermal degradation stages of dBM.
The first peak, observed in the control sample at ~133 °C with a shoulder around 102 °C, was attributed to the evaporation of mobile and bound water, as well as initial protein denaturation [40,49,50]. As demineralization progresses, this peak shifts to lower temperatures, indicative of hydroxyapatite loss in the samples. The removal of hydroxyapatite exposes tropocollagen and releases bound water trapped between them [51]. With hydroxyapatite removed, more water existed in a mobile state, leading to earlier evaporation.
The second major peak, between 300 and 375 °C, corresponds to the thermal degradation of collagen. In the control sample, this peak occurred at ~350 °C. With increasing demineralization time, the peak shifted to ~330 °C, accompanied by an increase in the degradation rate. This shift reflects the decreased thermal stability of demineralized collagen fibrils due to the loss of mineral shielding [42].
These results indicate that demineralization alters the thermal behavior of the matrix by removing hydroxyapatite and exposing collagen structures to degradation. The reduction in thermal stability confirms the successful removal of mineral components and provides insight into the physicochemical changes in the ECM during processing.
Complex changes were observed in the third and fourth degradation stages as demineralization time increased. These stages correspond to the degradation of residual organic compounds in the bone matrix [40]. The third stage, occurring between 380 and 500 °C, showed a peak near 397 °C in both acid concentrations, with the peak temperature decreasing over time. In contrast, the fourth stage reached a maximum of 602.58 °C after 24 h of demineralization with 1.0 M HCl. This increase may be due to the degradation of thermally stable organic components that persist during prolonged demineralization.
3.1.5. Differential Scanning Calorimetry (DSC)
DSC analysis was conducted on freeze-dried decellularized extracellular bone matrix (dEBM) samples to minimize moisture content and ensure consistency across all specimens. As shown in the thermograms presented in Figure 7, the control sample exhibited a broad thermal with two shoulder peaks within the range of 0–250 °C. Similar thermal behavior was observed in the demineralized samples, each displaying two distinct endothermic peaks, designated as T1,max and T2,max. The first peak (T1,max) appeared between ~60–80 °C, while the second peak (T2,max) was observed between ~210–220 °C.
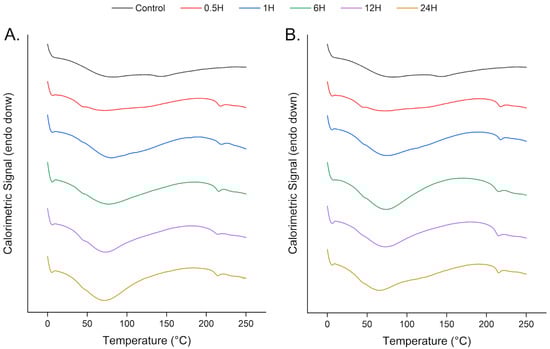
Figure 7.
DSC thermograms of tuna bone samples under varying demineralization conditions: (A) Control and dBM treated with 0.5 M HCl; (B) Control and dBM treated with 1.0 M HCl.
The first endothermic event exhibited two shoulders: one at ~40–50 °C and another at ~100–140 °C, most prominent in the control and partially demineralized samples (e.g., 0.5 h and 1 h treatments). As demineralization time increased, the first endotherm became sharper, and the higher-temperature shoulder diminished. This shift in T1,max and loss of the shoulder were also observed in the TGA thermograms. The disappearance of the shoulder is associated with the removal of hydroxyapatite, which coats collagen fibrils and binds water.
The lower-temperature shoulder preceding T1,max remained detectable across all samples, suggesting early-stage collagen denaturation prior to major dehydration of the bone matrix.
A consistent second endothermic peak was observed across all demineralized samples, corresponding to the denaturation of collagen within the bone matrix—a distinct feature in freeze-dried specimens. In these samples, the denaturation peak shifted to higher temperatures compared to the hydrated state, attributable to the replacement of hydrogen bonds between polypeptide chains and water molecules by direct interchain hydrogen bonds in the absence of water bridges [40,52,53]. Only minor shifts in T2,max were observed among the demineralized samples. In contrast, this peak was absent in the control sample within the same range, suggesting a higher denaturation temperature due to the thermal stabilization provided by the mineral phase. The observed decrease in T2,max after demineralization supports the removal of hydroxyapatite and the corresponding reduction in collagen thermal stability. Only slight shifts were observed, indicating minimal structural alterations in the matrix during demineralization and preserving the thermal properties of the native tissue.
3.1.6. Mechanical Strength
The compressive strength of dBM was evaluated to assess the effect of demineralization duration and acid concentration on mechanical integrity. Compressive strength was determined using the first deflection point in the stress–strain curve as the failure criterion with results presented in Figure 8.
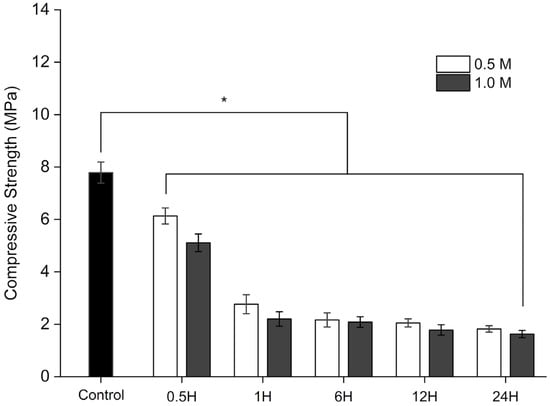
Figure 8.
Compressive strength of control and dBM subjected to varying demineralization durations and HCl concentrations. All data are shown as mean ± standard deviation (n = 3); *, p < 0.05.
The control sample exhibited an initial compressive strength of 7.79 ± 0.40 MPa. A progressive decline in compressive strength was observed with increasing demineralization time. A statistically significant reduction in strength was noted after 1 h of treatment (p < 0.05), with no significant differences observed thereafter among samples treated for the same duration but with different acid concentrations.
This trend is attributed to the near-complete removal of the mineral phase covering collagen fibrils in the tissue after 6 h of demineralization. Despite this reduction, samples treated for 0.5, 1, and 6 h using both 0.5 M and 1.0 M HCl retained compressive strengths within the range reported for human cancellous bone (2–20 MPa) [54]. This result suggests that these demineralized samples possess mechanical strength suitable for biomedical applications.
However, samples demineralized for 24 h fell below this threshold, suggesting that prolonged demineralization may compromise structural integrity to levels. Controlled demineralization has an impact on the physical properties of the scaffold. For biomedical applications such as a scaffold, it is better to not fully demineralize the bone matrix to have sufficient mechanical strength. This approach would benefit from exposing the collagen-rich ECM and bioactive factors needed for repair without sacrificing good mechanical strength.
3.1.7. Scanning Electron Microscopy (SEM)
A close examination of the dBM surfaces using SEM reveals significant changes in the surface morphology of the matrix components. Representative micrographs are shown in Figure 9, covering control and treated samples subjected to 1 h, 6 h, and 24 h of demineralization at HCl concentrations of 0.5 M and 1.0 M.
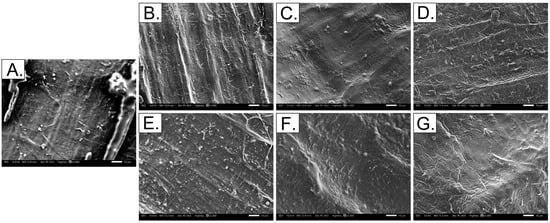
Figure 9.
SEM micrographs (1000× magnification) of tuna bone samples under varying demineralization conditions: (A) Control; (B–D) 0.5 M HCl for 1, 6, and 24 h, respectively; (E–G) 1.0 M HCl for 1, 6, and 24 h, respectively.
In the control sample, collagen fibrils were not clearly distinguishable due to dense hydroxyapatite deposits occupying the interfibrillar spaces. After 1 h of demineralization, limited exposure of collagen fibrils was observed, with more visible fibrils in samples treated with 1.0 M HCl compared to those treated with 0.5 M. This suggests a more aggressive mineral phase removal at higher acid concentration.
After 6 h of treatment, collagen fibrils became more prominent, exhibiting straight fiber alignment and increased porosity due to the removal of hydroxyapatite. This enhanced porosity could be advantageous for cell adhesion and proliferation when used as a biomaterial. However, samples demineralized for 24 h displayed a disorganized collagen network, characterized by disrupted fibrillar arrangement and apparent loss of interfibrillar bonding. Prolonged exposure to the demineralization process led to tropocollagen denaturation, reducing interfibrillar bonding and resulting in the observed disorganized structure. These morphological changes are consistent with reductions in collagen thermal stability and the observed alterations in ATR–FTIR spectra, supporting the structural impact of extended demineralization.
SEM micrographs revealed the surface morphology of demineralized samples relevant to bone tissue engineering. Surface roughness plays a critical role in regulating cell–material interactions and bioactivity. Both partially and fully demineralized samples exhibited roughened topographies with exposed collagen fibrils, creating attachment sites that facilitate cell adhesion and proliferation. In line with previous studies, enhanced micro- to nanoscale roughness increased protein adsorption and promoted osteoblast attachment, proliferation, and osteogenic differentiation [27]. These surface features are favorable for osseointegration and subsequent bone regeneration.
3.2. Characterization of dEBM
3.2.1. Attenuated Total Reflectance—Fourier Transform Infrared Spectroscopy (ATR-FTIR)
ATR–FTIR was used to evaluate changes in the organic matrix following demineralization and subsequent decellularization of tuna bone. Figure 10A,B show that the characteristic collagen bands remain within their expected wavenumber windows in all treated samples—amide A (3115–3705 cm−1), amide B (3030–3115 cm−1), vsCH2 (2880–2990 cm−1), vasCH2 (2760–2880 cm−1), amide I (1583–1715 cm−1), amide II (1485–1587 cm−1), and amide III (1207–1323 cm−1)—indicating preservation of the collagenous backbone after processing. For demineralized tissue, the phosphate (ν4 ≈ 560–600 cm−1; ν3 ≈ 1030 cm−1 with a ν1 shoulder near 960 cm−1) and carbonate (ν2 ≈ 870 cm−1) signals prominent in native bone are reduced to residual peaks because mineral was removed prior to decellularization. The relative intensities of the amide bands vary with decellularization conditions (Figure 10C). Relative to the demineralized-only control (0.5 M HCl, 12 h), increasing detergent concentration—especially with the ionic surfactant SDS—progressively weakens amide A/I/II/III, consistent with partial solubilization and loss of matrix proteins and a lower effective protein concentration in the thin surface layer that ATR measures.
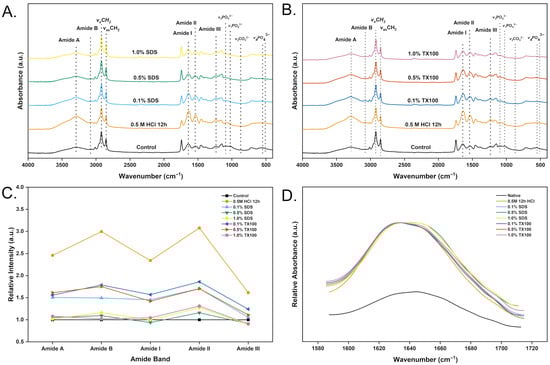
Figure 10.
ATR-FTIR spectra of control, demineralized tuna bone sample (0.5 M HCl 6 h), and decellularized samples under varying conditions: (A) dEBM treated with SDS; (B) dEBM treated with TX100. (C) Relative intensity of amide bands of control, demineralized (0.5 M HCl 6 h), dEBM samples (D) Peak shifting of amide I band of control, demineralized (0.5 M HCl 6 h), dEBM samples.
Figure 10D shows distinct shifts in the amide bands after processing, which reflect changes in the protein conformation of the ECM. In general, lower structural order of proteins corresponds to lower peak frequencies in the amide region. The amide I band—commonly used as an indicator of collagen’s secondary structure—shifted to lower wavenumbers following demineralization (0.5 M HCl, 12 h) and in most dEBM treatments. As shown in Figure 10B, consistent peak shifts were also observed in samples treated with TX100, with the magnitude of the shift increasing alongside the concentration of the agent. In contrast, treatment with 0.5% and 1.0% SDS resulted in a shift in the amide I band toward higher wavenumbers. This behavior may be attributed to the stronger ionic environment generated by higher SDS concentrations, which could lead to the solubilization of proteins loosely bound to the ECM, thereby increasing the retained collagen fraction which have higher order in the dEBM samples.
The ATR–FTIR spectra of the decellularized samples remained characteristic of a proteinaceous scaffold, with clear amide I, II, and III bands indicating preservation of key ECM proteins, particularly collagen. This matters because the ECM’s bioactivity relies on both architecture and biochemical composition. In a biomaterial context, retaining these proteins provides cues for cell adhesion, proliferation, and differentiation; collagen and non-collagenous proteins supply binding sites for osteoblasts and support mineral deposition, enabling osteoconduction [23].
3.2.2. Histological Staining
Hematoxylin and eosin (H&E) staining provides a rapid morphological read-out of decellularization quality. One criterion for effective decellularization is the removal of visible nuclear material as indicated by hematoxylin and eosin (H&E) staining [48]. Hematoxylin labels nucleic acids (blue–purple) while eosin stains the proteinaceous extracellular matrix (pink). Figure 11 shows the H&E staining of the sections of the samples. In the control sample, dense cellular components were clearly visible. Specifically, cellular components were seen in the osteocyte lacunae (small white and purple holes) and vascular canals (white and purple holes inside bone matrix). The demineralized sample treated with 0.5 M HCl for 12 h showed reduced cellular content but retained some nuclear material in the vascular canals, indicating that demineralization alone was insufficient for complete decellularization. Moreover, the enhancement of the osteocyte lacunae and vascular canals were observed across all samples, attributed to the removal of minerals during the demineralization step.
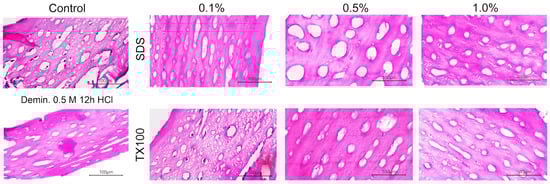
Figure 11.
H&E staining images of control and decellularized tuna bone samples under varying treatment conditions.
The effectiveness of the decellularizing agents varied with concentration. Samples treated with 0.1% SDS and TX100 still displayed visible cellular components, suggesting incomplete decellularization. At 0.5% concentration, SDS-treated samples showed complete removal of nuclear material, while TX100-treated samples exhibited only minimal remnants. Complete decellularization, with no observable cellular material, was achieved at 1.0% concentration for both SDS and TX100.
Beyond cellular removal, the morphology of osteocyte lacunae demonstrated clear protocol-dependent effects. Samples subjected only to demineralization (0.5 M HCl, 12 h) retained a pore architecture similar to controls, with several lacunae still occupied by osteocytes. Treatment with 0.1% concentrations of the decellularizing agents largely preserved the native pore structure and osteoid, particularly in the case of TX100. At concentrations above 0.5%, both SDS and TX100 produced a marked enlargement of lacunae to ~50 µm, with SDS inducing progressive fusion of adjacent lacunae and vascular canals, thereby increasing overall tissue porosity. Notably, these decellularization protocols did not create new pores; rather, they altered existing structures by enlarging the lacunae. At 1.0% for both detergents, no residual cellular material was observed; however, progressive enlargement and fusion of pre-existing lacunae were noted. Importantly, no gross tissue tearing or fissuring was observed at these higher concentrations. The strong eosinophilic staining of the matrix confirmed that the osteoid and a substantial amount of organic material were retained in the treated samples [27].
An optimal bone-repair scaffold requires a highly interconnected porous architecture that supports cell adhesion and proliferation, facilitates tissue ingrowth, and enables efficient nutrient–waste exchange. For this reason, preserving the patency of vascular canals and osteocyte lacunae is advantageous in ECM-derived biomaterials. In human cortical bone, osteocyte lacunae typically measure ~14–25 µm in length and ~5–10 µm in width [55]. The figure shows that decellularization altered the dimensions of the lacunae, producing spaces that can serve as sites for cell attachment and proliferation. Notably, the lacunae expanded to sizes comparable to those in native human bone, which may enhance the matrix’s capacity to support cellular colonization and tissue integration after implantation.
3.2.3. Double-Stranded DNA (dsDNA) Quantification
Quantification of dsDNA was performed to assess the extent of nuclear material removal following decellularization. Control samples and samples treated with 0.5 M HCl for 12 h were included for comparison. A significant reduction in dsDNA content was observed in the demineralized samples; however, levels remained considerably higher than those in decellularized samples (Figure 11). This finding is consistent with previous studies indicating that hydrochloric acid alone can reduce but not eliminate nuclear components within 24 h of demineralization [40].
While demineralization reduces cellular content, the use of hydrochloric acid alone is insufficient for complete removal of dsDNA, particularly considering the potential damage to ECM integrity with prolonged exposure. Therefore, decellularizing protocols were necessary to achieve effective decellularization.
To enhance decellularization and improve visual quality of biomaterials, additional treatments have been investigated following acid-based demineralization. Oxidizing agents such as hydrogen peroxide (H2O2) have been applied in porcine bone processing to produce collagen matrices. In these protocols, varying peroxide concentrations were combined with subsequent low-acid treatments, achieving complete nuclear clearance. Nonetheless, treated samples often exhibited discoloration and surface cracks, indicating possible protein alteration. Peroxide was also employed to decolorize tissues with undesirable pigmentation, although cytotoxicity was not thoroughly evaluated [27]. Alkaline agents such as NaOH or KOH have likewise been explored for bovine bone, where they act by saponifying lipids and denaturing nucleoprotein complexes, thereby reducing residual DNA. However, excessive exposure risks collagen modification, fibril swelling, and microcracking. Li et al. (2022) further demonstrated that combining alkaline treatments with ultrasonication facilitated decellularization while retaining osteogenic potential [26]. In the present study, detergents were evaluated as decellularizing agents.
Figure 12 shows the dsDNA content of the control, 0.5 M HCl for 12 h dBM and dEBM samples. The effect of detergent concentration was statistically significant (p < 0.05) in the dsDNA of the samples. SDS-treated samples showed a greater reduction in dsDNA content compared to those treated with Triton X-100, which may be attributed to the ionic nature of SDS and its stronger interaction with nuclear membranes [56,57].
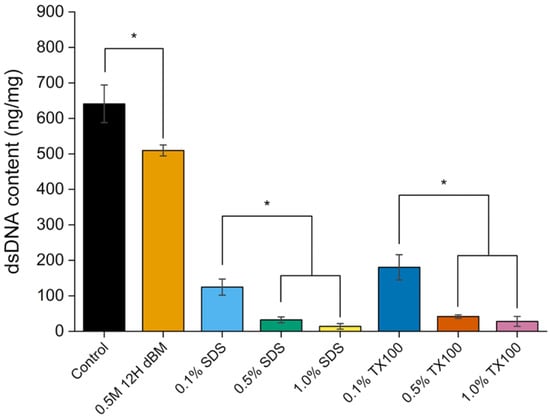
Figure 12.
Comparison of double-stranded DNA (dsDNA) content in control, 0.5 M HCl for 12 h dBM, and dEBM under varying conditions. All data are shown as mean ± standard deviation (n = 3); *, p < 0.05.
A crucial requirement for successful decellularization is the effective removal of cellular components, particularly nuclear material, with double-stranded DNA (dsDNA) content ideally below 50 ng/mg of dry tissue [8]. Failure to meet this threshold may trigger host immune responses, including inflammation, fibrosis, and scar formation [58,59]. It may also hinder successful recellularization due to residual cellular components interfering with cell attachment and growth.
Among the dEBM samples, those treated with 0.5% SDS, 1.0% SDS, 0.5% TX100, and 1.0% TX100 exhibited dsDNA contents below the specified threshold, meeting the minimum criteria for use as biomaterial scaffolds with minimal risk of adverse immune response.
3.2.4. Residual Detergent Concentrations
Residual detergent analysis was carried out to evaluate the effectiveness of the washing protocol and quantify retained detergent in the decellularized bone tissue. Figure 13 shows the residual detergent concentration of the dEBM samples. The use of 1.0% SDS resulted in the highest residual detergent content (0.1817 ± 0.0022 µg/mg), while 0.1% TX100 showed the lowest (0.0181 ± 0.0011 µg/mg). SDS-treated samples consistently exhibited higher residual levels compared to Triton X-100-treated samples (p < 0.05), which aligns with previous reports that ionic detergents are more difficult to remove from tissues than nonionic counterparts [36].
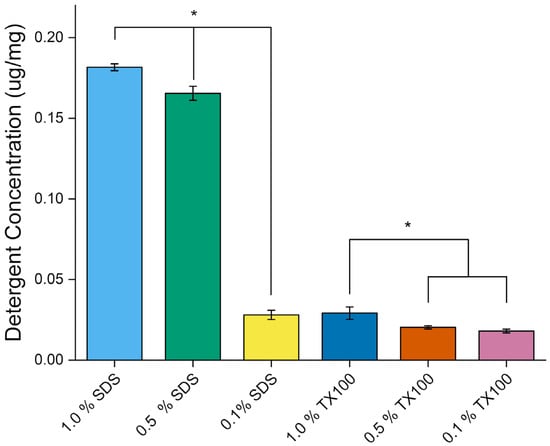
Figure 13.
Residual detergent concentrations of dEBM under varying conditions. All data are shown as mean ± standard deviation (n = 3); *, p < 0.05.
Higher detergent concentrations also resulted in greater residual levels post-washing (p < 0.05), indicating that concentration plays a significant role in detergent entrapment within the matrix.
Previous studies have shown that both TX100 and SDS are cytotoxic and require strict safety controls before application as biomaterials [36]. For Triton X-100, residual levels should not exceed 0.15 mM, which is tolerable for human cells [60]. This corresponds to around 0.09 µg/mg of sample, assuming a 1:1 ratio of milliliters to grams based on the reference specific gravity. In contrast, SDS must be reduced to below 10 µg/mg tissue dry weight to ensure cytocompatibility [61]. All decellularized samples in this study met their respective safety thresholds following the implemented washing procedures.
In addition, Triton X-100’s lower retention allows its use at relatively higher concentrations compared to SDS. However, concerns remain regarding its effect on the preservation of the ECM. Despite achieving acceptable residual levels, retained detergent—especially SDS—may still influence downstream applications, including cell adhesion and proliferation on dEBM scaffolds.
3.2.5. Sodium Dodecyl Sulfate–Polyacrylamide Gel Electrophoresis (SDS-PAGE)
SDS-PAGE revealed distinct collagen type I bands, the primary component of the ECM, across control, demineralized, and decellularized tuna bone samples. Collagen type I typically appears as α1 and α2 bands at a 2:1 ratio, along with β- and γ-bands. Structurally, collagen type I is a heterotrimer composed of two α1 chains and one α2 chain. The β-band represents crosslinked dimers of α-chains, while the γ-band corresponds to trimers [62].
The electrophoretic profiles in Figure 14 show that the control and 0.5 M HCl–treated sample display consistent α1 and α2 bands, with molecular weights between 100 and 135 kDa, and a thicker α1 band. The β-band, observed near 250 kDa, was present across all samples, indicating the retention of collagen dimers. These patterns confirm the characteristic migration behavior of type I collagen.
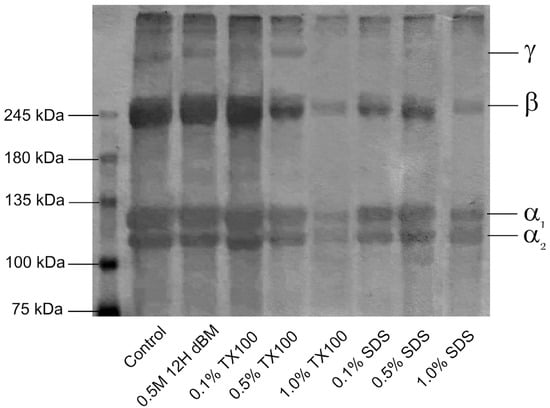
Figure 14.
SDS-PAGE analysis showing the electrophoretic profiles of solubilized proteins from control, 0.5 M 12 h dBM, and dEBM under varying treatment conditions.
A reduction in the intensity of α, β, and γ bands was observed with increasing concentrations of decellularizing agents, despite equal sample loading across all lanes. This decrease in band intensity reflects progressive protein solubilization and degradation, particularly under more aggressive decellularization conditions. Notably, SDS-treated samples exhibited lower band intensity than those treated with Triton X-100 at equivalent concentrations, suggesting a stronger impact of SDS on collagen structure.
The γ-band, associated with collagen trimers, was the most affected. It was absent in all SDS-treated samples and in samples treated with 1.0% Triton X-100. This indicates that crosslinked collagen structures were disrupted during decellularization, particularly with SDS and higher concentrations of nonionic detergent. These findings highlight the susceptibility of collagen crosslinks to degradation during chemical decellularization, with implications for ECM integrity and bifunctionality.
3.2.6. Soluble Collagen Assay
Figure 15 shows the amount of soluble collagen in the control and dEBM samples. the amount of soluble collagen gives information about the less cross-linked fraction of the total collagen in the dEBM samples. As shown in the figure, higher concentration of soluble collagen is observed as higher concentration of agents were used. The use of 1.0% SDS as decellularizing agent resulted in the lowest soluble collagen content (16.84 ± 5.63 µg/mg). In contrast, the use of the relatively milder decellularizing agent 0.1% TX100 showed a soluble collagen content of 134.57 ± 0.70 µg/mg. Higher detergent concentrations also resulted in significantly lower soluble collagen fractions (p < 0.05), indicating that concentration is a factor on the ECM retention. The use of SDS also have a significant removal of soluble collagen in the dEBM samples compared to TX100 (p < 0.05).
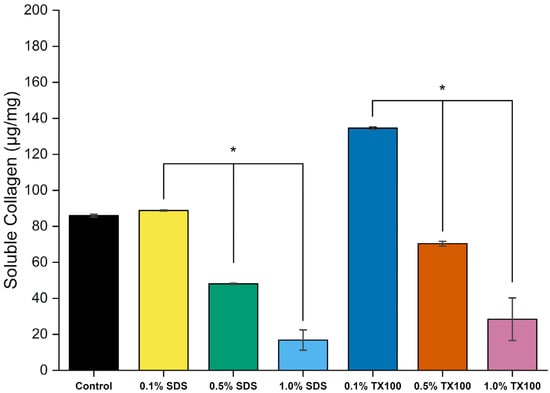
Figure 15.
Soluble collagen concentrations of dEBM under varying conditions. All data are shown as mean ± standard deviation (n = 2); *, p < 0.05.
SDS is a strong anionic detergent that, during decellularization, aggressively solubilizes cell membranes and extracts loosely bound or soluble ECM proteins—including non-fibrillar collagens. As a result, the remaining scaffold becomes relatively consists of cross linked, fibrillar collagen. In contrast, TX100 is a milder nonionic surfactant that primarily disrupts lipid membranes while preserving protein–protein interactions within the ECM, leading to greater retention of soluble collagen. These trends were consistent with the SDS-PAGE analysis of the samples. Notably, decellularization with higher concentrations of SDS (0.5% and 1.0%) yielded scaffolds with more intact and cross-linked fibrillar collagen. However, these samples also may retain fewer non-collagenous ECM proteins, which are important contributors to osteogenesis.
3.2.7. Amino Acid Analysis
The amino acid composition of control and dEBM was analyzed to evaluate the effect of decellularization treatments on protein integrity. Table 3 summarizes the amino acid profiles across all conditions.
Table 3.
Amino acid composition of control and dEBM samples treated with varying concentrations of SDS and TX100.
Glycine was the most abundant amino acid in both control and treated samples, consistent with the high collagen content of bone. Collagen α-chains are predominantly composed of repeating Gly–Pro–X motifs, explaining the high glycine levels. Alanine and glutamic acid were also found in relatively high abundance across all samples.
Proline content markedly decreased in all decellularized samples compared to the control. This reduction may be attributed to partial degradation or loss of structural ECM proteins during the decellularization process. Proline plays a crucial role in maintaining the secondary structure and thermal stability of the collagen triple helix [63]; thus, its reduction may indicate a slight compromise in matrix structural integrity.
Negligible amounts of threonine were detected in both control and decellularized samples, consistent with its low abundance in bone tissue. Cysteine and tryptophan were excluded from the analysis due to their degradation during acid hydrolysis [64].
Hydroxyproline—a collagen-specific imino acid that stabilizes the triple helix—comprised a larger fraction of the organic matrix as decellularizing-agent concentration increased [65]. This pattern is consistent with the removal of non-collagenous ECM proteins, yielding dEBM scaffolds enriched in fibrillar type I collagen.
Although most amino acids remained relatively stable, the observed decrease in hydroxyproline, proline and histidine content suggest that detergent treatment may lead to minor alterations in the ECM structure, particularly at higher concentrations.
3.2.8. Total Collagen Content Quantification
Beyond removing immunogenic cellular remnants, decellularization must preserve Beyond eliminating immunogenic cellular remnants, decellularization must preserve the scaffold’s osteoconductive cues. Among these, type I collagen is critical as it provides tensile strength, supports osteoblast adhesion and mineral nucleation, and regulates fibrillogenesis. It should therefore remain a major component of the decellularized extracellular bone matrix (dEBM) [23,61].
Collagen from marine sources is hydrophilic, providing favorable cell attachment sites, and has been widely applied in bone tissue engineering. It stimulates mesenchymal stem cell differentiation toward osteoblasts, enhances osteoblast proliferation, and contributes to the immunomodulatory environment of bone remodeling.
Figure 16 shows the collagen content of the samples, determined from hydroxyproline analysis with replicates. Control samples contained 434.67 ± 36.48 µg/mg of collagen. After demineralization and decellularization, the relative collagen fraction increased, most notably in samples treated with 1.0% SDS, which reached 867.41 ± 41.92 µg/mg. This increase reflects the relative enrichment of collagen due to the removal of other extracellular matrix (ECM) constituents such as proteoglycans and non-collagenous proteins, rather than an absolute increase in collagen content. The use of the studied decellularizing agents above the concentration of 0.5% showed significant increase in fraction of the collagen in the dEBM samples which aligns to the changes physico-chemical changes described above.
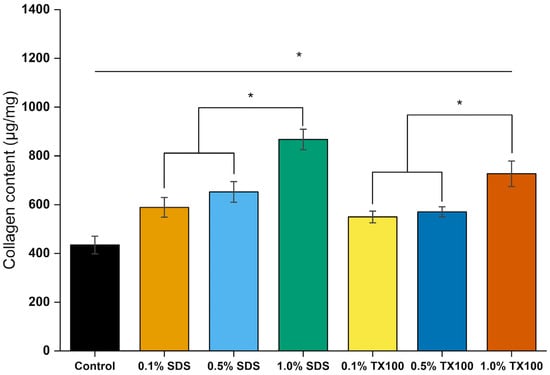
Figure 16.
Total collagen concentrations of dEBM under varying conditions based on hydroxyproline assay. All data are shown as mean ± standard deviation (n = 2); *, p < 0.05.
Marine-derived collagen has additional biological functions relevant to osteogenesis. It can reduce inflammation, support chondrogenic differentiation (facilitating endochondral ossification), improve bone mineral density, and stimulate osteogenic activity and new collagen synthesis [16,18,66].
Selecting an appropriate decellularization protocol is therefore critical for producing high-quality ECM from alternative sources. The high collagen content obtained under the studied conditions suggests favorable osteogenic potential. Nonetheless, further studies are needed to evaluate biocompatibility and cytotoxicity, as this work primarily highlights the potential of tuna bones as a source of biomaterials for bone regeneration while simultaneously providing a sustainable pathway for upcycling fish processing waste.
4. Conclusions
This study demonstrated the potential of tuna bones as a sustainable source of extracellular matrix (ECM) through sequential demineralization and decellularization. Kinetic analysis revealed that demineralization followed a second-order reaction between calcium and hydrochloric acid, with residual calcium content reduced to negligible levels after 6 h, as supported by thermogravimetric analysis and scanning electron microscopy. ATR–FTIR analysis confirmed reductions in phosphate and carbonate bands and preservation of key amide peaks, while differential scanning calorimetry indicated the successful removal of bound water, supporting effective mineral extraction.
Decellularization using SDS and Triton X-100 significantly reduced cellular content, as evidenced by H&E staining and dsDNA quantification. SDS-PAGE analysis confirmed the retention of major collagen bands in samples treated with ≤0.5% detergent, indicating preservation of ECM protein structure. Amino acid analysis further supported the structural integrity of the matrix, with glycine, alanine, and glutamic acid remaining abundant across all conditions.
Collectively, the results highlight the feasibility of producing structurally and biochemically stable ECM from tuna bones. The resulting decellularized tuna bone matrix (dEBM) holds promise for biomedical applications, including bone regeneration and wound healing, due to its preserved structural, thermal, and mechanical properties.
Future studies should include ECM protein quantification, expanded histological assessments, and in vivo biocompatibility tests to validate clinical potential. We did not evaluate alkaline or oxidative post-treatments in this study. Although alkaline or oxidative post-treatments were not evaluated here, subsequent work should systematically evaluate post-HCl options (bleaching and sterilization) across concentration–time exposure and washing regimes, benchmarking effects on ECM integrity, mechanical properties, and residuals. In addition, future investigations should assess the biosafety of this alternative ECM to ensure its suitability for biomedical applications. These findings establish a foundation for the industrial-scale valorization of tuna processing waste into high-value biomaterials.
Author Contributions
Conceptualization, R.B.; methodology, J.A., Z.C.B., C.L.B., M.L.J., E.E. and K.D.D.V.; software, J.A., Z.C.B., C.L.B., M.L.J., E.E. and K.D.D.V.; validation, R.B., J.A., Z.C.B., C.L.B., M.L.J., E.E. and K.D.D.V.; formal analysis, R.B., J.A., Z.C.B., C.L.B., M.L.J., E.E. and K.D.D.V.; investigation, R.B. and Z.C.B.; resources, R.B.; data curation, R.B., M.L.J. and K.D.D.V.; writing— original draft preparation, Z.C.B. and M.L.J.; writing—review and editing, R.B. and C.L.B.; visualization, R.B.; supervision, R.B.; project administration, R.B.; funding acquisition, R.B. All authors have read and agreed to the published version of the manuscript.
Funding
This research was funded by the Department of Science and Technology (DOST) under the Niche Centers in the Regions (NICER)—Science for Change Program (S4CP), grant number and DPMIS number 2021-03-A2-NICER-3209.
Institutional Review Board Statement
Not applicable.
Data Availability Statement
The datasets generated and analyzed during the current study are available from the corresponding author on reasonable request.
Acknowledgments
We would like to thank the Premier Research Institute of Science and Mathematics (PRISM) at the Mindanao State University—Iligan Institute of Technology for the lyophilization of our samples. We would also extend our thanks to the Philippine Genome Center at the University of the Philippines—Mindanao for the DNA extraction and quantification analysis.
Conflicts of Interest
The authors declare no conflicts of interest. The funders had no role in the design of the study; in the collection, analyses, or interpretation of data; in the writing of the manuscript; or in the decision to publish the results.
References
- Karsdal, M.; Cox, T.R.; Parker, A.L.; Willumsen, N.; Sand, J.M.B.; Jenkins, G.; Hansen, H.H.; Oldenburger, A.; Geillinger-Kaestle, K.E.; Larsen, A.T.; et al. Advances in Extracellular Matrix-Associated Diagnostics and Therapeutics. J. Clin. Med. 2025, 14, 1856. [Google Scholar] [CrossRef] [PubMed]
- Kang, H.J.; Park, S.S.; Tripathi, G.; Lee, B.T. Injectable Demineralized Bone Matrix Particles and Their Hydrogel Bone Grafts Loaded with β-Tricalcium Phosphate Powder and Granules: A Comparative Study. Mater. Today Bio 2022, 16, 100422. [Google Scholar] [CrossRef] [PubMed]
- Neto, I.V.d.S.; Durigan, J.L.Q.; da Silva, A.S.R.; Marqueti, R.d.C. Adipose Tissue Extracellular Matrix Remodeling in Response to Dietary Patterns and Exercise: Molecular Landscape, Mechanistic Insights, and Therapeutic Approaches. Biology 2022, 11, 765. [Google Scholar] [CrossRef]
- Bual, R.; Labares, M.; Valle, K.D.D.; Pague, J.; Bantilan, Z.C.; Ducao, P.G.; Alimasag, J.; Acibar, C. Characterization of Decellularized Extracellular Matrix from Milkfish (Chanos chanos) Skin. Biomimetics 2022, 7, 213. [Google Scholar] [CrossRef] [PubMed]
- Mir, T.A.; Alzhrani, A.; Nakamura, M.; Iwanaga, S.; Wani, S.I.; Altuhami, A.; Kazmi, S.; Arai, K.; Shamma, T.; Obeid, D.A.; et al. Whole Liver Derived Acellular Extracellular Matrix for Bioengineering of Liver Constructs: An Updated Review. Bioengineering 2023, 10, 1126. [Google Scholar] [CrossRef]
- Chameettachal, S.; Venuganti, A.; Parekh, Y.; Prasad, D.; Joshi, V.P.; Vashishtha, A.; Basu, S.; Singh, V.; Bokara, K.K.; Pati, F. Human Cornea-Derived Extracellular Matrix Hydrogel for Prevention of Post-Traumatic Corneal Scarring: A Translational Approach. Acta Biomater. 2023, 171, 289–307. [Google Scholar] [CrossRef]
- Zhou, H.; Li, W.; Pan, L.; Zhu, T.; Zhou, T.; Xiao, E.; Wei, Q. Human Extracellular Matrix (ECM)-like Collagen and Its Bioactivity. Regen. Biomater. 2024, 11, rbae008. [Google Scholar] [CrossRef]
- Chen, Z.; Du, C.; Liu, S.; Liu, J.; Yang, Y.; Dong, L.; Zhao, W.; Huang, W.; Lei, Y. Progress in Biomaterials Inspired by the Extracellular Matrix. Giant 2024, 19, 100323. [Google Scholar] [CrossRef]
- Bual, R.P.; Ijima, H. Intact Extracellular Matrix Component Promotes Maintenance of Liver-Specific Functions and Larger Aggregates Formation of Primary Rat Hepatocytes. Regen. Ther. 2019, 11, 258–268. [Google Scholar] [CrossRef]
- Ijima, H.; Nakamura, S.; Bual, R.; Shirakigawa, N.; Tanoue, S. Physical Properties of the Extracellular Matrix of Decellularized Porcine Liver. Gels 2018, 4, gels4020039. [Google Scholar] [CrossRef]
- Kjartansson, H.; Olafsson, I.H.; Karason, S.; Thorisson, H.; Baldursson, B.T.; Gunnarsson, E.; Jorundsson, E.; Sigurjonsson, G.F. Use of Acellular Fish Skin for Dura Repair in an Ovine Model: A Pilot Study. Open J. Mod. Neurosurg. 2015, 5, 124–136. [Google Scholar] [CrossRef]
- Kamalvand, M.; Biazar, E.; Daliri-Joupari, M.; Montazer, F.; Rezaei-Tavirani, M.; Heidari-Keshel, S. Design of a Decellularized Fish Skin as a Biological Scaffold for Skin Tissue Regeneration. Tissue Cell 2021, 71, 101509. [Google Scholar] [CrossRef] [PubMed]
- Eriksson, A.; Burcharth, J.; Rosenberg, J. Animal Derived Products May Conflict with Religious Patients’ Beliefs. BMC Med. Ethics 2013, 14, 48. [Google Scholar] [CrossRef]
- Fu, Y.; Li, C.; Wang, Q.; Gao, R.; Cai, X.; Wang, S.; Zhang, Y. The Protective Effect of Collagen Peptides from Bigeye Tuna (Thunnus obesus) Skin and Bone to Attenuate UVB-Induced Photoaging via MAPK and TGF-β Signaling Pathways. J. Funct. Foods 2022, 93, 105101. [Google Scholar] [CrossRef]
- Abejón, R.; Abejón, A.; Garea, A.; Tsuru, T.; Irabien, A.; Belleville, M.P.; Sanchez-Marcano, J. In Silico Evaluation of Ultrafiltration and Nanofiltration Membrane Cascades for Continuous Fractionation of Protein Hydrolysate from Tuna Processing Byproduct. Ind. Eng. Chem. Res. 2016, 55, 7493–7504. [Google Scholar] [CrossRef]
- Nurilmala, M.; Hizbullah, H.H.; Karnia, E.; Kusumaningtyas, E.; Ochiai, Y. Characterization and Antioxidant Activity of Collagen, Gelatin, and the Derived Peptides from Yellowfin Tuna (Thunnus albacares) Skin. Mar. Drugs 2020, 18, 98. [Google Scholar] [CrossRef]
- Vázquez, J.A.; Pedreira, A.; Durán, S.; Cabanelas, D.; Souto-Montero, P.; Martínez, P.; Mulet, M.; Pérez-Martín, R.I.; Valcarcel, J. Biorefinery for Tuna Head Wastes: Production of Protein Hydrolysates, High-Quality Oils, Minerals and Bacterial Peptones. J. Clean. Prod. 2022, 357, 131909. [Google Scholar] [CrossRef]
- Jafari, H.; Lista, A.; Siekapen, M.M.; Ghaffari-Bohlouli, P.; Nie, L.; Alimoradi, H.; Shavandi, A. Fish Collagen: Extraction, Characterization, and Applications for Biomaterials Engineering. Polymers 2020, 12, 2230. [Google Scholar] [CrossRef] [PubMed]
- Toppe, J.; Albrektsen, S.; Hope, B.; Aksnes, A. Chemical Composition, Mineral Content and Amino Acid and Lipid Profiles in Bones from Various Fish Species. Comp. Biochem. Physiol.-B Biochem. Mol. Biol. 2007, 146, 395–401. [Google Scholar] [CrossRef] [PubMed]
- Gruskin, E.; Doll, B.A.; Futrell, F.W.; Schmitz, J.P.; Hollinger, J.O. Demineralized Bone Matrix in Bone Repair: History and Use. Adv. Drug Deliv. Rev. 2012, 64, 1063–1077. [Google Scholar] [CrossRef]
- Liu, Z.; Jiang, X.; Wang, K.; Zhou, Y.; Li, T.; Gao, J.; Wang, L. Preparation of Fish Decalcified Bone Matrix and Its Bone Repair Effect in Rats. Front. Bioeng. Biotechnol. 2023, 11, 1134992. [Google Scholar] [CrossRef] [PubMed]
- Pang, S.; Su, F.Y.; Green, A.; Salim, J.; McKittrick, J.; Jasiuk, I. Comparison of Different Protocols for Demineralization of Cortical Bone. Sci. Rep. 2021, 11, 7012. [Google Scholar] [CrossRef]
- Neishabouri, A.; Soltani Khaboushan, A.; Daghigh, F.; Kajbafzadeh, A.M.; Majidi Zolbin, M. Decellularization in Tissue Engineering and Regenerative Medicine: Evaluation, Modification, and Application Methods. Front. Bioeng. Biotechnol. 2022, 10, 805299. [Google Scholar] [CrossRef]
- Kasravi, M.; Ahmadi, A.; Babajani, A.; Mazloomnejad, R.; Hatamnejad, M.R.; Shariatzadeh, S.; Bahrami, S.; Niknejad, H. Immunogenicity of Decellularized Extracellular Matrix Scaffolds: A Bottleneck in Tissue Engineering and Regenerative Medicine. Biomater. Res. 2023, 27, 10. [Google Scholar] [CrossRef]
- Allu, I.; Sahi, A.K.; Koppadi, M.; Gundu, S.; Sionkowska, A. Decellularization Techniques for Tissue Engineering: Towards Replicating Native Extracellular Matrix Architecture in Liver Regeneration. J. Funct. Biomater. 2023, 14, 518. [Google Scholar] [CrossRef]
- Li, P.; Feng, M.; Hu, X.; Zhang, C.; Zhu, J.; Xu, G.; Li, L.; Zhao, Y. Biological Evaluation of Acellular Bovine Bone Matrix Treated with NaOH. J. Mater. Sci. Mater. Med. 2022, 33, 58. [Google Scholar] [CrossRef]
- de Sousa Lopes, M.; Gomes, M.J.P.; de Souza, F.F.P.; Castro-Silva, I.I.; Mattos, A.L.A. Influence of Hydrogen Peroxide on Composition, Thermostability, Porosity and Swelling of Collagen Matrices of Demineralized Porcine Cortical Bone. Brazilian Arch. Biol. Technol. 2024, 67, e24230742. [Google Scholar] [CrossRef]
- Arellano, F.M.; Bual, R.; Bantilan, Z.C.; Alimasag, J.; Aron, J.; Baclayon, L.; Nisperos, M.J.; Valle, K.D.D.; Ducao, P.G.; Lumancas, G.; et al. Upcycling Waste Tilapia (Oreochromis niloticus) Scales through a Decellularization Process for Extracellular Matrix Extraction. Mater. Res. Express 2024, 11, 025101. [Google Scholar] [CrossRef]
- Massaro, M.S.; Pálek, R.; Rosendorf, J.; Červenková, L.; Liška, V.; Moulisová, V. Decellularized Xenogeneic Scaffolds in Transplantation and Tissue Engineering: Immunogenicity versus Positive Cell Stimulation. Mater. Sci. Eng. C 2021, 127, 112203. [Google Scholar] [CrossRef] [PubMed]
- Aron, J.; Bual, R.; Alimasag, J.; Arellano, F.; Baclayon, L.; Bantilan, Z.C.; Lumancas, G.; Nisperos, M.J.; Labares, M.; Valle, K.D.D.; et al. Effects of Various Decellularization Methods for the Development of Decellularized Extracellular Matrix from Tilapia (Oreochromis Niloticus) Viscera. Int. J. Biomater. 2024, 2024, 6148496. [Google Scholar] [CrossRef] [PubMed]
- Emami, A.; Talaei-Khozani, T.; Vojdani, Z.; Zarei Fard, N. Comparative Assessment of the Efficiency of Various Decellularization Agents for Bone Tissue Engineering. J. Biomed. Mater. Res.-Part B Appl. Biomater. 2021, 109, 19–32. [Google Scholar] [CrossRef]
- Han, Y.; Zhang, B.; Li, J.; Cen, L.; Zhao, L.; Xi, Z. Preparation of Extracellular Matrix of Fish Swim Bladders by Decellularization with Supercritical Carbon Dioxide. Bioresour. Bioprocess. 2023, 10, 14. [Google Scholar] [CrossRef] [PubMed]
- Yang, J.Z.; Qiu, L.H.; Xiong, S.H.; Dang, J.L.; Rong, X.K.; Hou, M.M.; Wang, K.; Yu, Z.; Yi, C.G. Decellularized Adipose Matrix Provides an Inductive Microenvironment for Stem Cells in Tissue Regeneration. World J. Stem Cells 2020, 12, 585–603. [Google Scholar] [CrossRef]
- AAT Bioquest, Inc. PBS (Phosphate Buffered Saline) (1X, pH 7.4). Available online: https://www.aatbio.com/resources/buffer-preparations-and-recipes/pbs-phosphate-buffered-saline (accessed on 15 August 2025).
- Levenspiel, O. Chemical Reaction Engineering. Ind. Eng. Chem. Res. 1999, 38, 4140–4143. [Google Scholar] [CrossRef]
- Ijima, H.; Nakamura, S.; Bual, R.P.; Yoshida, K. Liver-Specific Extracellular Matrix Hydrogel Promotes Liver-Specific Functions of Hepatocytes in Vitro and Survival of Transplanted Hepatocytes in Vivo. J. Biosci. Bioeng. 2019, 128, 365–372. [Google Scholar] [CrossRef] [PubMed]
- Pavlović, B.; Cvijetić, N.; Dragačević, L.; Ivković, B.; Vujić, Z.; Kuntić, V. Direct UV Spectrophotometry and HPLC Determination of Triton X-100 in Split Virus Influenza Vaccine. J. AOAC Int. 2016, 99, 396–400. [Google Scholar] [CrossRef]
- Alizadeh, M.; Rezakhani, L.; Soleimannejad, M.; Sharifi, E.; Anjomshoa, M.; Alizadeh, A. Evaluation of Vacuum Washing in the Removal of SDS from Decellularized Bovine Pericardium: Method and Device Description. Heliyon 2019, 5, e02253. [Google Scholar] [CrossRef]
- Zhang, F.; Wang, A.; Li, Z.; He, S.; Shao, L. Preparation and Characterisation of Collagen from Freshwater Fish Scales. Food Nutr. Sci. 2011, 2, 818–823. [Google Scholar] [CrossRef]
- Nisperos, M.J.; Bacosa, H.; Lumancas, G.; Arellano, F.; Aron, J.; Baclayon, L.; Bantilan, Z.C.; Labares, M.; Bual, R. Time-Dependent Demineralization of Tilapia (Oreochromis niloticus) Bones Using Hydrochloric Acid for Extracellular Matrix Extraction. Biomimetics 2023, 8, 217. [Google Scholar] [CrossRef]
- Chang, R.; Overby, J. (Role) Aut Chemistry, 14th ed.; McGrawHill Book Company: New York, NY, USA; London, UK, 2022; ISBN 9781260784473. [Google Scholar]
- Bigi, A.; Ripamonti, A.; Cojazzi, G.; Pizzuto, G.; Roveri, N.; Koch, M.H.J. Structural Analysis of Turkey Tendon Collagen upon Removal of the Inorganic Phase. Int. J. Biol. Macromol. 1991, 13, 110–114. [Google Scholar] [CrossRef]
- Ariffin, A.F.; Yusof, N.; Mohd, S.; Rahman, S.A.; Ramalingam, S.; Mansor, A.; Min, N.G. Verifying Measurements of Residual Calcium Content in Demineralised Cortical Bone. Cell Tissue Bank. 2019, 20, 527–534. [Google Scholar] [CrossRef]
- Eagle, M.J.; Rooney, P.; Kearney, J.N. Development of an Improved Bone Washing and Demineralisation Process to Produce Large Demineralised Human Cancellous Bone Sponges. Cell Tissue Bank. 2015, 16, 569–578. [Google Scholar] [CrossRef]
- Anastassopoulou, J.; Kolovou, P.; Papagelopoulos, P.; Theophanides, T. The Role of β-Antagonists on the Structure of Human Bone-A Spectroscopic Study. Life Biomed. Sci. 2012, 25, 259–271. [Google Scholar]
- Rabotyagova, O.S.; Cebe, P.; Kaplan, D.L. Collagen Structural Hierarchy and Susceptibility to Degradation by Ultraviolet Radiation. Mater. Sci. Eng. C 2008, 28, 1420–1429. [Google Scholar] [CrossRef] [PubMed]
- Dixon, D.T.; Landree, E.N.; Gomillion, C.T. 3D-Printed Demineralized Bone Matrix-Based Conductive Scaffolds Combined with Electrical Stimulation for Bone Tissue Engineering Applications. ACS Appl. Bio Mater. 2024, 7, 4366–4378. [Google Scholar] [CrossRef]
- Abedin, E.; Lari, R.; Mahdavi Shahri, N.; Fereidoni, M. Development of a Demineralized and Decellularized Human Epiphyseal Bone Scaffold for Tissue Engineering: A Histological Study. Tissue Cell 2018, 55, 46–52. [Google Scholar] [CrossRef] [PubMed]
- Mkukuma, L.D.; Skakle, J.M.S.; Gibson, I.R.; Imrie, C.T.; Aspden, R.M.; Hukins, D.W.L. Effect of the Proportion of Organic Material in Bone on Thermal Decomposition of Bone Mineral: An Investigation of a Variety of Bones from Different Species Using Thermogravimetric Analysis Coupled to Mass Spectrometry, High-Temperature X-Ray Diffraction. Calcif. Tissue Int. 2004, 75, 321–328. [Google Scholar] [CrossRef]
- Modolon, H.B.; Inocente, J.; Bernardin, A.M.; Klegues Montedo, O.R.; Arcaro, S. Nanostructured Biological Hydroxyapatite from Tilapia Bone: A Pathway to Control Crystallite Size and Crystallinity. Ceram. Int. 2021, 47, 27685–27693. [Google Scholar] [CrossRef]
- Vaissier Welborn, V. Environment-Controlled Water Adsorption at Hydroxyapatite/Collagen Interfaces. Phys. Chem. Chem. Phys. 2021, 23, 13789–13796. [Google Scholar] [CrossRef]
- Blanco, I.; Siracusa, V. The Use of Thermal Techniques in the Characterization of Bio-Sourced Polymers. Materials 2021, 14, 1686. [Google Scholar] [CrossRef]
- Samouillan, V.; Delaunay, F.; Dandurand, J.; Merbahi, N.; Gardou, J.-P.; Yousfi, M.; Gandaglia, A.; Spina, M.; Lacabanne, C. The Use of Thermal Techniques for the Characterization and Selection of Natural Biomaterials. J. Funct. Biomater. 2011, 2, 230–248. [Google Scholar] [CrossRef] [PubMed]
- Bose, S.; Roy, M.; Bandyopadhyay, A. Recent Advances in Bone Tissue Engineering Scaffolds. Trends Biotechnol. 2012, 30, 546–554. [Google Scholar] [CrossRef]
- Yu, B.; Pacureanu, A.; Olivier, C.; Cloetens, P.; Peyrin, F. Assessment of the Human Bone Lacuno-Canalicular Network at the Nanoscale and Impact of Spatial Resolution. Sci. Rep. 2020, 10, 4567. [Google Scholar] [CrossRef]
- Lin, C.H.; Hsia, K.; Su, C.K.; Chen, C.C.; Yeh, C.C.; Ma, H.; Lu, J.H. Sonication-Assisted Method for Decellularization of Human Umbilical Artery for Small-Caliber Vascular Tissue Engineering. Polymers 2021, 13, 1699. [Google Scholar] [CrossRef]
- Moffat, D.; Ye, K.; Jin, S. Decellularization for the Retention of Tissue Niches. J. Tissue Eng. 2022, 13, 20417314221101151. [Google Scholar] [CrossRef]
- Solarte David, V.A.; Güiza-Argüello, V.R.; Arango-Rodríguez, M.L.; Sossa, C.L.; Becerra-Bayona, S.M. Decellularized Tissues for Wound Healing: Towards Closing the Gap Between Scaffold Design and Effective Extracellular Matrix Remodeling. Front. Bioeng. Biotechnol. 2022, 10, 821852. [Google Scholar] [CrossRef]
- McInnes, A.D.; Moser, M.A.J.; Chen, X. Preparation and Use of Decellularized Extracellular Matrix for Tissue Engineering. J. Funct. Biomater. 2022, 13, 240. [Google Scholar] [CrossRef]
- Koley, D.; Bard, A.J. Triton X-100 Concentration Effects on Membrane Permeability of a Single HeLa Cell by Scanning Electrochemical Microscopy (SECM). Proc. Natl. Acad. Sci. USA 2010, 107, 16783–16787. [Google Scholar] [CrossRef] [PubMed]
- Keane, T.J.; Swinehart, I.T.; Badylak, S.F. Methods of Tissue Decellularization Used for Preparation of Biologic Scaffolds and in Vivo Relevance. Methods 2015, 84, 25–34. [Google Scholar] [CrossRef]
- Amirrah, I.N.; Lokanathan, Y.; Zulkiflee, I.; Wee, M.F.M.R.; Motta, A.; Fauzi, M.B. A Comprehensive Review on Collagen Type I Development of Biomaterials for Tissue Engineering: From Biosynthesis to Bioscaffold. Biomedicines 2022, 10, 2307. [Google Scholar] [CrossRef] [PubMed]
- Berisio, R.; Granata, V.; Vitagliano, L.; Zagari, A. Imino Acids and Collagen Triple Helix Stability: Characterization of Collagen-like Polypeptides Containing Hyp-Hyp-Gly Sequence Repeats. J. Am. Chem. Soc. 2004, 126, 11402–11403. [Google Scholar] [CrossRef] [PubMed]
- Mohamad Zharif, Z.; Nur Azira, T.; Muhamad Shirwan, A.S.; Azilawati, M.I. Recent Advanced Techniques in Cysteine Determination: A Review. Food Res. 2020, 4, 2336–2346. [Google Scholar] [CrossRef] [PubMed]
- Taga, Y.; Tanaka, K.; Hattori, S.; Mizuno, K. In-Depth Correlation Analysis Demonstrates That 4-Hydroxyproline at the Yaa Position of Gly-Xaa-Yaa Repeats Dominantly Stabilizes Collagen Triple Helix. Matrix Biol. Plus 2021, 10, 100067. [Google Scholar] [CrossRef]
- Zhai, X.; Geng, X.; Li, W.; Cui, H.; Wang, Y.; Qin, S. Comprehensive Review on Application Progress of Marine Collagen Cross-Linking Modification in Bone Repairs. Mar. Drugs 2025, 23, 151. [Google Scholar] [CrossRef] [PubMed]
Disclaimer/Publisher’s Note: The statements, opinions and data contained in all publications are solely those of the individual author(s) and contributor(s) and not of MDPI and/or the editor(s). MDPI and/or the editor(s) disclaim responsibility for any injury to people or property resulting from any ideas, methods, instructions or products referred to in the content. |
© 2025 by the authors. Licensee MDPI, Basel, Switzerland. This article is an open access article distributed under the terms and conditions of the Creative Commons Attribution (CC BY) license (https://creativecommons.org/licenses/by/4.0/).