Article

Green Synthesis and Characterization of Iron Oxide Nanoparticles Using Egeria densa Plant Extract

1
Department of Biology, Morgan State University, Baltimore, MD 21251, USA
2
Federal Polytechnic Ile-Oluji, Ile-Oluji 351108, Ondo State, Nigeria
*
Authors to whom correspondence should be addressed.
Appl. Biosci. 2025, 4(2), 27; https://doi.org/10.3390/applbiosci4020027
Submission received: 27 March 2025 / Revised: 7 May 2025 / Accepted: 14 May 2025 / Published: 2 June 2025

Abstract

:
An aqueous leaf extract of Egeria densa was used to green-synthesize iron (II) and iron (III) oxide nanoparticles from ferrous sulphate and ferric chloride, respectively. The successful green synthesis of the nanoparticles was confirmed through UV–visible spectroscopy, and the colour of the mixtures changed from light-yellow to green-black and reddish-brown for FeO–NPs and Fe2O3–NPs, respectively. The morphological characteristics of the nanoparticles were determined using an X-ray diffractometer (XRD), a Fourier transform infrared spectrophotometer (FTIR), a transmission electron microscope (TEM), and energy-dispersive X-ray spectroscopy (EDX). The UV–Vis spectrum of the FeO–NPs showed a sharp peak at 290 nm due to the surface plasmon resonance, while that of the Fe2O3–NPs showed a sharp peak at 300 nm. TEM analysis revealed that the FeO–NPs were oval to hexagonal in shape and were clustered together with an average size of 18.49 nm, while the Fe2O3-NPs were also oval to hexagonal in shape, but some were irregularly shaped, and they clustered together with an average size of 27.96 nm. EDX analysis showed the presence of elemental iron and oxygen in both types of nanoparticles, indicating that these nanoparticles were essentially present in oxide form. The XRD patterns of both the FeO–NPs and Fe2O3–NPs depicted that the nanoparticles produced were crystalline in nature and exhibited the rhombohedral crystal structure of hematite. The FT-IR spectra revealed that phenolic compounds were present on the surface of the nanoparticles and were responsible for reducing the iron salts into FeO–NPs and Fe2O3–NPs. Conclusively, this work demonstrated for the first time the ability of Elodea aqueous extract to synthesize iron-based nanoparticles from both iron (II) and iron (III) salts, highlighting its versatility as a green reducing and stabilizing agent. The dual-path synthesis approach provides new insights into the influence of the precursor oxidation state on nanoparticle formation, thereby expanding our understanding of plant-mediated nanoparticle production and offering a sustainable route for the fabrication of diverse iron oxide nanostructures. Furthermore, it provides a simple, cost-effective, and environmentally friendly method for the synthesis of the FeO–NPs and Fe2O3–NPs using Egeria densa.

1. Introduction

Nanoparticles are a broad class of particulate substances with dimensions less than 100 nm [1]. They have been shown to possess distinctive physical, chemical, and biological properties, relative to their peers with bigger sizes. They also possess a larger surface area to volume ratio. These properties enable nanoparticles to exhibit high mechanical strength and chemical reactivity [2]. Nanoparticles can be produced from different types of metal oxides, e.g., copper, iron, gold, zinc, silver, magnesium, alginate, palladium, and iron oxides. These nanoparticles are utilized in different areas, ranging from packaging, cosmetics, coatings, electronics, and the field of biotechnology. Many of these nanoparticles’ particular applications are determined by their size, shape, dimensions, and strength [1,2,3]. Among nanoparticles prepared from metallic oxides, iron oxide nanoparticles (FeNPs) are the most remarkable due to their biocompatibility, magnetic properties, and variable oxidation states [4,5,6]. FeNPs are prepared from iron oxides (iron (II) or iron (III)), and they are highly polymorphic. In fact, there are 16 different types of iron oxide and oxide–hydroxide polymorphs. Some of these include α-Fe2O3 (hematite), β-Fe2O3, γ-Fe2O3 (maghemite), FeO (wüstite), and Fe3O4 (magnetite). Each of these polymorphs is unique and exhibits exceptional physical and chemical properties, which are beneficial for a broad range of applications [7]. Although FeNPs are frequently found in nature (as minerals in rocks and soils) [8], they can easily be prepared through diverse synthetic routes, which may be physical, chemical, or biological [9]. These different synthetic routes can result in the production of nanoparticles with diverse sizes, particle size distributions, morphologies, and physicochemical properties [10]. Compared to other nanoparticles, FeNPs have great potential as a result of their unique properties (superparamagnetism) and micro-configuration [11]. The unique characteristics of certain iron oxide and oxide–hydroxide polymorphs have led to their varied applications in diverse areas and fields; e.g., FeNPs have found extensive applications as high-performance anodes in lithium-ion batteries [12] and as catalysts for benzyl alcohol oxidation [13]. In medical/health fields, nanoparticles are utilized in immunoassays and the labelling of endothelial progenitor cells. They are also utilized in magnetic, targeted, site-specific drug delivery [14]; electromagnetic interference shielding; photoelectrochemical cells; and high-performance CO gas sensors [15]. They are also utilized in microwave absorbers, nonlinear optical systems, electrochromic devices, molecular electronics, and the production of magnetic recording media [6].
FeNPs are generally used for different purposes, including groundwater treatment and the removal of chemical pollutants, such as heavy metals, antibiotics, and other organic pollutants, from aquatic environments due to the high intrinsic reactivity of their surface sites [4]. FeNPs are also utilized in medical and other similar fields to aid in the selective destruction of tumour cells and in site-specific drug delivery [6]. They have also been found to be efficient in the destruction of several strains of pathogenic bacterial and fungi [16]. Although physical or chemical methods of nanoparticle synthesis are widely employed, they require the use of highly reactive and poisonous chemicals such as sodium borohydride and hydrazine hydrate, which can have unintended negative effects on plants, animals, and the environment [17]. Biological synthesis, also known as green synthesis, is a more attractive option since it is less expensive, more ecologically friendly, and does not consume or produce undesirable or dangerous byproducts. It is also easily scalable for large-scale synthesis [18]. The green synthesis of metal/metal-oxide nanomaterials using plant extracts is a very rapid method of nanoparticle synthesis because plant extracts possess a myriad of biomolecules [19]. These biomolecules possess antioxidant and reducing capabilities and are responsible for the reduction of metal salts to nanoparticles. Biomolecules can also act as a capping agent on the surface of nanoparticles, increasing the rate of reduction and stabilizing them [20]. Elodea sp. (e.g., Elodea canadensis, Egeria densa and Elodea nuttallii) are aquatic plants widely utilized for phytoremediation studies due to their widespread nature and potential to accumulate toxic pollutants [21]. Furthermore, the presence of a myriad of reducing agents such as polyphenols and flavonoids in high concentrations in Elodea makes it an ideal agent for the preparation of nanoparticles [22]. The present study reported the synthesis and characterization of iron oxide nanoparticles via a green chemistry route using E. densa plant extract. This study is significant because it avoids the use of hazardous chemicals (such as NaBH4, oleyl amine, liquid paraffin, and polyvinyl alcohol) commonly used in the chemical synthesis of nanoparticles [4,23] by making use of plant extract, thereby facilitating the development of an eco-friendly, cost-effective, scalable, and sustainable method for the synthesis of nanoparticles. Furthermore, green-synthesized nanoparticles have been reported to possess greater antioxidant activity, have more stability, and be less prone to oxidation compared to those produced through chemical synthesis [24]. While the green synthesis of nanoparticles using plant extracts has been extensively investigated, the majority of previous studies have focused predominantly on terrestrial plants such as Azadirachta indica, Jatropha curcas, and Moringa oleifera, with limited exploration of aquatic species such as Elodea, despite their ecological importance and diverse phytochemical profiles. The few available reports involving Elodea have largely concentrated on the synthesis of single types of nanoparticles (e.g., strontium oxide) [25] and have not systematically evaluated its versatility in reducing different iron precursors—specifically Fe2+ and Fe3+ salts—to produce iron-based nanoparticles. Furthermore, most existing studies do not compare the influence of the metal ion’s oxidation state on the properties of the resulting nanoparticles, especially when synthesized using the same plant extract. This leaves an important gap in understanding how plant-derived biomolecules interact with different metal precursors, potentially affecting reduction efficiency and nanoparticles’ morphology, size, stability, and functional properties. The present study addresses these limitations by employing Elodea aqueous extract to synthesize two distinct iron-based nanoparticles: one derived from an iron (II) salt and the other from an iron (III) salt. This comparative approach not only demonstrates the reducing capability and versatility of Elodea but also sheds light on the influence of the iron precursor type on nanoparticles’ formation, structure, and properties. This dual-path synthesis offers new insights into plant-mediated nanoparticle production, particularly highlighting the adaptability of Elodea extract and broadening the scope of green synthesis protocols for metal-based nanomaterials. Furthermore, the use E. densa in nanoparticle production promotes waste valorization, thereby contributing to waste-to-wealth or circular economy principles because E. densa is a noxious weed and its removal prevents it from cluttering rivers, resulting in an increase in water flow and preventing it from reducing oxygen levels and killing aquatic species.

2. Materials and Methods

2.1. Chemicals

All chemicals utilized in this study were of analytical grade and used without further purification. Some of these chemicals include iron (III) chloride hexahydrate (FeCl3.6H2O, 97%) and ferrous sulphate heptahydrate (FeSO4.7H2O, 97%) obtained from Sigma-Aldrich (St Louis, MO, USA), while sodium hydroxide pellets (NaOH, 99.0%) were supplied by Fisher-scientific. The carbon-coated TEM grids (40 µm × 40 µm, 200 mesh) were obtained from Electron Microscopy Sciences, Hatfield, PA, USA (CF200-Cu-UL-50). Stock solution preparation and other necessary dilutions were carried out using distilled water. The glassware was washed using non-ionic detergent, rinsed with distilled water, and dried in a hot air oven before use.

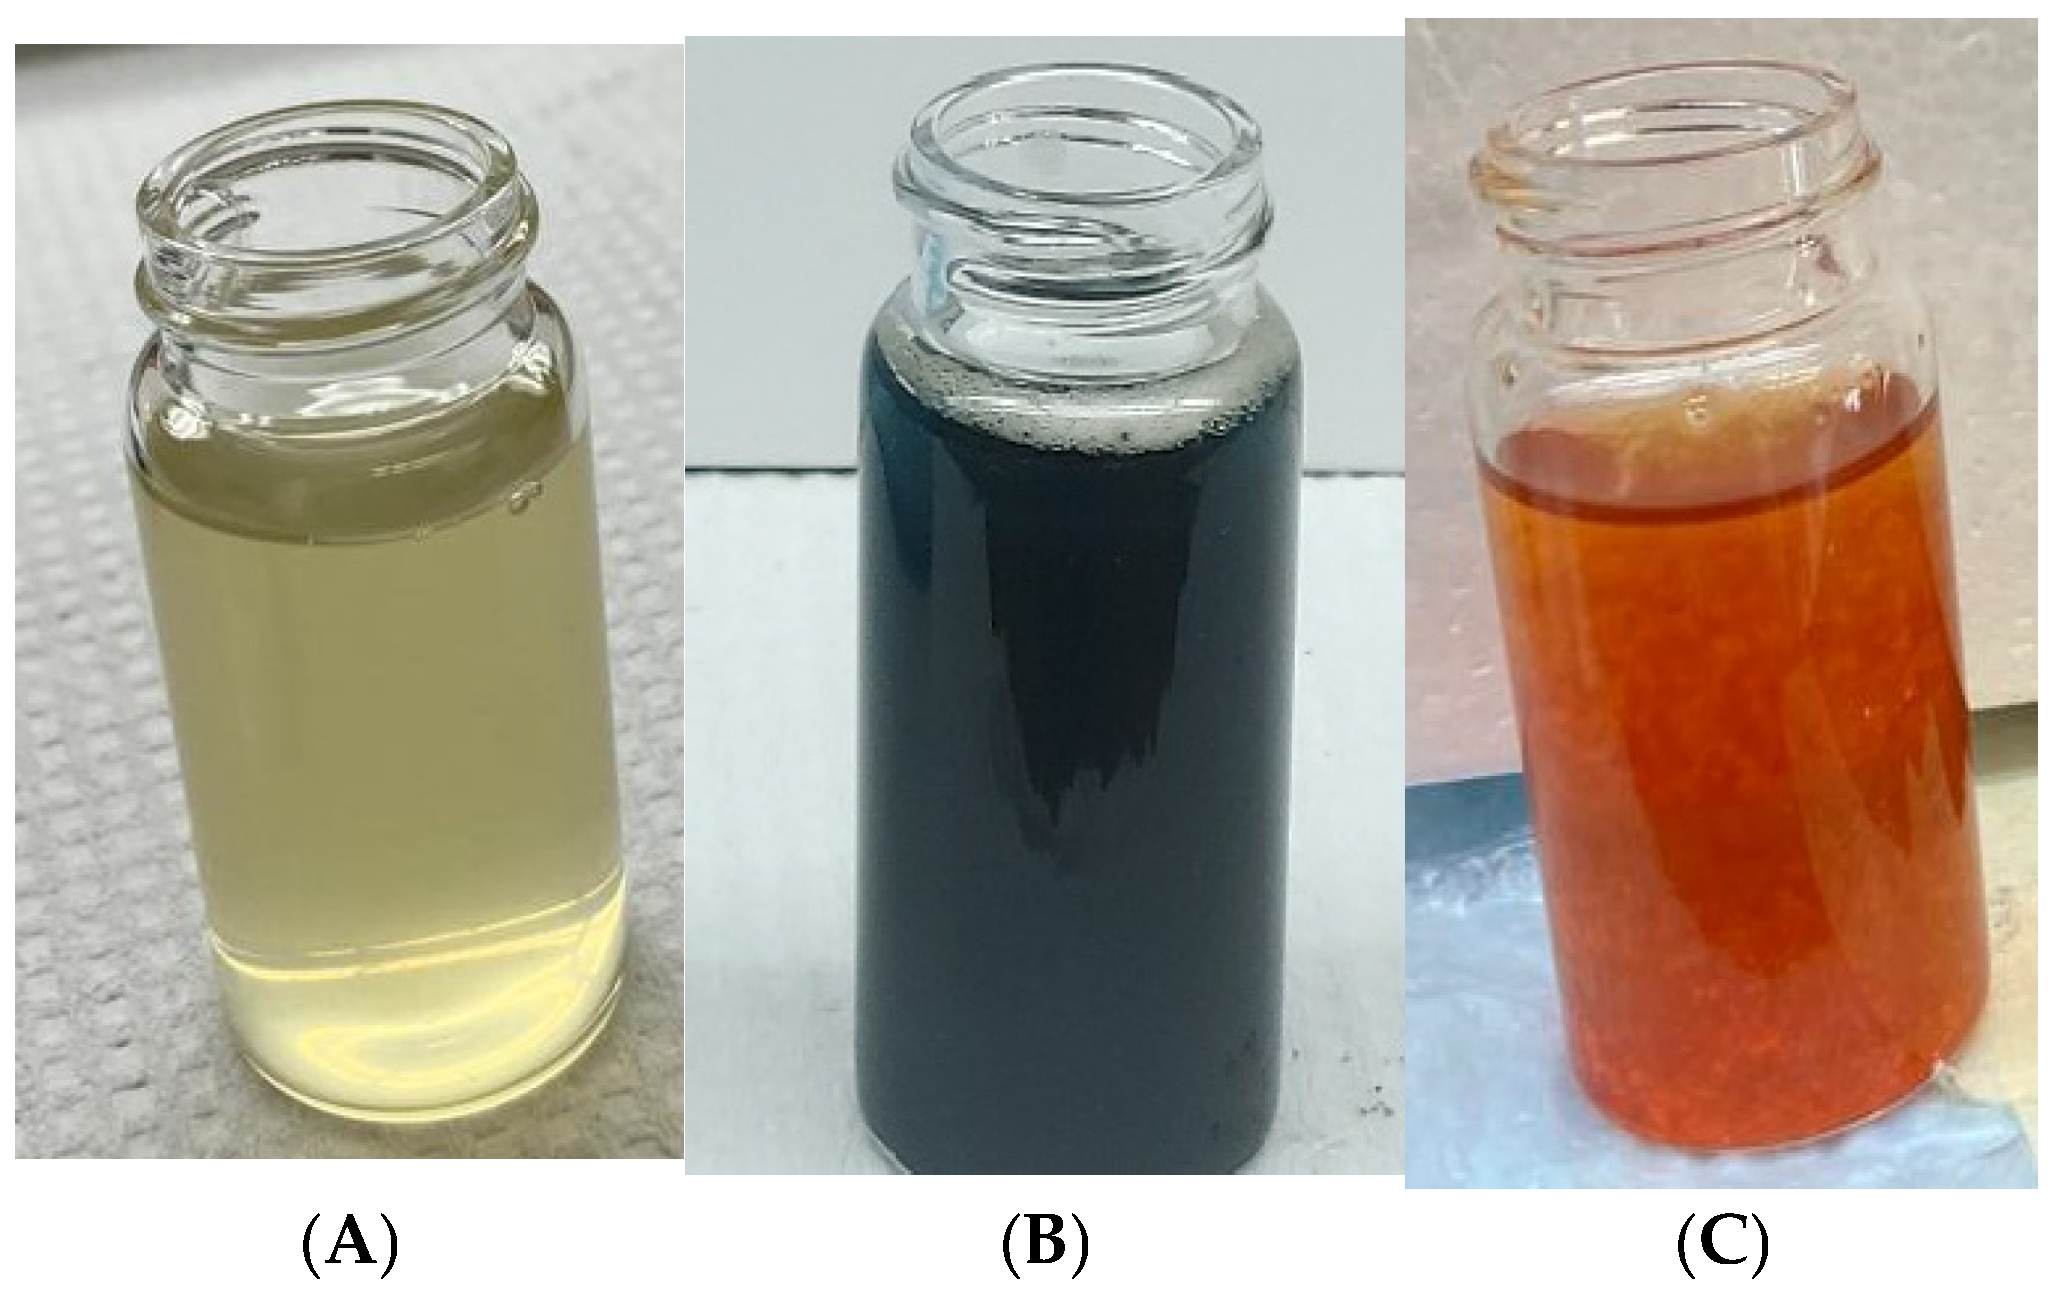
2.2. Preparation of Plant Extracts

The E. densa aqueous extract was prepared using a modified procedure from [25]. Fresh whole plants of E. densa, obtained from Carolina Biologicals and cultivated in the aquarium in the lab, were thoroughly washed with distilled water to eliminate impurities on the surface of the leaves and then air-dried at room temperature in a shaded area for 5 days. Approximately 2.5 g of the dried plant material was placed into a pestle and mortar and pulverized. The ground leaf samples were placed into 100 mL of distilled water (at a concentration of 25 mg/mL), boiled at 80 °C for 2 h with continuous stirring, and cooled. The cooled mixture was filtered using Whatman No. 1 filter paper (Sigma-Aldrich Ltd., St. Louis, MO, USA) to obtain an aqueous extract, which was further purified using 0.22 µm of PVDF polypropylene syringe filters. The light-yellowish final extracted E. densa leaf extract (ELE) (Figure 1A) was stored in a refrigerator (at 4 °C) and used as it was without further purification as a reducing agent.
(i).
Synthesis of iron oxide (FeO) nanoparticles from Fe2+ salts.
The synthesis of FeO nanoparticles was carried out based on a previous study detailing iron nanoparticle synthesis [4]. FeSO4.7H2O solution was used as the Fe precursor source for the formation of iron oxide nanoparticles (FeO–NPs). For the synthesis of FeO–NPs, the process began by preparing a 0.1 M FeSO4.7H2O solution in distilled water. This was followed by the addition of 100 mL of this solution to a 250 mL conical flask, positioned on a heating mantle set at a temperature of 70 °C. Subsequently, 50 mL of ELE was gradually added to this mixture from a cylinder using a Pasteur pipette at a rate of 45 drops per 30 s, while stirring constantly at 400 rpm. While still stirring, sodium hydroxide solution (1M) was added to the mixture in drops until the pH of the mixture reached between 8 and 9. This resulted in the formation of a green-black colloidal precipitate of FeO–NPs, as shown in Figure 1B.
(ii).
Synthesis of iron oxide (Fe2O3) nanoparticles from Fe3+ salts.
The synthesis of Fe2O3 nanoparticles was carried out based on a previous study detailing iron nanoparticle synthesis [4]. FeCl3.6H2O solution was used as the Fe precursor source for the formation of iron oxide nanoparticles (Fe2O3–NPs). For the synthesis of Fe2O3-NPs, the process began by preparing a 0.1 M FeCl3.6H2O solution in distilled water. This solution (100 mL) was added to a 250 mL conical flask, and the flask was then positioned on a heating mantle set at a temperature of 70 °C. Subsequently, 50 mL of ELE was gradually added to this mixture from a cylinder using a Pasteur pipette at a rate of 45 drops per 30 s while stirring constantly at 400 rpm. Sodium hydroxide solution (1M) was added to the mixture in drops until the pH of the mixture reached between 8 and 9. This resulted in the formation of reddish-brown colloidal precipitates of Fe2O3–NPs, as shown in Figure 1C.
The synthesized FeO–NPs and Fe2O3–NPs were separated by centrifugation at 5000 rpm for 5 min and subjected to multiple washing steps using 50% ethanol (at least three cycles) to remove excess extract and unreacted precursor salts, loosely bound phytochemicals, and other possible surface impurities from the nanoparticles. The washed pellets were subjected to pre-treatment at 100 °C for 8 h. They were further calcined in a muffle furnace at 400 °C for 2 h. The formed green-black precipitates (FeO–NPs) and reddish-brown precipitates (Fe2O3–NPs) were scraped up and used for characterization.

2.3. Characterization of FeNPs

(a)
UV–Vis Spectra Analysis
The characteristic surface plasmon resonance of FeO–NPs and Fe2O3-NPs were determined using a Biospec-1601 UV–vis spectrophotometer, Shimadzu Corporation, Kyoto, Japan. This was achieved by taking approximately 2 mL of the sample and placing into appropriately labelled Falcon tubes for subsequent UV–vis spectroscopic analysis of the maximum absorption characteristics associated with the formation of the nanoparticles. The nanoparticles were scanned at wavelengths ranging between 200 and 800 nm.
(b)
X-Ray Diffraction (XRD) Analysis
XRD analysis was also performed to confirm the successful synthesis and the crystallinity of FeO–NPs and Fe2O3–NPs synthesized using E. densa leaf extract. The XRD analysis was conducted at 40 kV and 35 mA, using Cu Kα radiation to produce X-rays with a wavelength of 0.154 nm at a rate of 0.02° min−1. The diffraction patterns were captured across a wide 2θ range (ranging from 0° to 80°). The average particle size of the nanoparticles was determined using the Debye–Scherrer’s formula given by the following Equation:
D = K λ β C o s θ
where D is the crystalline size in nm, λ is the X-ray wavelength (1.5406 Å), K is Scherer’s constant (0.9), β is the FWMH measured in radians; and θ is the Bragg angle of the peaks measured in radians. The peak position (2θ) and FWMH were determined by using Origin Pro 2024 software (Northampton, MA, USA). A crucial step in determining the crystalline nature of the nanoparticles is the calculation of the relative intensity (I/Io), a process made easier through recording the intensity of each diffraction peak. A comparison of the results with accepted norms—more specifically, the Joint Committee on Powder Diffraction Standards (JCPDS) database now known as the International Centre for Diffraction Data (ICDD)—was a major component of our investigation.
(c)
Fourier Transform Infrared Spectroscopy
The FTIR analysis of the FeO–NPs and Fe2O3-NPs were carried out on the dried and calcined nanoparticles, using a Thermo Scientific Nicolet IS 10 model, to determine the representative functional groups present on the surface of the nanoparticles.
(d)
TEM and EDX Analyses
The morphological characterization of the prepared FeO and Fe2O3 nanoparticles was determined using a JEM-2100F (JEOL, Tokyo, Japan) instrument, operating at an accelerating voltage of 200 kV. The samples were prepared by transferring 3 mL of the nanoparticle suspension into a 200-mesh carbon-coated copper grid. The excess liquid was removed with filter paper, and then the grid was placed in the TEM for visualization. Random photomicrographs at a scale of 200 nm and 1000 nm were taken. Energy-dispersive X-ray spectroscopy (EDX) was used to determine the elemental composition of atoms present in the nanoparticles by using the in-built JED-2300 detector present in the JEM-2100F instrument. The particle size and mean size distribution of the FeO–NPs and Fe2O3 nanoparticles were calculated from TEM micrographs using Image J software version 1.8.0 (National Institute of Health, Bethesda, MD, USA).

3. Results and Discussion

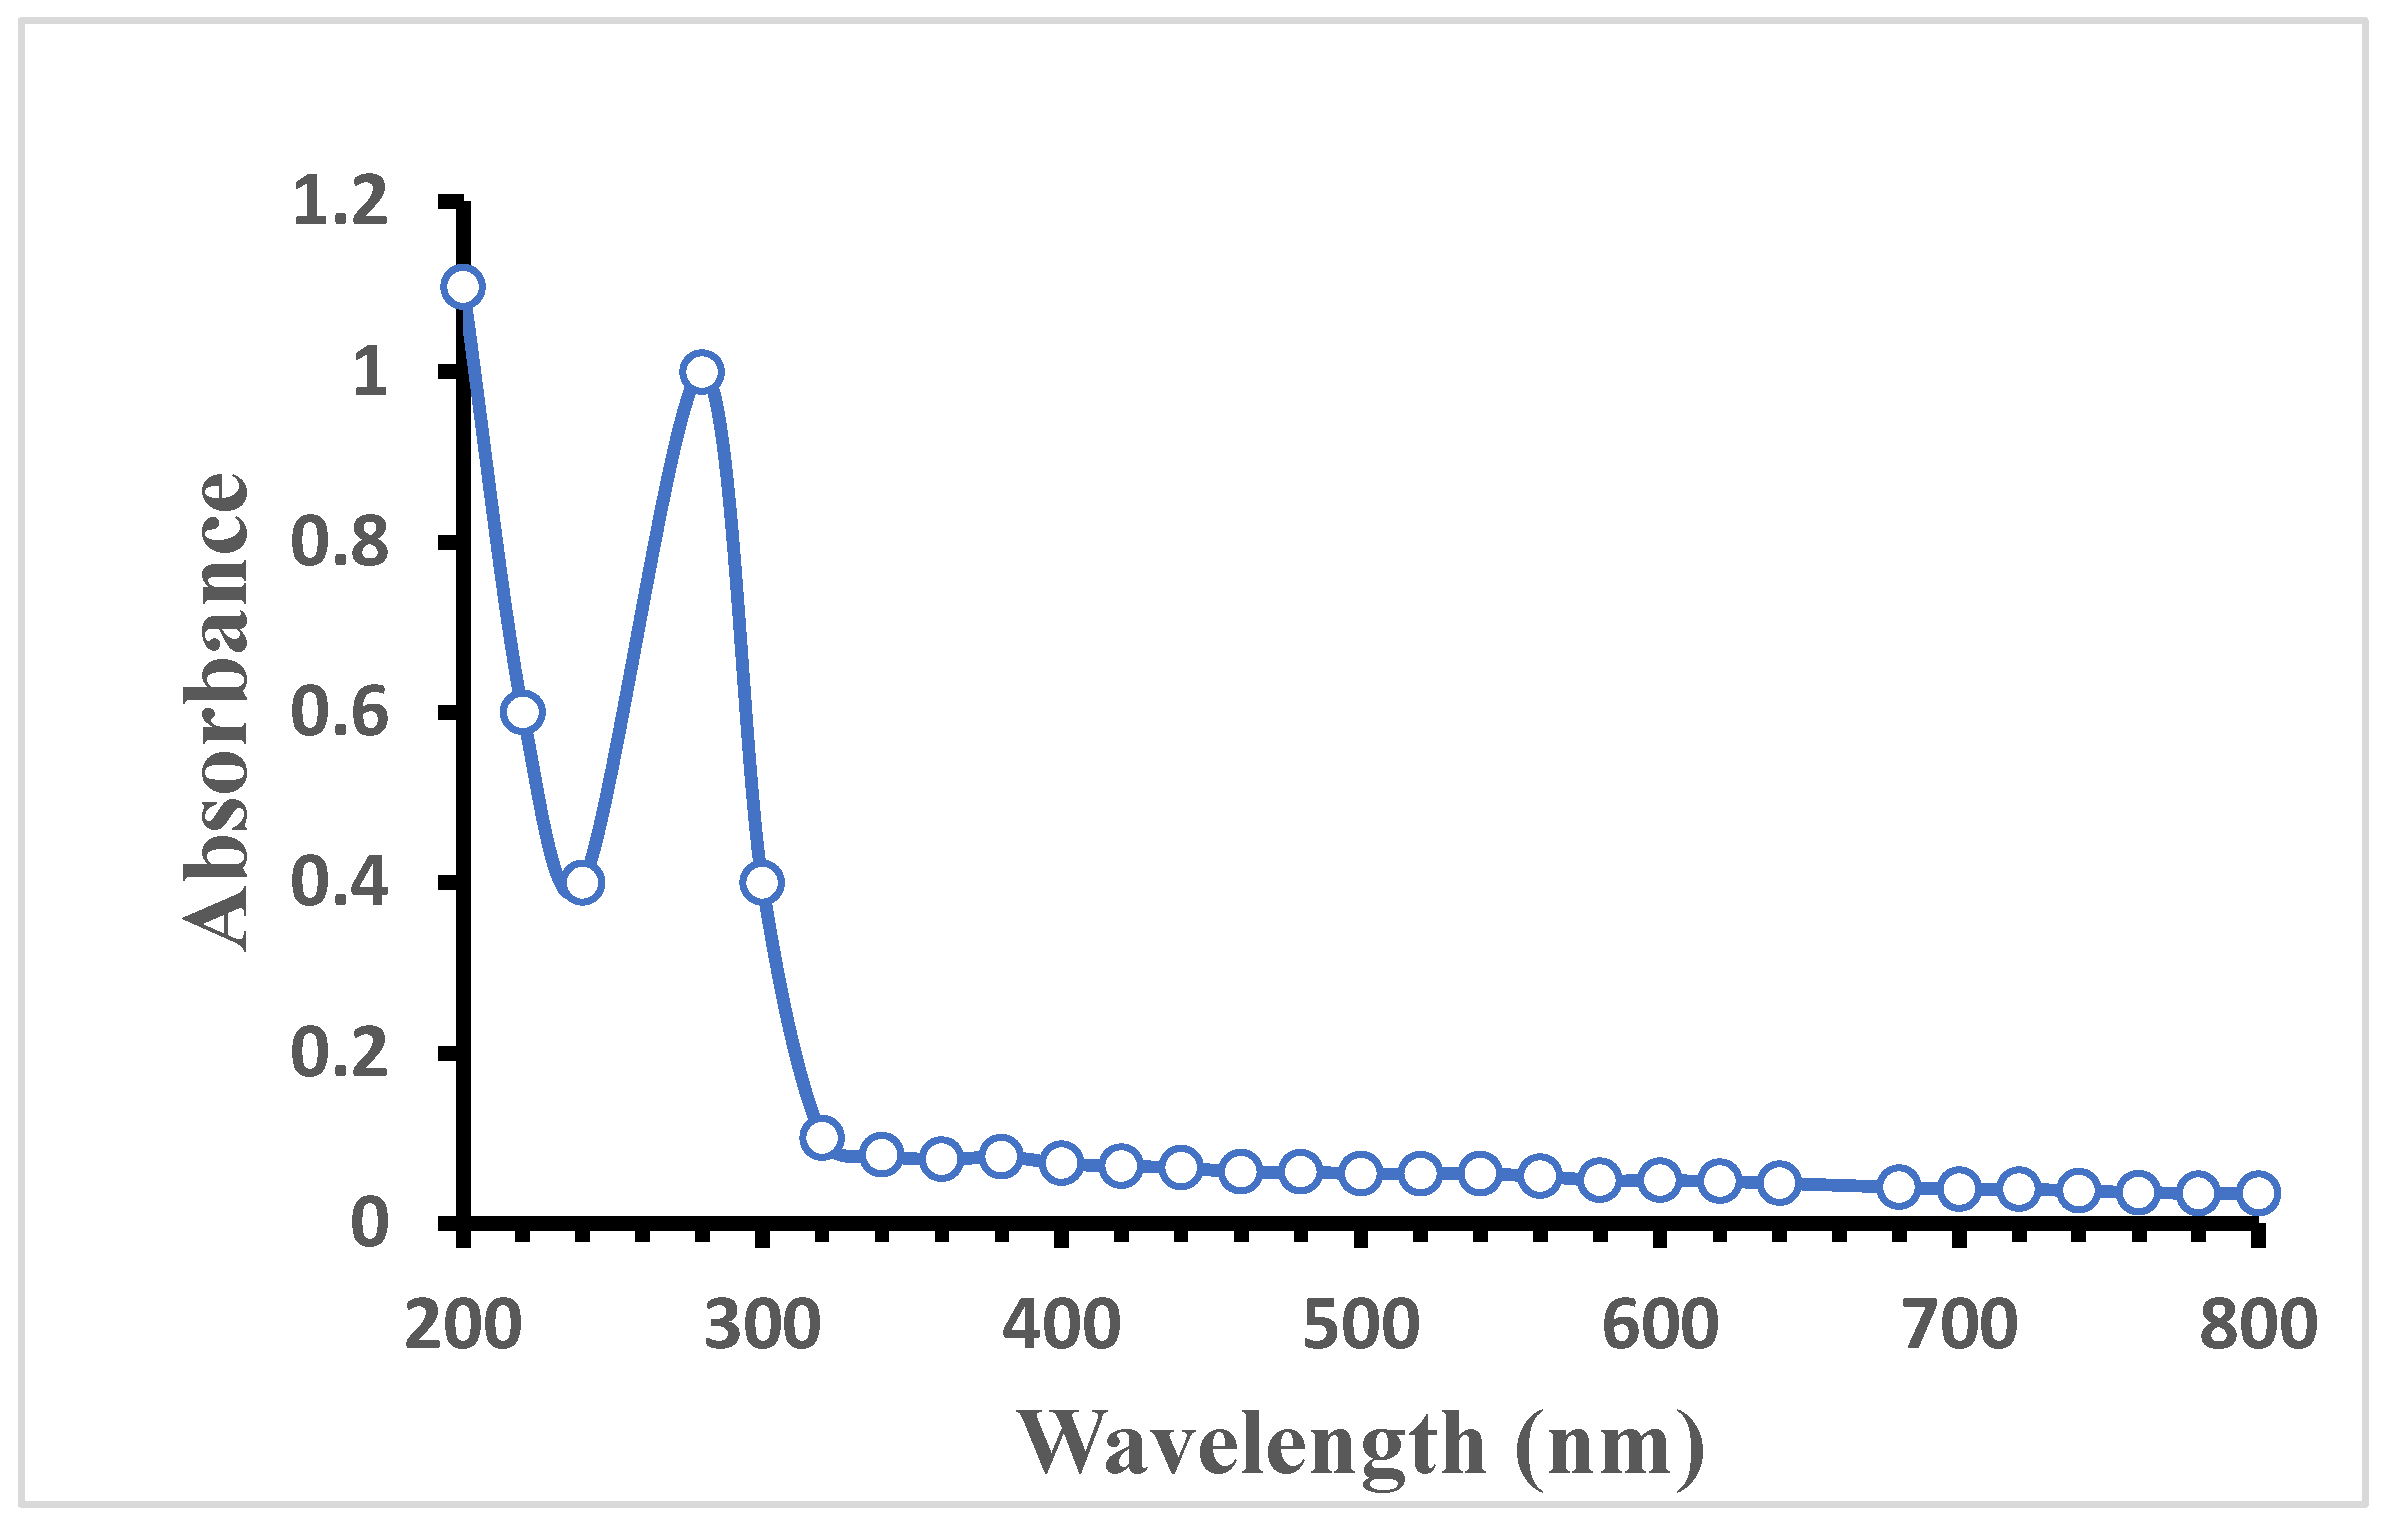
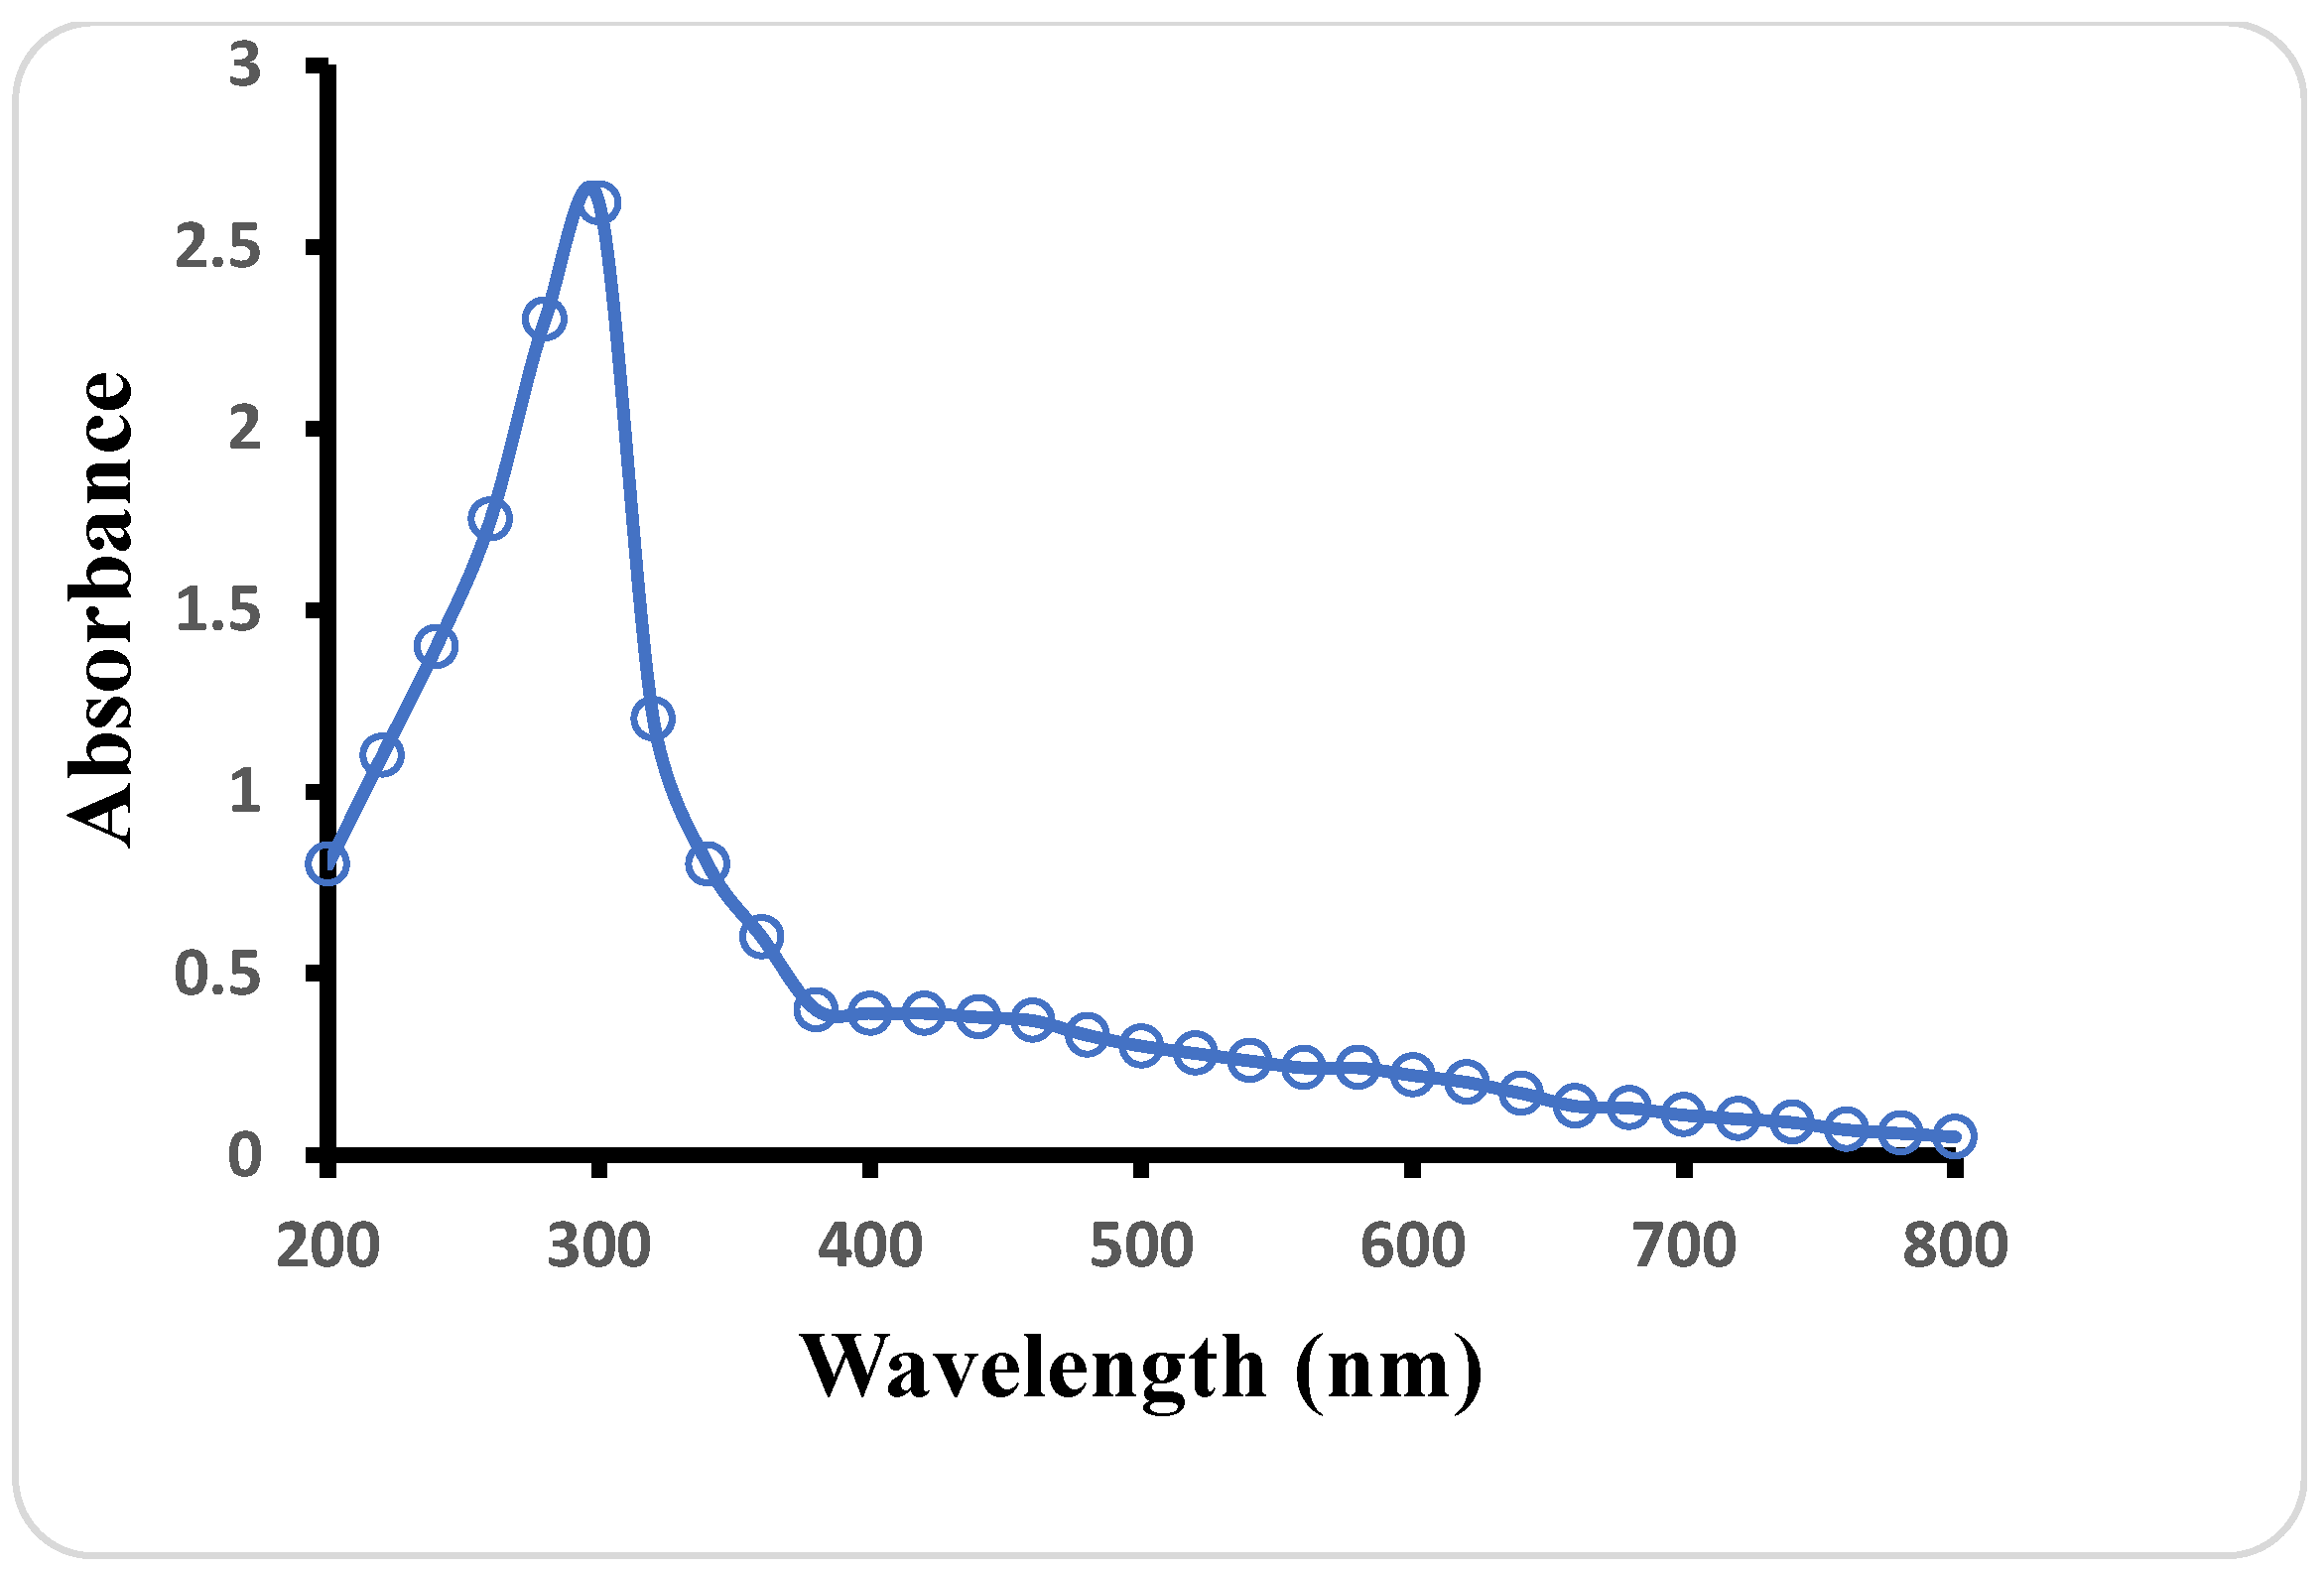
3.1. UV–Vis Spectroscopy

Notable colour changes were observed during the formation of both FeO–NPs and Fe2O3–NPs, indicating the synthesis of the nanoparticles. The synthesized iron oxide nanoparticles have continuous absorption in the visible range of 200–800 nm, and the spectrogram confirmed the successful synthesis of the nanoparticles. The characteristic surface plasmonic resonance (SPR) peak observed at 290 nm (Figure 2) indicates the successful synthesis of FeO–NPs, while the SPR peak at 300 nm indicates the formation of Fe2O3–NPs (Figure 3). The observed peaks are due to the inter-band transition of the core electrons of the Fe2O3–NPs. The shift in the position of the SRP peaks may be due to differences in the size and shape of the nanoparticles produced as well as their chemical composition [26]. A similar result was observed for iron nanoparticles prepared from Piper betle leaves [27]. This result is also similar to that obtained from iron nanoparticles prepared from Mimosa pudica root extract [11].

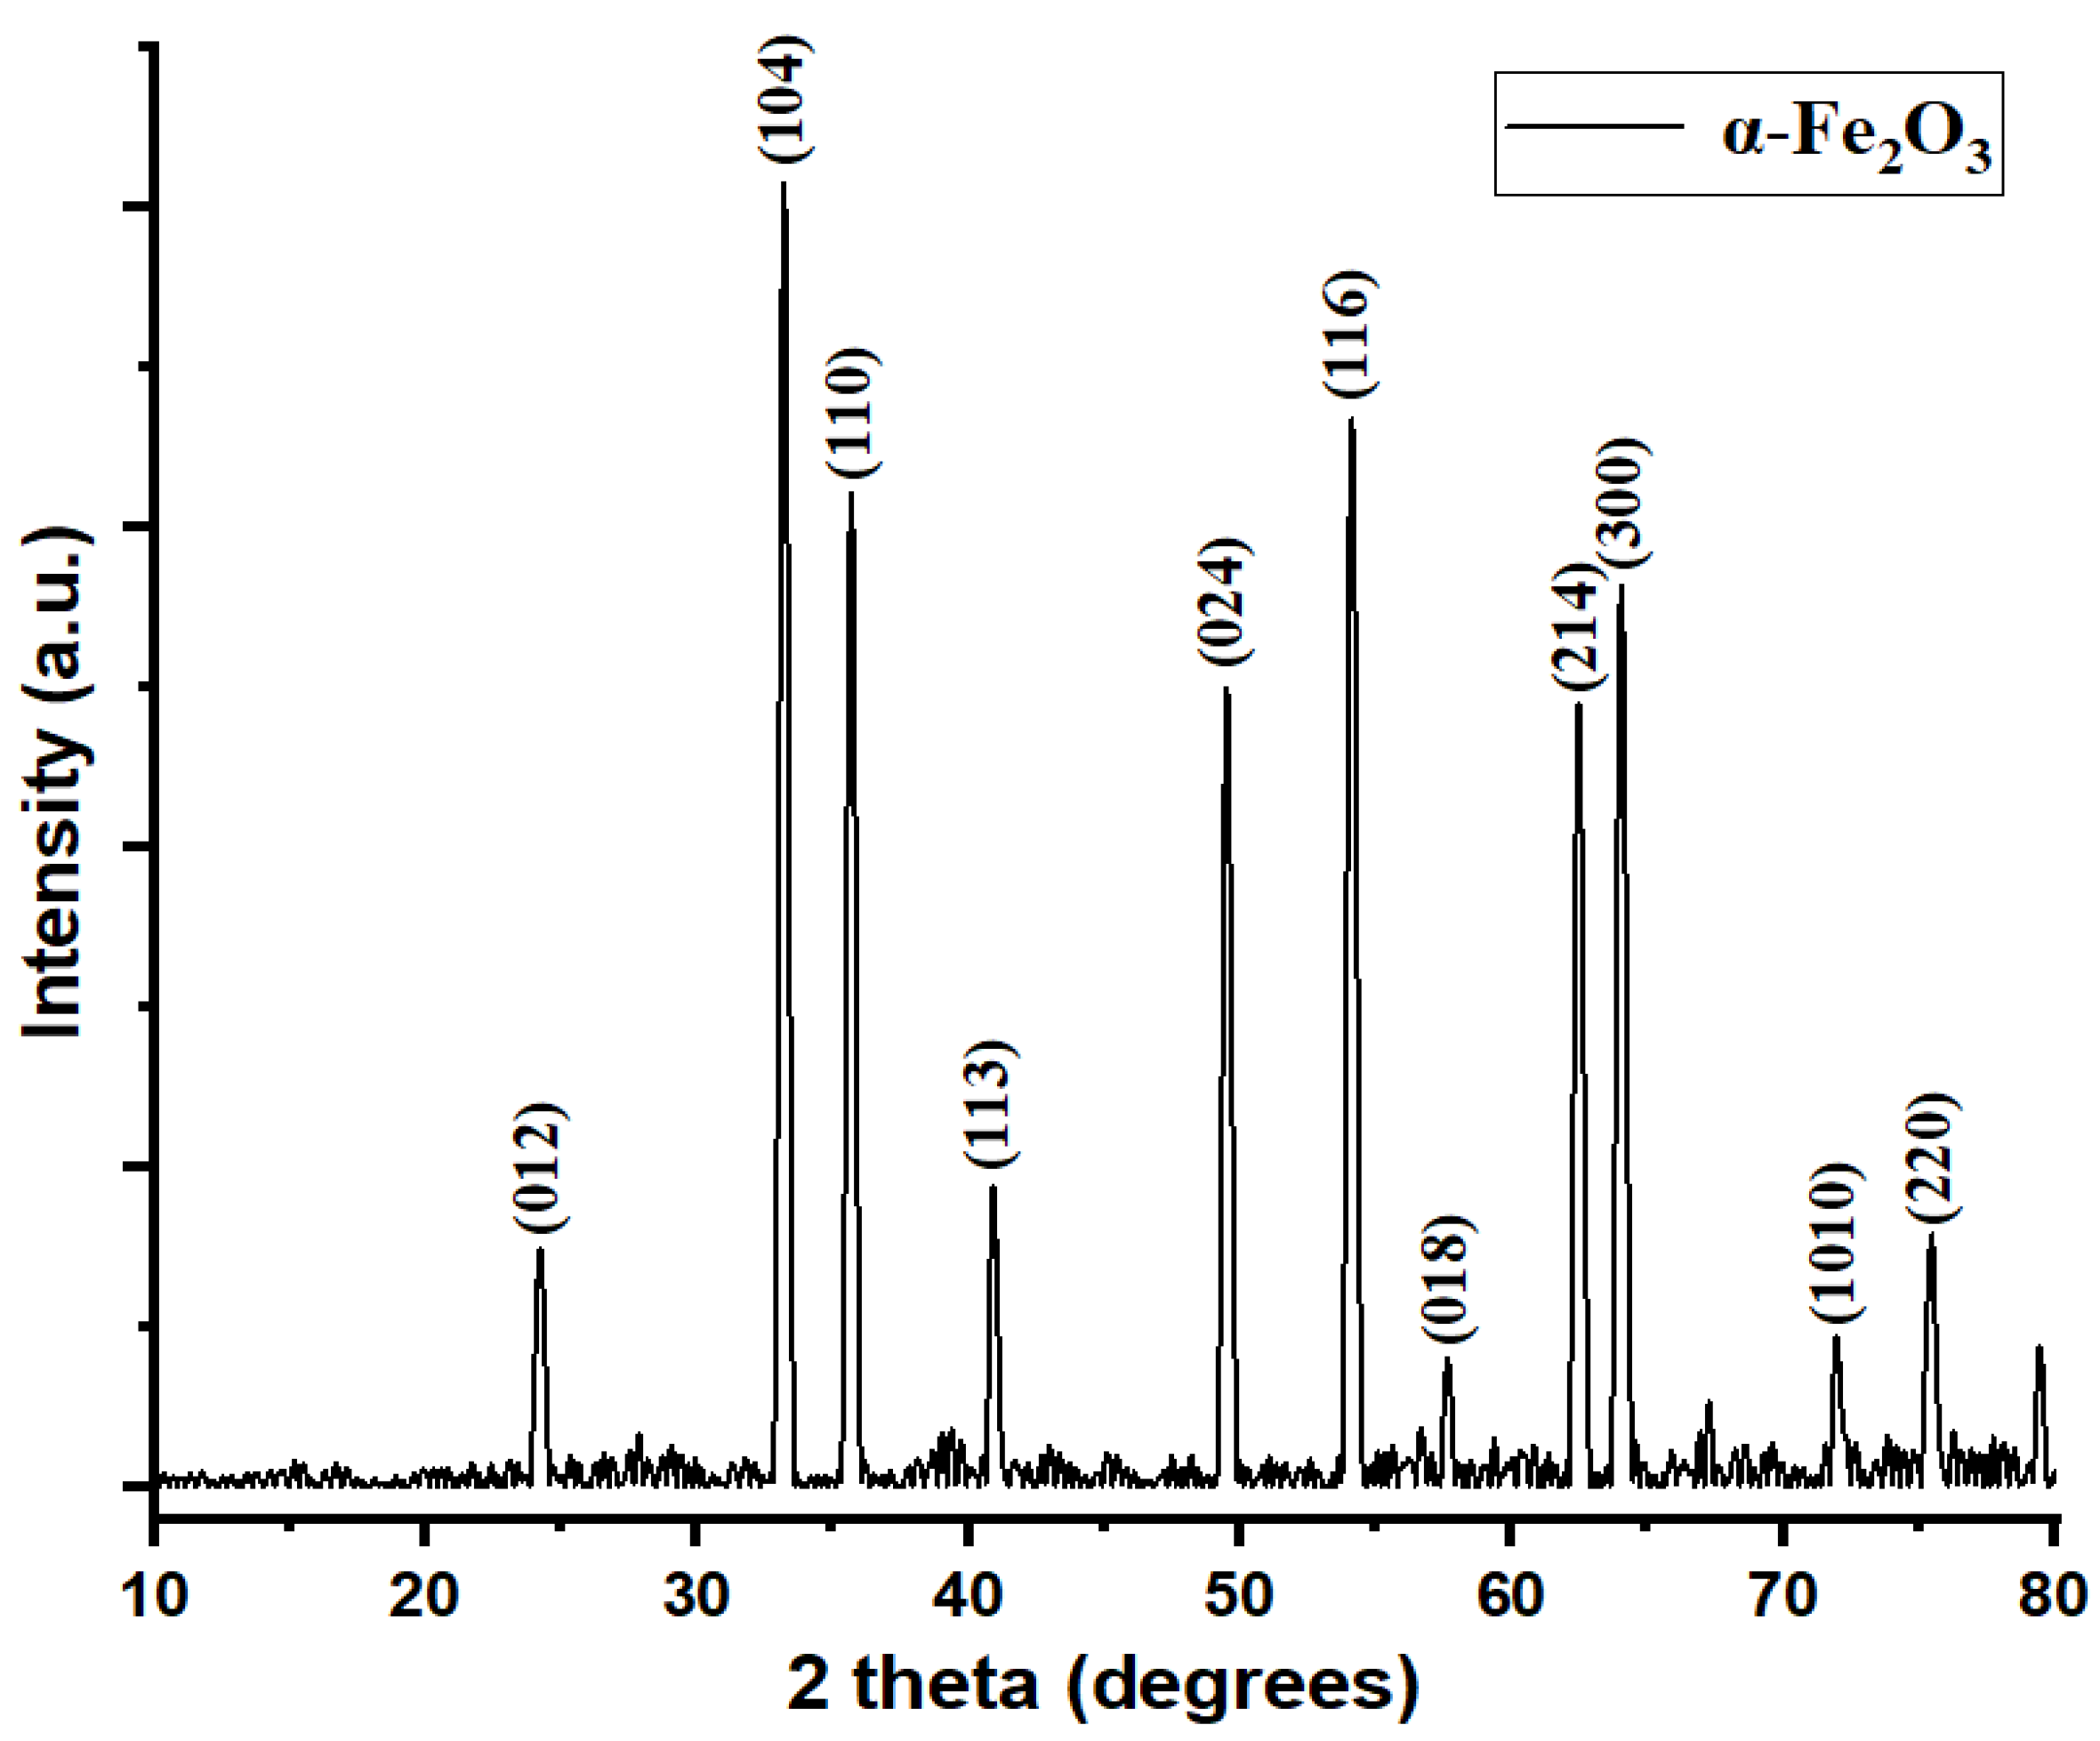
3.2. X-Ray Diffraction (XRD)

The X-ray diffraction (XRD) patterns also confirmed the successful synthesis of FeO–NPs from Fe2+ salts (Figure 4), as well as Fe2O3-NPs from Fe3+ salts (Figure 5). A series of diffraction peaks characterizing elemental iron were detected in both FeO–NPs and Fe2O3–NPs at 2θ values 23.7, 32.7, 35.1, 40.4, 49.05, 53.6, 62.0, 63.7, 71.65, and 75.1, corresponding to the 012, 104, 110, 113, 024, 116, 214, 300, 1010, and 220 crystallographic planes, respectively. The XRD pattern of FeO–NPs (Figure 4) exhibited prominent peaks at 32.7 (104), 35.1 (110), 49.05 (024), 53.6 (116), 62 (214), and 63.7 (300). The XRD spectrum of Fe2O3–NPs, (Figure 5) in addition to showing a minor peak at 57.1 (018), also showed prominent peaks at 32.7 (104), 35.1 (110), 49.05 (024), 53.6 (116), 62 (214), and 63.7 (300). The two spectra reflections portray significant agreement with standard diffraction data for hematite (α-Fe2O3), as displayed in JCPDS card no. 33-0664 (Table 1 and Table 2). The presence of intense and well-defined peaks, notably the (104) and (110) reflections, confirms the formation of a highly crystalline hematite phase. The close alignment of the 2θ positions between the observed pattern and the reference indicates the formation of a phase-pure hematite structure with no detectable secondary phases in both spectra (Table 1 and Table 2).
The observed minor and slight deviations in peak positions (within ±0.5°) between the sample and reference data can be ascribed to instrumental broadening, preferred orientation effects, or slight lattice strain effects emerging due to synthesis conditions. Generally, the XRD pattern is consistent with the formation of phase-pure hematite without detectable secondary phases. The alignment with the JCPDS data confirms the successful synthesis of crystalline α-Fe2O3 with a rhombohedral structure. The presence of high-intensity peaks at 35.1° (110) and 32.7° (104) is consistent with the most prominent reflections of hematite, thereby further supporting the FeO–NPs’ high crystallinity and characteristic rhombohedral structure. The absence of any additional unidentified peaks rules out the presence of impurity phases such as maghemite, goethite, or iron oxide hydroxides. Generally, the XRD results confirm the successful synthesis of crystalline hematite nanoparticles with structural features matching well-established standards. However, differences were noticed in the relative intensities of the diffraction peaks (Table 1). The strongest peak in the reference pattern was also the strongest in the sample pattern (100% relative intensity), confirming the presence of the primary phase. Some deviations were observed in the relative intensities of several reflections. For instance, the sample exhibited a relative intensity of 81.52% for the reflection with 88% relative intensity in the reference, while for a reflection with a relative intensity of 18% in the reference, the sample depicted 27.17%. It was also observed that some peaks were significantly stronger in the sample compared to the reference (e.g., 61.96% vs. 30%; 77.17% vs. 55%; 56.52% vs. 35%; and 55.43% vs. 25%). In Fe2O3-NPs, the strongest peak in the reference pattern was also the strongest in the sample pattern (100% relative intensity), confirming the presence of the primary phase (Table 2). Deviations were also observed in the relative intensities of several reflections. For example, the sample showed a relative intensity of 81.52% for a reflection with a relative intensity of 88% in the reference, but only 27.17% for a reflection with a relative intensity of 18% in the reference. Furthermore, the sample has much stronger peaks than the reference (e.g., 61.96% vs. 30%; 77.17% vs. 55%; 56.52% vs. 35%; and 55.43% versus 25%).
The variations in relative intensities, in both FeO–NPs and Fe2O3–NPs, indicates the presence of a preferred orientation (texture) in the sample. This preferred orientation emerges from a non-random distribution of crystallite orientations, where certain crystallographic planes are preferentially aligned. In this case, the observed intensity differences indicate that the sample deviates from the random crystallite orientation expected in an ideal powder.
The average crystalline size of the FeO–NPs, as calculated using the Debye–Scherer equation, ranges from 16.3 to 25.2 nm, while that of Fe2O3–NPs ranges from 23.1 to 33.1 nm, emphasizing the slightly larger size distribution for the Fe2O3-NPs compared to FeO–NPs. This finding also corroborated previous research showing a correlation between smaller nanoparticle sizes and lower absorption maximum values [28]. The absence of the characteristic peak (2θ = 44.9) for zero-valent iron nanoparticles confirms the capping and stabilizing effect of E. densa leaf extract on the surface of α-Fe2O3 nanoparticles. The intense and sharp peaks indicated that the α-hematite nanoparticles formed through the reduction method with E. densa leaf extract were crystalline in nature. The peaks obtained are almost similar to the XRD spectrum of the green-synthesized mesoporous hematite [29].

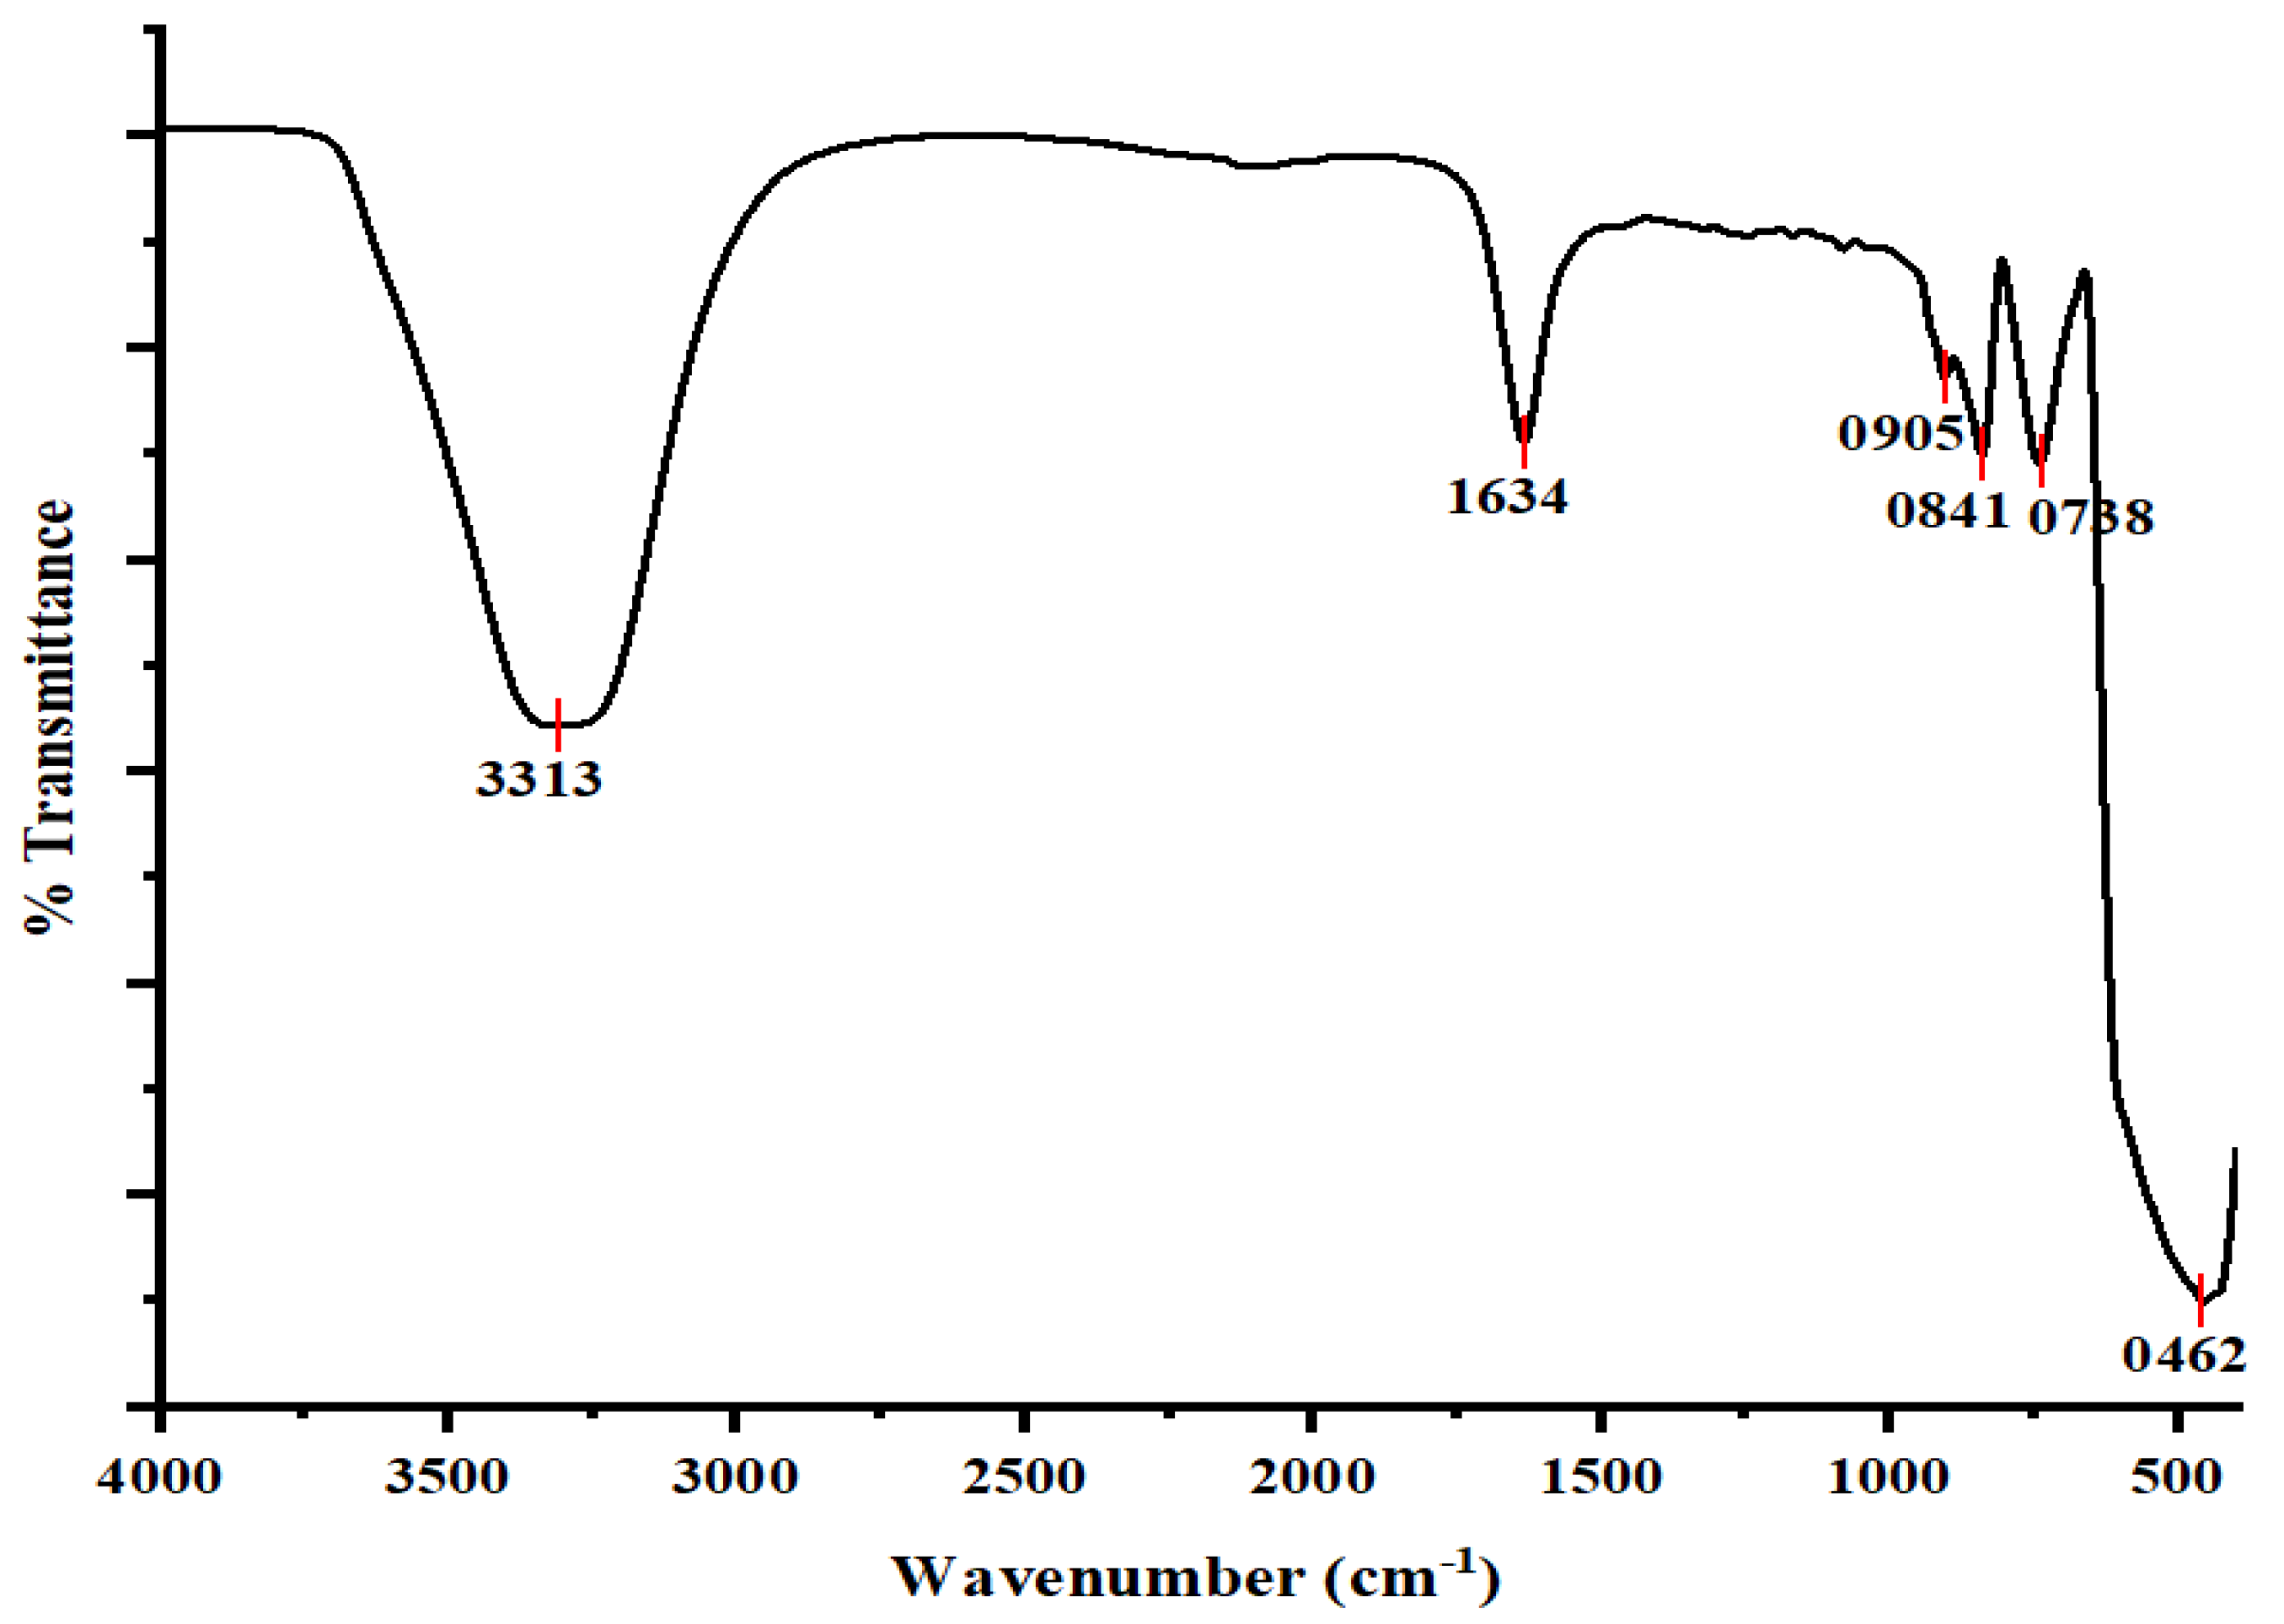
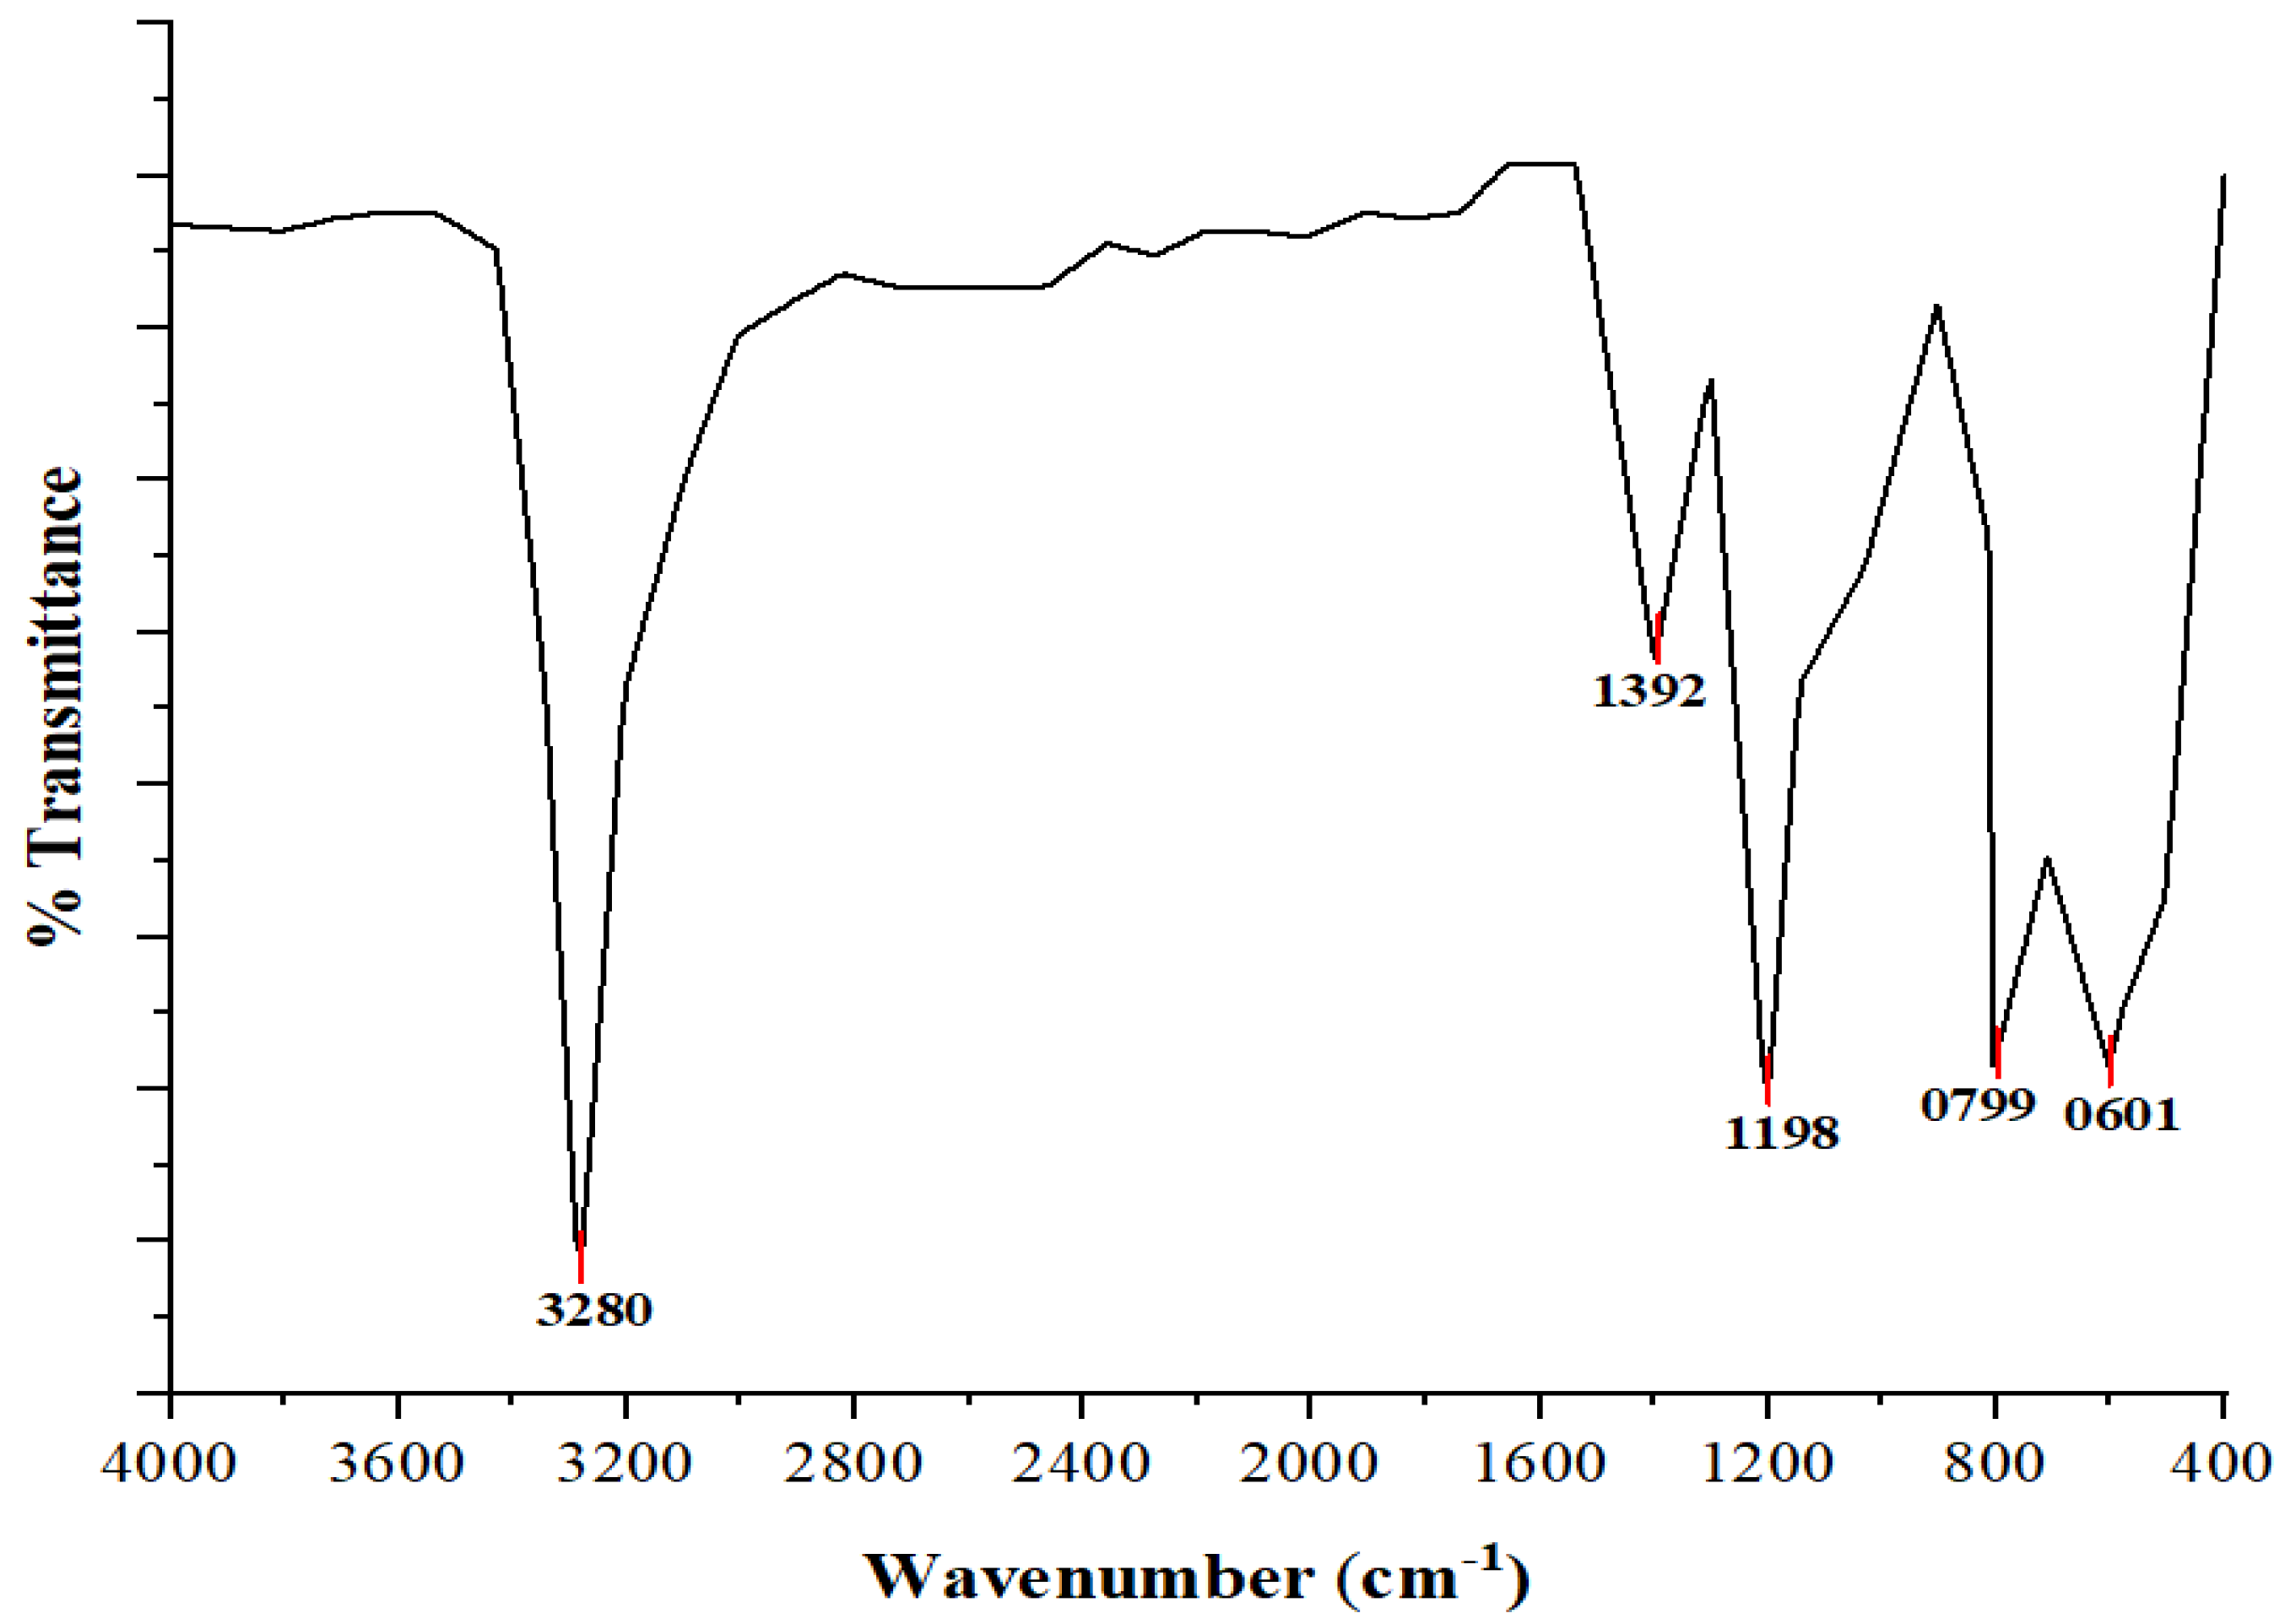
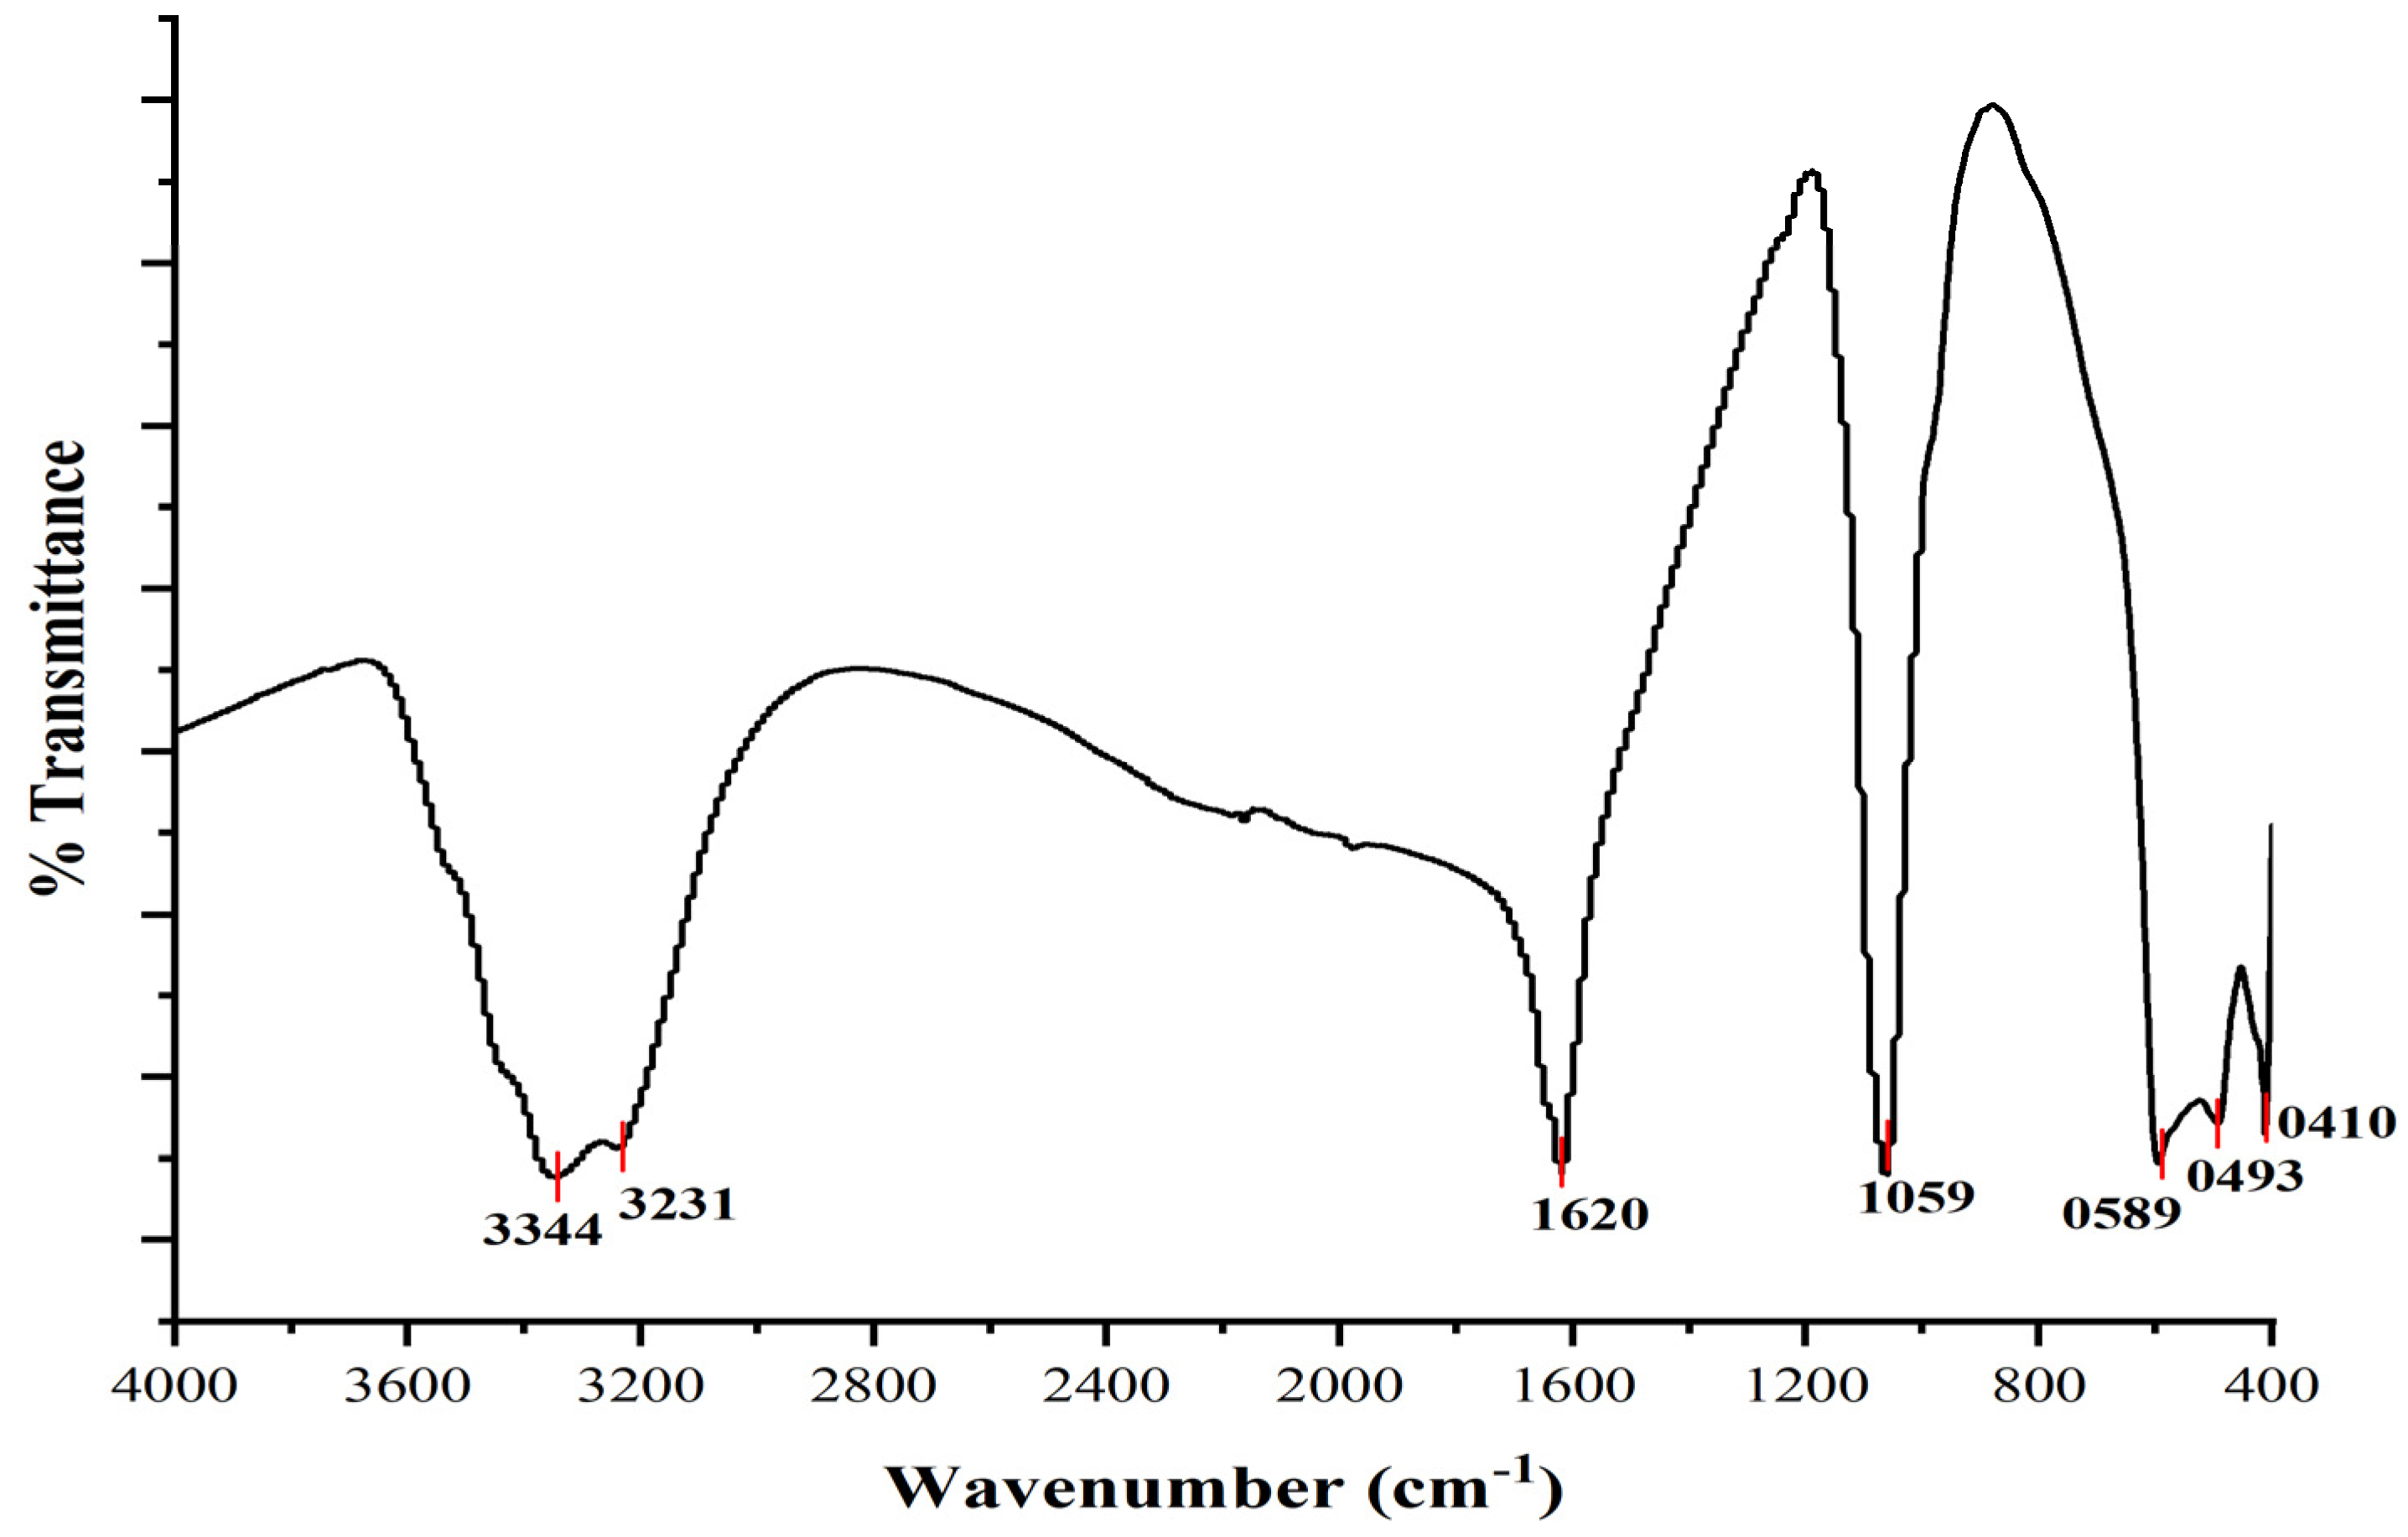
3.3. Fourier Transform Infrared Spectroscopy (FTIR)

The FTIR spectrum of the extracted E. densa leaf extract (ELE) showed the presence of a number of absorption peaks, depicting its complex nature (Figure 6). The relatively broad band at 3313 cm−1 could be attributed to the stretching vibration of hydroxyl (–OH) and amino (–NH) groups. The band at 1634 cm−1 can be attributed to the N–H bending and C–N stretching of groups present in secondary or cyclic amides. The bands at 905 and 841 cm−1 can be attributed to the out-of-plane C–H bending vibrations of alkenes or aromatic rings. The band at 738 cm−1 may be attributed to the out-of-plane C–H bending vibrations of alkenes or aromatic compounds. The functional groups responsible for the band at 462 cm−1 are generally unknown, but this band could be due to skeletal vibrations caused by ring deformation or the torsional vibration of phytochemicals present in the extract.
The FTIR spectrum of FeO–NPs (Figure 7) revealed the presence of several peaks, including the Fe–O peaks observed at 544 and 471 cm−1. These peaks are attributed to the Fe–O stretching vibrations of crystalline hematite [30]. Other notable peaks observed include 3297, 1867, 1593, 1465, 1409, 1345, 1228, 1174, 1140, 1051, 909, 853, 787, 642, 544, and 471 cm−1. The peak at 3297 corresponds to the O–H stretching of alcohol and carboxylic acid in the aqueous phase. The peak at 1051 can be assigned to the C–O, C–O–H, and symmetric and asymmetric C–O–C groups. The peak at 1867 represents the C=O stretching band of aromatic compounds such as carboxylic anhydrides. The peak at 1593 represents the N–H bending of amine or the C=C stretching of cyclic alkene. The peak at 1465 represents the C–H bending of alkane. The peak at 1409 represents the O–H bending of alcohol or carboxylic acid. The peak at 1345 represents the O–H bending of alcohol or phenol. The peak at 1228 represents the C–O stretching of alkyl aryl ether. The peaks at 1174 and 1140 represent the C–N stretching of amine. The peaks at 1140 and 1051 represent the C–O stretching of primary alcohol [31]. The presence of major FT–IR spectral signatures at 3297 cm−1, 1593 cm−1, and 642 cm−1 specify the existence of biomolecules, which act as capping and stabilizing agents in the nanoparticles.
The FTIR spectrum of Fe2O3–NPs (Figure 8) revealed the presence of seven peaks, including the Fe–O peaks observed at 589 and 493 cm−1. These peaks are attributed to the Fe–O stretching vibrations of crystalline hematite [30]. The peaks at 3344 and 3231 correspond to the O–H stretching of alcohol and carboxylic acid in the aqueous phase. The peak at 1620 corresponds to the C=C stretching of α, β-unsaturated ketone. The peak at 1059 corresponds to the C–O stretching of primary alcohol. The presence of major FT–IR spectral signatures at 3344 cm−1, 3231 cm−1, and 1620 cm−1 specify the existence of biomolecules, which act as capping and stabilizing agents in the nanoparticles.
The presence of bioactive phytochemicals possessing functional groups may be responsible for the reduction, capping, and conversion of the metal ions to iron oxide nanoparticles [32].

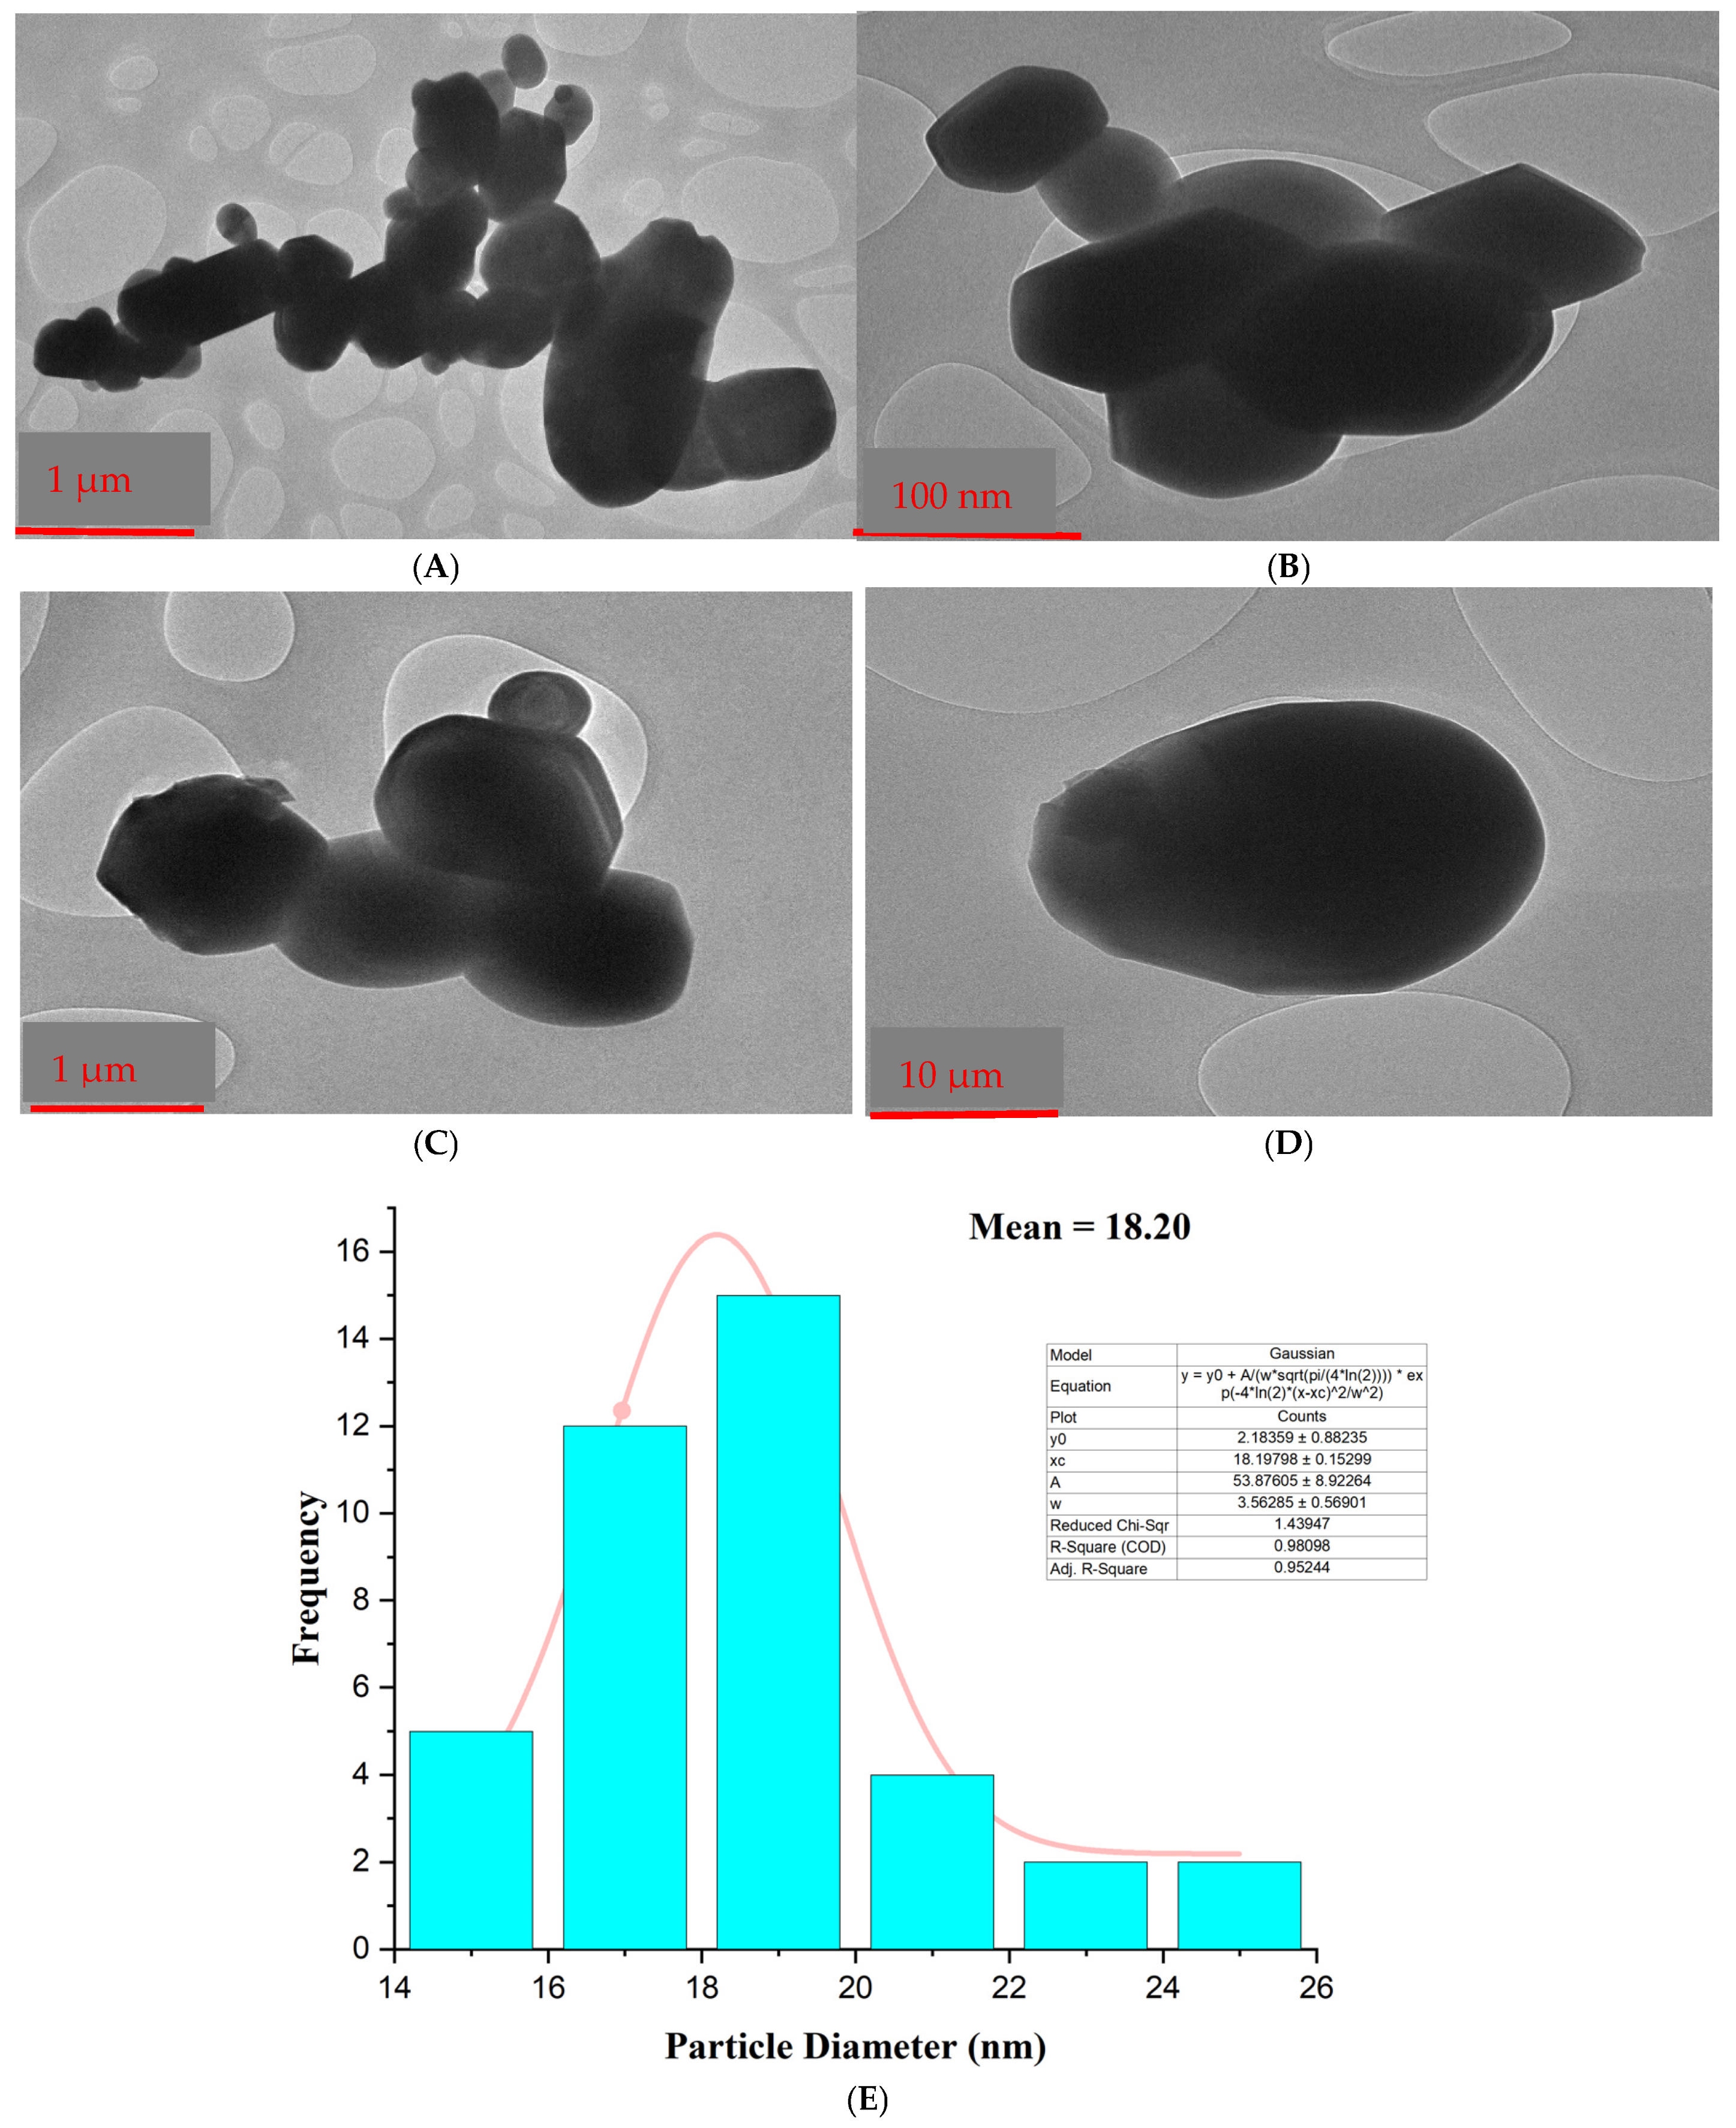
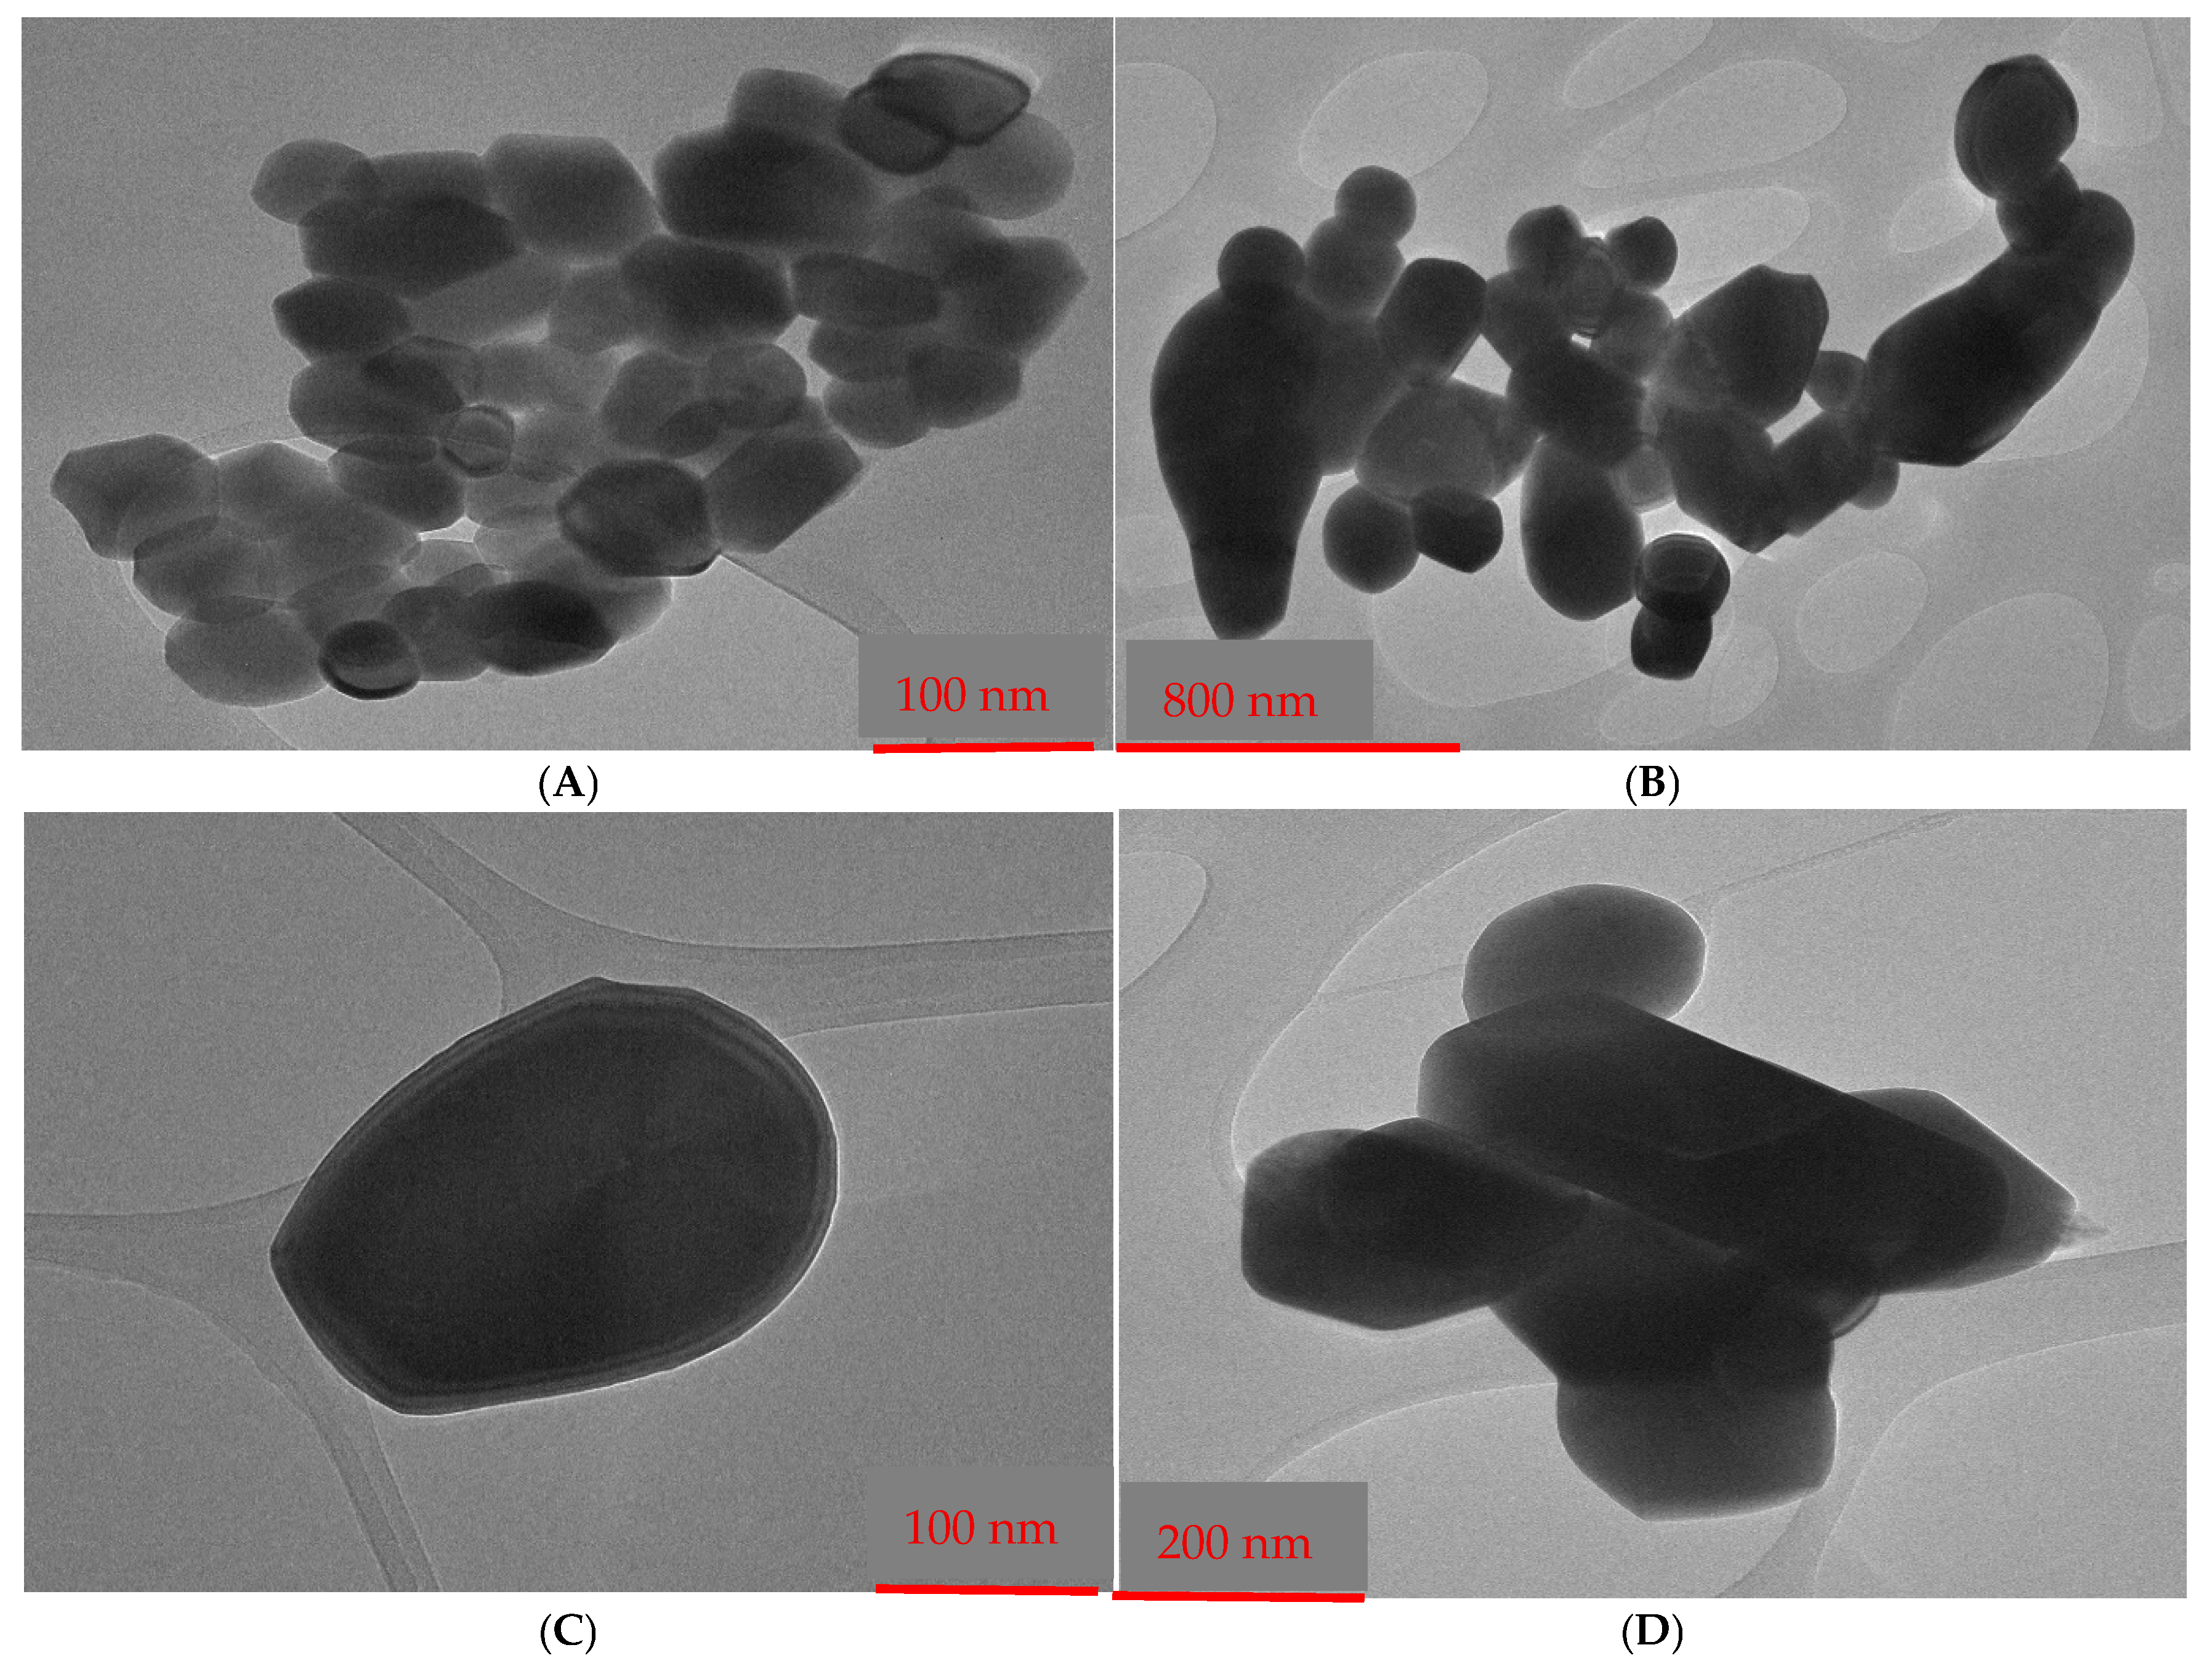
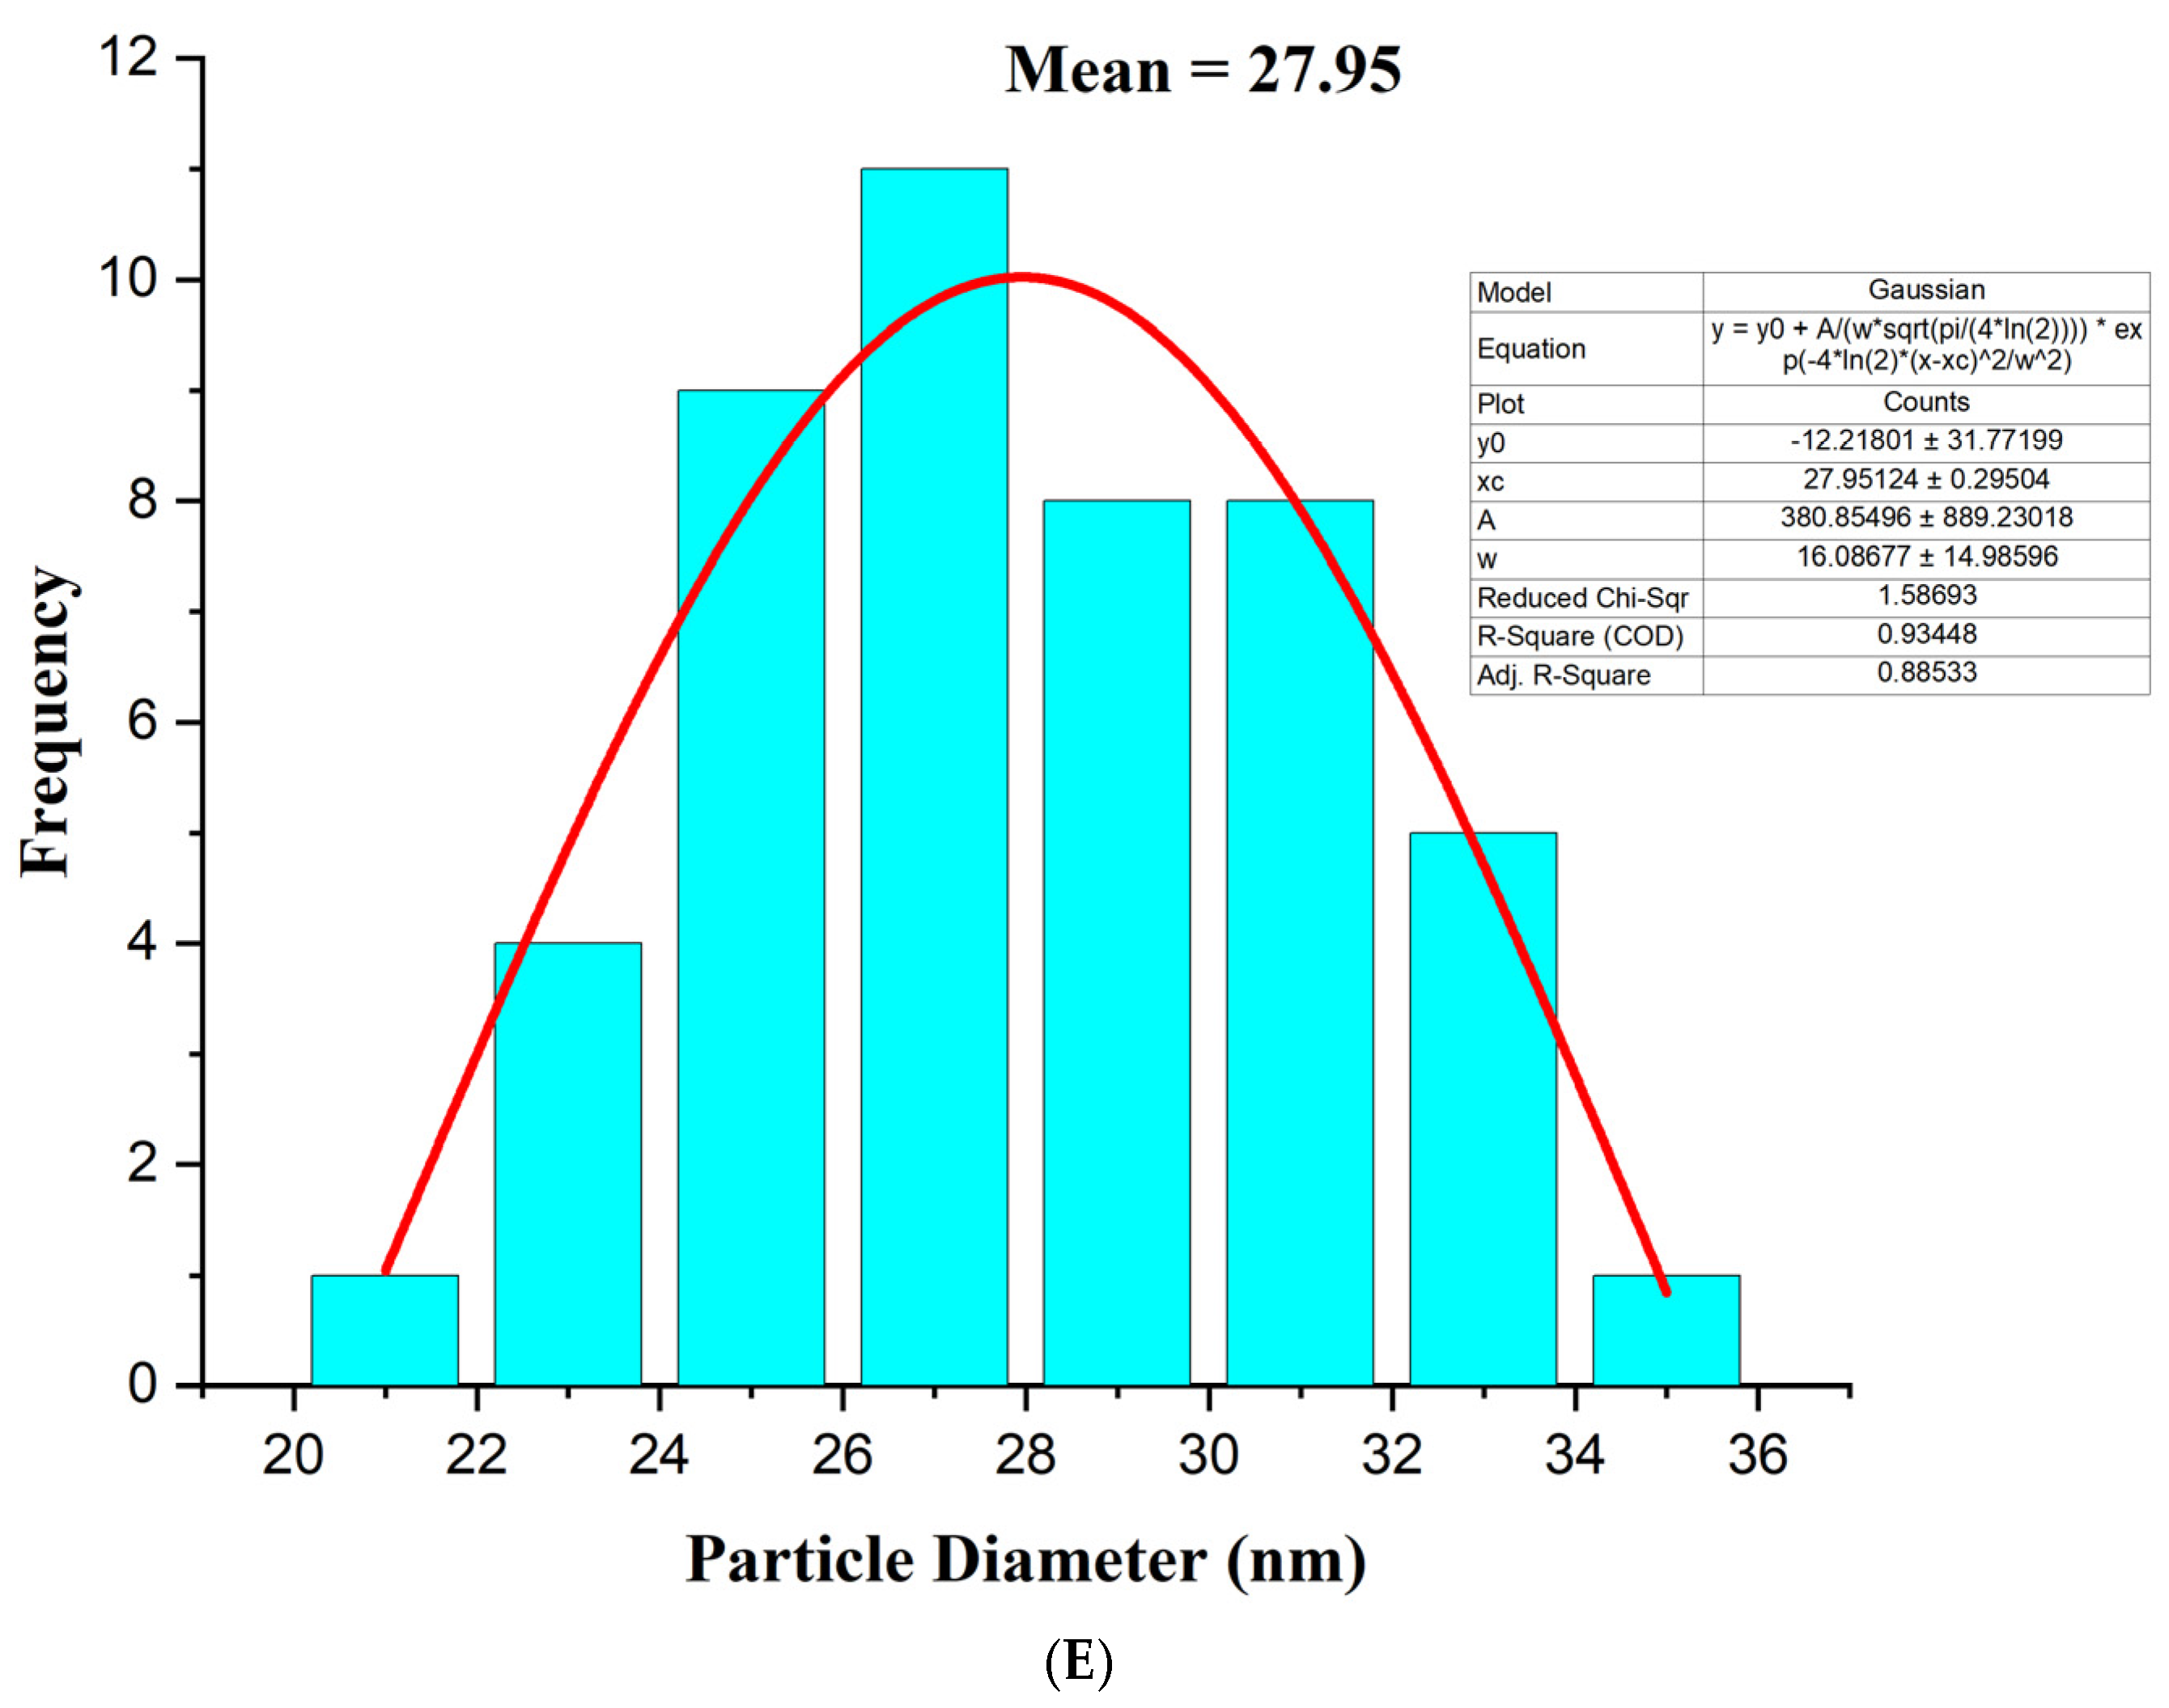
3.4. Transmission Electron Microscopy (TEM)
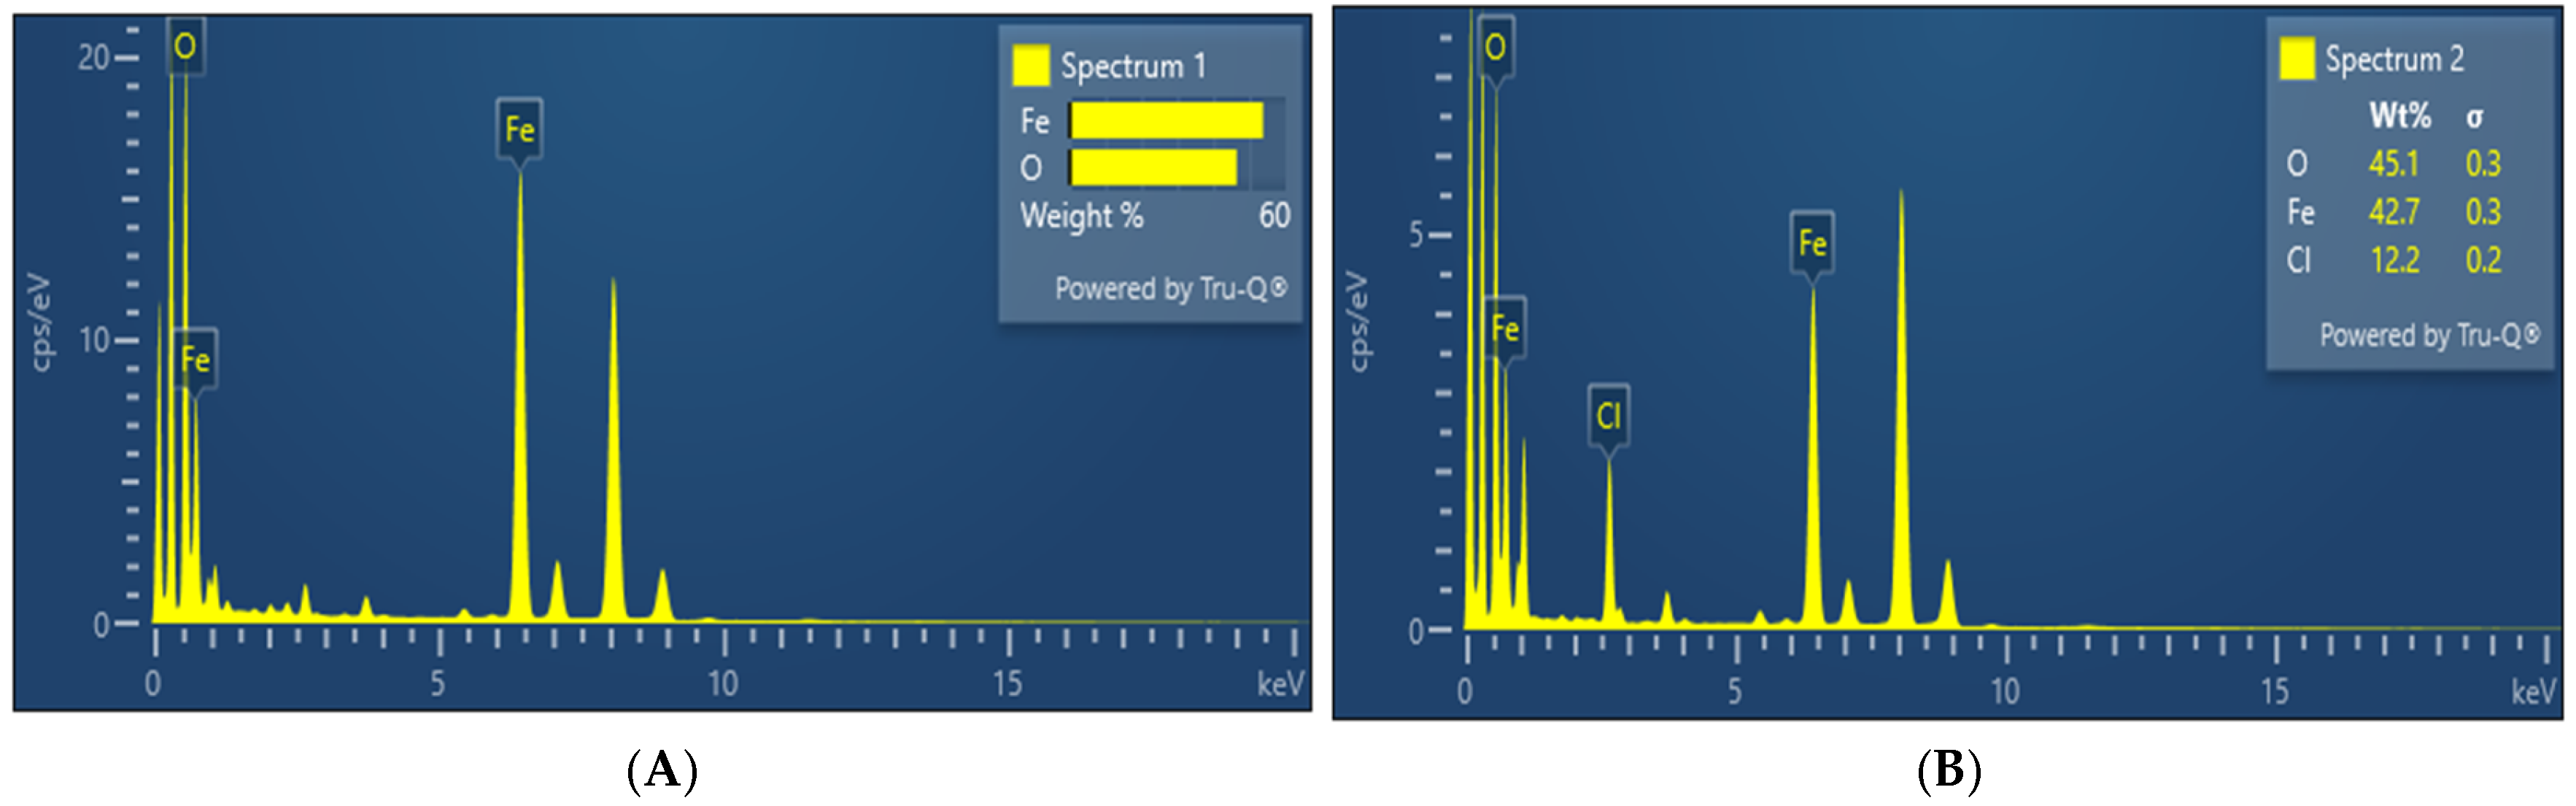
The TEM images of the nanoparticles produced and their particle size distribution histograms are shown in Figure 9 and Figure 10. The TEM images of FeO–NPs revealed that the nanoparticles were not uniform in nature, were oval to hexagonal in shape, and often aggregated together in clusters (Figure 9 A–D).
A Gaussian function was used to fit the particle size distribution of the synthesized FeO–NPs (Figure 9E), revealing a mean size of 18.2 ± 0.2 nm and a narrow FWHM of approximately 5.9 nm, indicating a predominantly monodisperse sample achieved through green synthesis. The high R-squared (0.981) and adjusted R-squared (0.952) values confirmed the Gaussian model’s excellent fit to the data, implying a uniform nanoparticle population influenced by the E. densa aqueous extract; this uniformity is beneficial for potential applications.
The TEM images of Fe2O3–NPs revealed that the nanoparticles were also not uniform in nature and were oval to hexagonal in shape, while some were irregularly shaped. They were also aggregated together in clusters (Figure 10 A–D). A Gaussian function was used to fit the particle size distribution of the synthesized Fe2O3–NPs (Figure 10E), revealing a mean size of 27.9 ± 0.3 nm and a FWHM of approximately 26.7 ± 24.8 nm, depicting a relatively broad particle size distribution. This broad distribution implies a considerable degree of polydispersity, meaning the nanoparticles are not uniform in size, which could have implications for their properties and potential applications. The R-squared value (0.934) suggests a good fit, but the adjusted R-squared (0.685) shows a larger discrepancy, which could be due to uncertainty in the baseline (y = −12.22 ± 31.78) and area (A = 380.85 ± 889.23). Additionally, a reduced chi-squared of 1.59 suggests some deviation between the model and the data, which could impact the material’s properties and potential applications compared to a more uniform sample.
The result is similar for spherical nanoparticles with average size of 38 nm obtained from Platanus orientalis leaf extract [6]. It is fairly similar to the spherical iron oxide nanoparticles (3.4–8.4 nm) obtained from Moringa oleifera aqueous extract [32], but differs from the rod- or tube-like nanoparticles (30–80 nm) obtained from Delonix regia aqueous extract [33].

3.5. EDX

The EDX analysis of the nanoparticles (Figure 11) showed the presence of intense peaks between 6.5 and 7 keV, indicating the presence of elemental iron in the nanoparticles. The presence of an oxygen peak also suggests the formation of iron oxide nanoparticles. The results showed that in FeO–NPs (Figure 11A), the weight percentage of elements under the irradiated area is 60% and 40% for iron and oxygen, respectively, while in Fe2O3-NPs (Figure 11B), the weight percentage is 42.70%, 45.1%, and 12.2% for iron, oxygen, and chlorine atoms, respectively. The chlorine observed in Fe2O3–NPs comes from the precursor used, and this has also been observed by other researchers [34]. The 2:3 ratio of Fe and O observed in FeO–NPs is similar to that observed from iron oxide nanoparticles prepared using Platanus orientalis leaf extract [6].

4. Conclusions

The FeO and Fe2O3 nanoparticles produced from E. densa leaf extract are morphologically similar, exhibiting oval to hexagonal shapes, but differ in size, with the Fe2O3 nanoparticles being bigger in size. The nanoparticles produced had smooth surfaces and were agglomerated together. The phytochemicals present in the extract successfully acted as both capping and reducing agents in order to naturally stabilize the nanoparticles produced. This eliminates the need for any additional capping chemicals or hazardous stabilizers. This result demonstrated that using Elodea in nanoparticle synthesis is superior to using other plant extracts, combined with the fact that Elodea is widely available, fast-growing, and easily harvested without the intensive land, water, or chemical inputs typically required for terrestrial plants, which improves the sustainability and scalability of the synthesis process. These combined properties highlight Elodea as a promising green resource for the synthesis of iron oxide nanoparticles, offering both environmental and functional advantages over conventional plant-based approaches. The simplicity, cost efficiency, and environment-friendly nature of the synthesized nanoparticles showed that green synthesis is a viable route for the production of nanoparticles for biomedical and bioremediation applications.
The findings of this study contribute to existing knowledge by demonstrating the unique versatility of Elodea extract in synthesizing iron-based nanoparticles from both Fe2+ and Fe3+ precursors. This comparative approach not only confirms the plant’s potential as an effective green synthesis agent but also provides valuable insights into the role of precursor chemistry in shaping nanoparticle characteristics, a subject that remains underexplored in the current literature.
While present study provides important insights into the green synthesis and characterization of iron-based nanoparticles using Egeria densa extract, one limitation of this study is the absence of zeta potential and hydrodynamic size characterization, which are essential for understanding nanoparticle stability in a suspension. These analyses, as well as others, such as atomic force microscopy (AFM), X-ray photoelectron spectroscopy (XPS), and scanning electron microscopy (SEM), will be carried out in future research to complement the structural and morphological data presented here. They would also provide deeper understanding of the surface chemistry, morphology, and crystallinity of the nanoparticles, especially at the atomic scale.
We also aimed to carry out mechanistic studies in order to elucidate the exact molecular pathways involved in the green synthesis process, particularly the role of specific phytochemicals in nanoparticle nucleation and stabilization.
Furthermore, we also aimed to expand the scope of this research to include performance evaluations in real-world conditions (such as in wastewater treatment and photocatalysis in sunlight).
Beyond these future investigations, the implications of this study extend to a broader scientific and societal context. It highlights the potential for sustainable nanotechnology practices that reduce reliance on toxic chemicals and energy-intensive processes. The ability to produce functional nanomaterials using renewable biological resources aligns with global efforts to support green chemistry principles and circular economy frameworks.

Author Contributions

Conceptualization, M.O.Y. and S.P.; methodology, M.O.Y.; validation, M.O.Y., S.P. and M.I.; formal analysis, M.O.Y. and M.I.; investigation, M.O.Y. and M.I.; data curation, M.O.Y.; software, M.O.Y. and M.I.; resources, J.W.; writing—original draft, M.O.Y.; writing—review and editing, M.I. and S.P.; supervision, S.P.; project administration, M.O.Y.; funding acquisition, J.W.; All authors have read and agreed to the published version of the manuscript.

Funding

This research received no external funding.

Institutional Review Board Statement

Not Applicable.

Informed Consent Statement

Not Applicable.

Data Availability Statement

The data is unavailable due to privacy or ethical restrictions.

Acknowledgments

The authors acknowledge the use of core facilities supported by the National Institute on Minority Health and Health Disparities through grant number 5U54MD013376 and the National Institute of General Medical Sciences through grant number 5UL1GM118973. The authors also acknowledge Yucheng Lan and Ashtiani for their technical assistance.

Conflicts of Interest

The authors declare no conflicts of interest.

References

  1. Hasan, S.A. Review on Nanoparticles: Their Synthesis and Types. Res. J. Recent. Sci. 2015, 4, 9–11. [Google Scholar]
  2. Khan, Y.; Sadia, H.; Ali Shah, S.Z.; Khan, M.N.; Shah, A.A.; Ullah, N.; Ullah, M.F.; Bibi, H.; Bafakeeh, O.T.; Khedher, N.B.; et al. Classification, Synthetic, and Characterization Approaches to Nanoparticles, and Their Applications in Various Fields of Nanotechnology: A Review. Catalysts 2022, 12, 1386. [Google Scholar] [CrossRef]
  3. Ealia, S.A.M.; Saravanakumar, M.P. A review on the classification, characterisation, synthesis of nanoparticles and their application. IOP Conf. Ser. Mater. Sci. Eng. 2017, 263, 1–15. [Google Scholar]
  4. Huang, L.; Weng, X.; Chen, Z.; Megharaj, M.; Naidu, R. Synthesis of iron-based nanoparticles using oolong tea extract for the degradation of malachite green. Spectrochim. Acta-Part A Mol. Bio. Spe. 2014, 117, 801–804. [Google Scholar] [CrossRef]
  5. Ajinkya, N.; Yu, X.; Kaithal, P.; Luo, H.; Somani, P.; Ramakrishna, S. Magnetic Iron Oxide Nanoparticle (IONP) Synthesis to Applications: Present and Future. Materials 2020, 13, 4644. [Google Scholar] [CrossRef]
  6. Devi, H.S.; Boda, M.A.; Shah, M.A.; Parveen, S.; Wani, A.H. Green synthesis of iron oxide nanoparticles using Platanus orientalis leaf extract for antifungal activity. Green Process. Synth. 2019, 8, 38–45. [Google Scholar] [CrossRef]
  7. Tuček, J.; Tuček, P.; Čuda, J.; Filip, J.; Pechoušek, J.; Machala, L.; Zbořil, R. Iron (III) oxide polymorphs and their manifestations in In-field 57Fe Mössbauer spectra. AIP Conf. Proc. 2012, 1489, 56–74. [Google Scholar] [CrossRef]
  8. Griffin, S.; Masood, M.I.; Nasim, M.J.; Sarfraz, M.; Ebokaiwe, A.P.; Schäfer, K.; Keck, C.M.; Jacob, C. Natural Nanoparticles: A Particular Matter Inspired by Nature. Antioxidants 2018, 7, 3. [Google Scholar] [CrossRef]
  9. Roy, A.; Sharma, A.; Yadav, S.; Jule, L.T.; Krishnaraj, R. Nanomaterials for Remediation of Environmental Pollutants. In Bioinorganic Chemistry and Applications; Hindawi Limited: London, UK, 2021. [Google Scholar] [CrossRef]
  10. Nagime, P.V.; Chandak, V.S. A comprehensive review of nanomaterials synthesis: Physical, chemical, and biological approaches and emerging challenges. Bio. Agr. Bio. 2024, 62, 103458. [Google Scholar] [CrossRef]
  11. Niraimathee, V.A.; Subha, V.; Ernest Ravindran, R.S.; Renganathan, S. Green synthesis of iron oxide nanoparticles from Mimosa pudica root extract. Int. J. Env. Sus. Dev. 2016, 15, 227–240. [Google Scholar] [CrossRef]
  12. Zhang, Y.; Chang, H.; Han, A.; Yang, S.; Xu, S.; Wang, X.; Guo, Z.; Chen, N.; Li, A.; Chen, X.; et al. High-performance anodes of Si@B-C/rGO nanoparticles for liquid and all-solid-state lithium-ion batteries. J. Alloys Compd. 2024, 983, 173919. [Google Scholar] [CrossRef]
  13. Sathya, V.; Jagatheesan, R.; Jeevanantham, V.; Gopi, D.; Muralidharan, V.P.; Rathinam, R. Selective oxidation of benzyl alcohol to benzaldehyde using sustainable catalysts: An overview. J. Indian Chem. Soc. 2024, 101, 101456. [Google Scholar] [CrossRef]
  14. Liu, J.F.; Jang, B.; Issadore, D.; Tsourkas, A. Use of magnetic fields and nanoparticles to trigger drug release and improve tumor targeting. Int. Rev. Nanomed. Nanobiotechnology 2019, 11, e1571. [Google Scholar] [CrossRef]
  15. Kirdat, P.N.; Dandge, P.B.; Hagwane, R.M.; Nikam, A.S.; Mahadik, S.P.; Jirange, S.T. Synthesis and characterization of ginger (Z. officinale) extract mediated iron oxide nanoparticles and its antibacterial activity. Mater. Proc. 2021, 43, 2826–2831. [Google Scholar] [CrossRef]
  16. Muthukumar, H.; Mohammed, S.N.; Chandrasekaran, N.I.; Sekar, A.D.; Pugazhendhi, A.; Matheswaran, M. Effect of iron doped Zinc oxide nanoparticles coating in the anode on current generation in microbial electrochemical cells. Int. J. Hydrog. Energy 2019, 44, 2407–2416. [Google Scholar] [CrossRef]
  17. Saif, S.; Tahir, A.; Chen, Y. Green Synthesis of Iron Nanoparticles and Their Environmental Applications and Implications. Nanomaterials 2016, 6, 9. [Google Scholar] [CrossRef]
  18. Soltys, L.; Olkhovyy, O.; Tatarchuk, T.; Naushad, M. Green Synthesis of Metal and Metal Oxide Nanoparticles: Principles of Green Chemistry and Raw Materials. Magnetochemistry 2021, 7, 145. [Google Scholar] [CrossRef]
  19. Duman, F.; Ocsoy, I.; Kup, F.O. Chamomile flower extract-directed CuO nanoparticle formation for its antioxidant and DNA cleavage properties. Mater. Sci. Eng. C 2016, 60, 333–338. [Google Scholar] [CrossRef]
  20. Saranya, S.; Eswari, A.; Gayathri, E.; Eswari, S.; Vijayarani, K. Green Synthesis of Metallic Nanoparticles using Aqueous Plant Extract and their Antibacterial Activity. Int. J. Curr. Microbiol. Appl. Sci. 2017, 6, 1834–1845. [Google Scholar] [CrossRef]
  21. Sankaranarayanana, V.; Velusamyb, S.; Sankaranb, P.; Kandasamy, K. Phytoremediation potential of Elodea canadensis for reduction of chromium–optimization using response surface methodology. Desalination Water Treat. 2023, 293, 192–199. [Google Scholar] [CrossRef]
  22. Sobiecka, E.; Mroczkowska, M.; Olejnik, T.P. The Influence of Chlorpyrifos on the Nonenzymatic Antioxidants Content in Macrophytes Leaves. Antioxidants 2022, 11, 684. [Google Scholar] [CrossRef] [PubMed] [PubMed Central]
  23. Vishwanath, R.; Negi, B. Conventional and green methods of synthesis of silver nanoparticles and their antimicrobial properties. Curr. Res. Green Sustain. Chem. 2021, 4, 100205. [Google Scholar] [CrossRef]
  24. Moreno-Samaniego, M.; Villagomez-Herrera, J.; Dalgo-Flores, V.; Sanchez-Moreno, H. Green synthesis of copper oxide nanoparticles using Eucalyptus globulus extract with effective bactericidal activity for river water treatment. Results Eng. 2024, 24, 103441. [Google Scholar] [CrossRef]
  25. Anbu, P.; Gopinath, S.C.B.; Salimi, M.N.; Letchumanan, I.; Subramaniam, S. Green synthesized strontium oxide nanoparticles by Elodea canadensis extract and their antibacterial activity. J. Nanostructure Chem. 2021, 12, 365–373. [Google Scholar] [CrossRef]
  26. Kaminskiene, Z.; Prosyevasa, I.; Stonkute, J.; Guobiene, A. Evaluation of optical properties of ag, cu, and co nanoparticles synthesized in organic medium. Acta Phys. Pol. A 2013, 123, 111–114. [Google Scholar] [CrossRef]
  27. Dhananjayan, B.; Badmapriya, D.; Asharani, I.V. Dye Degradation Studies Catalysed by Green Synthesized Iron Oxide Nanoparticles. 2016. Available online: https://www.researchgate.net/publication/306208710 (accessed on 27 October 2024).
  28. Saion, E.; Gharibshahi, E.; Naghavi, K. Size-Controlled and Optical Properties of Monodispersed Silver Nanoparticles Synthesized by the Radiolytic Reduction Method. Int. J. Mol. Sci. 2013, 14, 7880–7896. [Google Scholar] [CrossRef]
  29. Ahmmad, B.; Leonard, K.; Shariful Islam, M.; Kurawaki, J.; Muruganandham, M.; Ohkubo, T.; Kuroda, Y. Green synthesis of mesoporous hematite (α-Fe2O3) nanoparticles and their photocatalytic activity. Adv. Powder Technol. 2013, 24, 160–167. [Google Scholar] [CrossRef]
  30. Paredes-García, V.; Toledo, N.; Denardin, J.; Venegas-Yazigi, D.; Cruz, C.; Spodine, E.; Luo, Z. One Pot Solvothermal Synthesis of Organic Acid Coated Magnetic Iron Oxide Nanoparticles. Int. J. Chil. Chem. Soc. 2013, 58, 2011–2015. [Google Scholar] [CrossRef]
  31. InstaNANO. FTIR Functional Group Database Table with Search. Available online: https://instanano.com/all/characterization/ftir/ftir-functional-group-search/ (accessed on 1 December 2024).
  32. Katata-Seru, L.; Moremedi, T.; Aremu, O.S.; Bahadur, I. Green synthesis of iron nanoparticles using Moringa oleifera extracts and their applications: Removal of nitrate from water and antibacterial activity against Escherichia coli. J. Mol. Liq. 2018, 256, 296–304. [Google Scholar] [CrossRef]
  33. Kulkarni, N.J.; Kulkarni, N.; Dauthal, P.; Mukhopadhyay, M. Green Synthesis of Iron Complex Nanoparticles Using Delonix regia Leaf. In Proceedings of the 68th Annual Conference of Indian Institute of Chemical Engineers, Assam, India, 27–30 December 2015; Available online: https://www.researchgate.net/publication/290426479 (accessed on 8 February 2025).
  34. Qasim, S.; Zafar, A.; Saif, M.S.; Ali, Z.; Nazar, M.; Waqas, M.; Haq, A.U.; Tariq, T.; Hassan, S.G.; Iqbal, F.; et al. Green synthesis of iron oxide nanorods using Withania coagulans extract improved photocatalytic degradation and antimicrobial activity. J. Photochem. Photobiol. B Biol. 2020, 204, 111784. [Google Scholar] [CrossRef]
Figure 1. E. densa aqueous extract (ELE) (A), nanoparticles prepared from E. densa and Fe2+ salt (B), nanoparticles prepared from E. densa and Fe3+ salt (C).
Applbiosci 04 00027 g001
Figure 2. UV–visible spectrum of FeO–NPs.
Applbiosci 04 00027 g002
Figure 3. UV–visible spectrum of Fe2O3–NPs.
Applbiosci 04 00027 g003
Figure 4. XRD pattern of FeO–NPs prepared from Fe2+ salts.
Applbiosci 04 00027 g004
Figure 5. XRD pattern of Fe2O3–NPs prepared from Fe3+ salts.
Applbiosci 04 00027 g005
Figure 6. FT–IR spectrum of FeO–NPs.
Applbiosci 04 00027 g006
Figure 7. FT–IR spectrum of Fe2O3–NPs.
Applbiosci 04 00027 g007
Figure 8. FT–IR spectrum of Fe2O3–NPs.
Applbiosci 04 00027 g008
Figure 9. (AD) TEM images of green-synthesized FeO nanoparticles. (E) Size distribution histogram of the FeO–NPs.
Applbiosci 04 00027 g009
Figure 10. (AD) TEM image of green-synthesized Fe2O3 nanoparticles. (E) Size distribution histogram of the Fe2O3-NPs.
Applbiosci 04 00027 g010aApplbiosci 04 00027 g010b
Figure 11. EDX spectrum of FeO–NPs (A) and Fe2O3–NPs (B).
Applbiosci 04 00027 g011
Table 1. Comparison of XRD peaks of FeO nanoparticles with standard JCPDS data for hematite (α-Fe2O3).
Sample (2θ)Reference
(2θ) (JCPDS)
Reference (hkl)Reference Relative Intensity (%)Sample Relative Intensity (%)Match Assessment
23.7°24.18°01228.823.91Close shift (≈ −0.48°)
32.7°33.15°104100100Close shift (≈ −0.45°)
35.1°35.61°1106081.52Slight shift (≈ −0.51°)
40.4°40.92°1131827.17Slight shift (≈ −0.52°)
49.05°49.53°0243061.96Close shift (≈ −0.48°)
53.6°54.13°1165577.17Slight shift (≈ −0.53°)
62.0°62.53°2143556.52Slight shift (≈ −0.53°)
63.7°64.0°3002555.43Close shift (≈ −0.3°)
71.65°72.06°101010.821.74Close shift (≈ −0.41°)
75.1°75.57°2207.016.30Close shift (≈ −0.47°)
Table 2. Comparison of XRD peaks of Fe2O3 nanoparticles with standard JCPDS data for hematite (α-Fe2O3).
Sample (2θ)Reference
(2θ) (JCPDS)
Reference (hkl)Reference Relative Intensity (%)Sample Relative Intensity (%)Match Assessment
23.7°24.18°01228.817.44Close (shift ≈ −0.48°)
32.7°33.15°104100100Close (shift ≈ −0.45°)
35.1°35.61°1106076.74Slight shift (≈−0.51°)
40.4°40.92°1131823.26Slight shift (≈ −0.52°)
49.05°49.53°0243061.63Close (shift ≈ −0.48°)
53.6°54.13°1165581.40Slight shift (≈ −0.53°)
57.1°57.5°018409.30Close (shift (≈ −0.4°)
62.0°62.53°2143560.47Slight shift (≈ −0.53°)
63.7°64.0°3002569.77Close (shift ≈ −0.3°)
71.65°72.06°101010.811.63Close (shift ≈ −0.41°)
75.1°75.57°2207.076.74Close (shift ≈ −0.47°)
Disclaimer/Publisher’s Note: The statements, opinions and data contained in all publications are solely those of the individual author(s) and contributor(s) and not of MDPI and/or the editor(s). MDPI and/or the editor(s) disclaim responsibility for any injury to people or property resulting from any ideas, methods, instructions or products referred to in the content.

