Article

Solvent Survey and Acidification Effects on the Recovery of Main Antioxidant Polyphenols from Dried Olive Pomace


by
Mahmoud Ghazi
1,
Mohamed Mehdi Yataghene
1,
Spyros Grigorakis
1 and
Dimitris P. Makris
1,2,*
1
Department of Food Quality & Chemistry of Natural Products, Mediterranean Agronomic Institute of Chania (M.A.I.Ch.), International Centre for Advanced Mediterranean Agronomic Studies (CIHEAM), Makedonias Street, 73100 Chania, Greece
2
Green Processes & Biorefinery Group, Department of Food Science & Nutrition, School of Agricultural Sciences, University of Thessaly, N. Temponera Street, 43100 Karditsa, Greece
*
Author to whom correspondence should be addressed.
Waste 2026, 4(2), 19; https://doi.org/10.3390/waste4020019
Submission received: 4 May 2026 / Revised: 1 June 2026 / Accepted: 3 June 2026 / Published: 5 June 2026

Abstract

Olive pomace is a major side stream originating from olive processing for the production of olive oil. This waste material bears a load of polyphenolic antioxidants, and thus it might serve as a source of precious phytochemicals. This work had as its objective the development of an extraction process for the efficacious recovery of polyphenols from dried olive pomace (dOP), employing eco-friendly extraction media. To this end, environmentally benign solvents were first compared for their efficiency in obtaining increased yields in total polyphenols, and 40% aqueous isopropanol was selected as the best-performing mixture. Further examination of the role of acidification showed that mineral acid addition (sulfuric, hydrochloric) had a rather negative effect on polyphenol yield. To the contrary, incorporation of oxalic acid into the solvent at a 10% level provided significantly higher extraction yield (p < 0.05), which reached 27.1 ± 1.1 mg caffeic acid equivalents (CAE) per g dOP. This solvent system (40% isopropanol/10% oxalic acid) was additionally scrutinized for its effectiveness by studying the role of process severity and response surface optimization. Out of both approaches, it was demonstrated that polyphenol extraction yield, but also antiradical activity, was directly correlated with residence time and temperature, within the limits tested. Moreover, a high correlation between polyphenol concentration and antiradical activity was also revealed. Liquid chromatography-tandem mass spectrometry analyses showed that the extract obtained with the solvent system used (40% isopropanol/10% oxalic acid) was characterized by the presence of both hydroxytyrosol and the flavone luteolin (242.1 and 178.6 μg g−1 dOP, respectively), but, in the absence of isopropanol, the extract produced was largely dominated by hydroxytyrosol (4629.7 μg g−1 dOP). Thus, it was concluded that the solvent system could fundamentally diversify extract composition. It is proposed that, when combined with integrated biorefinery technologies, this approach could effectively contribute to reducing environmental impacts while enabling the production of valuable natural antioxidants or platform chemicals that are vital for the food, pharmaceutical, and cosmetic industries. Within the broader context of sustainable food waste management, such strategies might be key elements of a circular economy framework.

1. Introduction

The transition to a sustainable future increasingly depends on the development of a strong bioeconomy, where renewable biological resources are used to produce food, energy, and materials. Within this framework, food waste valorization plays a crucial role by transforming organic waste streams into high-value products such as biofuels, bioplastics, animal feed, and nutraceuticals. Instead of viewing food waste as a disposal problem, innovative technologies enable its conversion into economic opportunities, reducing environmental impact while creating new revenue streams. By integrating circular economy principles, bioeconomy strategies that prioritize food waste valorization can enhance resource efficiency and contribute to more resilient and sustainable food systems [1,2].
Olive oil production is a vital agricultural activity in many Mediterranean countries, generating significant economic and cultural value. However, it also produces large quantities of waste, including olive mill wastewater, pomace, and olive leaves, which can pose environmental challenges if not properly managed. These by-products are rich in organic matter and bioactive compounds, creating opportunities for innovative reuse in areas such as pharmaceuticals, foods and cosmetics. By implementing sustainable management practices and circular economy approaches, the sector can reduce the environmental impact of olive oil production while transforming wastes into valuable resources [3,4].
The valorization of olive pomace entails the sustainable conversion of the primary byproduct derived from olive oil extraction into high-utility derivatives. Predominantly generated within Mediterranean regions—specifically Spain, Italy, and Greece—this substrate is composed of olive fruit residual tissues and residual lipids. Rather than being classified as a waste stream, olive pomace serves as a versatile feedstock for several industrial applications, including bioenergy production, lipid recovery, extraction of phytochemicals, and agricultural uses (e.g., composting, animal feed). Through these pathways, olive pomace management aligns with circular economy principles, mitigating the environmental degradation typically associated with conventional disposal methods [5,6].
Olive pomace polyphenols are bioactive compounds that remain in the solid by-product after olive oil extraction. Although many phenolics transfer into extra virgin olive oil, a significant fraction stays in the pomace, making it a rich and underutilized source of antioxidants. The main polyphenols include hydroxytyrosol, some oleuropein derivatives, and flavonoids. These compounds are known for their strong antioxidant, anti-inflammatory, antimicrobial, and cardioprotective properties. Hydroxytyrosol, in particular, is one of the most potent natural antioxidants and is highly valued in the nutraceutical, cosmetic, and functional food industries [7,8,9]. Extraction techniques such as solvent extraction, ultrasound-assisted extraction, and supercritical fluid extraction are commonly used to recover these polyphenols from olive pomace and have been explored to improve yield, selectivity, and sustainability [10,11].
On the other hand, conventional polyphenol extraction techniques—such as, e.g., maceration, Soxhlet extraction—present several disadvantages. First, conventional methods typically require large volumes of organic solvents (such as methanol, acetone), many of which are toxic, flammable, and environmentally hazardous. This increases environmental impact, disposal costs, and risks to operator safety. Second, conventional extraction is usually time-consuming and energy-intensive, often requiring long extraction times and high temperatures. Prolonged heating can degrade thermolabile polyphenols, reducing extract quality and bioactivity. Finally, conventional processes often have lower extraction efficiency and selectivity, leading to co-extraction of unwanted compounds and requiring additional downstream processing [12,13,14].
Green extraction technologies are typically more selective, scalable, and aligned with sustainable development goals, making them more suitable for modern polyphenol recovery from plant matrices such as olive pomace. In addition, they often use safer solvents (e.g., water, ethanol) or solvent-free systems, and thus they tend to produce cleaner extracts with fewer purification steps. Such methodologies generally shorten extraction time and operate under milder or more controlled conditions, preserving sensitive compounds. In this context, this study aimed to develop an extraction process designed to boost recovery of polyphenols from dOP, by comparing green solvents, including ethanol, 1-propanol and 2-propanol. These solvents were selected due to their low cost, environmental friendliness, and wide availability [15]. The treatment performance was further enhanced by appropriate acidification and evaluated in terms of both effectiveness and process severity by calculating combined severity factors and applying response surface methodology for optimization. The resulting extracts were analyzed through the tentative identification and quantification of the principal polyphenolic compounds. In addition, antioxidant activity was assessed as a complementary indicator of extract quality. To the authors’ knowledge, such an approach targeting at establishing a simple, straightforward, and low-cost benign methodology has not been accomplished in the past and may provide novel insights into OP valorization as a pool of precious compounds.

2. Materials and Methods

2.1. Chemicals—Reagents

Caffeic acid (≥98%) was from Extrasynthese (Genay, France). Sodium carbonate (>99.8%) was sourced from Honeywell/Fluka (Steinheim, Germany). Hydroxytyrosol (98%), luteolin 7-O-glucoside (>98%), oxalic acid (98%), and 2,2-diphenylpicrylhydrazyl (DPPH) were purchased from Sigma-Aldrich (Darmstadt, Germany). 2-Propanol (isopropanol), ethanol and 1-propanol were purchased from Honeywell/Riedel-de Haen (Seelze, Germany). The Folin–Ciocalteu reagent was from Merck (Darmstadt, Germany). For the chromatographic determinations, high-performance liquid chromatography (HPLC)-grade solvents were used.

2.2. Procurement of Dried Olive Pomace (dOP)

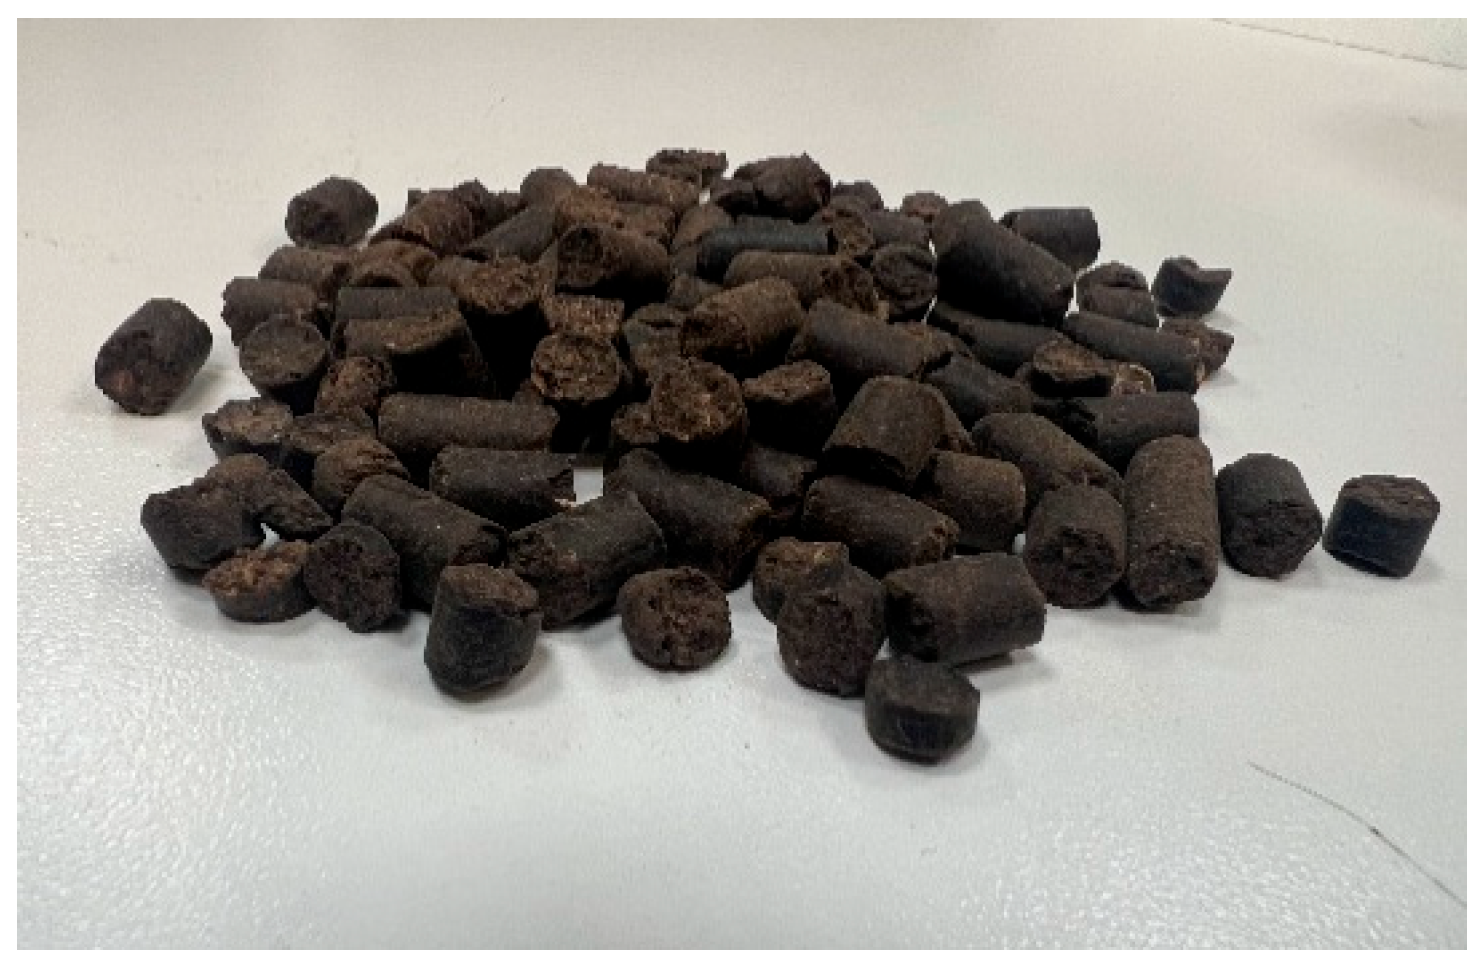
The raw material originated from the olive oil production process that implicated a 2-phase oil extraction technique, and it was kindly donated by Mills of Crete (Chania, Greece). dOP was received in the form of pellets (Figure 1), in airtight packaging in plastic bags, and after appropriate grinding in a table laboratory mill (Tristar, Tilburg, The Netherlands), sieving of dOP afforded a powder with a mean particle size < 300 μm. This powder was used for all extraction processes tested.

2.3. Extraction Methodology

An accurately weighed 2.5 g portion of dOP was placed in a 100 mL Duran™ glass vial and combined with 50 mL of solvent. The solvents tested were initially methanol, ethanol, 1-propanol and 2-propanol, and they were used as aqueous mixtures at variable proportions, ranging from 0 (neat water) to 80% (v/v). After screening, the highest-performing system was combined with various concentrations of sulfuric acid (SuAc) and hydrochloric acid (HCl) varying from 0.5 to 2% (w/v), and oxalic acid (OxAc), varying from 3 to 12% (w/v), to examine the effect of acidification on the polyphenol extraction yield. The ranges of acid concentration were based on trials reported in earlier studies [16]. Screening extractions were carried out at 60 °C, under stirring at 400 rpm, for 180 min. Both stirring and heating were provided by a hotplate/magnetic stirrer (AREC.X, Velp Scientifica, Usmate, Italy), with the aid of a paraffin bath. Then, extracts were centrifuged at 11,500× g for 10 min to remove debris and obtain a clarified extract.

2.4. Process Severity Determination

The intensity of the treatment was evaluated following a previously described method [17]. It is defined as:
R o   =   t   ×   e ( T 100 14.75 )
From Equation (1), the severity factor (SF) is obtained as:
SF = logRo
In these expressions, Ro represents the treatment severity, 100 °C is used as the reference temperature, and 14.75 is an empirical constant related to the process temperature and activation energy. The combined severity factor (CSF) can be calculated as shown below:
R o   =   10 pH   ×   t   ×   e ( T 100 14.75 )
CSF = logRo − pH
Additionally, the “alternative combined severity factor” (CSF′) was determined as follows:
CSF′ = logRo + |pH − 7|

2.5. Extraction Kinetics

Based on an initial screening, the kinetic model that provided the best fit to the experimental results was a single rectangular, two-parameter hyperbolic function, consistent with those applied in previous studies [16]:
Y T P ( t ) =   Y T P ( s ) t t 0.5 +   t
In this equation, YTP(t) represents the total polyphenol yield at any residence time t ; YTP(s) is the equilibrium (saturation) yield; and t 0.5 denotes the time at which YTP(t) reaches one-half of YTP(s). Thus, when t = t0.5, the yield equals YTP(s)/2, meaning that t 0.5 can be interpreted as the half-saturation time. Consequently, approximately 2 × t0.5 represents the residence time needed for the yield to enter the regular regime, that is, small increases in YTP(s) as a response to relatively large t. The initial extraction rate, h , and the second-order extraction rate constant, k , can then be calculated as follows:
h =   Y T P ( s ) t 0.5
k = 1 Y T P s t 0.5

2.6. Response Surface Methodology—Process Optimization

The evaluation of the treatments was carried out using a design of experiments that incorporated the two key processing variables: temperature (T) and residence time (t). The maximum temperature was set at 80 °C to avoid generating excessive vapor pressure within the treatment vial caused by the presence of alcohols in the solvent systems tested. Based on insights gained from the kinetic analysis, a central composite design was selected, consisting of eight factorial points and three center points, for a total of eleven experiments. Both variables were coded at three levels (−1, 0, and 1), following a procedure previously outlined [18]. Table 1 presents the complete set of experimental conditions.
The significance of the model (R2, p-value) and of each individual model coefficient was evaluated using appropriate statistical methods, including lack-of-fit and ANOVA tests, with a 95% confidence level set as the threshold for significance.

2.7. Total Polyphenol Determination

To determine the total polyphenol concentration in the dOP extracts produced, the Folin–Ciocalteu methodology was used, as previously reported [19]. All samples were appropriately diluted with 1 M formic acid in methanol prior to determination. Then, 0.78 mL distilled water was transferred into a 1.5 mL centrifuge tube and mixed with 0.02 mL diluted extract or standard solution and 0.05 mL Folin–Ciocalteu reagent, and left to react for 1 min. Following this, 0.15 mL of 20% sodium carbonate solution was added, and the mixture was incubated at ambient temperature for 60 min. Absorbance measurements were obtained at 740 nm, using as a control a sample prepared with water instead of extract or standard. With the aid of a calibration curve, constructed with standard solutions of caffeic acid (54–486 mg L−1, R2 = 0.997), the yield in total polyphenols (YTP), expressed as caffeic acid equivalents (CAE), was determined as follows:
Y T P m g   C A E   g 1 =   C × V m
where C is the total polyphenol (TP) concentration of the extract (mg L−1), V is the volume of the extraction medium (L), and m is the dry weight (g) of the plant material.

2.8. Antiradical Activity Determination

A previously published stoichiometric method was applied [20], using DPPH. The extracts were diluted with 1 M formic acid in methanol, after which 0.025 mL of the diluted extract was combined with 0.975 mL of DPPH solution (100 μM in methanol) and left to incubate at room temperature. Absorbance at 515 nm was recorded at the start (t = 0 min; A515(i)) and after 30 min (A515(f)). The antiradical activity (AAR) of the extracts was calculated using the following equation:
A AR   =   Δ A ε   ×   l   ×   C × Y TP
Here, ΔA is equal to A515(i) minus A515(f); ε (for DPPH) is 11,126 M−1 cm−1; C represents the total polyphenol (TP) concentration × 0.025 × the dilution factor (1/20 in this case); YTP is the extraction yield (mg g−1) of total polyphenols, as described by Equation (9); and l is the cuvette path length (1 cm). The AAR value was reported as μmol DPPH per gram of dry matter.

2.9. Chromatographic Analyses

A recently reported methodology was implemented to carry out liquid chromatography-tandem mass spectrometry determinations [21]. All chromatographic and mass spectrometric analyses were carried out using a TSQ Quantum Access LC-MS/MS system, equipped with a Surveyor pump (Thermo Scientific, Waltham, MA, USA) and an Acquity PDA detector (Waters, Milford, MT, USA). The instrument was operated through XCalibur 2.1 and TSQ 2.1 software. Separation was performed on a Fortis RP-18 column (150 mm × 2.1 mm, 3 μm) maintained at 40 °C. Samples were injected at 10 μL with a flow rate of 0.3 mL min−1. The mobile phases consisted of eluent A (1% aqueous acetic acid) and eluent B (99% acetonitrile/1% acetic acid). The gradient profile was as follows: 0–2 min, 5% B; 2–27 min, 50% B; 27–29 min, 100% B. Mass spectrometry conditions included a spray voltage of 3000 V, sheath gas at 30 (arbitrary units), auxiliary gas at 10 (arbitrary units), and a capillary temperature of 350 °C. Quantification was performed using an external calibration, with curves constructed using luteolin 7-O-glucoside (for luteolin quantification) (R2 = 0.9990), hydroxytyrosol (R2 = 0.9987) commercial standards, with a concentration range 0–50 μg mL−1. Standard solutions were freshly prepared in HPLC-grade methanol prior to analyses.

2.10. Statistics

The experimental design, application of response surface methodology and associated statistical analyses (including ANOVA and lack-of-fit tests), as well as multivariate regressions, were carried out using JMP™ Pro 16 (SAS, Cary, NC, USA). Non-linear curve fitting for kinetic determinations with a minimum significance threshold of 95% was generated using SigmaPlot™ 15.0 (Systat Software Inc., San Jose, CA, USA). Statistically significant differences related to various determinations of the extracts produced were first checked with the Shapiro–Wilk test. This test indicated that the data did not follow a normal distribution; thus, statistically significant differences were evaluated with the Kruskal–Wallis test in IBM SPSS Statistics™ 29 (SPSS Inc., Chicago, IL, USA). All extractions were executed at least twice, while each spectrophotometric and chromatographic measurement was performed in triplicate. Results are presented as mean values ± standard deviation (SD).

3. Results and Discussion

3.1. Solvent Trial

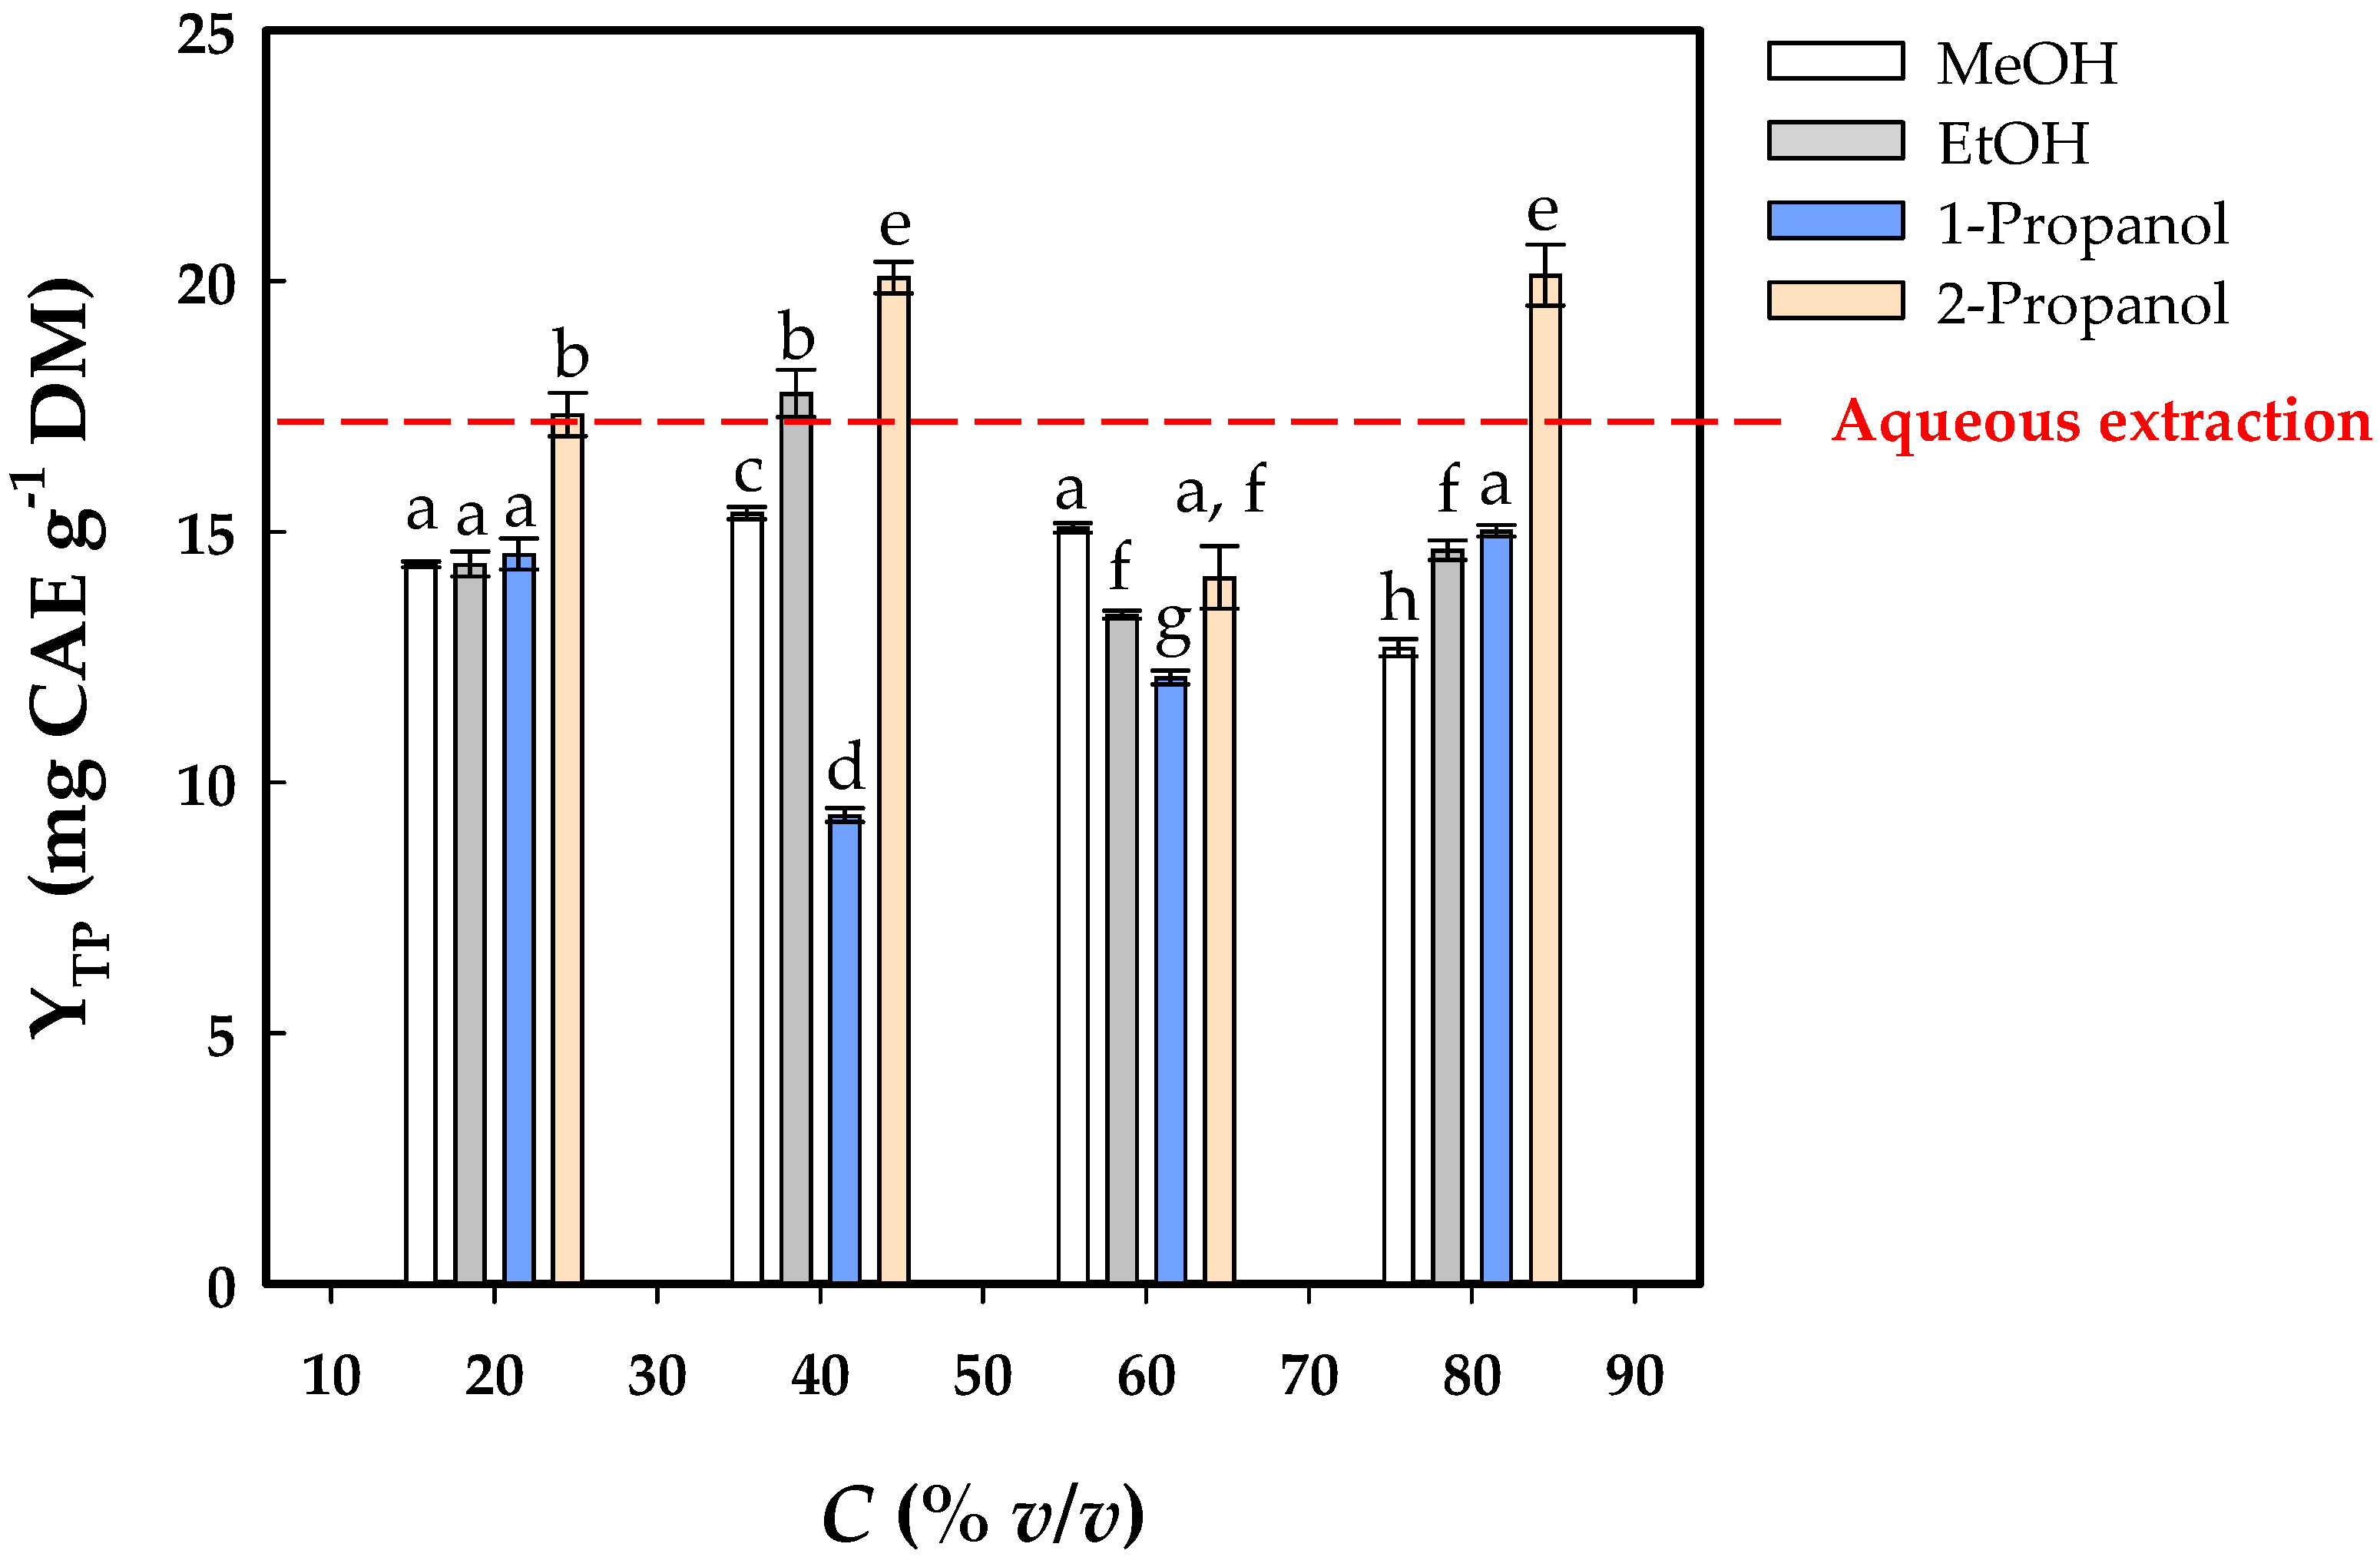
Detailed information on the effectiveness of various common solvents to recover polyphenols from dOP is scarce in the literature. Thus, in order to shape a better picture of this issue, four solvents regularly employed for polyphenol extraction were assayed as aqueous mixtures. On this basis, solvent effectiveness was assessed by determining the yield in total polyphenols (YTP) of the extracts obtained and compared to aqueous extraction, which served as a control. The results of this assay are portrayed in Figure 2. At a proportion of 20% (v/v), none of the solvents tested gave a statistically higher YTP compared to water (p > 0.05), although 2-propanol (isopropanol) was more effective than methanol, ethanol and 1-propanol (p < 0.05).
When the proportion of alcohol/water was switched to 40%, 2-propanol was shown to be significantly more effective, and the same was observed for the proportion of 80% (p < 0.05). It was also noteworthy that no other solvent system was of better efficiency compared to the aqueous extraction. Since the YTP provided by the 40% aqueous 2-propanol was the highest one (20.1 ± 0.3 mg CAE g−1 DM) and did not significantly differ from that obtained with the 80% mixture (20.1 ± 0.6 mg CAE g−1 DM), the solvent system composed of 40% 2-propanol was chosen as the most appropriate for further examinations.

3.2. Acidification Effects

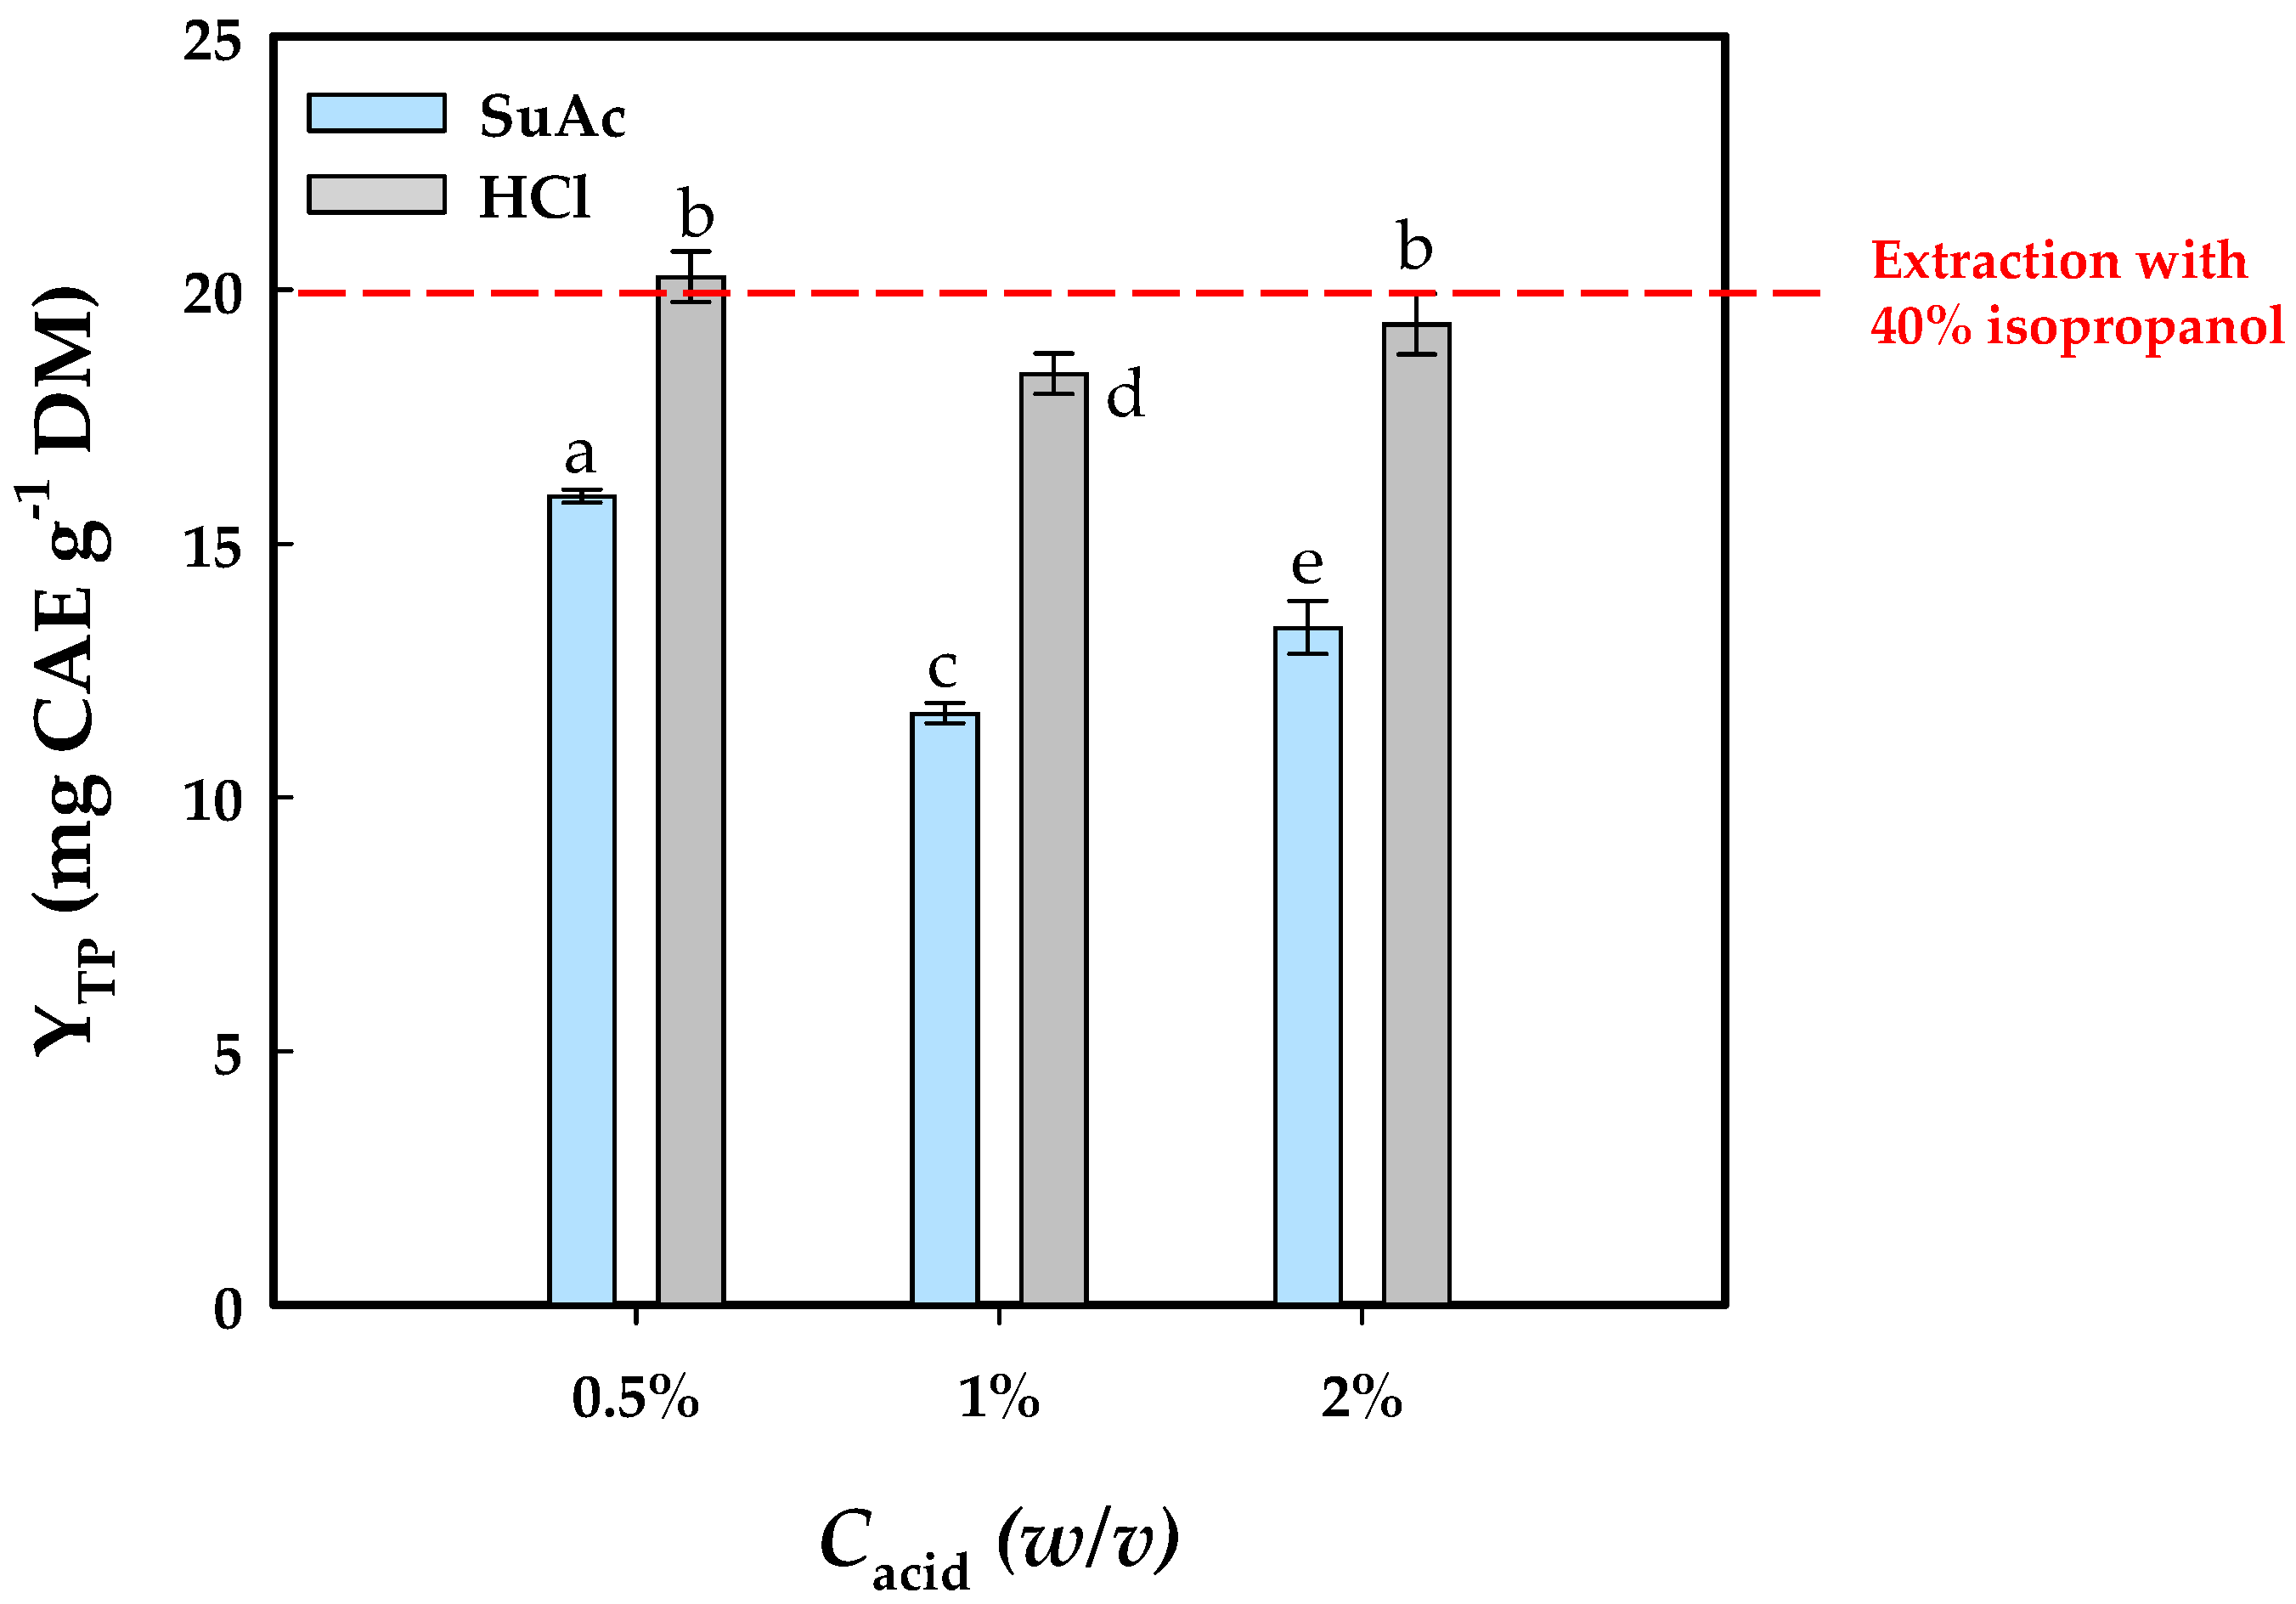
Using 40% aqueous 2-propanol as the most efficacious solvent system, the role of acid addition was first explored using two common, strong mineral acids, including sulfuric acid (SuAc) and hydrochloric acid (HCl). The results depicted in Figure 3 clearly indicated that, over an acid concentration of 0.5 to 2% (w/v), acidification offered no advantage in increasing polyphenol extraction yield.
On the contrary, in certain cases, a significant decline was recorded, manifesting a negative effect of either acid tested. This outcome was in line with earlier findings that demonstrated a non-significant effect on polyphenol recovery from olive pomace when HCl was added to hydroethanol mixtures [22]. Similar results were obtained from studies on aqueous olive pomace polyphenol extraction, where incorporation of SuAc at 0.25% provoked a decrease in total polyphenol yield [23]. On the other hand, the behavior of HCl was concentration-dependent when waste orange peel extraction was performed with water/ethanol mixtures [16]. However, it should be noted that in investigations pertaining to polyphenol extraction from olive leaves [21], the addition of SuAc or HCl was pivotal in increasing total polyphenol yield.
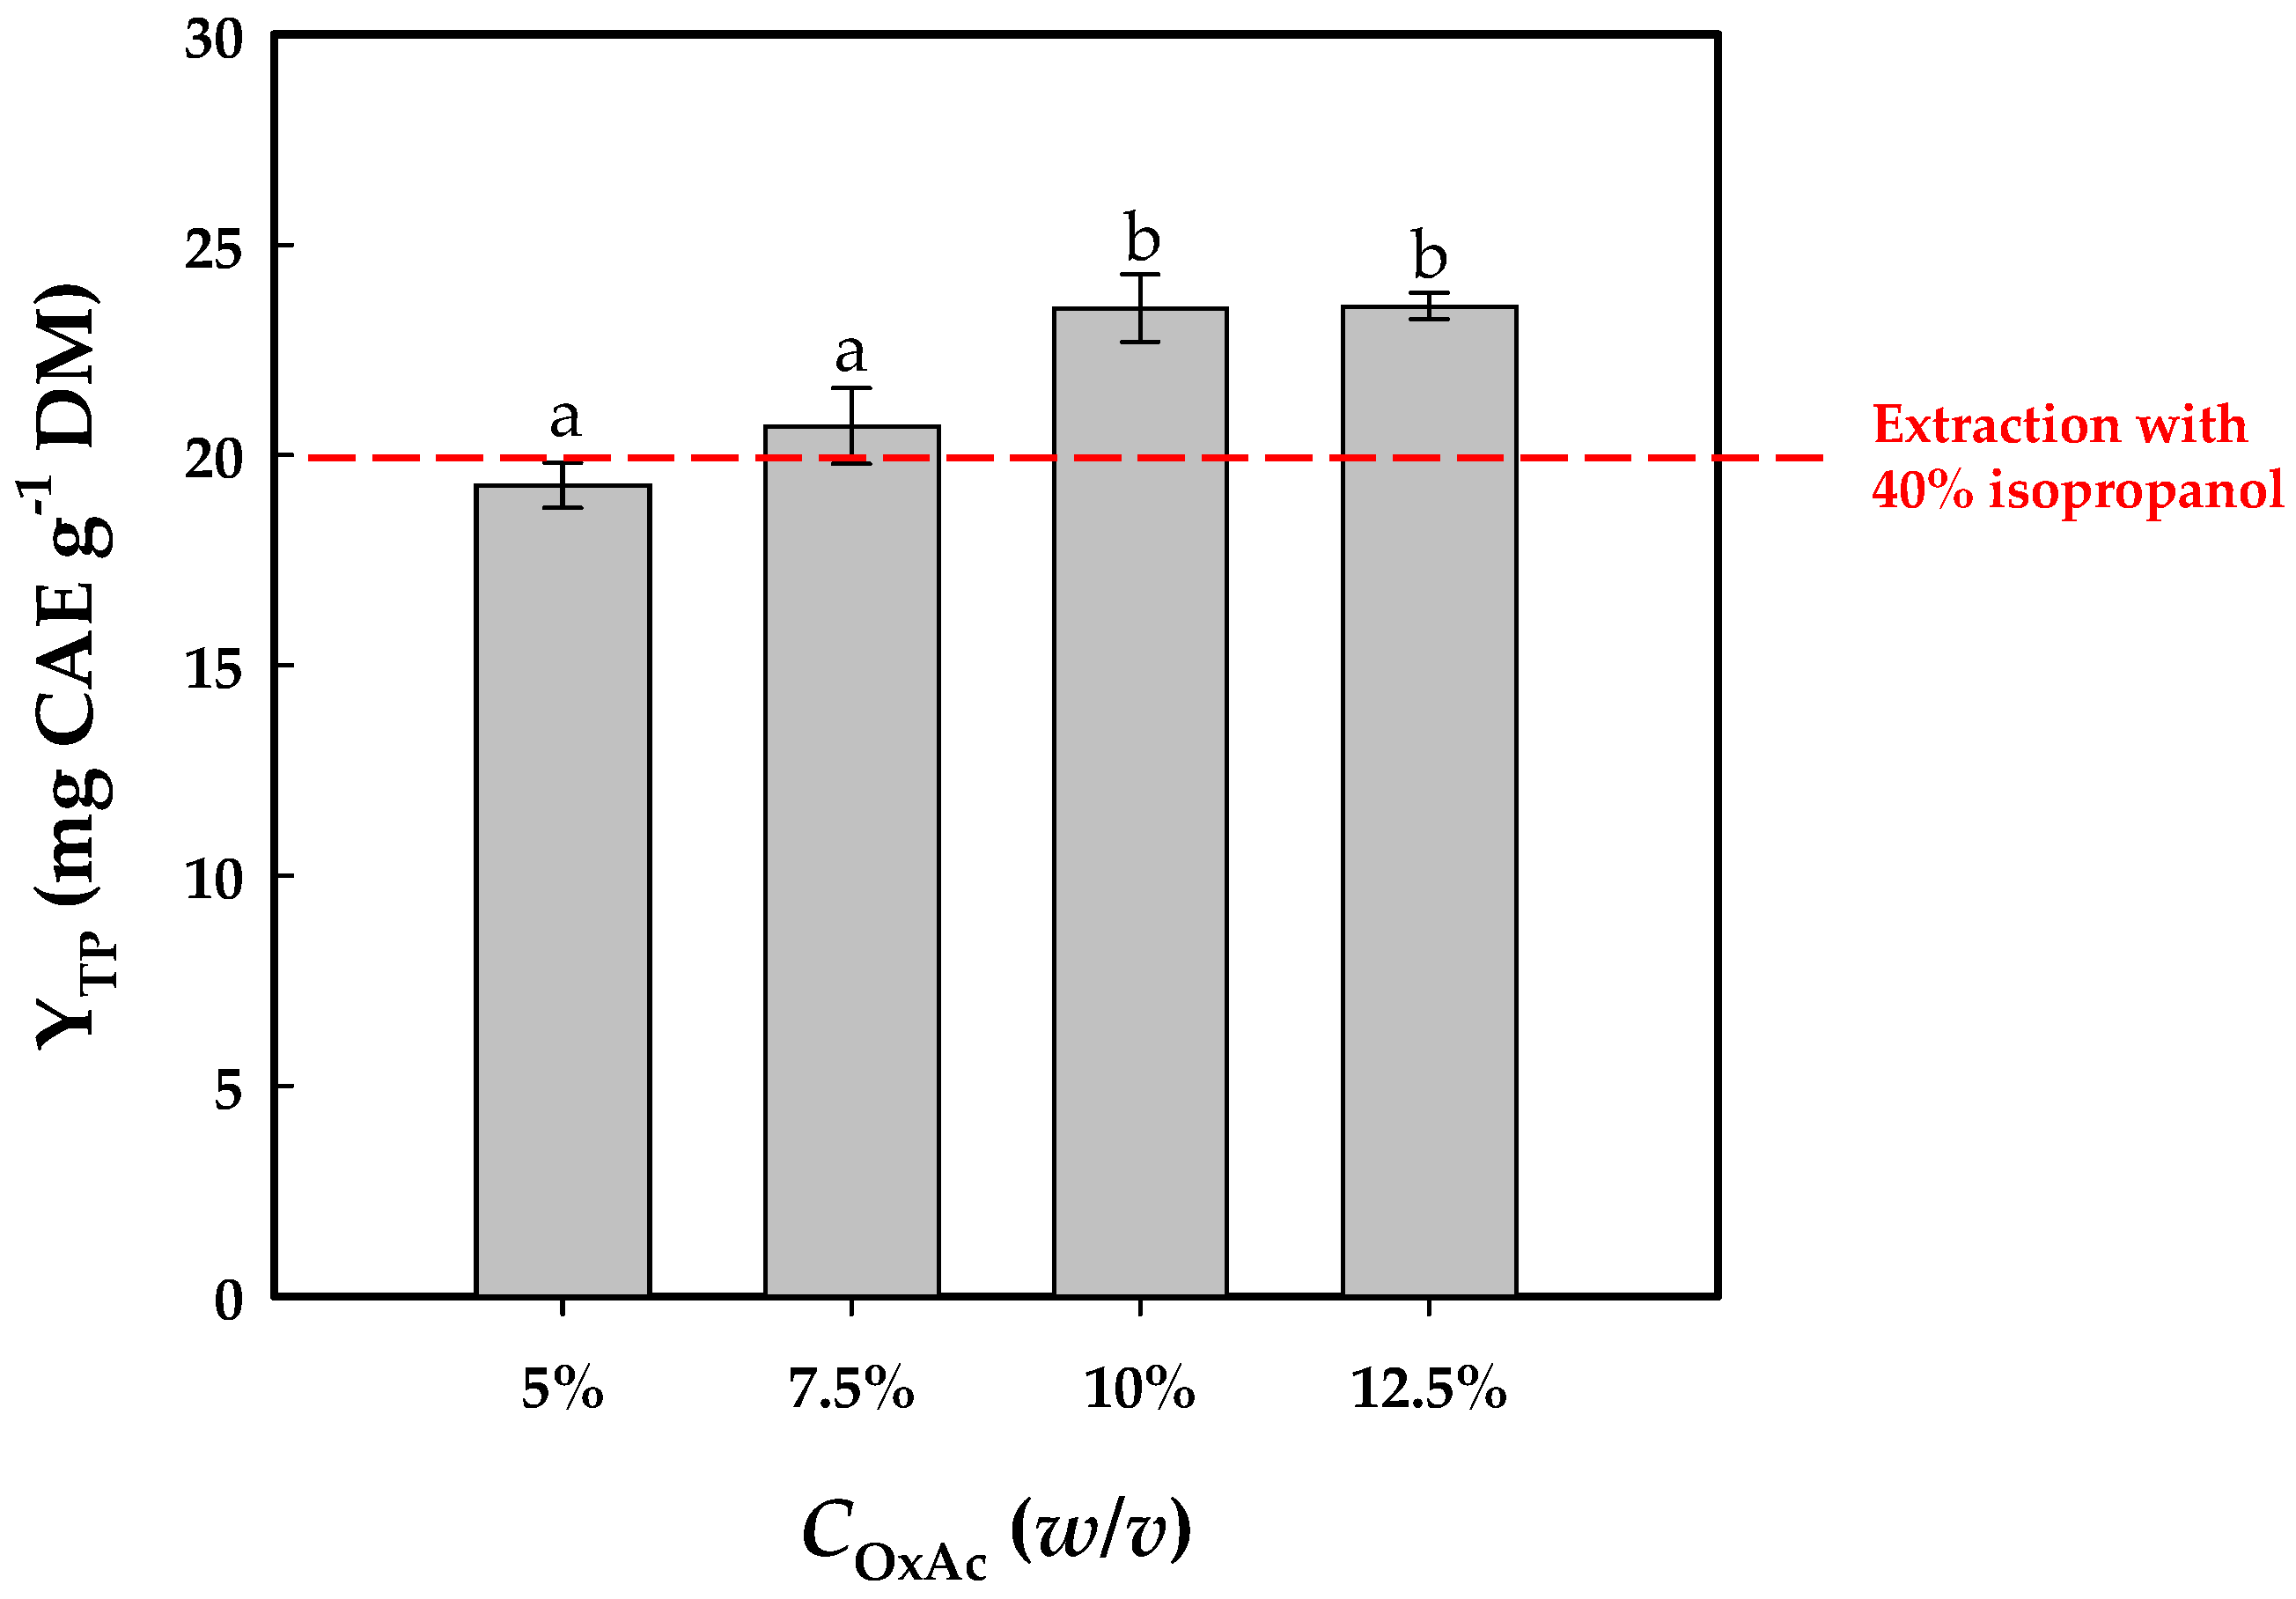
As opposed to mineral acid addition, reports on acidification with organic acids provided a diversified picture. A significant boost in polyphenol extraction yield from olive leaves was demonstrated using hydroethanolic solvents containing oxalic acid (OxAc), and from water orange peels using water containing tartaric or citric acid [24]. Nevertheless, in waste orange peel extraction with aqueous ethanol, the addition of either citric or OxAc was shown to have a null or negative effect [16]. On this basis, and in order to examine the role of organic acid addition, solutions of 40% isopropanol were also tested in the presence of increasing OxAc concentration. The results illustrated in Figure 4 suggested that, up to a level of 7.5%, OxAc exerted no significant effect on polyphenol extraction yield (p > 0.05).
However, when 10% concentration was used, a notable increase in polyphenol extraction yield was observed (p < 0.05), although further rise in OxAc concentration to 12.5% provoked no significant yield enhancement. This outcome pointed emphatically to the use of OxAc as a polyphenol extraction booster, and the mixture 40% 2-propanol/10% OxAc was selected as the highest-performing system.

3.3. Kinetics of Polyphenol Extraction

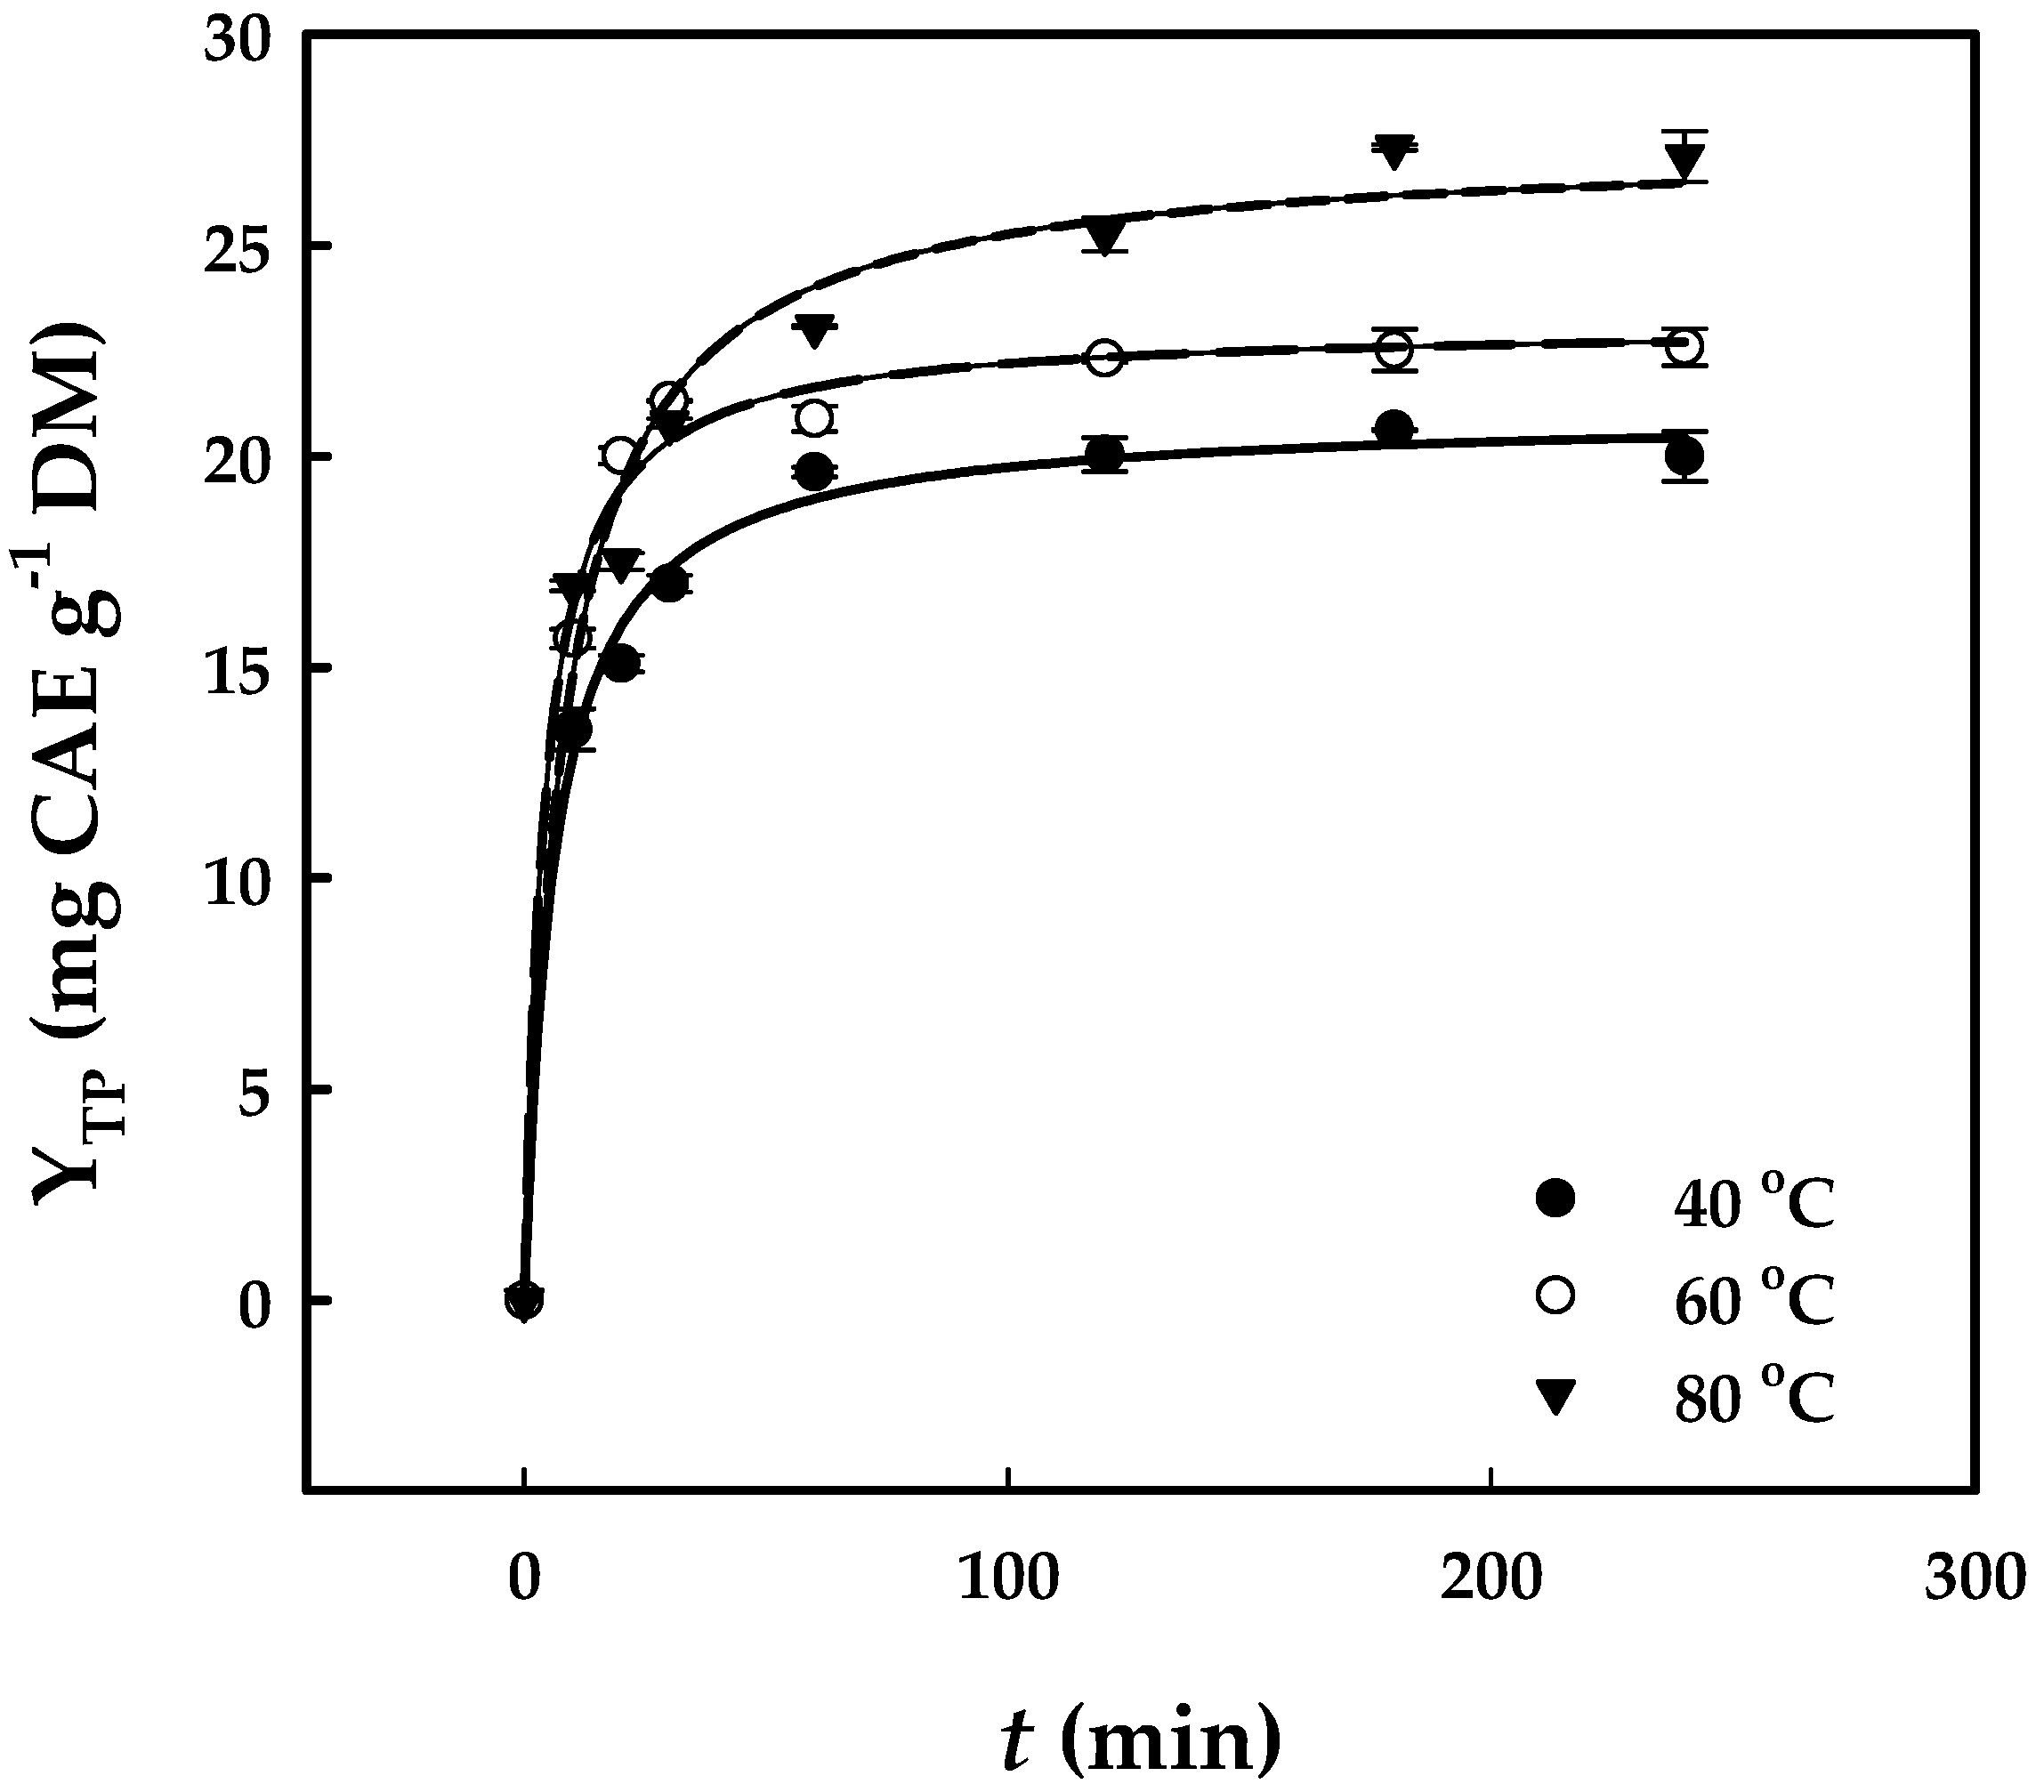
On the basis of the above results, the solvent system 40% 2-propanol/10% OxAc was used to trace polyphenol extraction kinetics, with the aim of revealing information related to the effect of residence time and temperature. Preliminary investigation on curve fitting to the experimental data indicated that polyphenol extraction obeyed a hyperbolic function model (R2 > 0.98), described by Equation (6), in accordance with earlier findings [16]. The examination over a temperature range of 40 to 80 °C (Figure 5) showed that the second-order extraction rate, k, displayed an increase when the temperature was raised from 40 to 60 °C (Table 2).
Nevertheless, a decrease was recorded when the temperature was switched to 80 °C. Likewise, the initial extraction rate, h, increased from 40 to 60 °C, but it declined when the extraction temperature changed from 60 to 80 °C. These results contradicted the Arrhenius model, which predicts that k should increase with temperature. The underlying cause of this kinetic behavior remains unclear, although similar outcomes have been observed for polyphenol extraction [20].
It could be suggested that at lower temperatures, the easily extracted polyphenols are quickly transferred into the solvent, with the observed k representing a fast, washing phase of the extraction. However, as the temperature increases, the diffusion of other, non-readily extracted polyphenols into the liquid phase slows down. In this scenario, diffusion becomes the limiting factor of the process. As a result, mass transfer progresses more slowly, as indicated by the decrease in k, h, and t0.5. Despite this, the maximum extraction yield (YTP(s)) still increases because the liquid phase accumulates polyphenols from both the washing phase and diffusion.

3.4. Severity Effects

Considering the information derived from the kinetic trial on the effect of time and temperature, the influence of severity on the performance of the extraction process was also evaluated. To this end, several combinations of residence time and temperature were examined, while severity determination included solvent acidity, as shown in Equations (4) and (5). The results of this trial are analytically given in Table 3.
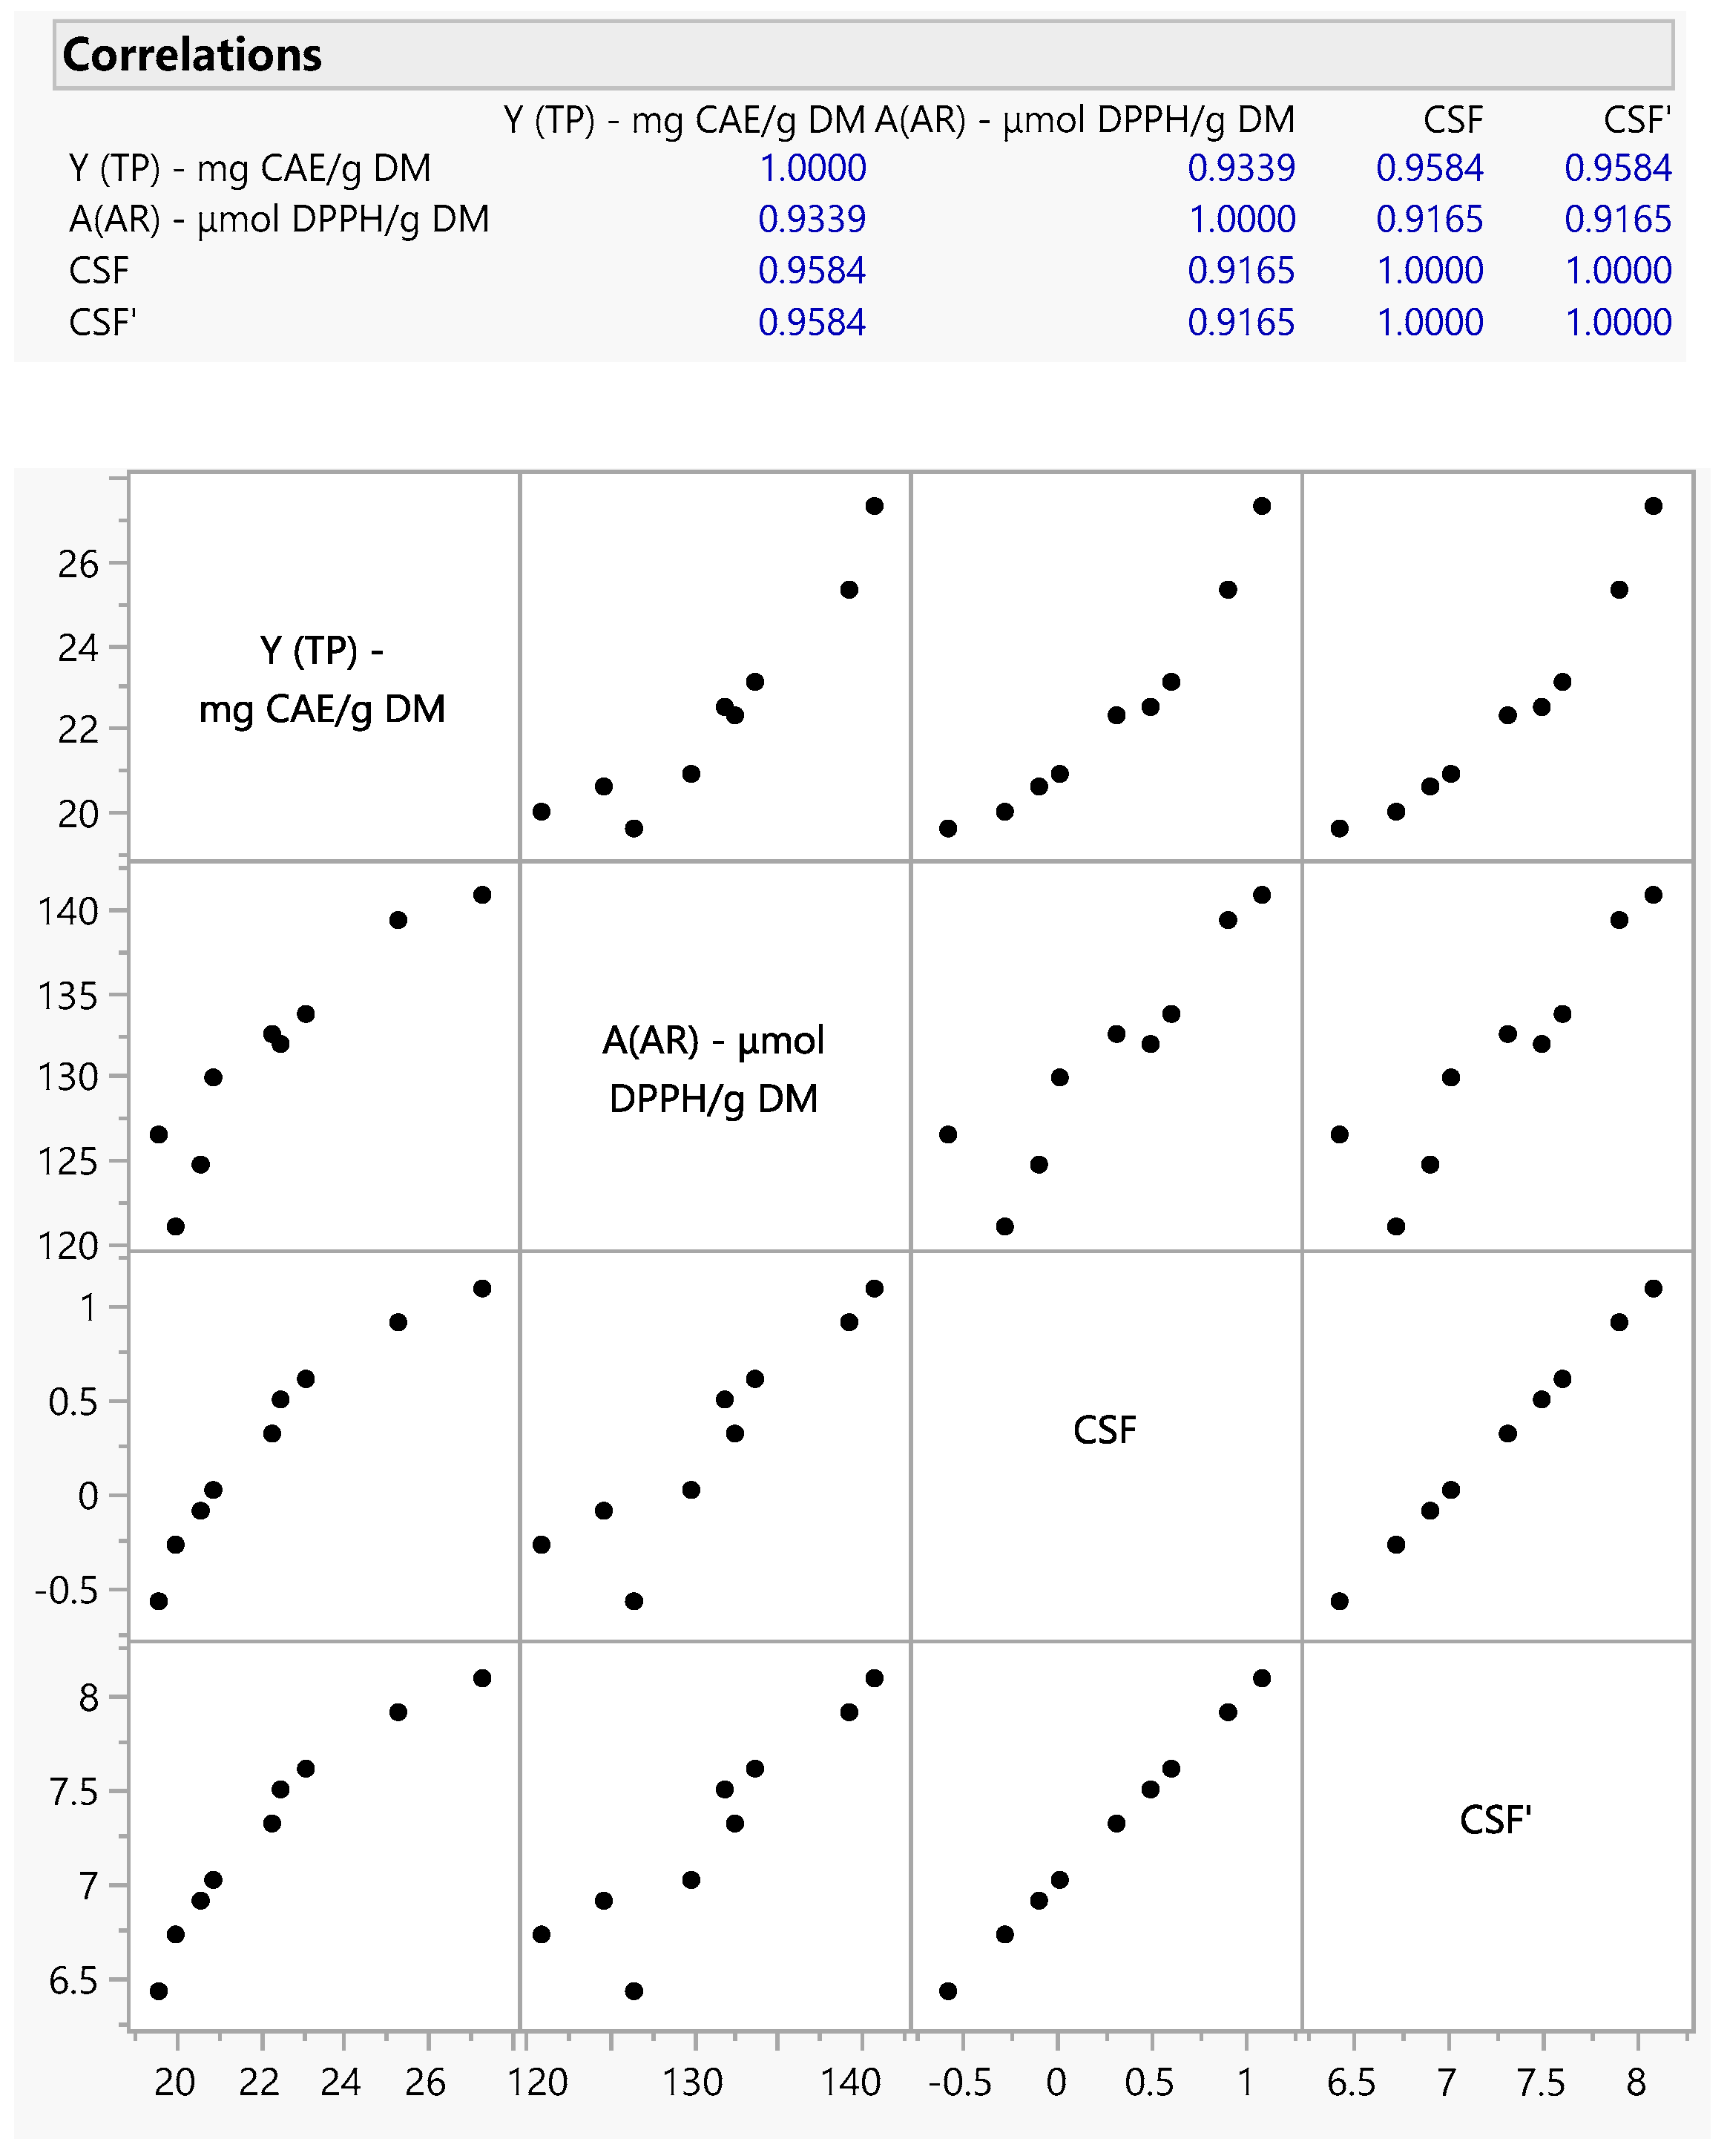
With regard to YTP, significantly higher values were recorded when the combination of 80 °C/180 min was used. A similar outcome was seen for the AAR, although AAR values did not vary significantly between 60 and 180 min when the extraction was carried out at 80 °C. Based on these observations and seeking to further clarify whether extraction severity positively affected yield and antioxidant activity, a multiple correlation was attempted. It can be viewed in Figure 6 (and the inset Table named “Correlations”) that a linear relationship between YTP and CSF′ (or CSF) was highly significant (r = 0.9584, p < 0.0001). Likewise, AAR was also significantly correlated with CSF′ (r = 0.9165, p < 0.001), but also YTP (r = 0.9339, p < 0.001). These results pointed clearly to a tight association between severity and polyphenol extraction yield, but also antioxidant activity.
Earlier studies have shown that the total polyphenol yield obtained from ethanol organosolv treatment of coffee silverskin, catalyzed with either sulfuric or oxalic acid, was strongly dependent on process severity [25]. In that work, the highest YTP was achieved using oxalic acid at a CSF′ value of 7.61. Likewise, maximum YTP from red grape pomace was obtained at a CSF′ of 7.44 during citric acid-catalyzed organosolv processing with a water/ethanol/glycerol solvent system [26]. However, to the authors’ knowledge, a correlation between extraction severity and antioxidant activity has not been previously reported. Furthermore, the high correlation between AAR and YTP strongly suggested that the expression of antioxidant activity is tightly linked to the richness of the dOP extracts in polyphenolic compounds. Such a relationship has been demonstrated for various polyphenol-containing extracts, manifesting a strong correlation between polyphenol concentration and radical-scavenging potential [27,28,29,30].
The use of treatment severity as an indicator of polyphenol extraction efficiency was first introduced in studies on ferulic acid recovery from wheat bran [31,32] and can serve as a useful approach for evaluating the combined influence of temperature and residence time on polyphenol yield. In addition, incorporating pH into the severity expression may provide a more comprehensive assessment of treatment intensity and allow its application across a broad pH range [17,33]. Nevertheless, severity should be regarded as a qualitative indicator, as the impact of treatment harshness on total polyphenol yield can depend on multiple factors, such as the polyphenolic profile and the thermal stability of the compounds. Furthermore, severity parameters do not capture potential interaction (synergistic) effects between temperature and residence time; however, they may still be useful as a supplementary criterion when selecting operational variables for organosolv processing.

3.5. Response Surface Implementation and Process Optimization

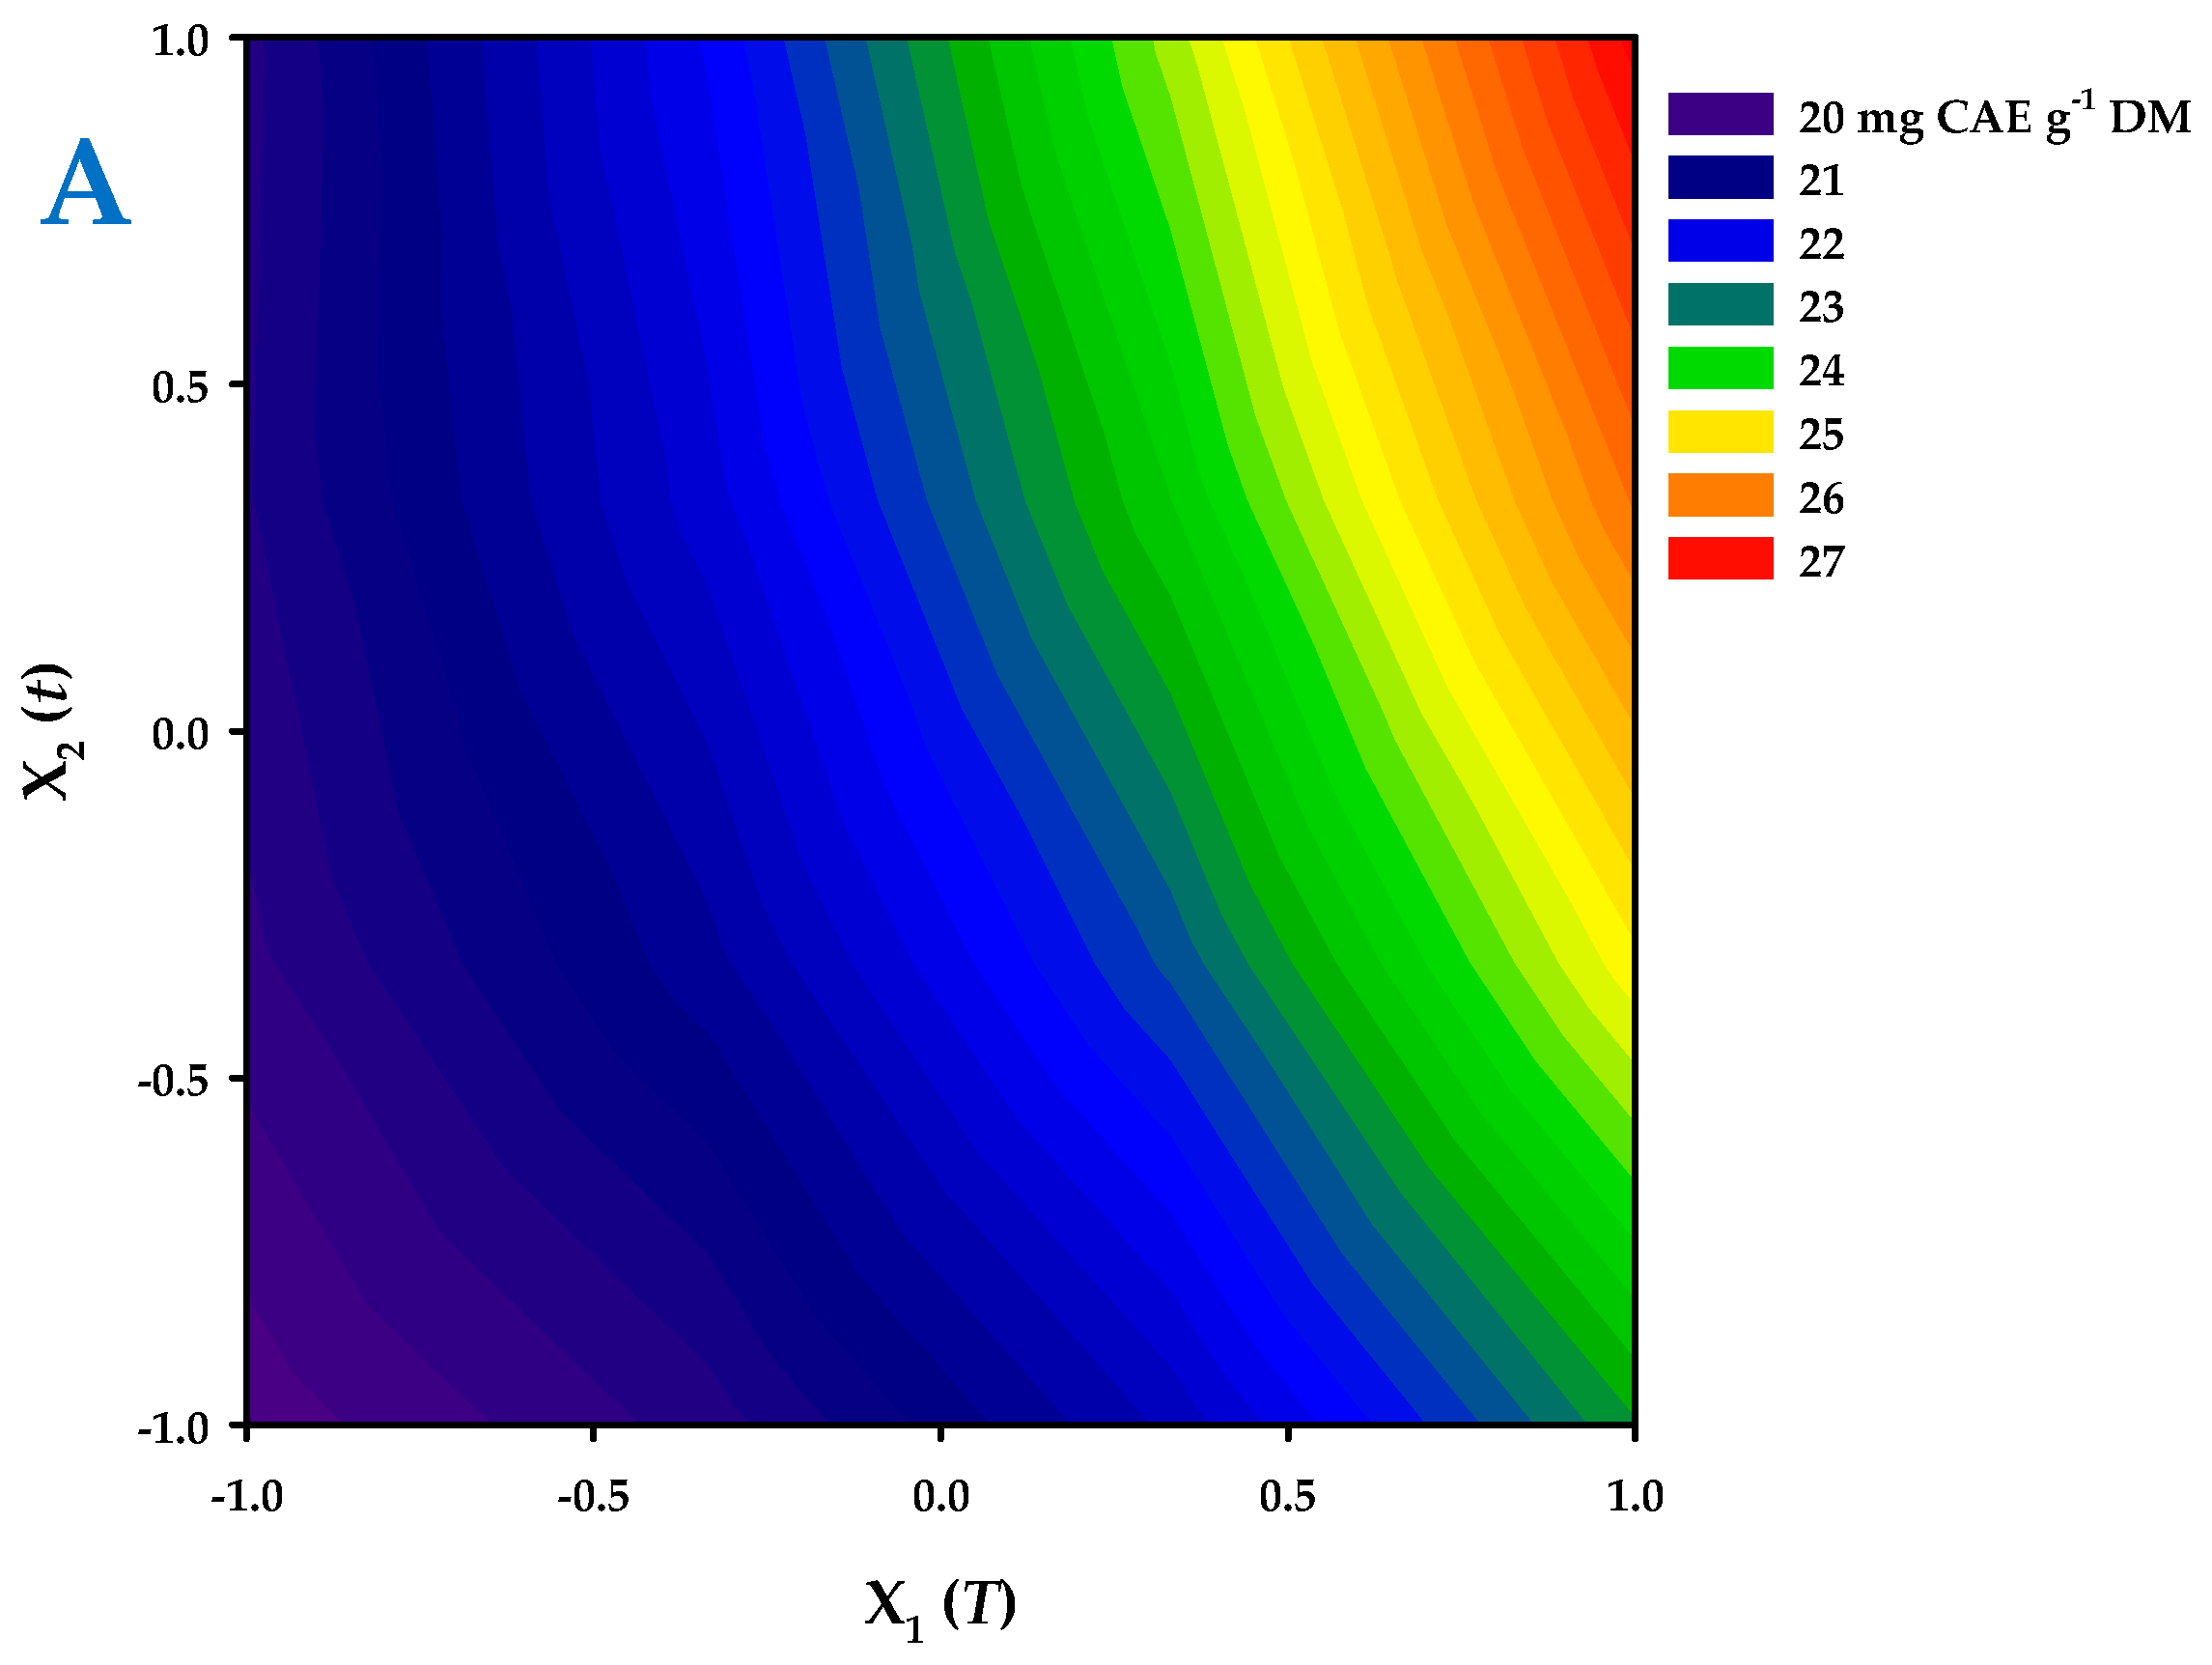
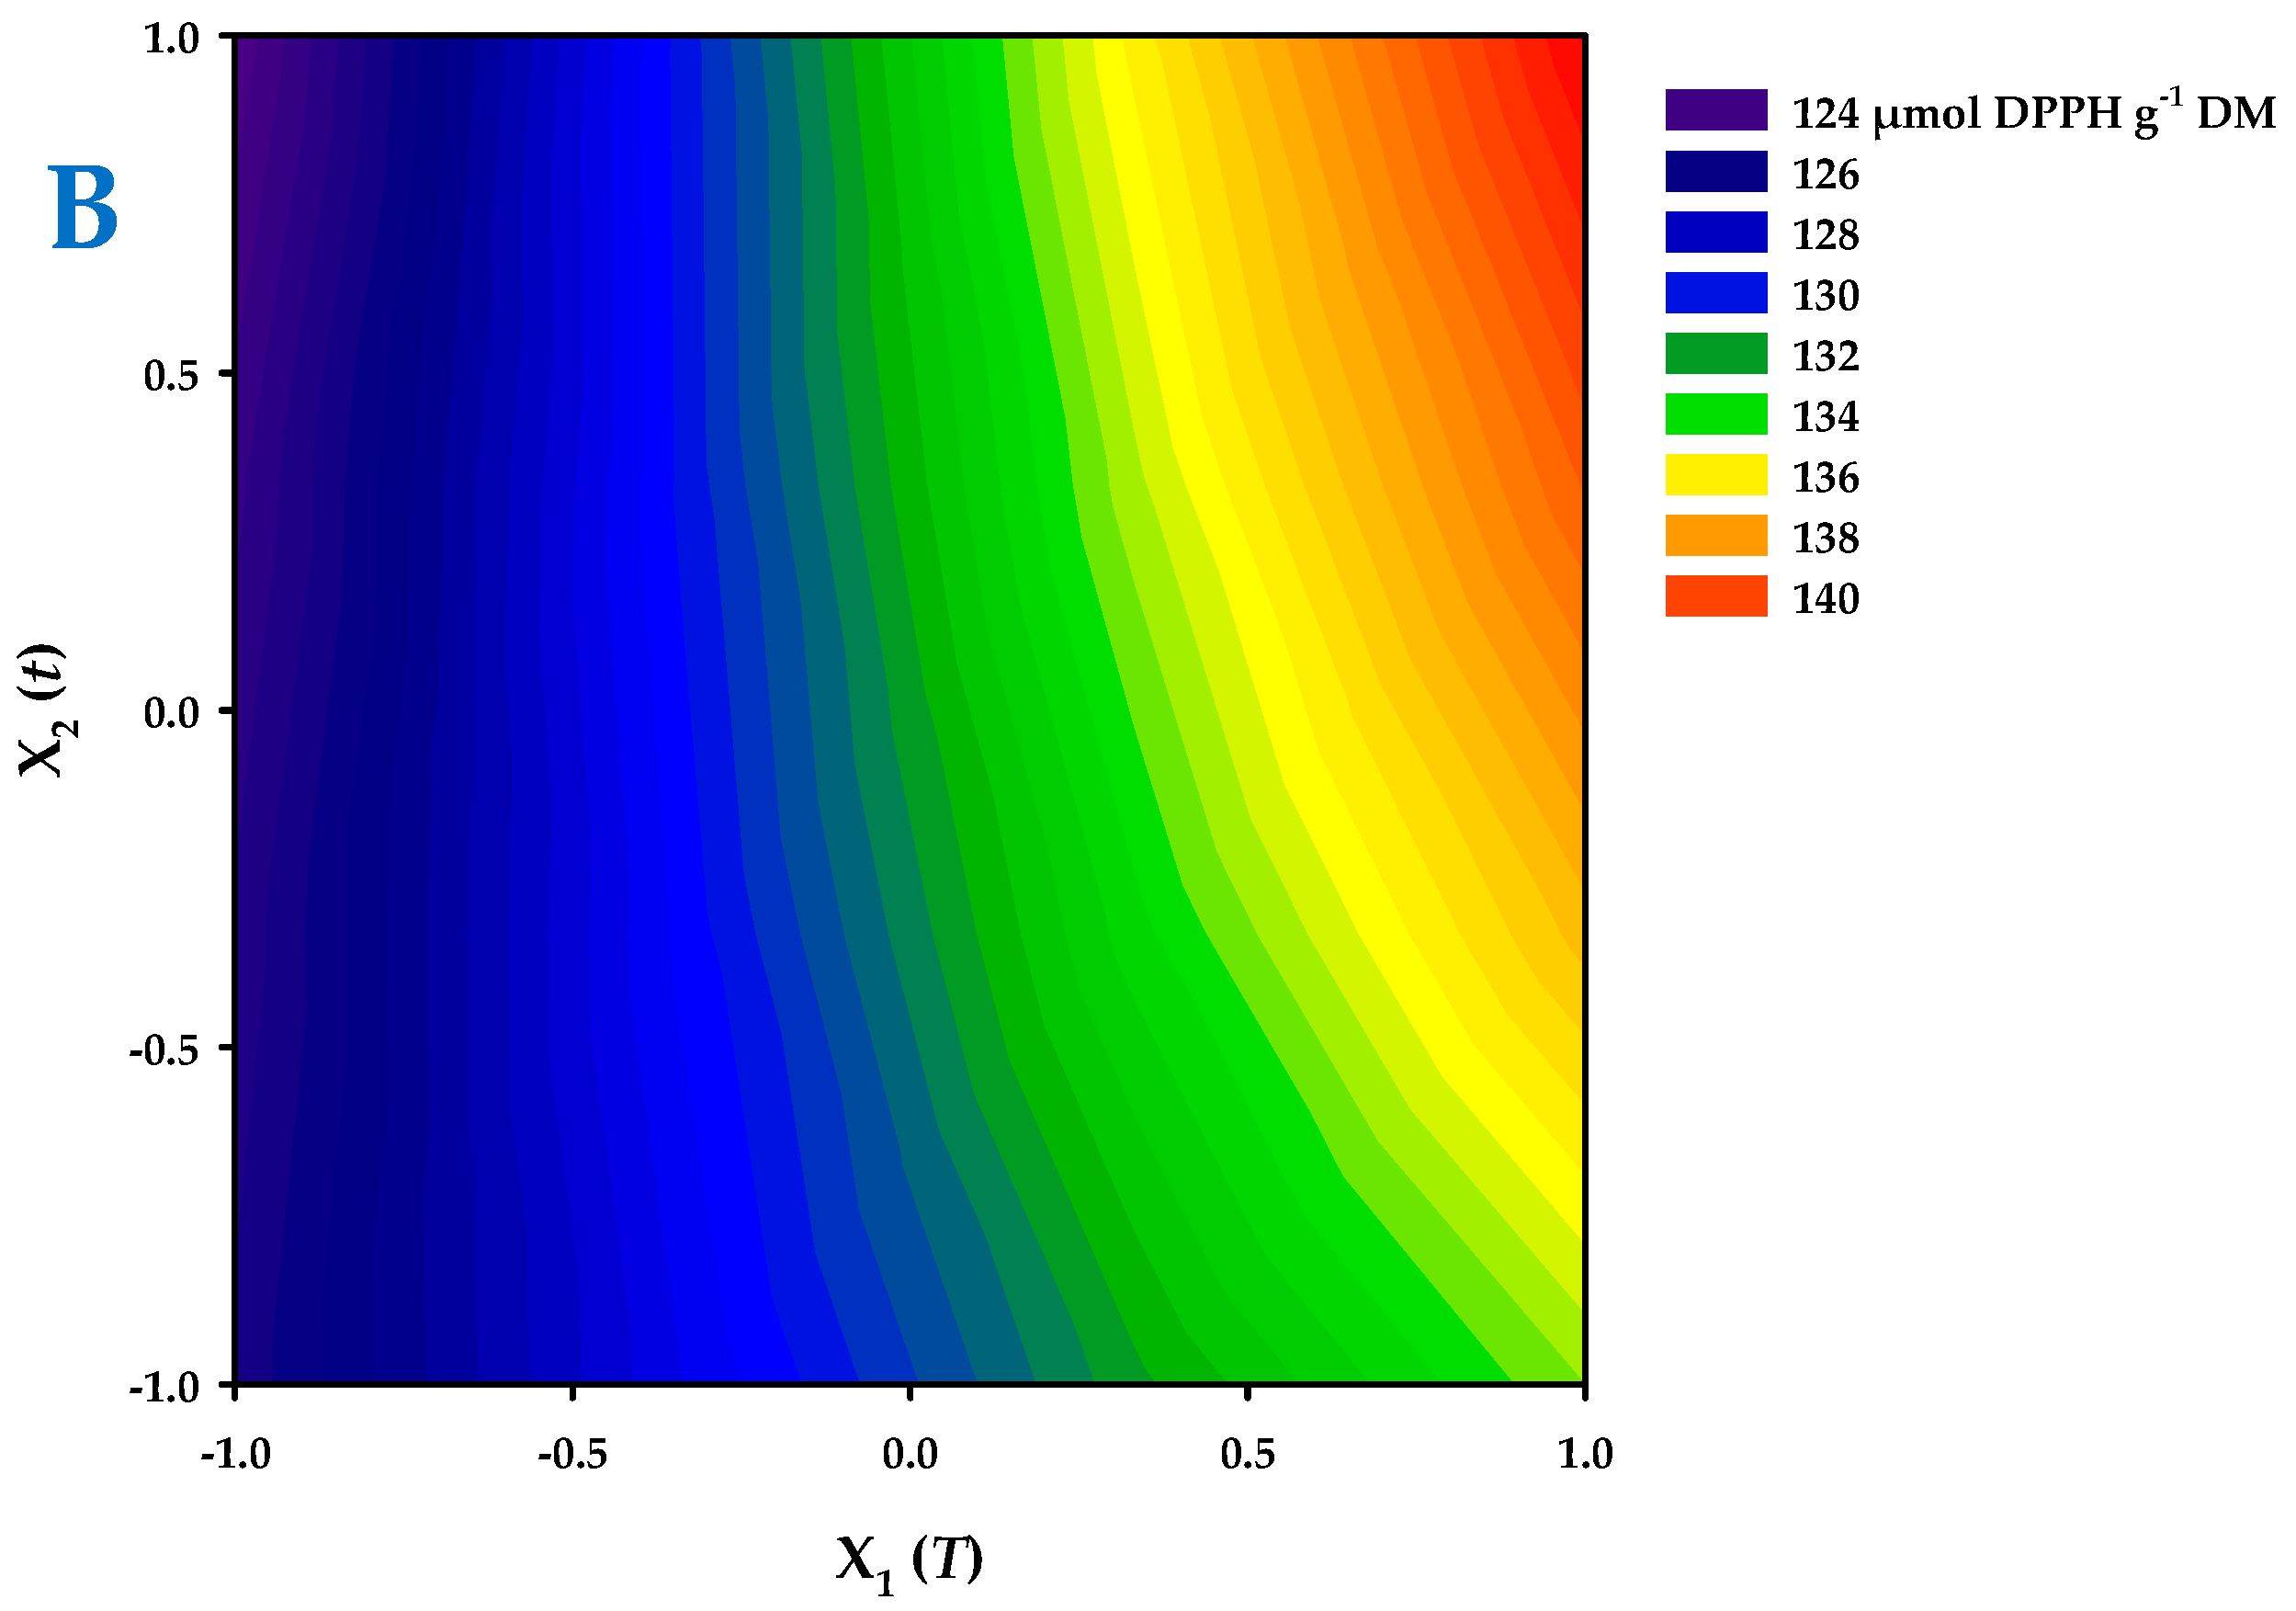
Both the severity-based analysis and the kinetic assay provided valuable information on the effects of temperature and residence time; however, these approaches cannot identify potential interaction effects between these variables or determine optimal combinations of treatment conditions (t, T). To overcome these limitations, response surface methodology was employed to systematically evaluate the influence of these key parameters and to investigate possible synergistic interactions. Both the yield in total polyphenols (YTP) and the antiradical activity (AAR) were used as responses. The adequacy of the models and the reliability of the generated response surfaces were assessed through analysis of variance (ANOVA) and lack-of-fit tests (Figures S1 and S2), as well as by comparing predicted and experimental response values for both YTP and AAR (Table 4). Contour plots derived from the models offered a clear visualization of the effects of the variables on YTP and AAR, as shown in Figure 7.
The resulting second-order polynomial equations (mathematical models), after removing non-significant terms, are presented below along with their corresponding coefficients of determination (R2), which indicate the fraction of the total variability accounted for by the models. For both models, R2 values were ≥ 0.95, and p-values were below 0.005, demonstrating an excellent agreement with the experimental data:
YTP = 22.2 + 2.56X1 + 1.1X2 + 0.81X1X2
AAR = 132.0 + 6.8X1 + 2.2X1X2
For both responses, extraction temperature (X1) was a highly significant factor (p ≤ 0.0002), but residence time exerted a notable effect on AAR only as a function of temperature, as could be implied by the significance of the X1X2 term. Thus, and based on the information drawn from the desirability function (Figures S1 and S2), the optimum settings for achieving maximum YTP and AAR were 80 °C and 180 min.
The maximum YTP level of 27.1 ± 1.1 mg CAE g−1 DM was much higher than 3.32 mg gallic acid equivalents (GAE) g−1 DM reported in a recent investigation [34], which was attained with 60% aqueous acetone under optimized conditions (75 °C, 20 min). However, a yield of almost 42 mg GAE g−1 DM could be reached when 50% aqueous acetone was used for 90 min, at 55 °C [35]. Other authors reported values under 12 mg GAE g−1 DM when microwave-assisted extraction was employed in combination with water/ethanol mixtures [22], while a yield of 15.3 mg GAE g−1 DM was obtained after implementation of a similar methodology [36]. By contrast, a combination of microwave- and enzyme-assisted processes did not afford a yield higher than 3 mg GAE g−1 DM [37]. Moreover, levels of 15–22 mg GAE g−1 DM were obtained when destoned, dried olive pomace was extracted with methanol, assisted by ultrasonication [38], but room-temperature extraction with a methanol/formic acid/water mixture yielded about 49 mg GAE g−1 DM [39]. On the other hand, it is to be underlined that yields of around 60 mg GAE g−1 DM or higher could be possible by deploying techniques such as high pressure [40], cyclodextrin-containing extraction media [41] and ultra-turrax homogenization [42].

3.6. Polyphenolic Composition

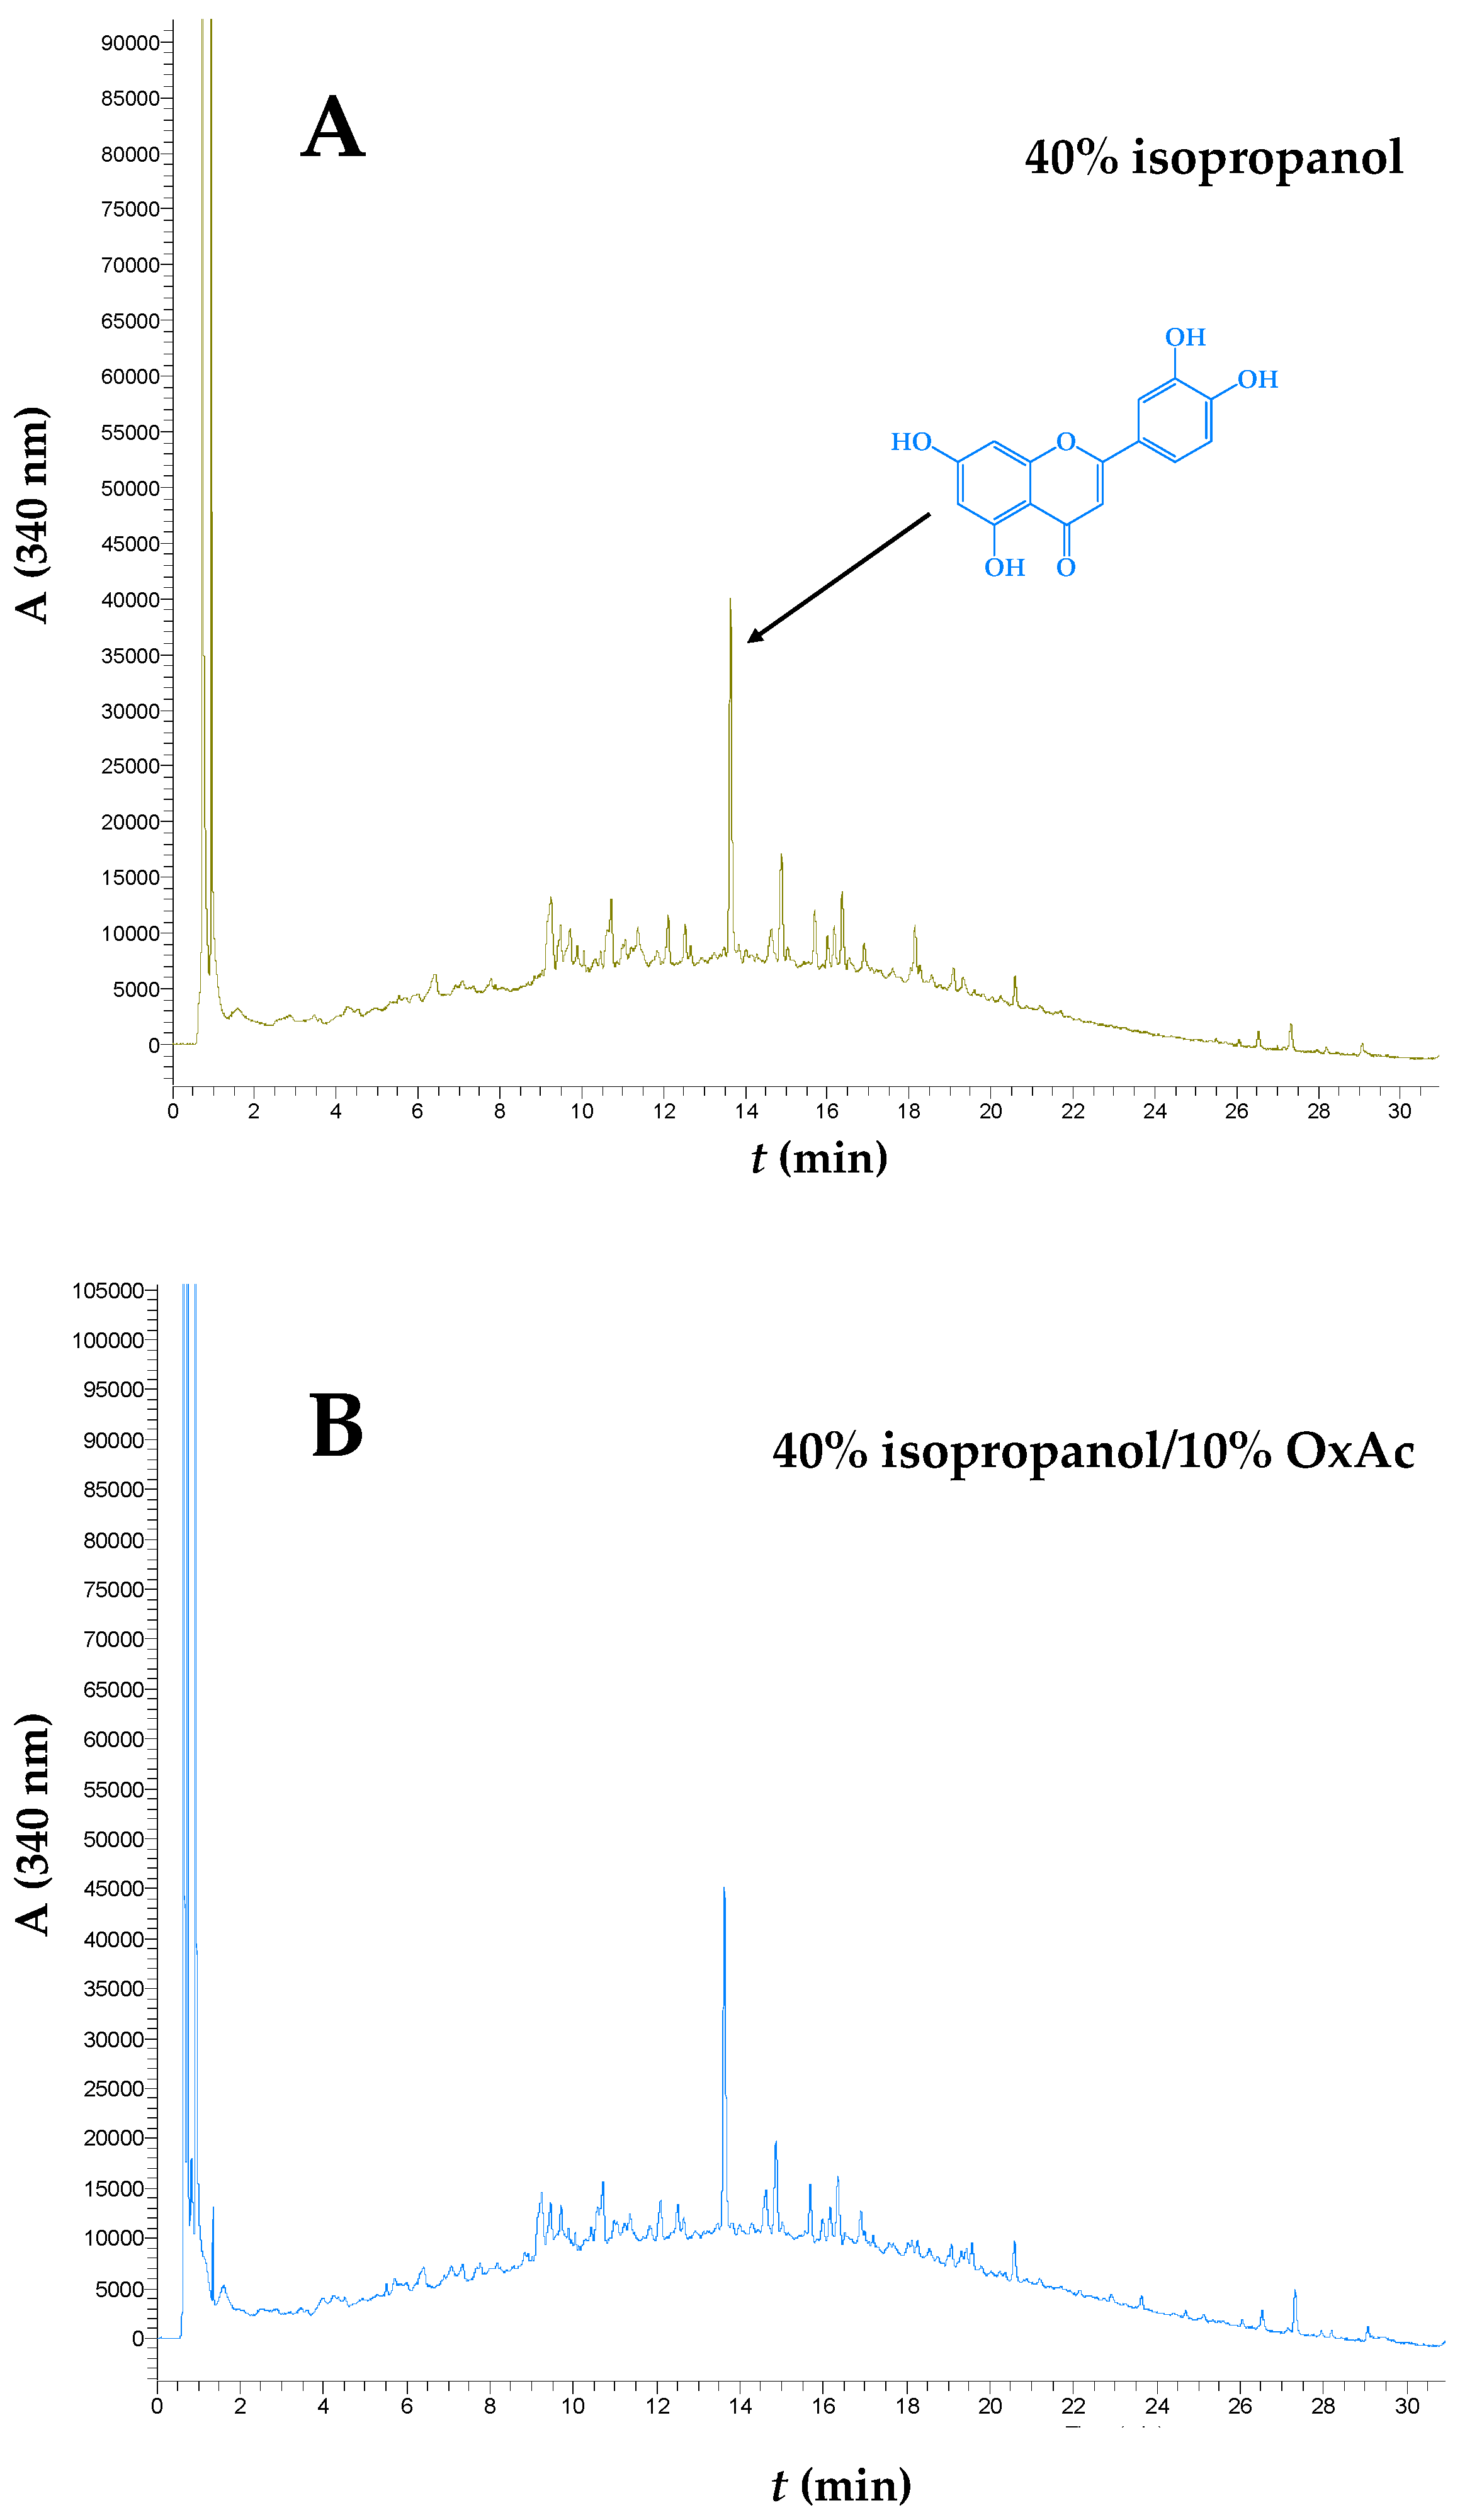
To shape a picture regarding the effect of both solvent and acidification on the polyphenolic composition of dOP extracts, liquid chromatography-mass spectrometry analyses were undertaken. It can be seen in Figure 8A that the extract obtained with 40% aqueous isopropanol was dominated by one major peak eluted at approximately 13.5 min, which exhibited UV-vis maxima at 254 and 349 nm. This was evidence of a flavone structure. The mass spectrum acquired in negative ionization mode showed a molecular ion with m/z = 285, and based on this information, this compound was tentatively identified as luteolin [43,44]. The analysis of the extract produced with 40% isopropanol/10% OxAc gave an almost identical profile, with luteolin being by far the major constituent (Figure 8B). This outcome revealed that the incorporation of OxAc into the extraction solvent did not affect the polyphenolic profile.
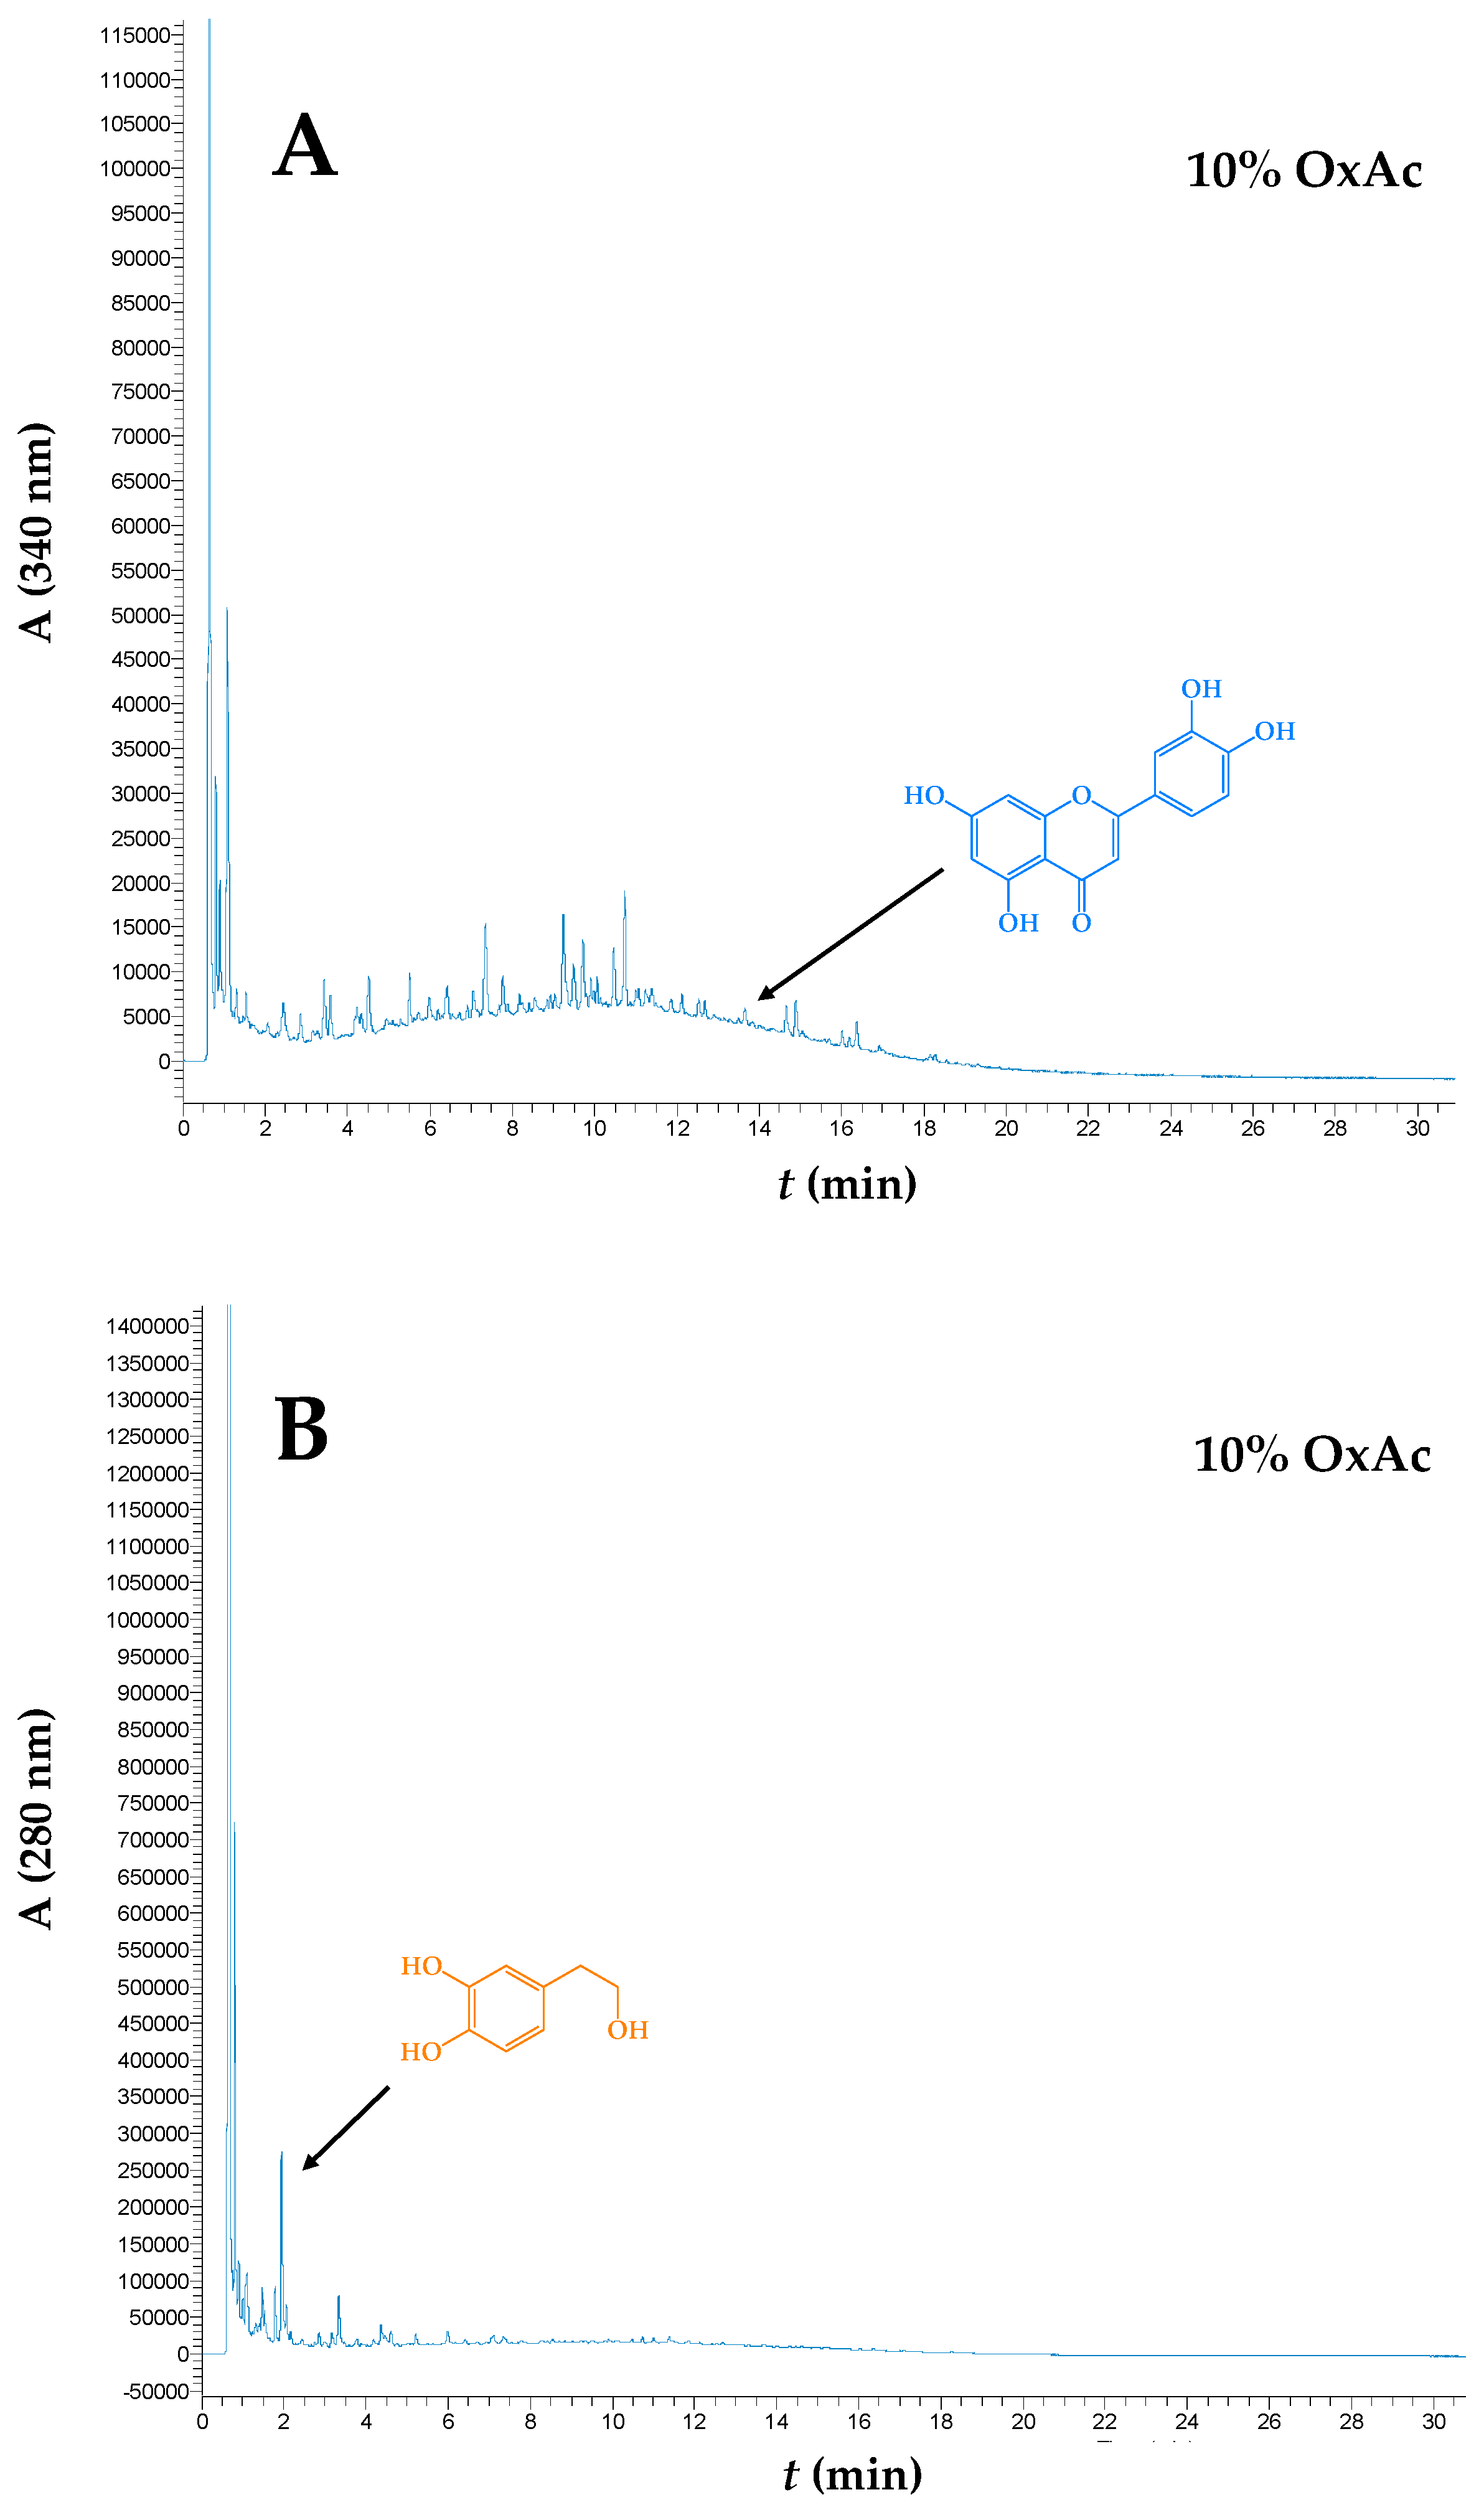
On the contrary, the extract obtained with 10% aqueous OxAc (omission of isopropanol), luteolin occurred at a very low level (Figure 9A). However, monitoring of the chromatogram at 280 nm showed the presence of another dominant peak (Figure 9B), which did not appear in the extracts produced with isopropanol-based solvents, and displayed a UV max at 278 nm, and a molecular ion at m/z = 153. This substance was tentatively assigned to hydroxytyrosol [43,44].
To gain a deeper insight into the composition of these extracts, a quantitative assessment was conducted, and the results are analytically given in Table 5. The extract generated with 10% aqueous OxAc was indeed highly enriched in hydroxytyrosol, but the yield in luteolin was particularly low and did not exceed 11 μg g−1 DM. On the other hand, extraction with 40% isopropanol/10% OxAc afforded significantly higher yields for both hydroxytyrosol and luteolin compared to the extraction with 40% isopropanol, highlighting the importance of OxAc addition. Nevertheless, it was also made clear that increased hydroxytyrosol yield was not favored when water/isopropanol mixtures were used for the extraction. This result suggested that efficient hydroxytyrosol recovery may require more polar extraction media.
The dominance of hydroxytyrosol in olive pomace aqueous extracts has been observed in earlier studies, with a reported yield of 9120 μg g−1 DM [35]. Other examinations showed that in olive pomace extracts, hydroxytyrosol and luteolin were major constituents, accompanied by ferulic acid, kaempferol and quercetin [45], or secoiridoid derivatives [46]. In the latter case, the corresponding yields for hydroxytyrosol and luteolin were 258 and 158 μg g−1 DM. Results from a following study were in line, demonstrating hydroxytyrosol as the most abundant constituent (1844 μg g−1 DM), with tyrosol, secoiridoid derivatives and p-coumaric acid occurring at significantly lower levels [47]. More recent works have confirmed that hydroxytyrosol and luteolin are indeed principal polyphenolic compounds in olive pomaces, with the corresponding yields being 6520 and 453 μg g−1 DM [43], 4219 and 714 μg g−1 DM [48], and 500 and 2260 μg g−1 DM [44].

4. Conclusions

The work presented herein was a study on the recovery of polyphenolic phytochemicals from dried olive pomace. The solvent assay carried out showed that isopropanol was the most efficacious solvent, and its efficacy was boosted by combination with oxalic acid, whereas mineral acid addition was ineffective. Polyphenol extraction yield was found to be directly related to process severity, as was the antiradical activity. The multiple regression analysis performed also revealed a strong correlation between polyphenol concentration and antiradical activity of the extracts produced. Further examination with response surface optimization confirmed that both residence time and temperature are critical in maximizing polyphenol recovery and antiradical activity. The extract obtained with the highest-performing system, 40% isopropanol/10% OxAc, was characterized by the presence of both hydroxytyrosol and the flavone luteolin, but in the absence of isopropanol, the extract generated was highly enriched in hydroxytyrosol. These differences highlighted the importance of the extraction medium in diversifying the polyphenolic composition of the extracts. Therefore, the solvent composition could be adjusted for task-specific processes. In this frame, production of hydroxytyrosol-enriched extracts would not require isopropanol. Given that olive pomace is a major olive oil production residue, its valorization might contribute to minimizing its disposal, but also to retrieving high-value-added, bioactive compounds. Such an approach, combined with integrated biorefinery technologies, could act effectively towards an abatement of environmental aggravation and the production of precious natural antioxidants or platform chemicals, essential to food, pharmaceutical and cosmetics industries. In a wider frame of sustainable food waste management, similar strategies are instrumental components of a circular economy perspective.

Supplementary Materials

The following supporting information can be downloaded at: https://www.mdpi.com/article/10.3390/waste4020019/s1, Figure S1: Optimization of the extraction process with regard to YTP, using 40% isopropanol/10% oxalic acid. Panel (A) illustrates the relationship between the predicted and experimental response (YTP) values obtained through response surface methodology. The coefficient of determination (R2) and the model’s p-value are also presented. Panel (B) displays the desirability function, the highest predicted YTP, and the theoretical optimal time (t) and temperature (T). The inset tables summarize the statistical parameters related to the response surface methodology. Values highlighted in color indicate statistical significance (p < 0.05). Figure S2: Optimization of the extraction process with regard to AAR, using 40% isopropanol/10% oxalic acid. Panel (A) illustrates the relationship between the predicted and experimental response (AAR) values obtained through response surface methodology. The coefficient of determination (R2) and the model’s p-value are also presented. Panel (B) displays the desirability function, the highest predicted AAR, and the theoretical optimal time (t) and temperature (T). The inset tables summarize the statistical parameters related to the response surface methodology. Values highlighted in color indicate statistical significance (p < 0.05). Table S1: Composition and pH values of all solvent systems used in this study.

Author Contributions

Conceptualization, D.P.M. and S.G.; methodology, D.P.M., S.G., M.G. and M.M.Y.; validation, D.P.M., S.G., M.G. and M.M.Y.; formal analysis, M.G. and M.M.Y.; investigation, M.G. and M.M.Y.; resources, D.P.M. and S.G.; data curation, M.G. and M.M.Y.; writing—original draft preparation, D.P.M. and S.G.; writing—review and editing, D.P.M. and S.G.; visualization, D.P.M. and S.G.; supervision, D.P.M. and S.G.; project administration, S.G. All authors have read and agreed to the published version of the manuscript.

Funding

This study received no external funding.

Institutional Review Board Statement

Not applicable.

Informed Consent Statement

Not applicable.

Data Availability Statement

The data that support the findings of this study are available from the corresponding author upon reasonable request.

Conflicts of Interest

The authors declare no conflicts of interest.

References

  1. Hsiao, C.-J.; Hu, J.-L. Biomass and circular economy: Now and the future. Biomass 2024, 4, 720–739. [Google Scholar] [CrossRef] [Scilit]
  2. Lackner, M.; Besharati, M. Agricultural waste: Challenges and solutions, a Review. Waste 2025, 3, 18. [Google Scholar] [CrossRef] [Scilit]
  3. Roque, M.d.L.; Botelho, C.; Barros, A.N. From waste to resource: Chemical characterization of olive oil industry by-products for sustainable applications. Molecules 2025, 30, 3212. [Google Scholar] [CrossRef] [Scilit] [PubMed]
  4. Rodríguez-Pérez, M.; García-Béjar, B.; Burgos-Ramos, E.; Silva, P. Valorization of olive oil and wine industry byproducts: Challenges and opportunities in sustainable food applications. Foods 2025, 14, 2475. [Google Scholar] [CrossRef] [Scilit] [PubMed]
  5. Hassen, W.; Hassen, B.; Werhani, R.; Hidri, Y.; Jedidi, N.; Hassen, A. Processes of valorization and management of olive by-products: The pomace and olive mill wastewater. In Wastewater from Olive Oil Production: Environmental Impacts, Treatment and Valorisation; Springer: Berlin/Heidelberg, Germany, 2023; pp. 1–25. [Google Scholar]
  6. Gómez-Cruz, I.; del Mar Contreras, M.; Romero, I.; Castro, E. Towards the integral valorization of olive pomace-derived biomasses through biorefinery strategies. ChemBioEng Rev. 2024, 11, 253–277. [Google Scholar] [CrossRef] [Scilit]
  7. Romani, A.; Ieri, F.; Urciuoli, S.; Noce, A.; Marrone, G.; Nediani, C.; Bernini, R. Health effects of phenolic compounds found in extra-virgin olive oil, by-products, and leaf of Olea europaea L. Nutrients 2019, 11, 1776. [Google Scholar] [CrossRef] [Scilit]
  8. Paulo, F.; Santos, L. Deriving valorization of phenolic compounds from olive oil by-products for food applications through microencapsulation approaches: A comprehensive review. Crit. Rev. Food Sci. Nutr. 2021, 61, 920–945. [Google Scholar] [CrossRef] [Scilit]
  9. Bubulac, L.; Bogdan-Andreescu, C.F.; Voica, D.V.; Cristea, B.M.; Chiș, M.S.; Slăvescu, D.A. From olive oil to pomace: Sustainable valorization pathways linking food processing and human health. Appl. Sci. 2025, 15, 10717. [Google Scholar] [CrossRef] [Scilit]
  10. Tapia-Quirós, P.; Montenegro-Landívar, M.F.; Reig, M.; Vecino, X.; Cortina, J.L.; Saurina, J.; Granados, M. Recovery of polyphenols from agri-food by-products: The olive oil and winery industries cases. Foods 2022, 11, 362. [Google Scholar] [CrossRef] [Scilit]
  11. Contreras-Angulo, L.A.; Laaroussi, H.; Ousaaid, D.; Bakour, M.; Lyoussi, B.; Ferreira-Santos, P. Sustainable valorization of olive oil by-products: Green extraction of phytochemicals, encapsulation strategies, and food applications. J. Food Sci. 2025, 90, e70412. [Google Scholar] [CrossRef] [Scilit] [PubMed]
  12. Picot-Allain, C.; Mahomoodally, M.F.; Ak, G.; Zengin, G. Conventional versus green extraction techniques—A comparative perspective. Cur. Opin. Food Sci. 2021, 40, 144–156. [Google Scholar] [CrossRef] [Scilit]
  13. Queffelec, J.; Beraud, W.; Torres, M.D.; Domínguez, H. Advances in obtaining ready to use extracts with natural solvents. Sust. Chem. Pharm. 2024, 38, 101478. [Google Scholar] [CrossRef] [Scilit]
  14. Saini, R.K.; Khan, M.I.; Kumar, V.; Shang, X.; Lee, J.-H.; Ko, E.-Y. Bioactive compounds of agro-industrial by-products: Current trends, recovery, and possible utilization. Antioxidants 2025, 14, 650. [Google Scholar] [CrossRef] [Scilit]
  15. Byrne, F.P.; Jin, S.; Paggiola, G.; Petchey, T.H.; Clark, J.H.; Farmer, T.J.; Hunt, A.J.; Robert McElroy, C.; Sherwood, J. Tools and techniques for solvent selection: Green solvent selection guides. Sustain. Chem. Proc. 2016, 4, 7. [Google Scholar] [CrossRef] [Scilit]
  16. Agnaou, H.; Refai, H.; Grigorakis, S.; Makris, D.P. The effect of mineral and organic acid addition on the ethanol organosolv treatment of waste orange peels for producing hesperidin-enriched extracts. Analytica 2025, 6, 56. [Google Scholar] [CrossRef] [Scilit]
  17. Pedersen, M.; Meyer, A.S. Lignocellulose pretreatment severity–relating pH to biomatrix opening. New Biotech. 2010, 27, 739–750. [Google Scholar] [CrossRef] [Scilit]
  18. Bezerra, M.A.; Ferreira, S.L.C.; Novaes, C.G.; Dos Santos, A.M.P.; Valasques, G.S.; da Mata Cerqueira, U.M.F.; dos Santos Alves, J.P. Simultaneous optimization of multiple responses and its application in Analytical Chemistry—A review. Talanta 2019, 194, 941–959. [Google Scholar] [CrossRef] [Scilit]
  19. Karakashov, B.; Grigorakis, S.; Loupassaki, S.; Mourtzinos, I.; Makris, D.P. Optimisation of organic solvent-free polyphenol extraction from Hypericum triquetrifolium Turra using Box–Behnken experimental design and kinetics. Inter. J. Ind. Chem. 2015, 6, 85–92. [Google Scholar] [CrossRef] [Scilit]
  20. Lakka, A.; Karageorgou, I.; Kaltsa, O.; Batra, G.; Bozinou, E.; Lalas, S.; Makris, D. Polyphenol extraction from Humulus lupulus (hop) using a neoteric glycerol/L-alanine deep eutectic solvent: Optimisation, kinetics and the effect of ultrasound-assisted pretreatment. AgriEngineering 2019, 1, 403–417. [Google Scholar] [CrossRef] [Scilit]
  21. Refai, H.; Derwiche, F.; Grigorakis, S.; Makris, D.P. Simultaneous high-performance recovery and extended acid-catalyzed hydrolysis of oleuropein and flavonoid glycosides of olive (Olea europaea) leaves: Hydrothermal versus ethanol organosolv treatment. Inter. J. Mol. Sci. 2024, 25, 7820. [Google Scholar] [CrossRef] [Scilit]
  22. Tapia-Quirós, P.; Montenegro-Landívar, M.F.; Reig, M.; Vecino, X.; Alvarino, T.; Cortina, J.L.; Saurina, J.; Granados, M. Olive mill and winery wastes as viable sources of bioactive compounds: A study on polyphenols recovery. Antioxidants 2020, 9, 1074. [Google Scholar] [CrossRef] [Scilit] [PubMed]
  23. Rodríguez Márquez, M.; Rodríguez Gutiérrez, G.; Giménez, M.; Rizzo, P.F.; Bueno, L.; Deiana, C.; Monetta, P. Obtaining phenolic-enriched liquid fractions and compostable pomace for agriculture from alperujo using standard two-phase olive oil mill equipment. Agriculture 2024, 14, 1427. [Google Scholar] [CrossRef] [Scilit]
  24. Kalompatsios, D.; Athanasiadis, V.; Palaiogiannis, D.; Lalas, S.I.; Makris, D.P. Valorization of waste orange peels: Aqueous antioxidant polyphenol extraction as affected by organic acid addition. Beverages 2022, 8, 71. [Google Scholar] [CrossRef] [Scilit]
  25. Smyrnakis, G.; Stamoulis, G.; Palaiogiannis, D.; Chatzimitakos, T.; Athanasiadis, V.; Lalas, S.I.; Makris, D.P. Recovery of polyphenolic antioxidants from coffee silverskin using acid-catalyzed ethanol organosolv treatment. ChemEngineering 2023, 7, 72. [Google Scholar] [CrossRef] [Scilit]
  26. Geropoulou, M.; Yiagtzi, E.; Chatzimitakos, T.; Palaiogiannis, D.; Makris, D.P. Organosolv treatment of red grape pomace for effective recovery of antioxidant polyphenols and pigments using a ternary glycerol/ethanol/water system under mild acidic conditions. Molecules 2024, 29, 563. [Google Scholar] [CrossRef] [Scilit] [PubMed]
  27. Clarke, G.; Ting, K.N.; Wiart, C.; Fry, J. High correlation of 2, 2-diphenyl-1-picrylhydrazyl (DPPH) radical scavenging, ferric reducing activity potential and total phenolics content indicates redundancy in use of all three assays to screen for antioxidant activity of extracts of plants from the Malaysian rainforest. Antioxidants 2013, 2, 1–10. [Google Scholar]
  28. Sricharoen, P.; Techawongstein, S.; Chanthai, S. A high correlation indicating for an evaluation of antioxidant activity and total phenolics content of various chilli varieties. J. Food Sci. Technol. 2015, 52, 8077–8085. [Google Scholar] [CrossRef] [Scilit]
  29. Oney-Montalvo, J.E.; Avilés-Betanzos, K.A.; Ramírez-Rivera, E.d.J.; Ramírez-Sucre, M.O.; Rodríguez-Buenfil, I.M. Polyphenols content in Capsicum chinense fruits at different harvest times and their correlation with the antioxidant activity. Plants 2020, 9, 1394. [Google Scholar] [CrossRef] [Scilit]
  30. Khiya, Z.; Oualcadi, Y.; Gamar, A.; Berrekhis, F.; Zair, T.; Hilali, F.E. Correlation of total polyphenolic content with antioxidant activity of hydromethanolic extract and their fractions of the Salvia officinalis leaves from different regions of Morocco. J. Chem. 2021, 2021, 8585313. [Google Scholar] [CrossRef] [Scilit]
  31. Pazo-Cepeda, V.; Benito-Román, Ó.; Navarrete, A.; Alonso, E. Valorization of wheat bran: Ferulic acid recovery using pressurized aqueous ethanol solutions. Waste Biomass Valorization 2020, 11, 4701–4710. [Google Scholar] [CrossRef] [Scilit]
  32. Pazo-Cepeda, M.V.; Aspromonte, S.G.; Alonso, E. Extraction of ferulic acid and feruloylated arabinoxylo-oligosaccharides from wheat bran using pressurized hot water. Food Biosci. 2021, 44, 101374. [Google Scholar] [CrossRef] [Scilit]
  33. Svärd, A.; Brännvall, E.; Edlund, U. Rapeseed straw polymeric hemicelluloses obtained by extraction methods based on severity factor. Ind. Crops Prod. 2017, 95, 305–315. [Google Scholar] [CrossRef] [Scilit]
  34. Castillo-Rivas, A.; Álvarez-Mateos, P.; García-Martín, J.F. Revalorization of olive stones from olive pomace: Phenolic compounds obtained by microwave-assisted extraction. Agronomy 2025, 15, 1761. [Google Scholar] [CrossRef] [Scilit]
  35. Gómez-Cruz, I.; Cara, C.; Romero, I.; Castro, E.; Gullón, B. Valorisation of exhausted olive pomace by an eco-friendly solvent extraction process of natural antioxidants. Antioxidants 2020, 9, 1010. [Google Scholar] [CrossRef] [Scilit]
  36. Marđokić, A.; Maldonado, A.E.; Klosz, K.; Molnár, M.A.; Vatai, G.; Bánvölgyi, S. Optimization of conditions for microwave-assisted extraction of polyphenols from olive pomace of Žutica variety: Waste valorization approach. Antioxidants 2023, 12, 1175. [Google Scholar] [CrossRef] [Scilit]
  37. Macedo, G.A.; Barbosa, P.d.P.; Dias, F.F.; Crawford, L.M.; Wang, S.C.; Bell, J.M.D.M. Optimizing the integration of microwave processing and enzymatic extraction to produce polyphenol-rich extracts from olive pomace. Foods 2023, 12, 3754. [Google Scholar] [CrossRef] [Scilit]
  38. Pyrka, I.; Koutra, C.; Siderakis, V.; Stathopoulos, P.; Skaltsounis, A.-L.; Nenadis, N. Exploring the bioactive content of liquid waste and byproducts produced by two-phase olive mills in Laconia (Greece): Is there a prospect for added-value applications? Foods 2023, 12, 4421. [Google Scholar] [CrossRef] [Scilit]
  39. Orive, M.; Cebrián, M.; Amayra, J.; Zufia, J.; Bald, C. Integrated biorefinery process for olive pomace valorisation. Biomass Bioenergy 2021, 149, 106079. [Google Scholar] [CrossRef] [Scilit]
  40. Vergani, L.; Vecchione, G.; Baldini, F.; Voci, A.; Ferrari, P.F.; Aliakbarian, B.; Casazza, A.A.; Perego, P. Antioxidant and hepatoprotective potentials of phenolic compounds from olive pomace. Chem. Eng. Trans. 2016, 49, 475–480. [Google Scholar]
  41. Albahari, P.; Jug, M.; Radić, K.; Jurmanović, S.; Brnčić, M.; Brnčić, S.R.; Čepo, D.V. Characterization of olive pomace extract obtained by cyclodextrin-enhanced pulsed ultrasound assisted extraction. LWT 2018, 92, 22–31. [Google Scholar] [CrossRef] [Scilit]
  42. Guerboub, L.; Soufi-Maddi, O.; Ouldsaadi, L.; Bachir bey, M.; Medouni-Haroune, L.; Madani, K.; Boulekbache-Makhlouf, L. Ultra-turrax homogenization–assisted extraction of bioactive compounds from olive pomace using response surface methodology. Food Anal. Methods 2025, 18, 2198–2207. [Google Scholar] [CrossRef] [Scilit]
  43. Ribeiro, T.B.; Oliveira, A.L.; Costa, C.; Nunes, J.; Vicente, A.A.; Pintado, M. Total and sustainable valorisation of olive pomace using a fractionation approach. Appl. Sci. 2020, 10, 6785. [Google Scholar] [CrossRef] [Scilit]
  44. Expósito-Almellón, X.; Munguía-Ubierna, Á.; Duque-Soto, C.; Borrás-Linares, I.; Quirantes-Piné, R.; Lozano-Sánchez, J. Optimized ultrasound-assisted extraction for enhanced recovery of valuable phenolic compounds from olive by-products. Antioxidants 2025, 14, 938. [Google Scholar] [CrossRef] [Scilit]
  45. Andreou, V.; Psarianos, M.; Dimopoulos, G.; Tsimogiannis, D.; Taoukis, P. Effect of pulsed electric fields and high pressure on improved recovery of high-added-value compounds from olive pomace. J. Food Sci. 2020, 85, 1500–1512. [Google Scholar] [CrossRef] [Scilit]
  46. Cea Pavez, I.; Lozano-Sánchez, J.; Borrás-Linares, I.; Nuñez, H.; Robert, P.; Segura-Carretero, A. Obtaining an extract rich in phenolic compounds from olive pomace by pressurized liquid extraction. Molecules 2019, 24, 3108. [Google Scholar] [CrossRef] [Scilit] [PubMed]
  47. Cravotto, C.; Fabiano-Tixier, A.S.; Claux, O.; Rapinel, V.; Tomao, V.; Stathopoulos, P.; Skaltsounis, A.L.; Tabasso, S.; Jacques, L.; Chemat, F. Higher yield and polyphenol content in olive pomace extracts using 2-methyloxolane as bio-based solvent. Foods 2022, 11, 1357. [Google Scholar] [CrossRef] [Scilit]
  48. Zhao, H.; Avena-Bustillos, R.J.; Wang, S.C. Extraction, purification and in vitro antioxidant activity evaluation of phenolic compounds in California olive pomace. Foods 2022, 11, 174. [Google Scholar] [CrossRef] [Scilit] [PubMed]
Figure 1. Dried olive pomace in the form of pellets was used in this study.
Waste 04 00019 g001
Figure 2. Yield in total polyphenols (YTP) achieved using aqueous mixtures of various alcohols. All extractions were performed at 60 °C for 180 min. Bars designated with different letters (a–h) represent statistically different values (p < 0.05).
Waste 04 00019 g002
Figure 3. Yield in total polyphenols (YTP) achieved using 40% 2-propanol acidified either with sulfuric acid (SuAc) or hydrochloric acid (HCl). All extractions were performed at 60 °C for 180 min. Bars designated with different letters (a–e) represent statistically different values (p < 0.05).
Waste 04 00019 g003
Figure 4. Yield in total polyphenols (YTP) achieved using 40% 2-propanol acidified with variable concentrations of oxalic acid (OxAc). All extractions were performed at 60 °C for 180 min. Bars designated with different letters (a, b) represent statistically different values (p < 0.05).
Waste 04 00019 g004
Figure 5. Kinetics of total polyphenol extraction using 40% 2-propanol/10% OxAc.
Waste 04 00019 g005
Figure 6. Statistical analysis displaying the correlations between the yield and total polyphenols (YTP) and antiradical activity (AAR) with the extraction severity, represented by either the combined severity factor (CSF) or the alternative combined severity factor (CSF′). Numbers in blue color in the inset table “Correlations” are the corresponding r for each linear regression.
Waste 04 00019 g006
Figure 7. Contour plots displaying the simultaneous effect of variable X1 (T) and X2 (t) on the responses. (A) Total polyphenol yield (YTP); (B) antiradical activity (AAR).
Waste 04 00019 g007aWaste 04 00019 g007b
Figure 8. Chromatogram of the dOP extract obtained under optimized conditions (80 °C, 180 min). Monitoring of the eluent was accomplished at 340 nm. (A) Extract obtained with 40% isopropanol; (B) extract obtained with 40% isopropanol/10% oxalic acid.
Waste 04 00019 g008
Figure 9. Chromatogram of the dOP extract obtained under optimized conditions (80 °C, 180 min), with 10% oxalic acid (no isopropanol addition). Monitoring of the eluent was accomplished at 340 nm (A) and 280 nm (B).
Waste 04 00019 g009
Table 1. Coded and actual values for both process (independent) variables are considered for the experimental design and response surface methodology.
Treatment VariablesCodesCoded and Actual Variable Level
−101
T (°C)X1406080
t (min)X260120180
Table 2. Data derived from the extraction kinetics of polyphenols from dOP using 40% 2-propanol/10% OxAc as solvent system.
T
(°C)
k (×10−3)
(g mg−1 min−1)
t0.5
(min)
h
(mg g−1 min−1)
YTP(s)
(mg CAE g−1 DM)
407.596.33.3421.0 ± 0.9 a
6010.744.05.7323.1 ± 1.1 b
804.318.53.2427.4 ± 1.5 c
Values designated with different small letters (a, b, c) are statistically different (p < 0.05).
Table 3. Data presenting the severity values and the corresponding yield in total polyphenols and antiradical activity under various sets of residence time and temperature, used for the extraction of dOP. Extractions were performed with 40% 2-propanol/10% OxAc.
T (°C)t (min)CSFCSF′YTP
(mg CAE g−1 DM)
AAR
(μmol DPPH g−1 DM)
4060−0.586.4219.6 ± 0.1 a126 ± 4 a,b,c
120−0.286.7220.0 ± 0.2 b121 ± 5 a
180−0.106.9020.6 ± 0.4 b,c125 ± 3 a
60600.017.0120.9 ± 0.4 c130 ± 7 a,b,c
1200.317.3122.3 ± 0.1 d132 ± 2 b,c,d
1800.497.4922.5 ± 0.3 d,e132 ± 3 b,c,d
80600.607.6023.1 ± 0.4 e134 ± 5 c,d,e
1200.907.9025.3 ± 0.1 f139 ± 6 d,e
1801.088.0827.3 ± 0.1 g141 ± 3 e
Values marked with different small letters (a–g) are statistically different (p < 0.05).
Table 4. The design points used to build up the experimental design for the response surface methodology and the corresponding measured and predicted response values.
Design PointIndependent VariablesResponses
X1 (T, °C) X2 (t, min)YTP
(mg CAE g−1 DM)
AAR
(μmol DPPH g−1 DM)
MeasuredPredictedMeasuredPredicted
1−1 (40)−1 (60)19.619.7126.5125.3
21 (80)−1 (60)20.620.3124.7123.3
3−1 (40)1 (180)23.123.2133.7134.4
41 (80)1 (180)27.327.1140.8141.3
50 (60)−1 (60)20.020.3122.0124.6
60 (60)1 (180)25.325.4139.3138.2
7−1 (40)0 (120)20.920.8129.9130.4
81 (80)0 (120)22.523.1131.9132.9
90 (60)0 (120)22.322.2132.5132.0
100 (60)0 (120)21.922.2133.0132.0
110 (60)0 (120)22.922.2131.9132.0
Table 5. Extraction yields for the two major polyphenols of dOP, under optimized conditions, using different solvent systems.
CompoundYield (μg g−1 DM)
10% OxAc40% Isopropanol40% Isopropanol/10% OxAc
Hydroxytyrosol4629.7 ± 277.8 a158.6 ± 9.2 c242.1 ± 11.0 b
Luteolin10.7 ± 1.1 c159.7 ± 7.3 b178.6 ± 8.1 a
Sum4640.5318.3420.7
Values marked with different small letters (a–c) are statistically different (p < 0.05).
Disclaimer/Publisher’s Note: The statements, opinions and data contained in all publications are solely those of the individual author(s) and contributor(s) and not of MDPI and/or the editor(s). MDPI and/or the editor(s) disclaim responsibility for any injury to people or property resulting from any ideas, methods, instructions or products referred to in the content.