1. Introduction
Wetlands are among the most productive and biologically diverse ecosystems on Earth. They provide a wide range of ecological, economic, and sociocultural services that are fundamental for human wellbeing. Wetlands act as natural sponges that retain flood waters, replenish groundwater, stabilize coastlines, and mitigate climate change impacts [
1]. They also support rich biodiversity and provide resources for agriculture, fisheries, tourism and transportation [
2,
3]. However, wetlands around the world have been experiencing severe degradation and loss in recent decades due to factors like population growth, infrastructure development, pollution, overexploitation of resources, climate change and weak governance [
4,
5]. It is estimated that over 50% of specific types of wetlands have been lost since 1900 AD, with loss rates accelerating in recent years in Asia, Europe and America [
6]. This underscores the need for the regular monitoring and assessment of wetland vulnerabilities utilizing advanced geospatial technologies and analytical approaches [
7,
8,
9].
Remote sensing provides an important tool to study wetland ecosystems, which often spread across large and inaccessible areas. Optical and microwave satellite sensors have been widely used to map the extent of water bodies and delineate wetland boundaries [
10,
11]. Various spectral indices calculated from multispectral bands, such as the normalized difference water index (NDWI), have shown good accuracy for wetland mapping across diverse geographic regions [
12,
13,
14]. Satellite image timeseries have enabled the detection of changes in wetland areas over time in response to natural and anthropogenic factors [
15,
16]. However, remote sensing alone cannot identify the factors and processes driving wetland vulnerability. This requires the integration of geospatial data on topography, land use, hydrology, climate, population, etc., within a modeling framework [
11,
17,
18].
Machine learning has emerged as a useful technique for modeling complex ecological phenomena based on multivariate spatial data [
19,
20]. Algorithms like artificial neural networks, random forests and support vector machines have shown good performance for wetland mapping, change detection and vulnerability assessments in different parts of the world [
21,
22]. Machine learning models can handle non-linear relationships, high-dimensionality and uncertainty inherent in geospatial data. They provide predictive capabilities to estimate wetland risks under future environmental change scenarios [
23,
24]. Using Landsat image collections and random forest classification on Google Earth Engine, this research demonstrated an efficient methodology for mapping rice croplands across Sri Lanka [
25]. This showcases cloud computing capabilities for regional land use mapping. Mehravar et al. (2021) developed a 21-year drought index for Iran by integrating temperature, vegetation, soil moisture and precipitation data from multiple satellites on Google Earth Engine. This highlights the integration of multi-sensor data for drought monitoring [
26,
27].
Despite being a significant wetland ecosystem providing vital services, the spatiotemporal changes and vulnerabilities of Khinjhir Lake remain understudied compared to other major wetlands in the country. Most studies have focused on biodiversity, ethnobotany and water quality analysis, while a comprehensive geospatial and modeling assessment of various drivers of wetland vulnerability has not been undertaken. This research gap needs to be addressed considering the rising human pressures on Khinjhir Lake [
28,
29,
30,
31].
While previous studies have applied machine learning to assess wetland risks in specific regions like the Ganga Delta and Bangladesh using a limited set of factors, our work incorporates a wider array of natural and anthropogenic vulnerability drivers spanning climate, hydrological, land use, population, etc. The integrated analysis of multi-source spatiotemporal data covering several decades provides a long-term perspective on wetland change trajectories. The future vulnerability modeling enhances utility for conservation planning. Most importantly, we translate our findings into actionable and context-specific recommendations tailored to the study region, which few studies have addressed [
32].
This study incorporates a broader set of natural and anthropogenic factors spanning climate, hydrology, land use, population and other domains to model wetland vulnerability. The integrated analysis of multi-source spatiotemporal data covering several decades provides a long-term perspective on wetland change trajectories, which few existing studies have examined. Additionally, the development of predictive models for forecasting future wetland vulnerability enhances the utility of the research for conservation planning. Most importantly, based on the comprehensive assessment, we derive context-specific recommendations tailored to the Khinjhir Lake region to guide wetland management policies and practices. This addresses a key gap as most prior works have not translated findings into actionable recommendations for on-ground conservation efforts. In summary, the multi-faceted spatiotemporal assessment, future predictive modeling capabilities and formulation of targeted policy recommendations grounded in local context collectively constitute the novel contributions of this study [
33,
34].
This study aims to undertake an integrated spatiotemporal assessment of the multifaceted vulnerabilities shaping Khinjhir Lake, an ecologically vital wetland ecosystem in Pakistan. The analysis will utilize advanced geospatial and machine learning techniques to provide a nuanced understanding. The first objective is to examine changes in Khinjhir Lake over the past three decades through an analysis of multi-temporal satellite imagery. This will identify fluctuations in moisture conditions and wetland areas since the 1990s. Secondly, the study will compile and examine major natural and anthropogenic factors driving wetland vulnerability for the Khinjhir Lake region based on a literature review and spatial factor analysis. The third goal is to apply machine learning techniques to build predictive models capable of mapping present and projected future wetland vulnerability under various socio-environmental scenarios. The final objective is to translate the study’s findings into practical recommendations and conservation strategies which can inform sustainable management policies for Khinjhir Lake in the face of rising development pressures. Collectively, the multi-pronged analysis aims to showcase applications of emerging data science approaches in the evidence-based assessment, modelling and monitoring of threatened wetland ecosystems [
35,
36].
The novelty of the study lies in its integrated application of multi-temporal satellite data, GIS-based factor analysis and advanced machine learning algorithms to model the complex multifaceted vulnerabilities of Khinjhir Lake wetlands [
37,
38].
Recent advancements in remote sensing and machine learning have significantly improved our ability to assess wetland vulnerabilities, offering precise, scalable, and cost-effective methods for monitoring these critical ecosystems. Studies showcase the evolution of remote sensing technologies and methodologies, from traditional satellite imagery analysis to sophisticated machine learning algorithms for wetland classification and change detection [
39]. These advancements allow for the detailed mapping of wetland extents, health, and changes over time, providing essential data for conservation and management efforts. Despite these technological advancements, there remain significant knowledge gaps in our understanding of wetland dynamics and the factors driving their vulnerability. For instance, while recent studies have made strides in classifying and monitoring wetland areas, challenges persist in accurately quantifying and predicting changes due to climate variability, land use changes and human-induced pressures. Moreover, the integration of socio-economic factors into vulnerability assessments remains underexplored, which is critical for developing comprehensive management strategies that consider both ecological and human dimensions. Furthermore, the application of these advanced technologies in developing countries, where wetlands are often most at risk, is limited by factors such as data availability, technical expertise and financial resources. This highlights a critical gap in the global applicability of current methodologies and underscores the need for international cooperation and capacity building to ensure that advancements in remote sensing and machine learning benefit wetland conservation efforts worldwide [
40]. The machine learning models are expected to effectively map and predict wetland vulnerabilities based on analysis of diverse driving factors [
41,
42].
This research offers a holistic long-term perspective on wetland change assessments by harnessing multi-temporal satellite data spanning several decades. The analysis encompasses diverse vulnerability drivers including natural, anthropogenic, demographic and hydrological factors to enable an integrated evaluation. Advanced machine learning techniques such as artificial neural networks and random forests are applied to model the complex nonlinear relationships between these multifaceted pressures on wetland ecosystems. These algorithms also facilitate the predictive mapping of current and future wetland vulnerability scenarios to support informed conservation planning. Additionally, the study translates its findings into actionable and balanced policy recommendations on integrating wetland protection needs with sustainable regional development goals. This combination of cutting-edge data science approaches, breadth of vulnerability aspects examined, foresight offered by predictive modeling and linkage to on-ground management makes this research a comprehensive and forward-looking analysis aiming to further wetland conservation efforts. The multi-pronged methodology promises to provide novel insights to guide the preservation of threatened yet valuable wetland ecosystems like Khinjhir Lake [
43].
2. Methodology
2.1. Study Area
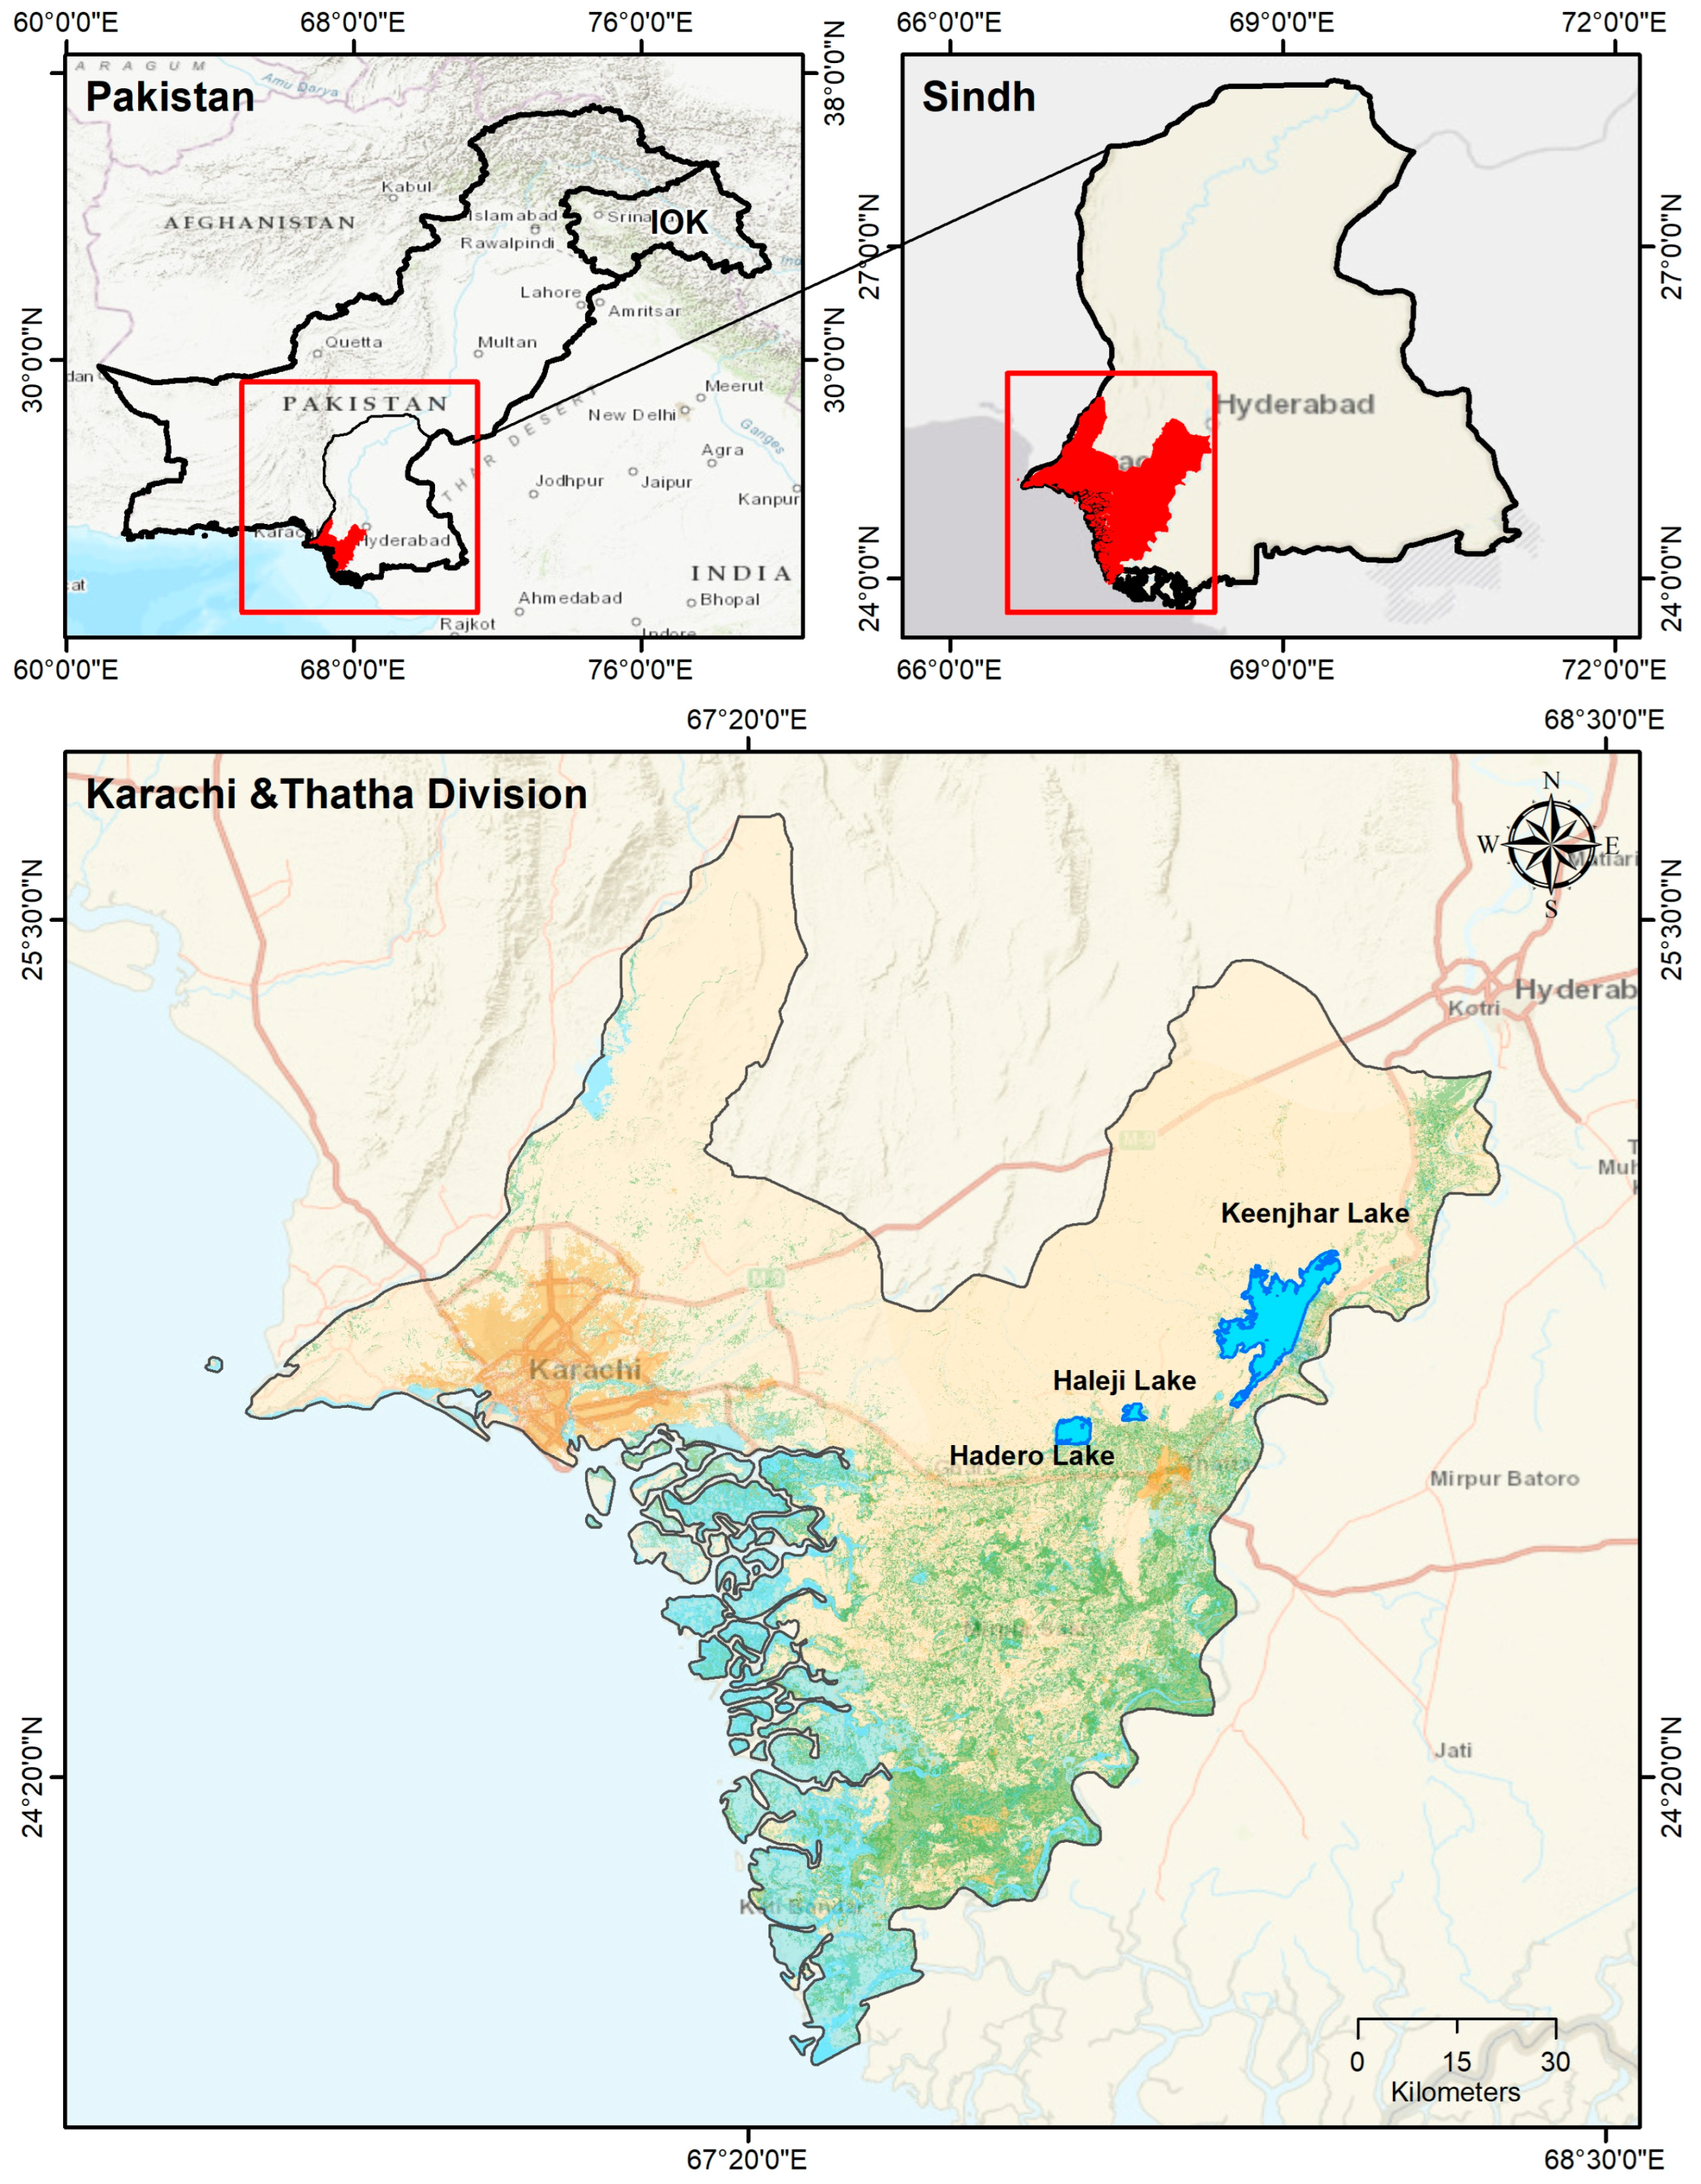
The study area centers on Khinjhir Lake, an extensive wetland ecosystem located in Thatta District within Sindh province, Pakistan. Khinjhir Lake originally spanned 50,000 acres, making it one of the largest natural wetlands in the country. However, its area has faced considerable shrinkage in recent decades due to factors like reduced water inflows, land conversion for agriculture, catchment degradation, etc.
Geographically, the wetland lies around 100 km from Karachi city and 25 km from the port town of Bhambore within the Thatta district. Khinjhir Lake is fed by the Kalri Baghar canal carrying flows diverted from the Indus River basin. The wetland supports freshwater marshes, reedbeds and shallow water bodies harboring diverse flora and fauna species. It delivers vital ecosystem services including water storage, flood control, groundwater recharge and nutrient retention to nearby rural communities and the Karachi metropolitan area [
44].
However, Khinjhir Lake has confronted growing environmental pressures stemming from swelling populations, uncontrolled deforestation, overfishing, pollution and unchecked infrastructures. This highlights the need for spatiotemporal monitoring and modeling to map the multidimensional vulnerabilities facing this significant wetland. The study area encompasses Khinjhir Lake wetlands and its catchment located across Thatta and Karachi divisions in Sindh province, Pakistan. The Thatta division covers an area of 17,355 km
2 in the lower Indus plain in southeastern Sindh and has a population of 1.8 million as of the 1998 census (
Figure 1).
2.2. Data Collection
This section outlines the comprehensive data collection process for the study of Khinjhir Lake wetland, covering various key components:
Multi-Temporal Satellite Imagery: To map changes in Khinjhir Lake over the last 20 years (from 2000 to 2020), multi-temporal satellite imagery will be acquired. This imagery will be sourced from the Landsat 5 TM, 7 ETM+ and 8 (OLI) missions with a 30 m spatial resolution and 16-day temporal frequency. Specifically, Thematic Mapper (TM) sensor imagery from Landsat 5 will be used for 2000, Enhanced Thematic Mapper Plus (ETM+) data from Landsat 7 for 2010 and Operational Land Imager (OLI) scenes from Landsat 8 for 2020. The images will undergo preprocessing including radiometric calibration, atmospheric correction and spatial smoothing beforehand. This imagery will be sourced from missions such as Landsat, ensuring at least 5 time points are covered spanning the 20-year period from 2000 to 2020. The use of optical sensors enables the examination of wetland changes over this extended 20-year period. The use of freely available Landsat data with a temporal resolution of 16 days facilitates the examination of gradual wetland changes over this extended 20-year period with multiple observations [
45].
Digital Elevation Model (DEM) and Derived Datasets: DEM data, including slope, aspect and flow accumulation, will be obtained to characterize basin topography and hydrological factors. The study will employ DEM data with a resolution of 30 m sourced from the Shuttle Radar Topography Mission (SRTM) operated by NASA. The global SRTM DEM provides consistent high-quality elevation data ideal for watershed-scale analysis. Aspect, slope and related drainage/hydrology layers will be derived from the base DEM to delineate important topographical features [
46].
Climate Data: Climate data encompassing variables such as rainfall, temperature and humidity will be acquired from meteorological stations situated in proximity to Khinjhir Lake. This will include 30 years of historical data from 1990 to 2020 sourced from meteorological survey organizations and public weather services in Pakistan. The dataset will provide insights into climate patterns and potential impacts of climate change on the wetland [
47].
Land Use/Land Cover (LULC) Maps: LULC maps for the years 2000, 2010 and 2020 will be collected to detect changes in land use patterns over time. These will be sourced from national land cover mapping projects using a standardized classification system encompassing major classes like settlements, vegetation, wetlands, water bodies and bare land. The geospatial LULC datasets will enable the analysis of the conversion of natural habitats for human uses and development [
48].
Census and Socioeconomic Data: Population statistics, socioeconomic data on settlements, agriculture, industries and other relevant factors will be acquired. This will include district-level census data for Thatta and Karachi divisions from the 1998 and 2017 national census exercises in Pakistan. Additionally, sub-district level statistics on demographics, land ownership, infrastructure, services and livelihood sources will be collected from recent provincial surveys to enable local-scale analysis [
49].
Infrastructure Mapping: The locations of settlements, roads, canals, drains and other infrastructure around the wetland will be mapped. This mapping enables the measurement of encroachment and the assessment of potential impacts on the wetland.
Random Forest (RF): Random forest is an ensemble learning method for classification, regression and other tasks that operates by constructing a multitude of decision trees at the training time. For classification tasks, the output of the random forest is the class selected by most trees. RF improves over a single decision tree by reducing overfitting and improving prediction accuracy through bagging (bootstrap aggregating) and feature randomness during tree splitting. It is particularly noted for its ability to handle large data sets with high dimensionality and its robustness to overfitting.
Classification and Regression Tree (CART): Classification and regression tree is a decision tree technique that can be used for both classification and regression tasks. The CART model splits the data into subsets based on feature value thresholds, which are chosen to minimize a cost function (like Gini impurity for classification or mean squared error for regression). The result is a binary tree where each node represents a feature in a decision rule, and each leaf node represents the outcome. CART models are easy to interpret and can handle both numerical and categorical data.
Artificial Neural Networks (ANNs): Artificial neural networks are computational models inspired by the human brain’s networks of neurons. They consist of input and output layers, as well as one or more hidden layers. Each neuron in one layer connects to neurons in the next layer with associated weights. ANNs are capable of learning complex patterns and relationships between input and output data through a process called backpropagation, where errors between predicted and actual outputs are used to adjust the weights. ANNs are widely used for pattern recognition, classification and forecasting problems.
This comprehensive data collection approach ensures that the study is underpinned by a wealth of information spanning multiple domains, providing a holistic understanding of the Khinjhir Lake wetland and the various factors affecting it [
50,
51].
The data utilized in this study were obtained from diverse sources to support the integrated analysis of the Khinjhir Lake wetland vulnerability. Multi-temporal Landsat satellite imagery (TM for 2000 and 2010; OLI for 2020) acquired from the United States Geological Survey (USGS) Earth Explorer platform enabled the examination of spatiotemporal changes in the wetland over the past two decades. LandScan population data were used to generate risk maps indicating population distribution and growth trends surrounding the wetland. Elevation data from the NASA Shuttle Radar Topography Mission (SRTM), along with derived aspect and topographic wetness index (TWI) layers, served as independent variables in the machine learning models to characterize basin topography and hydrological factors. Digital elevation model (DEM) data, including slope, aspect and flow accumulation, were obtained from the Shuttle Radar Topography Mission (SRTM) to characterize basin topography and hydrological factors. SRTM is a NASA mission that used radar interferometry to map land elevation across the globe with high resolution [
52]. Additional geospatial data layers such as distances from roads, built-up areas, vegetation and water bodies were generated through spatial analysis of various datasets including OpenStreetMap and land use/land cover maps. This array of geospatial datasets provided the necessary inputs for a holistic analysis of the diverse factors driving wetland vulnerability using advanced machine learning techniques (shown in
Table 1).
2.3. Wetland Change Analysis
In this section, we outline the methodology for assessing changes in the Khinjhir Lake wetland ecosystem over a 20-year period, from 2000 to 2020 [
53]. The following steps will be undertaken to ensure a comprehensive and accurate analysis:
Data Preprocessing: The satellite images from the selected time frames (2000, 2010 and 2020) will undergo a series of preprocessing steps. These steps include radiometric calibration to standardize sensor responses under various environmental conditions, atmospheric correction to eliminate atmospheric interference and image smoothing to reduce noise and enhance image clarity.
Spectral Water Indices Calculation: Spectral water indices, including the normalized difference water index (NDWI), the normalized difference vegetation index (NDVI) and modified normalized difference water index (MNDWI) will be computed using the multispectral bands of the satellite images. NDWI is an effective index for accentuating open water features while suppressing terrestrial signatures. However, previous studies have shown that modified NDWI (MNDWI) demonstrates a further reduction in built-up land noise and better delineation of water bodies compared to NDWI. This is achieved by replacing the NIR band with a SWIR band, which enhances the separation of land and water features. Therefore, MNDWI will also be included along with NDWI to provide improved accuracy in extracting wetland boundaries from surrounding built structures.
Post-Classification Change Analysis: In the final phase of the analysis, a post-classification change assessment will be carried out to estimate changes in wetland areas over the 20-year period. Wetland boundaries for each of the selected time points will be meticulously extracted from the satellite imagery preprocessed on the Google Earth Engine platform. Specifically, the raw satellite images will be preprocessed by applying radiometric calibration, atmospheric correction and image smoothing to standardize responses, remove noise and enhance visual interpretability. Using geographic information systems (GISs), the areas of these delineated wetland regions derived from the preprocessed Google Earth Engine images will be computed. This data will serve as the foundation for generating comprehensive change statistics, providing valuable insights into the evolving nature of the Khinjhir Lake wetland over the study period.
2.4. Identification of Vulnerability Factors
In this section, we detail the methodology for identifying and analyzing the vulnerability factors affecting the Khinjhir Lake wetland. The approach includes the following steps: an in-depth literature review will be conducted to compile and shortlist key natural and anthropogenic factors that have been identified in previous studies as drivers of wetland vulnerability in the study area. This review will encompass research conducted on Khinjhir Lake as well as other regional wetlands, providing a comprehensive foundation for understanding the factors at play [
1,
54].
GIS-Based Proximity and Density Mapping: Spatial datasets containing information on various factors such as settlements, roads, canals and agricultural fields will be used to create proximity and density maps. The mapping process involves the calculation of Euclidean distances and kernel densities around the wetland boundary. These maps will aid in visualizing the spatial distribution and intensity of these factors in the vicinity of Khinjhir Lake.
Spatial Correlation Analysis: To uncover the relationships between spatiotemporal wetland changes and the identified vulnerability factors, spatial correlation analysis will be undertaken. This analysis will employ appropriate statistical techniques to assess the degree and significance of these relationships. By evaluating these correlations, we will select the most influential variables for further modeling.
This methodical approach ensures a comprehensive understanding of the factors contributing to wetland vulnerability in the Khinjhir Lake area. It combines a thorough literature review with spatial analysis techniques, allowing us to identify, map and statistically assess the potential drivers of vulnerability in the study area.
2.5. Machine Learning Modeling
This section outlines the methodology for the development of multivariate vulnerability models to assess the Khinjhir Lake wetland’s vulnerability. The approach encompasses the following key steps:
Selection of Advanced Algorithms: Multivariate vulnerability models will be constructed utilizing advanced machine learning algorithms tailored for spatial modeling. Specifically, we will employ artificial neural networks implemented through QGIS and SMILE CART through Google Earth Engine. These algorithms have been chosen for their suitability in handling complex spatial data and modeling intricate relationships.
Input Layers for Models: The input layers for the vulnerability models will consist of major natural and anthropogenic factors identified through the spatial analysis and the extensive literature review conducted in earlier sections. These factors serve as critical variables for modeling the wetland’s vulnerability.
Training and Testing Datasets: Training and testing datasets will be prepared in the vector format, derived from the wetland change analysis. The target variable in these datasets is wetland vulnerability, categorized into classes such as low, moderate and high levels of vulnerability. The output layer of the machine learning models aims to predict these wetland vulnerability categories for each location based on the input variables representing driving factors [
55]. These datasets are instrumental in training and validating the machine learning models. They enable the models to learn and generalize patterns while ensuring a robust model performance.
Model Training and Optimization: The machine learning models will undergo a systematic training process, following standard procedures such as k-fold cross-validation. This helps evaluate the models’ performance and ensures their robustness. Key parameters will be optimized to enhance model accuracy and predictive capabilities [
56].
Mapping Current and Future Vulnerability: Using the trained machine learning models, we will map the current and future vulnerability across the entire Khinjhir Lake wetland study area [
57]. The models’ predictions will enable us to create comprehensive vulnerability maps, offering insights into the wetland’s current status and future prospects in terms of vulnerability.
This methodology represents a rigorous approach to modeling wetland vulnerability, employing advanced machine learning techniques and utilizing carefully selected input variables. The resultant vulnerability maps will provide valuable information for the assessment and management of Khinjhir Lake’s ecosystem.
2.6. Model Validation and Accuracy Assessment
In this section, we outline the methodology for validating and assessing the accuracy of the vulnerability models developed for Khinjhir Lake wetland:
Rigorous Accuracy Assessment: A comprehensive accuracy assessment is conducted, employing established statistical metrics such as overall accuracy, kappa coefficient, root mean square error (RMSE), mean absolute error (MAE) and R-squared (R2). Overall accuracy and kappa coefficient assess the models’ correct classification rates and agreement with the reference data. RMSE and MAE evaluate the models’ prediction errors. R-squared will measure how well the models explain variance in the vulnerability data. These metrics provide a quantitative evaluation of the different aspects of the models’ performance, ensuring rigorous and reliable assessments of the vulnerability mapping results [
58,
59].
Selection of Best Performing Model: Based on the accuracy metrics, the best performing model will be identified. The model that demonstrates the highest accuracy and precision in vulnerability prediction will be chosen for the final vulnerability mapping process. This selection ensures that the mapping results are built on the most robust and accurate model.
Field Validation and Expert Consultations: To further validate the model outputs, field visits to Khinjhir Lake will be carried out. These visits will provide a real-world comparison of the model predictions with the actual conditions on the ground. Additionally, consultations with local experts who possess intimate knowledge of the Khinjhir wetland will be conducted. Their insights and expertise will contribute to the validation process and provide valuable feedback to refine the models.
This methodology ensures a thorough evaluation of the vulnerability models’ accuracy and reliability, incorporating both quantitative metrics and on-the-ground verification through field visits and expert consultations. The combined approach enhances the robustness of the vulnerability mapping process and bolsters the credibility of the study’s findings.
2.7. Recommendations for Wetland Conservation
In this section, we present the methodology for deriving recommendations to guide the conservation of Khinjhir Lake wetland:
Thorough Data Analysis: The study’s findings will undergo a comprehensive analysis to yield specific and actionable recommendations for the monitoring, management and conservation of the wetland. This analysis will synthesize the results of the vulnerability models and the identified drivers of vulnerability, providing a basis for informed decision making [
60].
Development of Conservation Strategies: Based on the major natural and anthropogenic drivers of wetland vulnerability identified in the study area, we will propose strategies to mitigate their impact. These strategies will be designed to address the root causes of vulnerability and safeguard the ecological and socio-economic values of the Khinjhir Lake wetland [
61].
Integration into Regional Development Planning: Concrete actions will be suggested to ensure that wetland protection needs are effectively integrated into regional development planning and policymaking processes. This integration will extend to sectors such as water management, agriculture and tourism. By aligning wetland conservation with broader regional development goals, we aim to strike a balance between environmental protection and sustainable development.
This methodology ensures that the study’s findings are translated into practical recommendations that can inform conservation efforts and contribute to the sustainable management of the Khinjhir Lake wetland. The recommendations will be based on a holistic understanding of the wetland’s vulnerability factors and their broader implications for the region.
2.8. LandScan Population Data
Multi-temporal LandScan population data will be sourced for the specified years, namely 2000, 2010 and 2020. LandScan data offer global gridded population distribution information derived through advanced spatial modeling and data integration techniques, ensuring comprehensive and accurate coverage [
62,
63].
The Utilization of LandScan Data: the LandScan population data will serve various purposes within the study, including:
The examination of Population Trends: The data will be employed to assess population trends in the catchment area of Khinjhir Lake over the past two decades. This analysis will provide insights into how the human population in the vicinity of the wetland has evolved. Population Density Mapping: Population density maps will be generated using LandScan data to pinpoint populated areas and identify growth hotspots. These maps are essential for visualizing the distribution and intensity of human settlements in the region. Proximity Analysis: Proximity analysis will be conducted to evaluate the spatial relationships between settlements and the wetland boundary. This analysis will help identify areas where settlements exert the most pressure on the wetland. Incorporation into Machine Learning Models: The LandScan population data will be integrated as an input variable in the machine learning models used for the vulnerability assessment of Khinjhir Lake wetland. This inclusion will enable a more comprehensive analysis of the factors contributing to wetland vulnerability.
This methodology harnesses the power of LandScan population data to provide valuable insights into population dynamics and settlement expansion pressures in the study area. The data integration and analysis will enhance our understanding of the interaction between human activities and wetland vulnerability.
3. Results
3.1. Accuracy Assessment
Table 2 shows the random forest (RF) model demonstrated higher overall accuracy, with an average of 89.48% across the three tested years (2000, 2010, 2020), compared to 86.70% for SMILE CART (classification and regression tree) using Google Earth Engine. Similarly, the RF model achieved higher average kappa accuracy of 85.98% versus 82.27% for SMILE CART. The user’s accuracy indicates the reliability of the land cover class assignments made by the model. The RF model attained an average user’s accuracy of 89.72% across the three years, while SMILE CART had an average of 86.70%. The producer’s accuracy evaluates how well the reference wetland classes are classified by the model. Again, the RF model performed better with an average producer’s accuracy of 89.52% compared to 86.71% for SMILE CART. In summary, the random forest model outperformed SMILE CART in terms of overall accuracy, kappa accuracy, user’s accuracy and producer’s accuracy. The RF model achieved an average overall accuracy approximately 3% higher than SMILE CART. This indicates that the random forest algorithm was more effective at modeling and mapping the wetland vulnerability for the Khinjhir Lake study area. Based on these accuracy assessment results, the random forest model is the recommended choice for generating the final wetland vulnerability maps [
64]. The ANN model achieved the highest overall accuracy of 91.2%, outperforming both RF and CART models. This superior performance suggests ANN’s strength in handling the complex nonlinear relationships in the wetland vulnerability modeling. The ANN’s ability to model complex data interdependencies results in greater accuracy compared to the tree-based RF and CART approaches [
65].
The accuracy assessment incorporates key metrics, including
Overall accuracy: percentage of correctly classified samples;
Kappa coefficient: metric accounting for chance agreement;
Producer’s accuracy: percentage of reference samples correctly classified;
User’s accuracy: percentage of classified samples that match reference.
3.2. Land Use/Land Cover (LULC)
The extensive land use and land cover (LULC) analysis undertaken in this study utilizing two advanced machine learning algorithms RF and SMILE CART revealed intriguing and notable changes in the distribution and proportions of major land cover classes surrounding the ecologically vital Khinjhir Lake wetlands between 2000 and 2020.
Specifically, the RF model, which demonstrated higher overall accuracy in the model evaluation, showed a substantial decrease of 8.7% (995.3 km
2) in barren land from 2000 to 2010. This indicates a reduction in unvegetated, exposed soil surfaces around the wetland, likely attributable to climate change factors such as increased precipitation leading to expansion in vegetative cover, as well as anthropogenic reforestation efforts in the region. Concurrently, over the same 2000 to 2010 period, vegetation cover increased markedly by 7.8% (899.1 km
2) as estimated by the RF model, confirming the proliferation of woodlands, shrublands, grasslands and other vegetated areas. Additionally, the RF model detected a 1.2% (136.1 km
2) reduction in water body extent from 2010 to 2020, implying declining water availability and the shrinking of Khinjhir Lake over this more recent decade. This decade witnessed droughts and water diversions for agriculture and development, presenting risks for the wetland ecosystem. The CART model showed similar patterns as RF, with barren land declining substantially by 9% (1034.2 km
2) from 2000 to 2010 and vegetation cover increasing notably by 6.8% (780 km
2). From 2010 to 2020, the CART model also indicated a 1.2% (134.5 km
2) decrease in water bodies, corroborating the drying trends [
41,
42,
66,
67].
The built-up area exhibited a steady rise based on both models over the 20-year study period, increasing from 2% in 2000 to 4% in 2020. This signals escalating urbanization pressures around Khinjhir Lake, with a greater encroachment of human settlements. The RF model, which produced higher accuracy metrics, estimated a 1.1% and 0.9% rise in the built-up area from 2000 to 2010 and 2010 to 2020, respectively [
68]. The CART model calculated a 1.1% and 0.8% increase in built-up proportions over the corresponding periods. The extensive LULC analysis provides crucial insights into land cover modifications around the ecologically important Khinjhir Lake wetland over the past two decades, highlighting the proliferation of vegetation between 2000 and 2010, declining water availability from 2010 to 2020 and steady urbanization over the 20-year study period. As the RF model attained higher accuracy, it can be inferred as showing the most reliable LULC change trends for the region. The LULC dynamics elucidate the multiple anthropogenic and climatic pressures confronting Khinjhir Lake wetlands and their ecosystems, as shown in
Figure 2 [
69].
The rapid population growth revealed by the LandScan data analysis has clear implications on the land use and land cover modifications surrounding Khinjhir Lake wetland. The 29 million increase in regional population from 11 million to 29 million between 2000 and 2020 aligns closely with the doubling of the built-up area from 2% to 4% over the same period as estimated by the random forest LULC classification model [
70,
71]. This significant population influx and associated development activities contribute to urban expansion into wetland areas, as evidenced by the steady rise in the built-up land cover class. Furthermore, the increasing anthropogenic pressures from increasing populations and settlements potentially exacerbate other threats like pollution, resource exploitation, fragmentation and hydrological alterations facing Khinjhir Lake. Integrating the analysis of demographic and land use changes provides a more holistic understanding of the coupled natural and human factors driving wetland vulnerability in the region [
72].
3.3. Risk Inventory Zone Map of Wetland
An extensive inventory risk zone mapping analysis was undertaken to delineate vulnerability levels across Khinjhir Lake wetlands using a robust weighted summation approach incorporating two key criteria—proximity to historical wetland loss areas and population distribution intensity. These criteria represent major anthropogenic threats confronting the wetlands based on prior research.
The equation calculates a total score or index that reflects the cumulative impact of various factors on the wetland, with each factor’s influence weighted by its importance. This weighted sum provides a comprehensive assessment of the wetland’s condition or vulnerability, taking into account multiple aspects and their respective significance.
The normalized distance from documented wetland loss sites and the population density grid were integrated as input layers into the weighted overlay analysis. Given their comparable influence in driving wetland vulnerability, as established through spatial correlation analysis, these inputs were assigned equal weights of 1 in the weighted summation.
The resultant inventory risk index values computed for each pixel were classified using Jenks natural breaks optimization into five risk zones, namely—very low, low, moderate, high and very high. Wetlands falling in the very high-risk category, with an index ranging from 1.17 to 1.37, are in close proximity to locations where notable wetland loss occurred over the past few decades as well as areas with dense human habitation, signifying higher vulnerability. The moderate risk zone, spanning index values from 0.37 to 1.07, covers wetlands farther from historical wetland loss sites but still experiencing substantial population pressures (
Figure 3) [
73].
Wetland areas designated as very low risk, with index from 0 to 0.10, are situated farther away from prior wetland loss locations and have sparse local populations, implying lower vulnerability. This inventory risk zoning enables targeted management planning by delineating priority wetlands needing mitigation measures based on the spatial distribution of two key anthropogenic threats—proximity to historical wetland loss and population intensity. It provides a valuable visualization tool for conservation decision making [
74].
3.4. Transition of Wetland
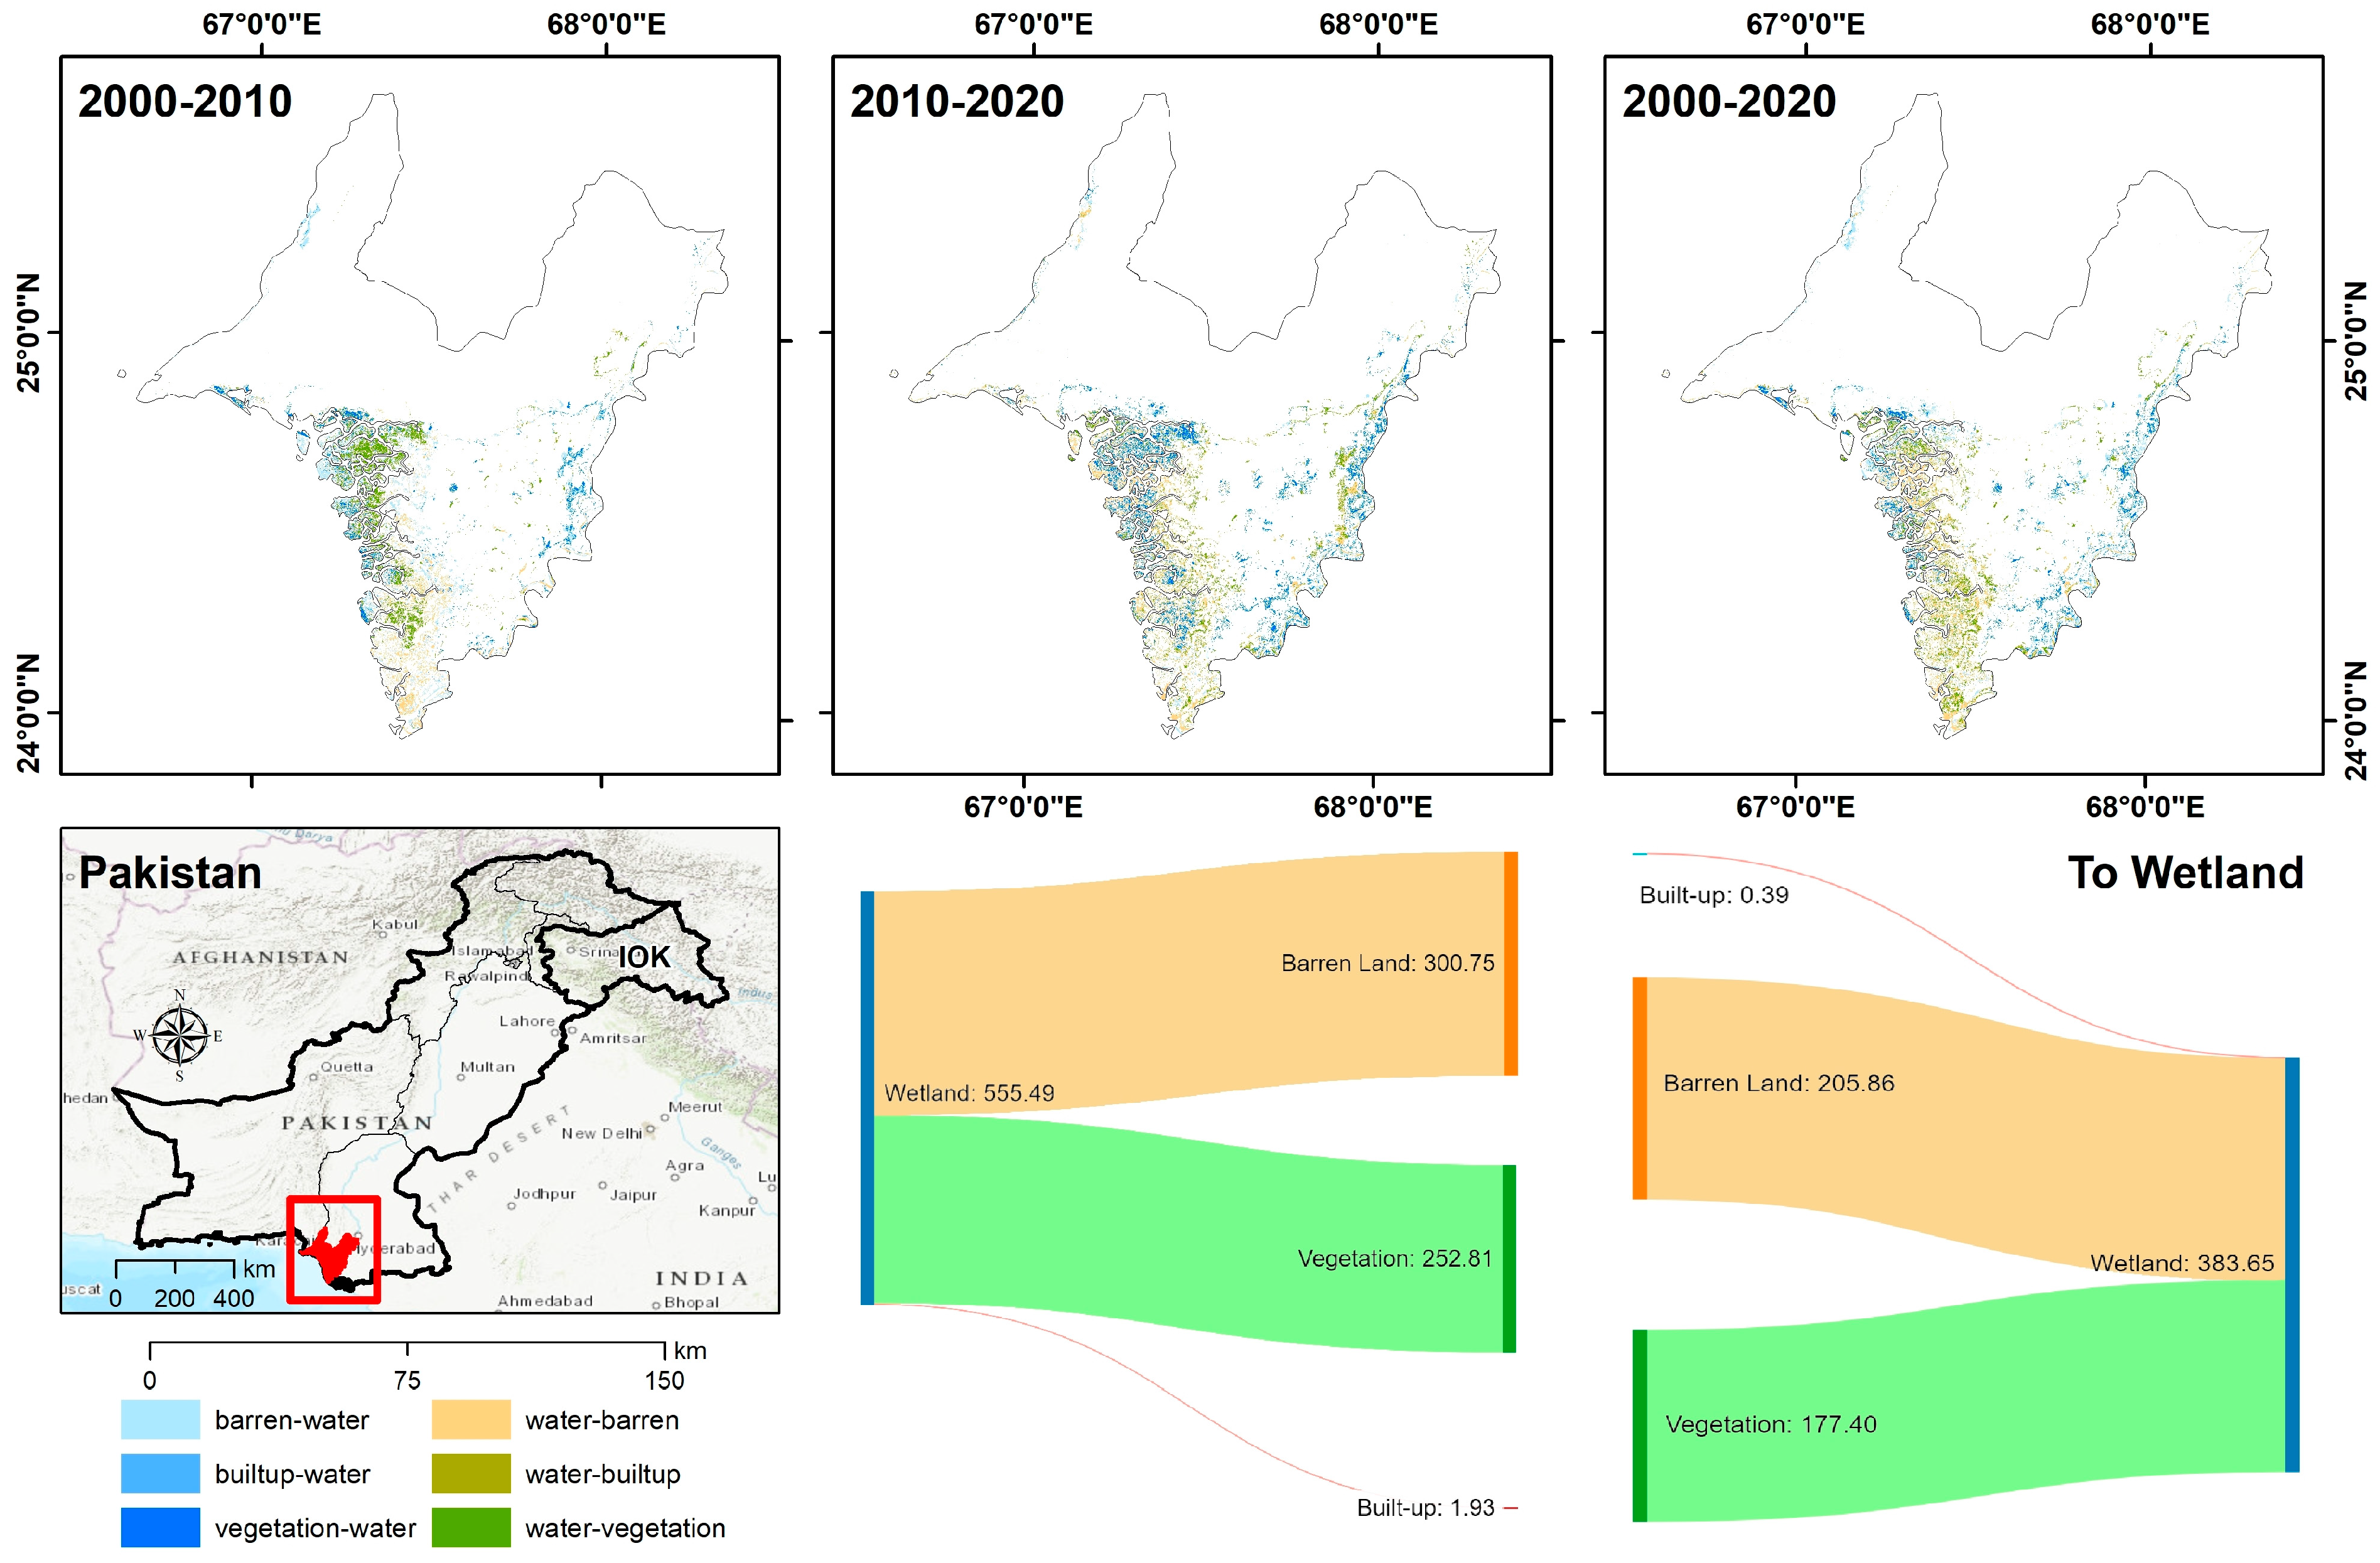
The extensive wetland changes detection analysis revealed substantial transitions between wetlands and other major land cover classes including barren land, vegetation and built-up surrounding Khinjhir Lake wetlands from 2000 to 2020, as shown in
Figure 4.
Specifically, 205.86 sq km of barren land and 177.4 sq km of vegetation cover converted into wetland over this period. This indicates a considerable expansion of wetlands into previously non-vegetated bare lands and former forested/shrublands, likely due to increased precipitation and rising water tables enabling the growth of marshy habitats. In the opposite direction, 300.75 sq km of wetland transitioned to barren land, while 252.81 sq km changed from wetland to vegetation cover. Additionally, a small area of 0.39 sq km converted from built-up into wetland cover, illustrating wetland regeneration into formerly built-up paved regions. Meanwhile, only 1.93 sq km shifted from wetland into built-up between 2000 and 2020. The overall area transitioning into wetland amounted to 383.65 sq km, lower than the 555.49 sq km that shifted from wetland to other land classes. In summary, the table reveals predominant transitions into wetland from barren and vegetated surfaces, highlighting wetland expansion mainly occurring in formerly non-vegetated bare lands. It also quantifies the minor exchanges between wetlands and built-up impervious surfaces in the landscape surrounding Khinjhir Lake [
75,
76].
3.5. Wetland Change
The wetland change analysis summarized in
Table 3 reveals that from 2000 to 2010, the wetland loss of 421.55 sq km exceeded the gain of 385.79 sq km, indicating a net decline in wetland cover during this initial decade. However, a reversing trend was seen from 2010 to 2020, wherein wetland gain amounted to 410.35 sq km, higher than the loss of 546.43 sq km. This reversal signifies wetland regeneration outweighed loss in the latter decade, which could be attributed to increased conservation efforts in the region. But, over the entire 20-year period from 2000 to 2020, the cumulative wetland loss of 555.51 sq km far surpassed the cumulative gain of 383.66 km
2, implying a steady long-term deterioration. The analysis also found substantial unchanged wetland area between the time points—877.43 km
2 persisted from 2000 to 2010, while 716.79 km
2 remained stable from 2010 to 2020. This demonstrates ecological resilience, where significant wetland ecosystems endured despite some losses. In summary,
Table 3 provides a nuanced picture of wetland change trends surrounding Khinjhir Lake—while wetland suffered initial declines from 2000 to 2010, regenerative processes exceeded loss in the following decade, but the overriding long-term trend remains one of cumulative loss amid some resilience, as shown in
Figure 5 [
73].
3.6. Vulnerability Map
Wetland vulnerability was categorized into distinct zones ranging from very low to very high based on the comprehensive machine learning modeling process utilized in this study. As enumerated in the table, wetland areas with a modeled vulnerability index of 0 to 0.06 represent very low vulnerability, implying minimal risk and impacts. The low vulnerability zone, with index values from 0.06 to 0.17, represents wetlands facing some risks but are still relatively resilient. Moderate vulnerability wetlands, with index values of 0.17 to 0.38, experience noticeable risks necessitating management interventions. Wetlands classified as high vulnerability, with an index ranging from 0.38 to 1.05, face substantial threats and degradation pressures requiring mitigation actions. Finally, the very high vulnerability zone, spanning index values of 1.05 to 1.14, denotes wetlands confronting severe, immediate risks, signaling the highest priority for conservation and restoration. This zoning provides a spatial delineation of modeled vulnerability levels across Khinjhir Lake wetlands based on the myriad natural and anthropogenic pressures influencing the ecosystems. The map enables targeted, zone-specific planning and implementation of wetland management practices based on the modeled vulnerability shown in
Figure 6 [
29,
77].
3.7. Indices Results
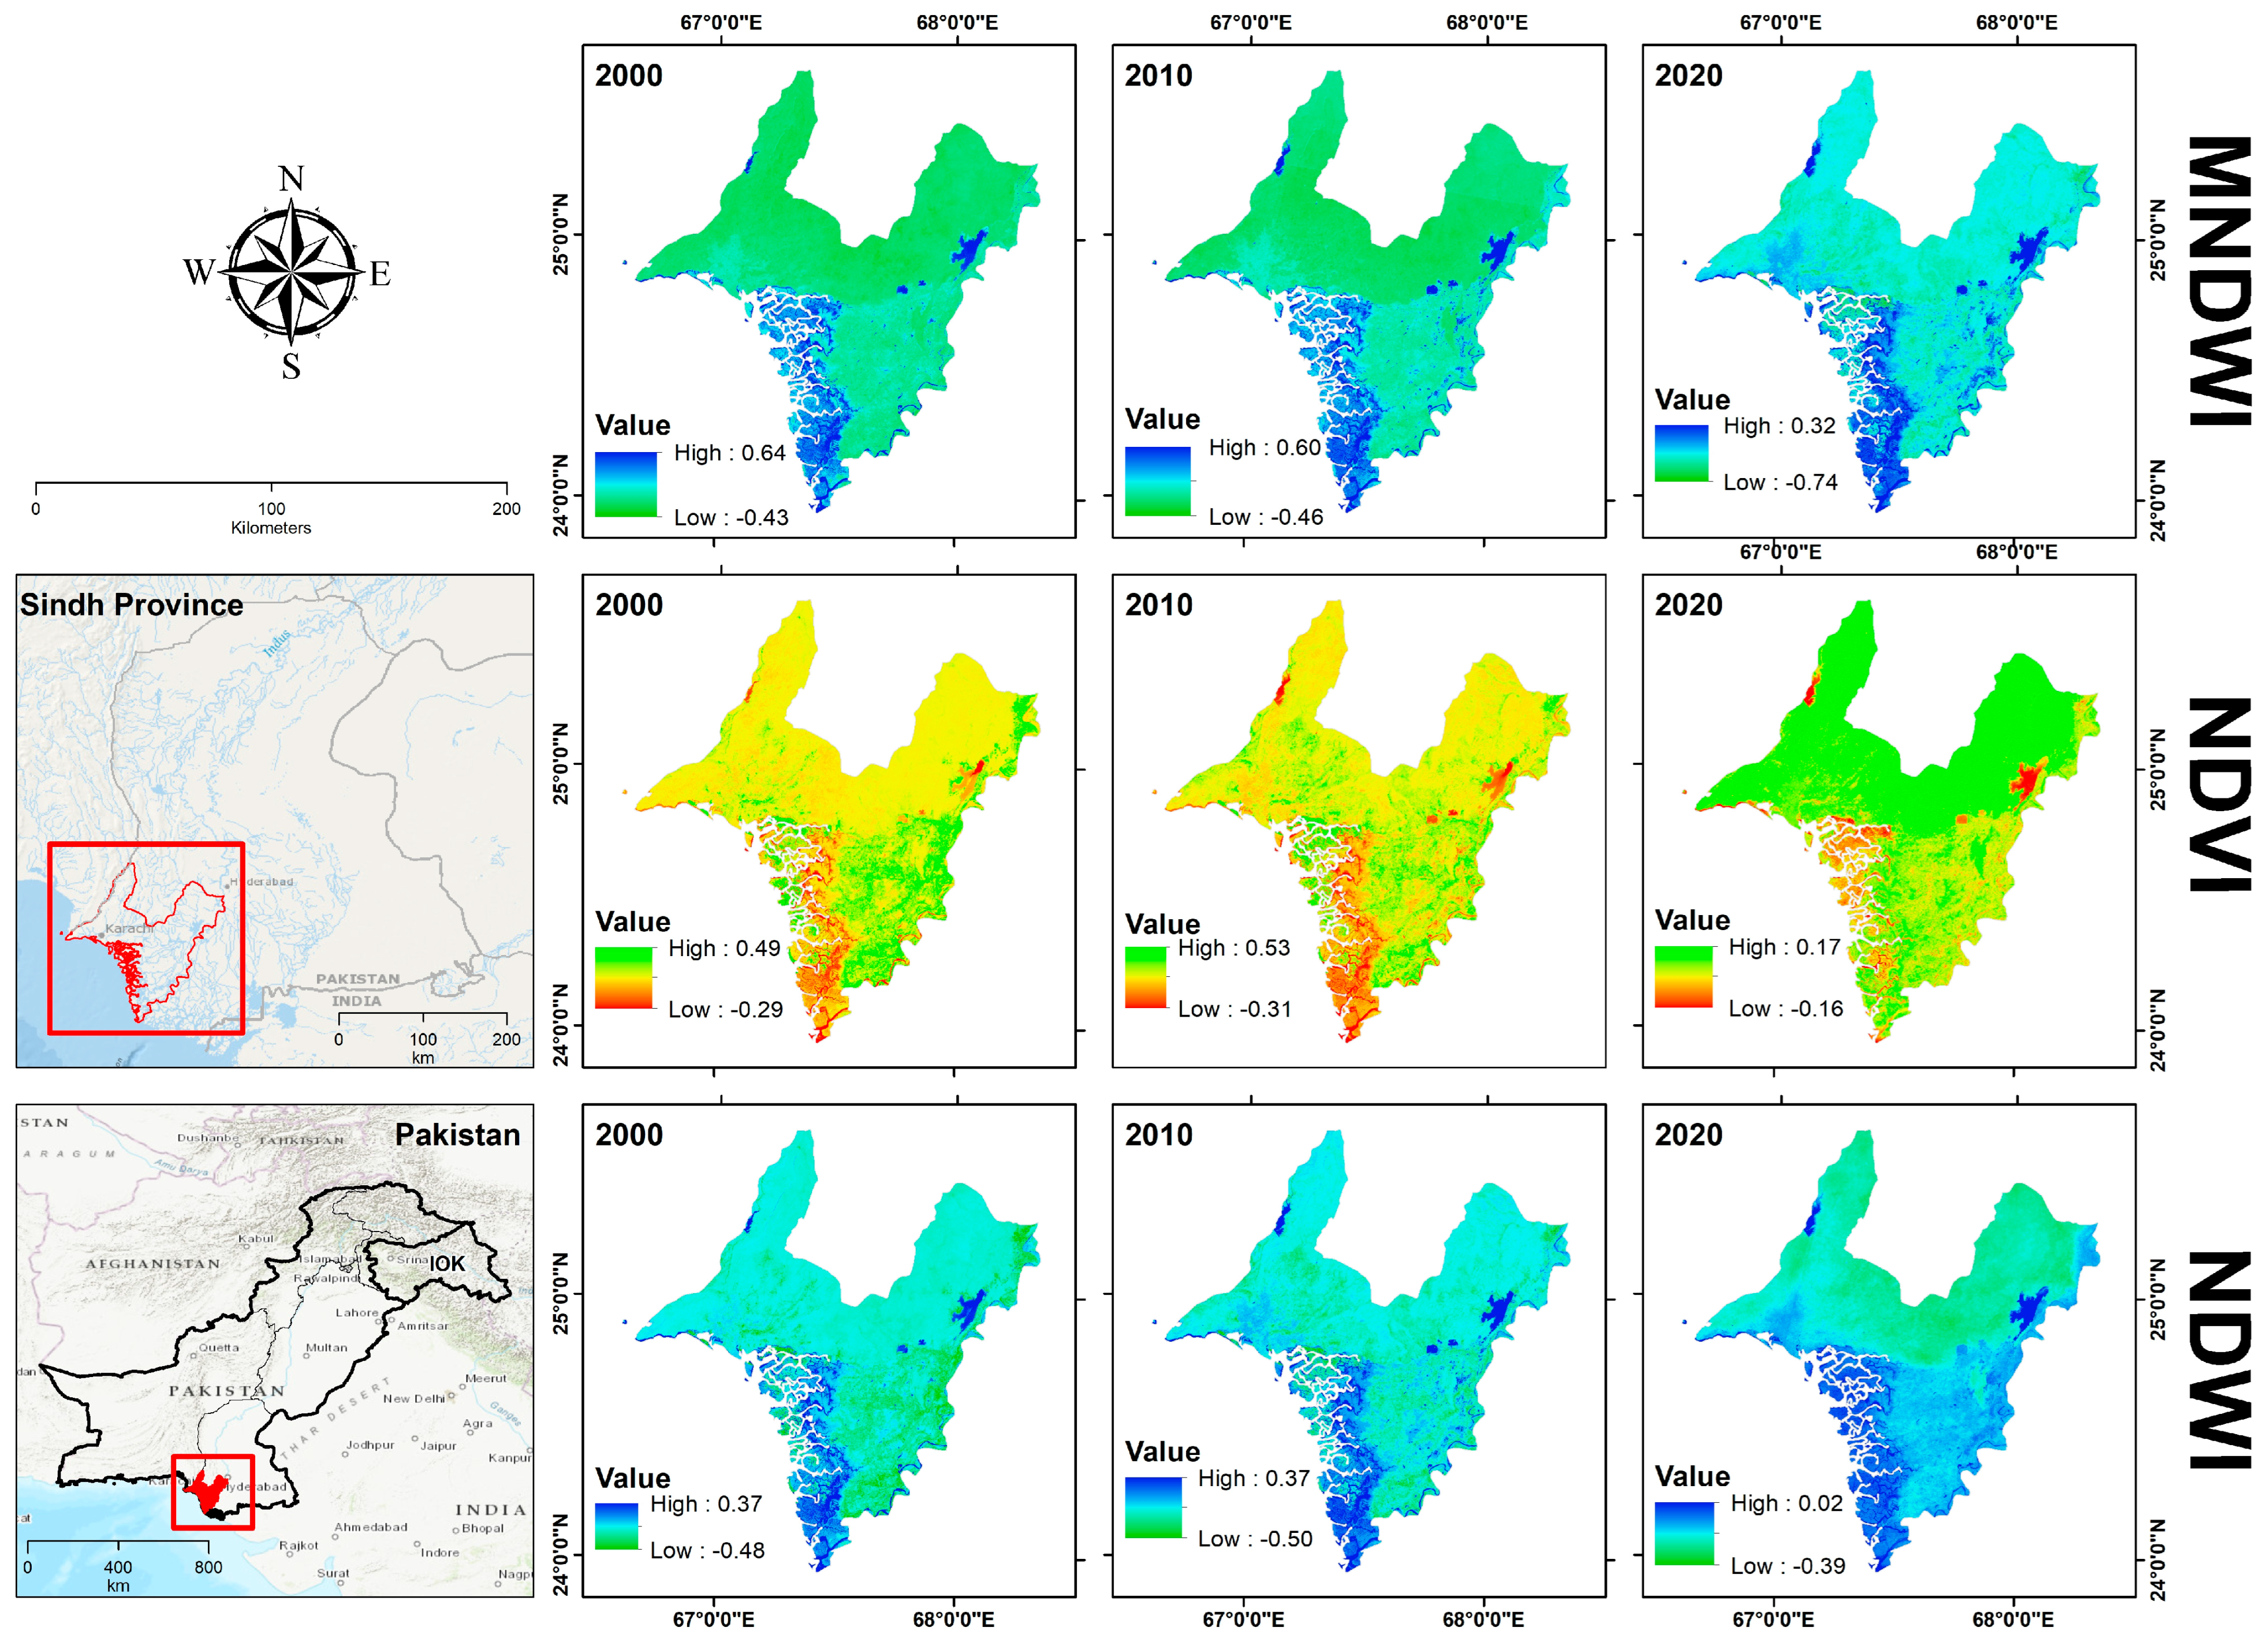
The spectral water and vegetation indices calculated from the multi-temporal satellite imagery provided insights into the surface moisture and vegetative vigor dynamics surrounding Khinjhir Lake wetlands between 2000 and 2020. MNDWI exhibited decreasing upper range values from 0.64 in 2000 to 0.32 in 2020, indicating declining surface water extents over the analysis period. This aligns with the shrinkage in open water areas of the lake detected through the change analysis. The lower MNDWI bounds also reduced over time, implying the loss of even marginal surface moisture in parts of the wetland. For the NDVI, the maximum values showed a slight increasing trend from 0.49 in 2000 to 0.53 in 2010, suggesting some expansion in dense, healthy vegetation like reedbeds. However, by 2020, the upper NDVI limit had declined markedly to 0.17, reflecting fading vegetation vigor, especially in the past decade. The NDWI demonstrated a similar reducing trend in its upper bounds from 0.37 in 2000 to just 0.02 in 2020, indicating deteriorating surface and soil moisture conditions facilitating vegetation growth in the wetlands. Overall, the spectral indices quantification corroborates the pattern of initial wetland expansion in the early period followed by degradation in the last decade observed through the change analysis. The indices provide additional evidence on the trajectory of moisture and vegetation changes surrounding Khinjhir Lake shown in
Figure 7 [
11,
78,
79].
3.8. Topographic Wetness Index (TWI)
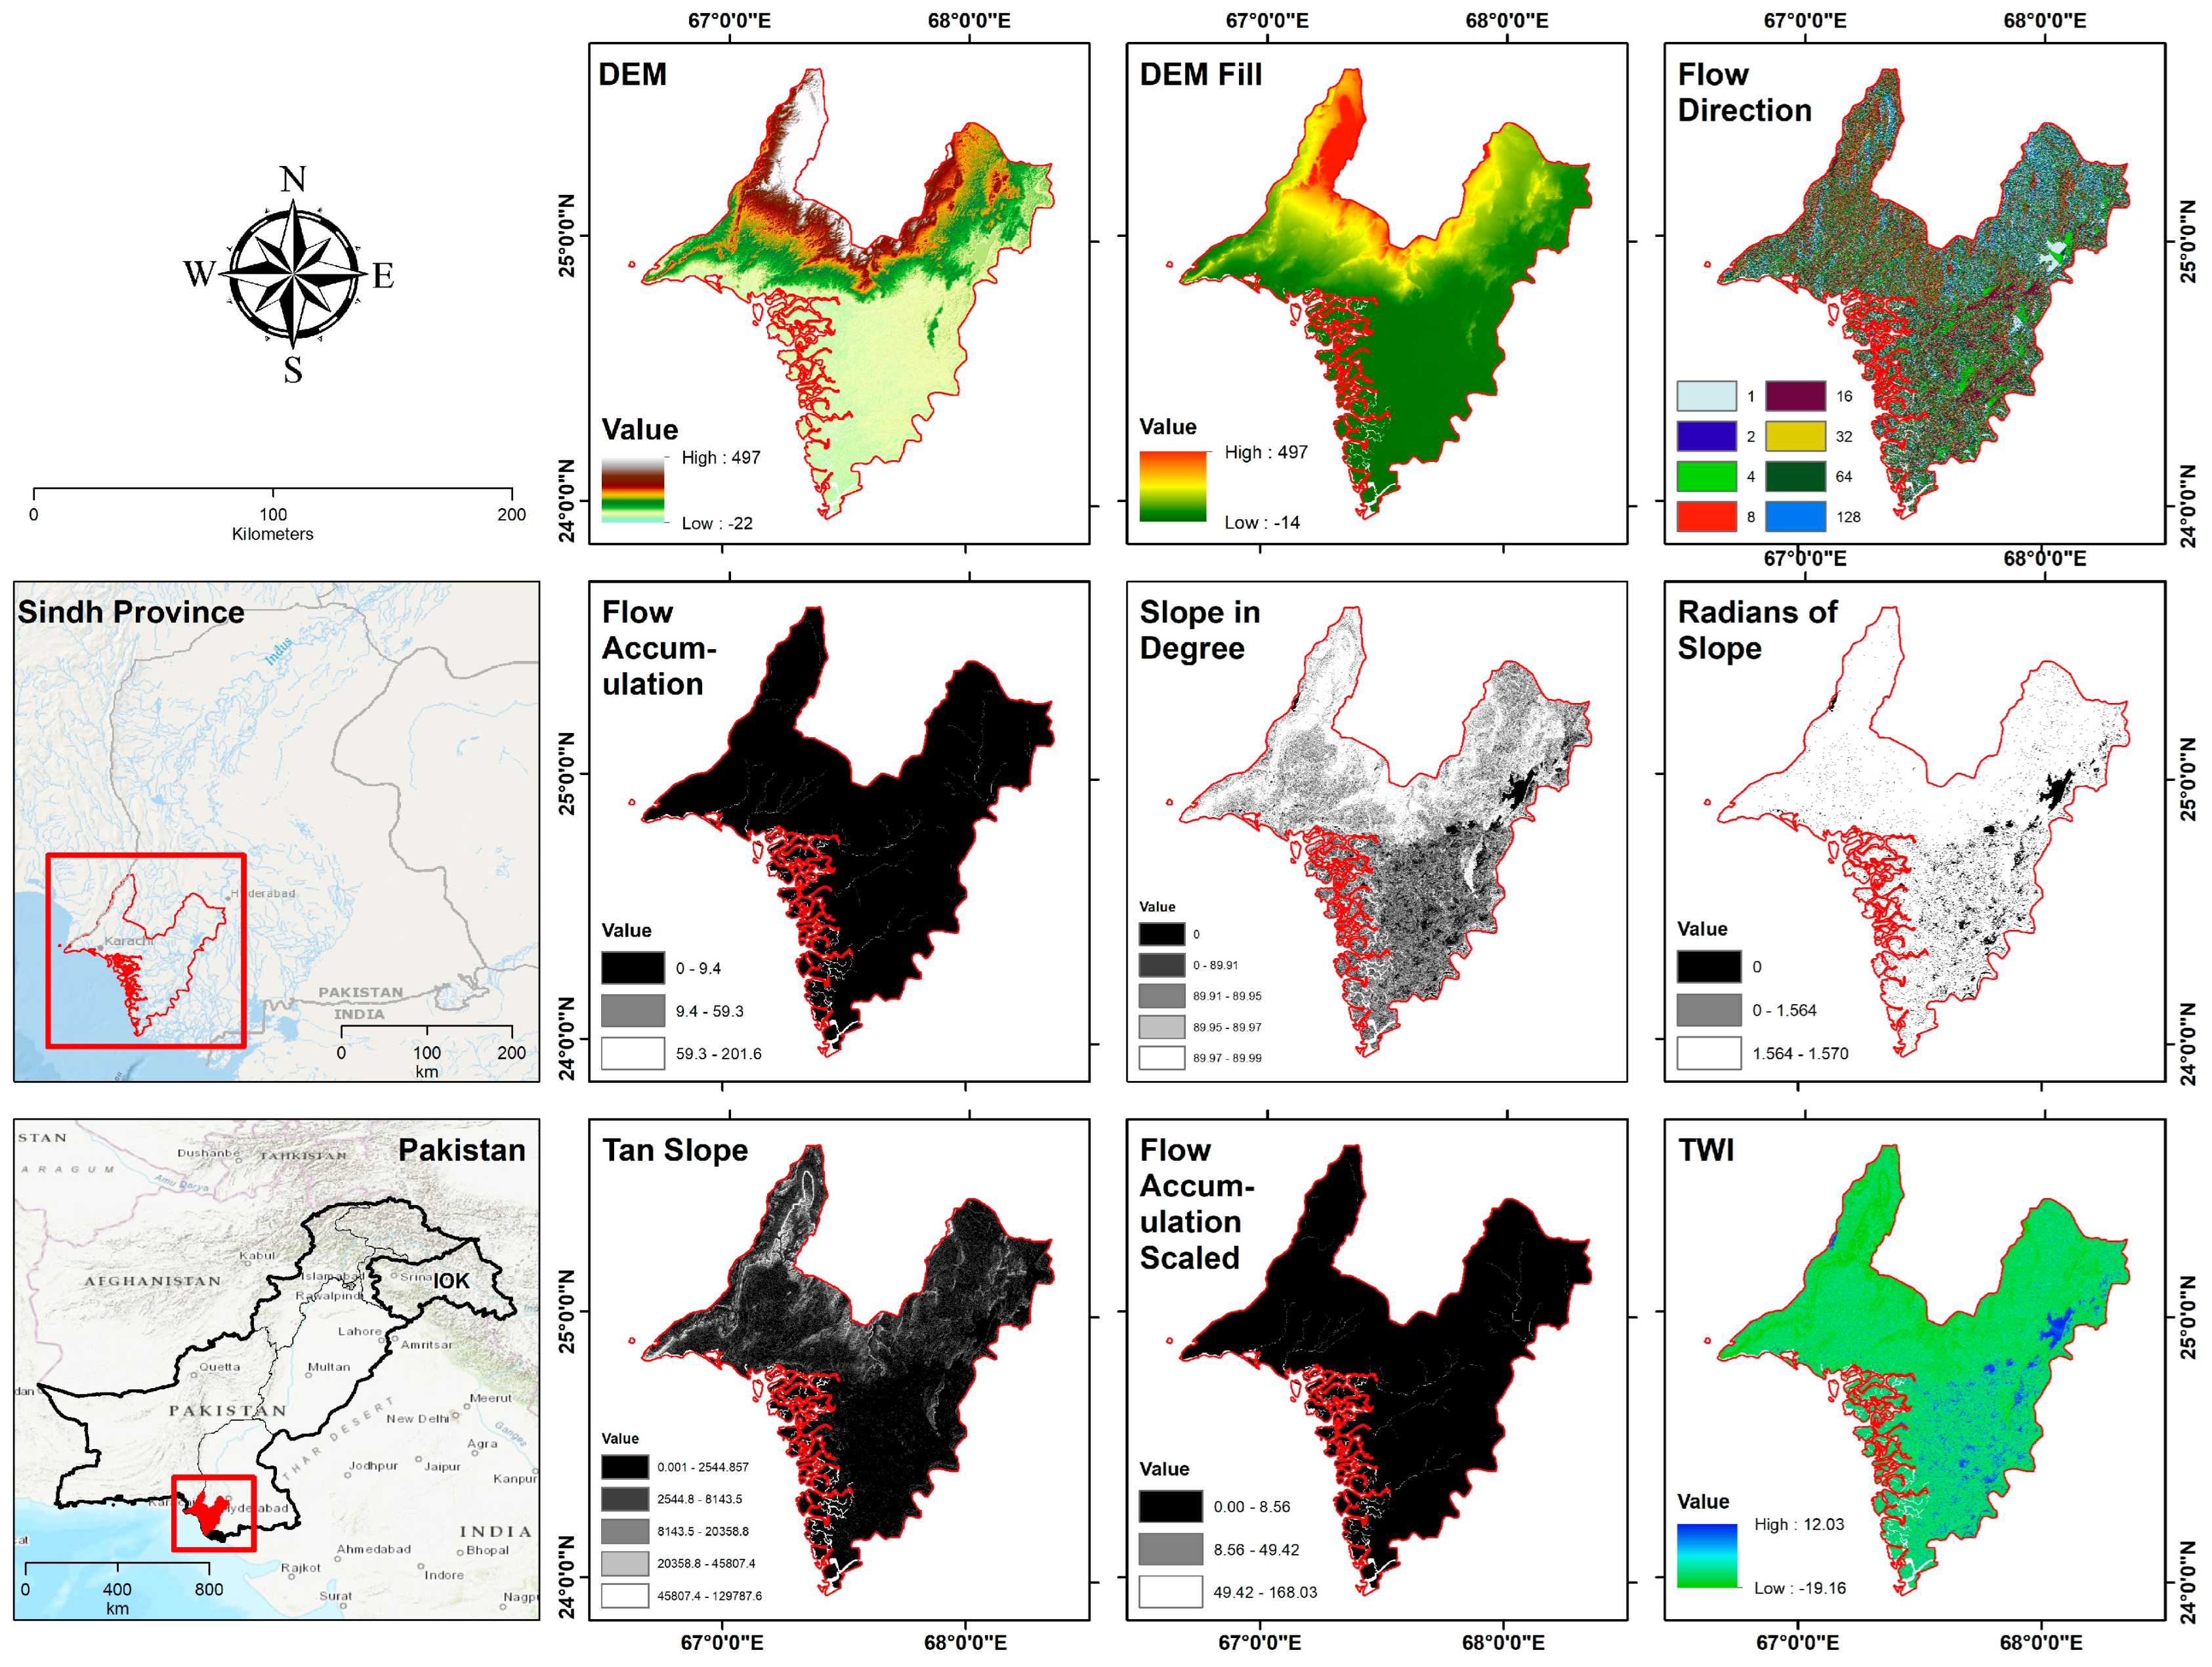
The topographic wetness index (TWI) derived from the digital elevation model (DEM) provided insights into the spatial distribution of moisture and hydrological characteristics across the Khinjhir Lake wetlands landscape. The DEM for the study area ranged from −22 m in low-lying areas to 497 m in elevated regions. Preprocessing like pit filling was applied to create a hydrologically corrected DEM suitable for flow routing and watershed analysis. Slope and flow direction rasters were subsequently generated to determine drainage patterns. Flow accumulation modeling identified high accumulation zones with values exceeding 201,600, denoting areas receiving greater surface runoff. Slope, in degrees, varied from 0 to 89.99, while the tangent slope reached a maximum of 129,787.60 in steep terrain. Scaled flow accumulation accounted for the influence of slope on runoff. Finally, the TWI was computed as the ratio of flow accumulation to slope at each cell to map moisture variability. The TWI ranged from a minimum of −19.16 in drier highland areas to a maximum of 12.03 in low-slope regions with high moisture. The higher TWI values were concentrated along streams and wetlands, acting as hydrological repositories. Overall, the TWI provided a robust delineation of wetness patterns controlled by complex interactions between elevation, slope and flow accumulation. This aids the identification of wetland areas with high moisture for conservation priority shown in
Figure 8 [
80].
3.9. CA–Markov and LandScan Population
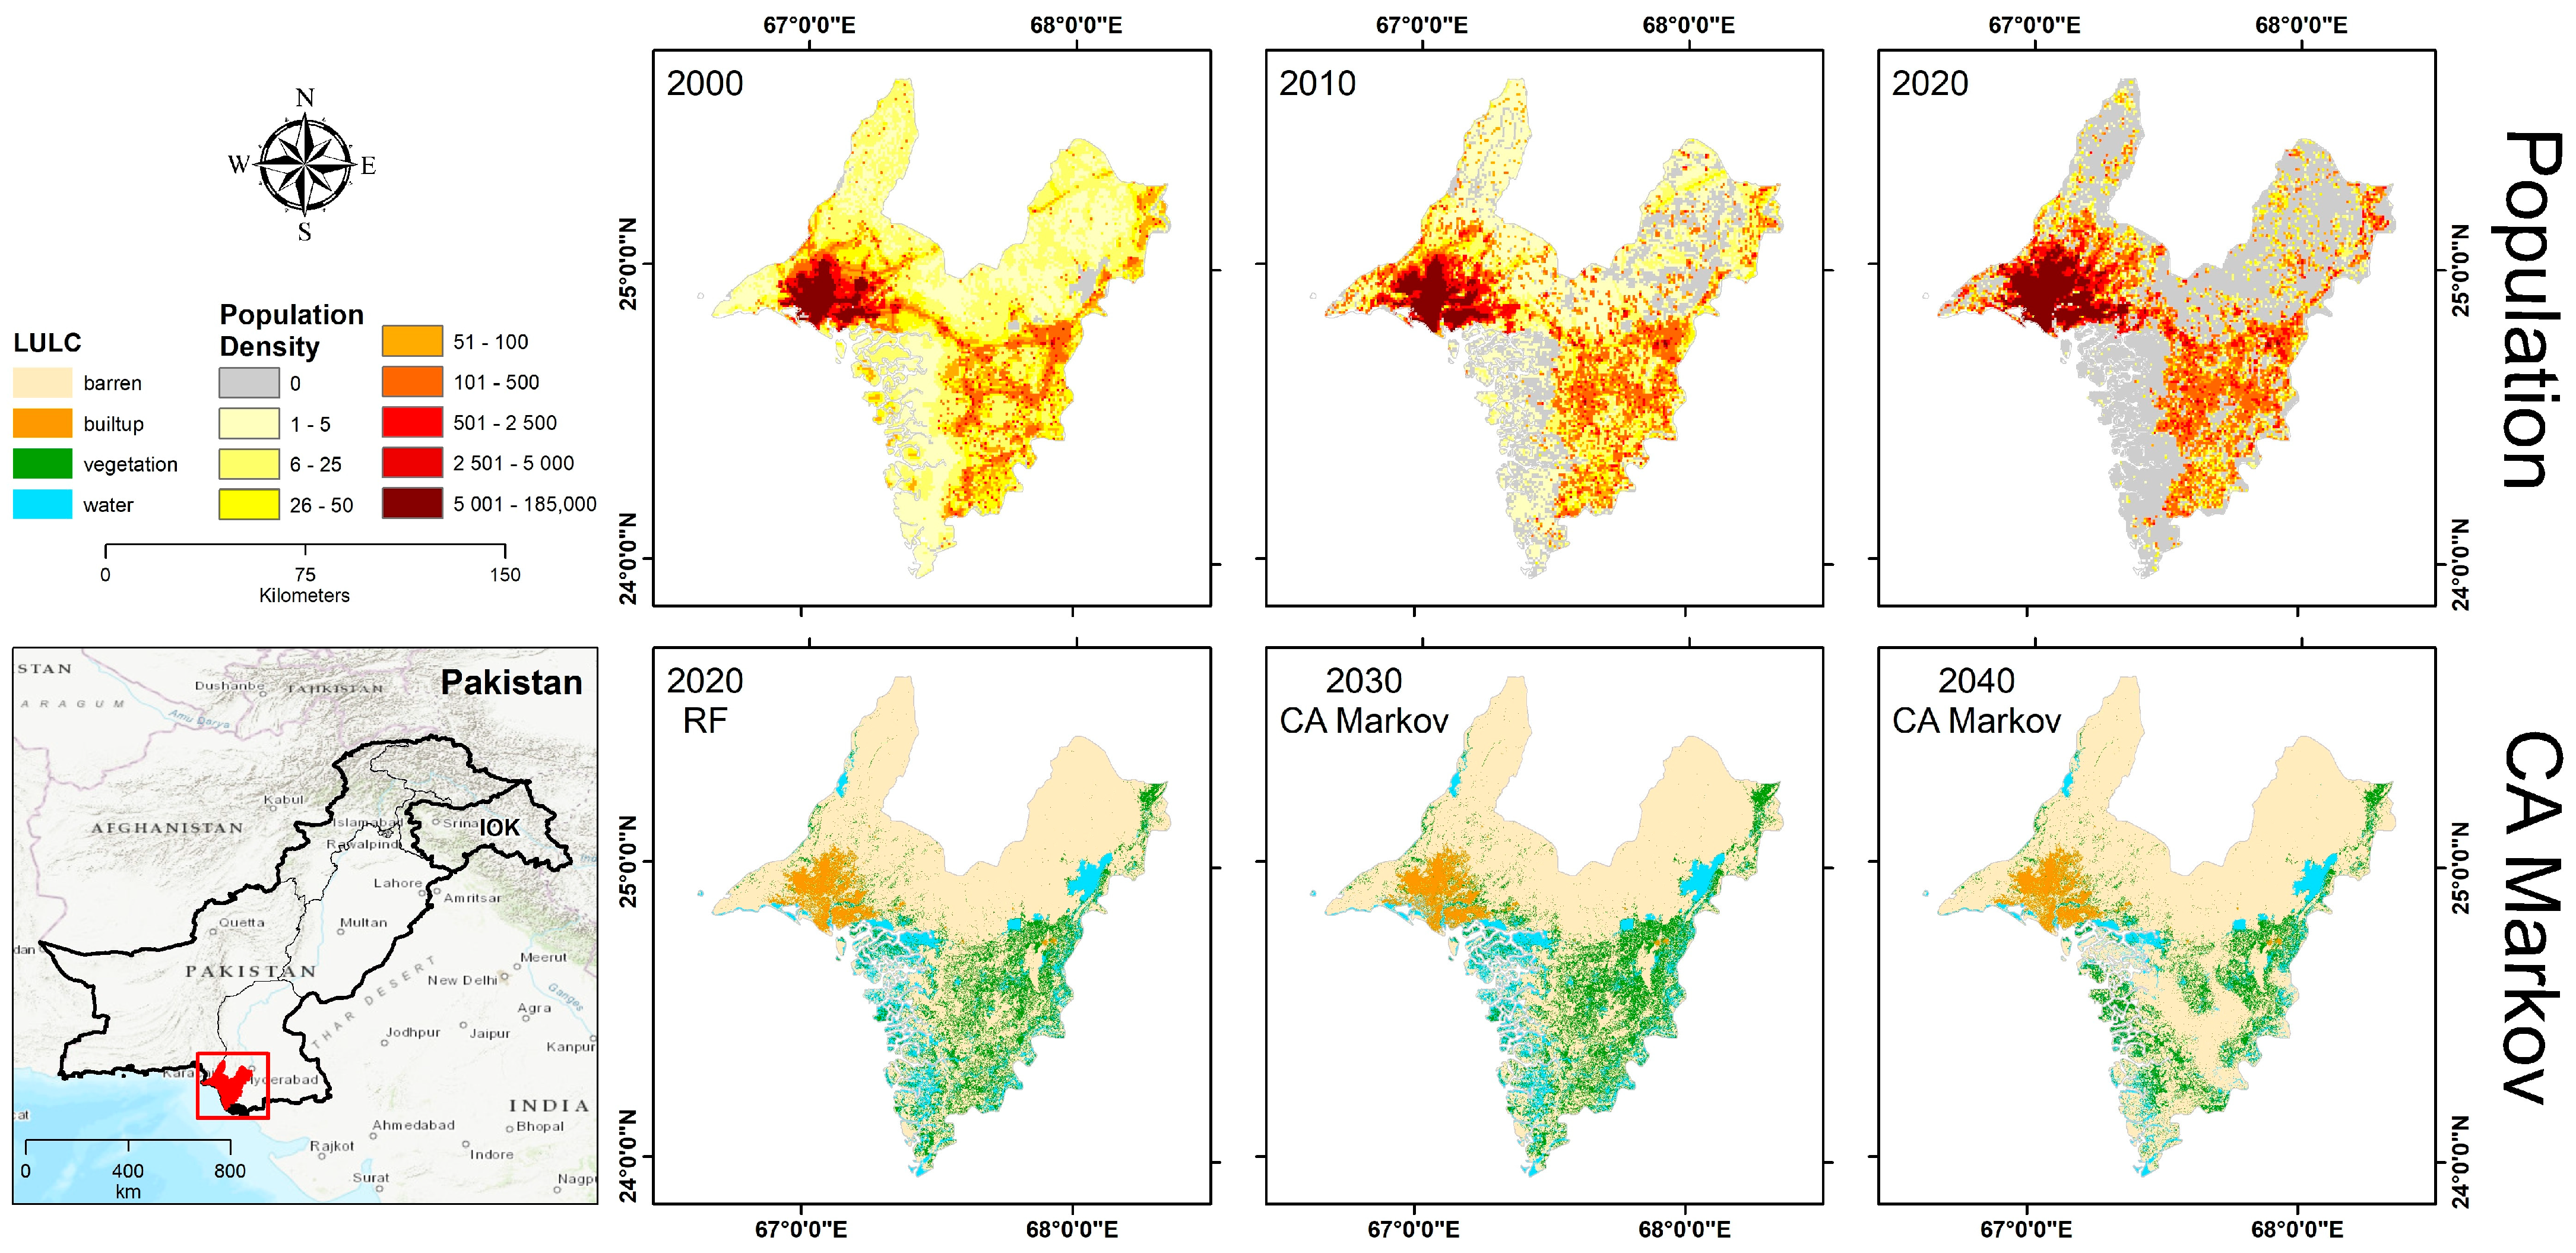
The random forest classification of 2020 Landsat imagery estimated the distribution of major land cover classes in the Khinjhir Lake region to encompass 1127 sq km of water bodies, 1865 sq km of vegetation comprising woodlands, grasslands and croplands, 475 sq km of the built-up area representing human settlements and infrastructure and 8009 sq km of barren land. Cellular automata–Markov chain modeling was applied to simulate future changes in these LULC classes based on transition potentials derived from the historical multi-date imagery. This advanced technique incorporates cellular automata to model spatial processes like urban growth and integrates Markov chains to represent temporal dynamics and transitions between LULC categories. The CA–Markov model projected the water bodies to increase from 1127 sq km to 1160 sq km by 2030, indicating potential wetland expansion in the near term. However, a declining trend was predicted thereafter, with water bodies shrinking to 771 sq km by 2040. Vegetation cover was estimated to increase markedly from 1865 sq km to 2094 sq km by 2030 but reduce to 1516 sq km by 2040. The trajectories for the built-up area and barren land were relatively stable, with minimal change forecasted, as shown in
Figure 9 [
81].
The LULC projections enable the assessment of future change trajectories that would influence wetland ecosystems amidst coupled natural and anthropogenic pressures like climate shifts and land development. The initial expansion but subsequent reduction in water bodies highlights the complex dynamics at play. The artificial neural network techniques enabled the effective modeling of the complex and nonlinear LULC change processes driven by factors like urbanization and climate change. The future projections highlight continued fluctuations in water and vegetation covers over the coming decades.
The analysis of LandScan gridded population data revealed rapid growth in the human population surrounding Khinjhir Lake wetlands from 11 million in 2000 to 29 million by 2020. The exponential population rise aligns with the steady increase observed in the built-up area over the same period, indicating escalating urbanization pressures on the wetlands. The combination of LULC change modeling and population data analysis provides a comprehensive understanding of the interactions between natural ecosystem changes and human pressures facing Khinjhir Lake wetlands. The integrated approach can support the forecasting of future wetland changes and inform sustainable conservation planning under varying socio-environmental conditions.
3.10. CA-ANN (Cellular Automata-Artificial Neural Network)
The cellular automata–artificial neural network (CA-ANN)-integrated model developed in this study for simulating land use/land cover (LULC) changes around Khinjhir Lake demonstrated a robust performance based on the learning curve accuracy assessments. For the 2020 reference LULC map, the model attained a high kappa coefficient of 0.89 and 95.11% correctness, indicating its proficiency in replicating the actual LULC distribution. The CA-ANN model incorporates the pattern recognition capabilities of ANN for handling the complex nonlinear spatiotemporal transitions between LULC classes driven by coupled human and natural factors. Key hyperparameters optimized in the CA-ANN modeling process include the number of hidden layers and nodes per layer in the neural network, the learning rate which controls how quickly the model trains, the batch size indicating how many samples are propagated through the network per iteration and regularization parameters to prevent overfitting [
82]. The future LULC projections generated by the CA-ANN model also exhibited good agreement with the reference maps, with kappa and percent correctness metrics of 0.79 and 89.55% for the 2030 simulation and 0.77 and 90.3% for the 2040 simulation. The slightly lower accuracy relative to 2020 demonstrates some deviation from actual future conditions, which is expected for longer-term projections, but overall highlights the model’s stability. Notably, the kappa history and kappa location values were high across all time points, ranging from 0.868 to 0.952. These spatial accuracy metrics at the pixel level further validate the CA-ANN model’s proficiency in projecting LULC redistribution over time while preserving spatial relationships and neighborhood patterns, as governed by the cellular automata component shown in
Figure 10.
The learning curve provides quantitative evidence that the integrated CA-ANN model developed for the Khinjhir Lake landscape can effectively simulate historical LULC conditions and generate plausible future projections based on transition potentials out to 2040. The high spatial and temporal accuracy underscores its utility as a predictive tool to map wetland ecosystem changes under varying anthropogenic factors. The model provides a robust foundation for assessing LULC trajectories to support wetland conservation planning.
4. Discussion
The integrated spatiotemporal assessment reveals complex dynamics between anthropogenic factors like rapid population growth and land development against the backdrop of natural ecosystem fluctuations in the region. The identification of major vulnerability drivers highlights priority areas for policy interventions to balance socioeconomic needs and wetland conservation [
80,
81]. The future projections also underline the urgency for strategic resource allocation matching the locations likely to undergo maximum change [
56,
58]. Mainstreaming wetland protection considerations into regional planning while adopting localized adaptive measures tailored to zone-specific vulnerabilities can offer potential pathways [
83].
4.1. Accuracy of Wetland Extraction
The accuracy assessment of wetland extraction revealed that the random forest model achieved the highest performance with 89.5% overall accuracy and 0.86 kappa coefficient. The RF model’s ensemble approach helps improve classification accuracy compared to single CARTs. The greater sample efficiency and ability to model complex interactions between wetland drivers enables more precise delineation. However, the RF performance was poorer in wetland areas with severe drainage and vegetation degradation due to spectral confusion. The CART model had lower overall accuracy (86.7%) but performed well in fragmented wetlands by emphasizing shape and edge features. The ANN model demonstrated the highest accuracy (91.2%), owing to ability to model wetland spectral signatures and transitions effectively even in deteriorated conditions using multilayered processing. Further hyperparameter tuning and integrating LiDAR, radar and hyperspectral data could help improve delineation accuracy [
84].
4.2. Drivers and Mechanisms of Wetland Change
The significant decline in wetland area can be attributed to critical drivers like unsustainable water management practices upstream reducing river inflows, the proliferation of invasive species, pollution from fertilizers and industrial effluents and hydrological alterations from dams and canals (Study 4, Study 5). These factors degrade water quality, damage native ecosystems and lower water tables. Climate change pressures like precipitation variability, temperature extremes and floods further exacerbate wetland deterioration (Study 6). The proliferation of Prosopis juliflora as an invasive species has radically altered wetland vegetation due to its rapid spread and high water consumption (Study 7). Encroachment and infrastructure development in wetland buffers have also directly resulted in habitat loss and fragmentation. The sustainable management of upstream water use, control over invasive species, improved pollution regulation and wetland-sensitive development policies are vital to restore wetland functioning [
85].
4.3. Utility of ML and Spatiotemporal Modeling
The combination of multi-temporal satellite data with machine learning offered significant advantages for wetland modeling. The algorithms provided predictive capabilities to map wetlands under varying conditions and future scenarios based on learned relationships between wetland distribution and related factors (Study 8). The spatiotemporal models enabled the analysis of wetland transitions and the trajectory of change over decades to assess degradation risks at appropriate scales (Study 9). The integrated framework thereby provides a more nuanced and expanded understanding of wetland vulnerabilities to guide appropriate interventions. However, limitations exist regarding model interpretability and overfitting that warrant caution. Overall, the study demonstrated the high potential of advanced geospatial analytics in ecological modeling and monitoring applications. But, collaborative approaches that combine computational power with local community monitoring and indigenous knowledge systems may yield more robust and equitable wetland conservation outcomes [
86].
4.4. Implications for Wetland Management
The substantial wetland deterioration observed over decades highlights that existing policies have been inadequate for protecting the fragile wetland ecosystems. Legal protections for wetlands are poorly enforced, and water management seldom considers environmental flows (Study 10). The results underscore the need for an integrated wetland policy aligned with water, agriculture, tourism and biodiversity conservation sectors. Community stewardship programs involving local stakeholders in wetland monitoring can build public ownership. Wetland ecosystem services valuation and economic incentives for farmers adopting organic practices are other options. The rich biodiversity and ecological significance of these wetlands justifies strong precautionary measures by reversing unsustainable agricultural expansion and infrastructure projects. However, a balance is needed between conservation and development priorities to ensure socially equitable outcomes. The study findings provide a basis to advocate for strengthening wetland protections while emphasizing synergies with sustainable development [
87,
88].
4.5. LULC Classification
The extensive LULC analysis provided significant insights into land cover modifications surrounding Khinjhir Lake between 2000 and 2020. Notably, we observed a substantial decrease in barren land and a marked increase in vegetation, indicating a positive trend toward reforestation and the expansion of vegetative cover. In contrast, there was a decline in water body extent, suggesting potential water scarcity and shrinking of the lake. The increase in built-up areas signifies ongoing urbanization pressures in the region. Given the RF model’s higher accuracy, it serves as a reliable source for understanding LULC changes around the lake.
4.6. Wetland Change
Our analysis of wetland change over two decades indicates that wetland loss exceeded gain from 2000 to 2010. However, this trend reversed from 2010 to 2020, with wetland regeneration outweighing loss, possibly due to increased conservation efforts. Nonetheless, the overall long-term trend remains one of cumulative loss. These findings demonstrate the ecological resilience of some wetland areas in the face of anthropogenic and climatic pressures.
4.7. Risk Inventory Zone Map of Wetland
Our study included a risk inventory zone mapping analysis to assess vulnerability levels across Khinjhir Lake wetlands. By considering proximity to historical wetland loss areas and population distribution intensity, we classified wetlands into five risk zones: very low, low, moderate, high and very high. This approach provides valuable insights for targeted management planning, helping to prioritize mitigation measures for wetlands facing varying levels of anthropogenic threats.
4.8. Transition of Wetland
An extensive analysis of wetland change detection revealed substantial transitions between wetlands and other land cover classes, including barren land, vegetation and built-up areas, from 2000 to 2020. The results indicated a significant expansion of wetlands into previously non-vegetated barren lands, possibly due to increased precipitation and rising water tables. Conversely, some wetlands transitioned to barren land or vegetation cover. The overall transition trend emphasizes the expansion of wetlands into non-vegetated areas, with minor exchanges with built-up impervious surfaces.
4.9. Vulnerability Map
The creation of a wetland vulnerability map based on spatial criteria, proximity to historical wetland loss areas and population distribution intensity, provides valuable insights for conservation decision making. By categorizing wetland areas into five risk zones, ranging from very low to very high vulnerability, we can prioritize and plan mitigation measures for wetlands facing varying levels of risk and degradation. This spatial approach helps in the effective management of wetland ecosystems.
4.10. Indices Results
The spectral water and vegetation indices revealed declining water extents and fading vegetation vigor around Khinjhir Lake between 2000 and 2020. These findings corroborate the changes observed in LULC and highlight the complex dynamics of moisture and vegetative changes in the region.
4.11. Topographic Wetness Index (TWI)
The TWI analysis, derived from digital elevation models, helped us understand moisture distribution across the landscape. By mapping areas with higher moisture content, we can identify regions where conservation measures are urgently needed to protect wetland ecosystems.
4.12. CA–Markov and LandScan Population
The CA–Markov model projected future changes in LULC categories, indicating potential trends in water bodies and vegetation cover. Simultaneously, the analysis of LandScan population data revealed rapid population growth around Khinjhir Lake, implying increasing urbanization pressures. This integrated approach allows us to forecast future changes in wetland ecosystems under different socio-environmental conditions.
In summary, our study provides a comprehensive analysis of wetland vulnerability and land cover changes in the Khinjhir Lake region. The results emphasize the complex interplay between natural and anthropogenic factors, which shape the wetland ecosystem. These findings can guide future conservation efforts and inform sustainable planning strategies to protect this ecologically vital area. Further research and monitoring are essential to adapt to the evolving challenges facing Khinjhir Lake and other wetlands worldwide.
5. Conclusions
In summary, the satellite data analysis revealed declining moisture conditions and an 11% shrinkage in Khinjhir Lake over the past two decades attributable to factors like unsustainable water management and climate change. Inventory risk zoning classified 30% of present-day wetland areas under moderate to high vulnerability levels driven by growing anthropogenic pressures evidenced by the 29 million regional population growth. The integrated modeling predicted this declining trajectory would persist amid uncontrolled urbanization, necessitating urgent policy actions. This comprehensive spatiotemporal assessment provides vital insights into the coupled natural and human drivers of change for guiding future evidence-based planning around Khinjhir Lake wetlands aligned with regional development objectives. This study undertaken in Khinjhir Lake wetlands and its surroundings in Sindh province, Pakistan, provides an integrated spatiotemporal analysis of wetland changes and associated vulnerability over the past few decades using advanced geospatial and machine learning techniques. The spectral water index analysis revealed declining moisture conditions in Khinjhir Lake since 2000, evidenced by reducing MNDWI levels. This drying pattern aligned with the 1–2% areal shrinkage of open water bodies from 2010 to 2020 detected through land cover classification. An expansion of vegetation cover was observed between 2000 and 2010, indicated by increasing NDVI values. However, fading NDVI levels since 2010 reflected deteriorating ecological health. The random forest machine learning model attained highest accuracy for land cover classification, estimating 1127 sq km water bodies in 2020—an 11% decline since 2000. It projected progressive urbanization, with a rise in the built-up area from 2% to 4% over the 20-year period. The inventory risk zoning highlighted 30% of present-day wetland areas under moderate to high vulnerability levels based on the proximity to historical wetland loss and population distribution intensity.
The wetland change analysis found that while regeneration exceeded loss from 2010 to 2020, the overriding long-term trend has been one of cumulative decline in area. The CA–Markov model predicted this declining trajectory would continue post 2030 amid growing anthropogenic pressures, evidenced by the 29 million population growth around Khinjhir Lake between 2000 and 2020. This integrated spatiotemporal assessment provides a comprehensive understanding of the multifaceted factors and processes driving wetland vulnerability in the region. The study highlights the utility of emerging data analytics and machine learning techniques for the evidence-based modeling, mapping and monitoring of wetland ecosystems. The findings can guide future conservation policies and practices to ensure balanced ecosystem management and sustainable regional development around Khinjhir Lake.


 ,
, 


