1. Introduction
Inherited retinal dystrophies (IRDs) are a large and heterogeneous group of hereditary diseases that often lead to progressive and severe vision loss. Over 400 genes are related to different phenotypes of IRDs, with some of them encoding for proteins essential for phototransduction or other photoreceptor functions [
1,
2]. Despite the identification of numerous disease-causing genes, therapeutic options for IRDs remain very limited; notably, Luxturna (voretigene neparvovec) is currently the only approved gene therapy for patients with biallelic
RPE65 mutations [
3]. Retinitis pigmentosa (RP) is the most prevalent IRD, affecting approximately 1 in 3000–4000 individuals worldwide [
4]. It is a progressive disease characterized by the primary degeneration of rod photoreceptors, followed by secondary cone loss. The onset and severity of this pathology vary according to the specific pathogenic variant and the gene involved. Both syndromic and non-syndromic RP forms exist, with the latter being more prevalent and associated with over 100 genes, including
PDE6A, whose pathogenic variants are inherited in an autosomal recessive manner [
2,
4].
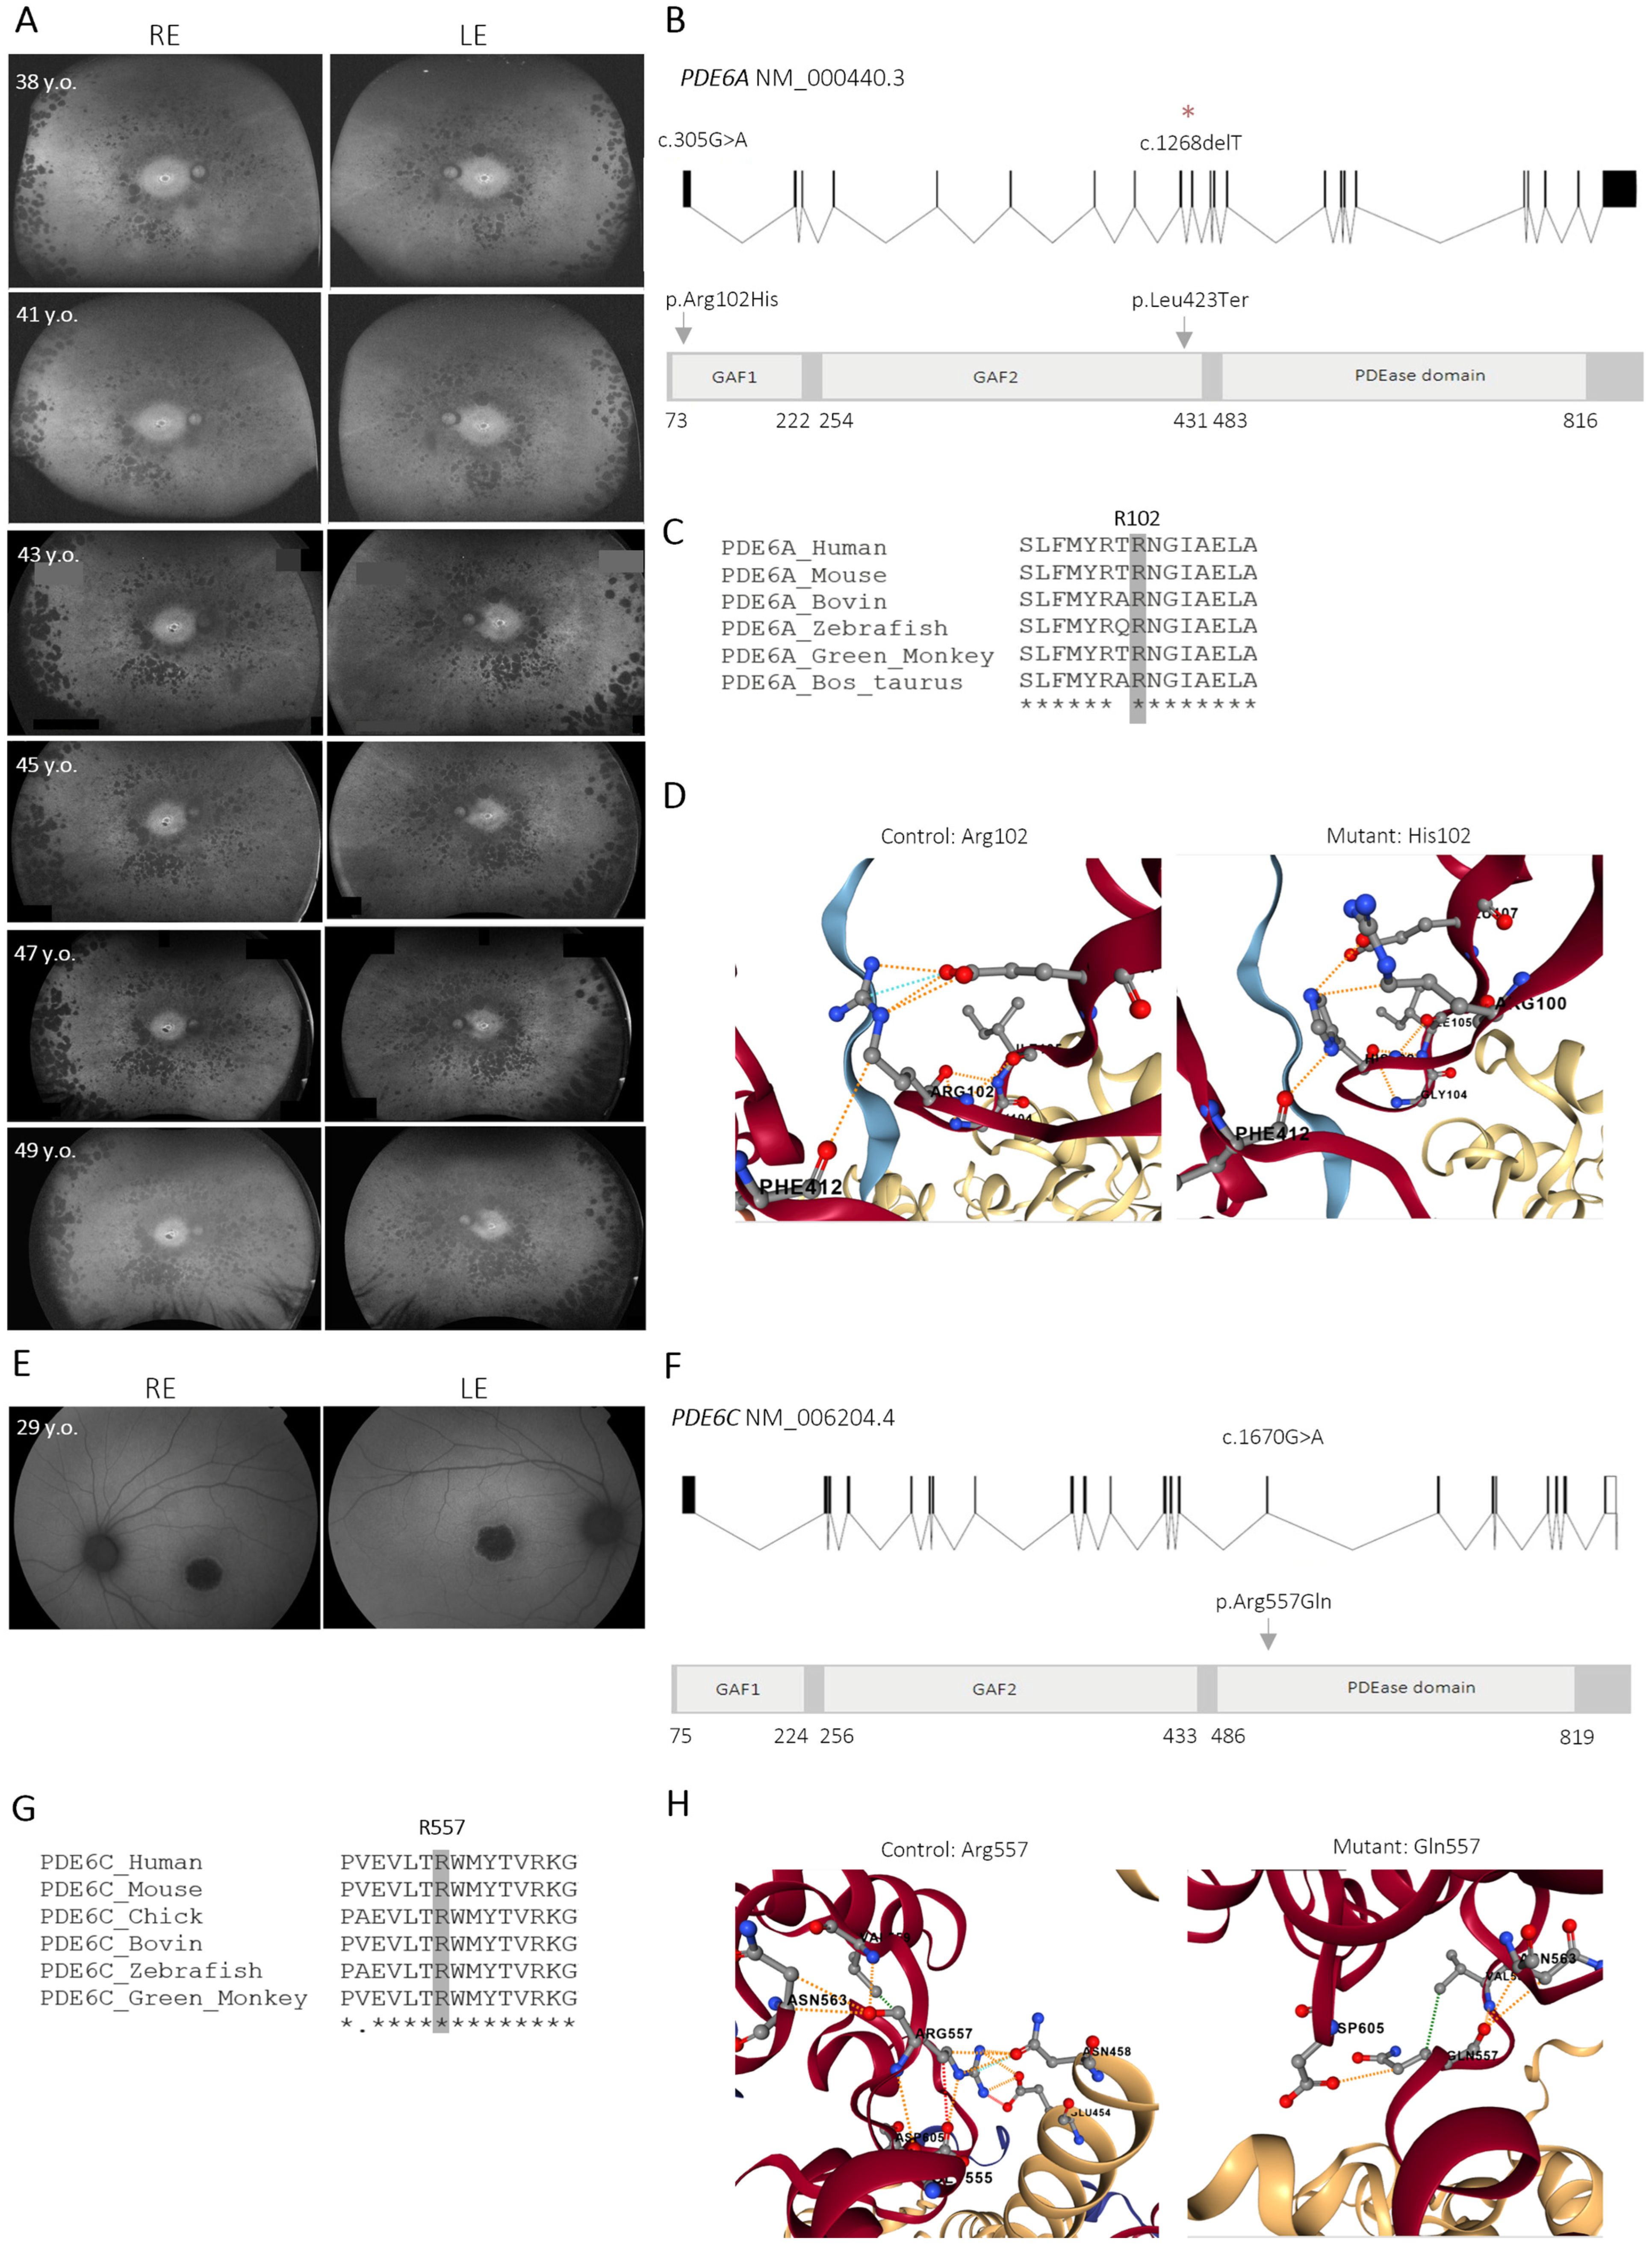
PDE6A (NM_000440.3; OMIM 180071) encodes the α-subunit of rod-specific cyclic nucleotide phosphodiesterase (PDE6) [
4] and is located on chromosome 5q32; it comprises 22 exons and encodes an 860 amino acid protein.
PDE6A is specifically expressed in rods and forms an heterotetrameric complex composed of two catalytic subunits (PDE6A, ~99.5 kDa, and PDE6B, ~98.3 kDa) and two identical inhibitory γ-subunits (PDE6G, ~9.6 kDa) [
5].
While
PDE6A is critical for rod photoreceptor integrity, cones rely on
PDE6C (NM_006204.4; OMIM 600827), which encodes the α′-subunit of cone-specific cyclic nucleotide phosphodiesterase. The
PDE6C gene is located on chromosome 10q23.33 and includes 22 exons encoding 858 residues of protein [
6]. In cone photoreceptors, PDE6 complexes are formed by two catalytic subunits of PDE6C (~99.1 kDa) (α’) and two identical inhibitory subunits of PDE6H(γ) (~9 kDa) (PDE62α’2γ).
PDE6C is one of the six known genes causative of achromatopsia (ACHM) [
7], inherited as an autosomal recessive trait but characterized by loss of cone photoreceptor function and affecting approximately 1 in 30,000 individuals worldwide [
8]. Patients with ACHM present low visual acuity since birth or early infancy, photosensitivity, and poor color discrimination [
9].
Both PDE6A and PDE6C share a conserved structure comprising one catalytic and two GAF domains (acronym derived from cyclic guanosine monophosphate (cGMP)-activated PDEs, adenylyl cyclase, and Fh1A): GAF-1 (73–222 aminoacids in PDE6A or 75–224 amino acids in PDE6C), which contains the cGMP binding site and the photoreceptor outer segment (POS) localization signal, and GAF-2 (254–431 amino acids in PDE6A or 256–433 amino acids in PDE6C), where the regulatory subunit γ is bound controlling the catalytic activity of the enzyme [
10,
11]. The catalytic domain is called cyclic nucleotide phosphodiesterase (PDEase) (483–816 amino acids in PDE6A or 486–819 amino acids in PDE6C) and mediates the light-activated hydrolysis of cGMP (data obtained from UniProt, 2026) [
12].
The PDE6 complex is a key component of the phototransduction cascade in rod and cone photoreceptors [
13]. Its primary function is to selectively hydrolyze cGMP into guanosine monophosphate (GMP). The decrease in cGMP levels triggers the closure of cyclic-nucleotide-gated (CNG) cation channels, thereby limiting Ca
2+ and Na
+ influx, which leads to membrane hyperpolarization and ultimately initiates signal transmission to secondary neurons. Conversely, excessive accumulation of cGMP can result in the persistent opening of CNG channels, causing continuous and pathological Ca
2+ entry, which may culminate in photoreceptor cell degeneration [
14,
15].
In the past decade, induced pluripotent stem cell (iPSC)-derived retinal organoids (ROs) have emerged as a powerful model to study retinal development and disease mechanisms [
16]. These three-dimensional structures are capable of recapitulating human retinas until the final stages and express all the retinal cell types and neuronal retinal markers [
17]. Disease modeling using iPSC-derived ROs has provided critical insights into the molecular and cellular mechanisms underlying IRDs. For instance, Gao et al., 2020, generated ROs from an RP harboring a homozygous mutation in
PDE6B, successfully modeling relevant pathological features in vitro [
17]. Strikingly,
PDE6A- and
PDE6C-associated retinal dystrophies have not yet been modeled using this approach.
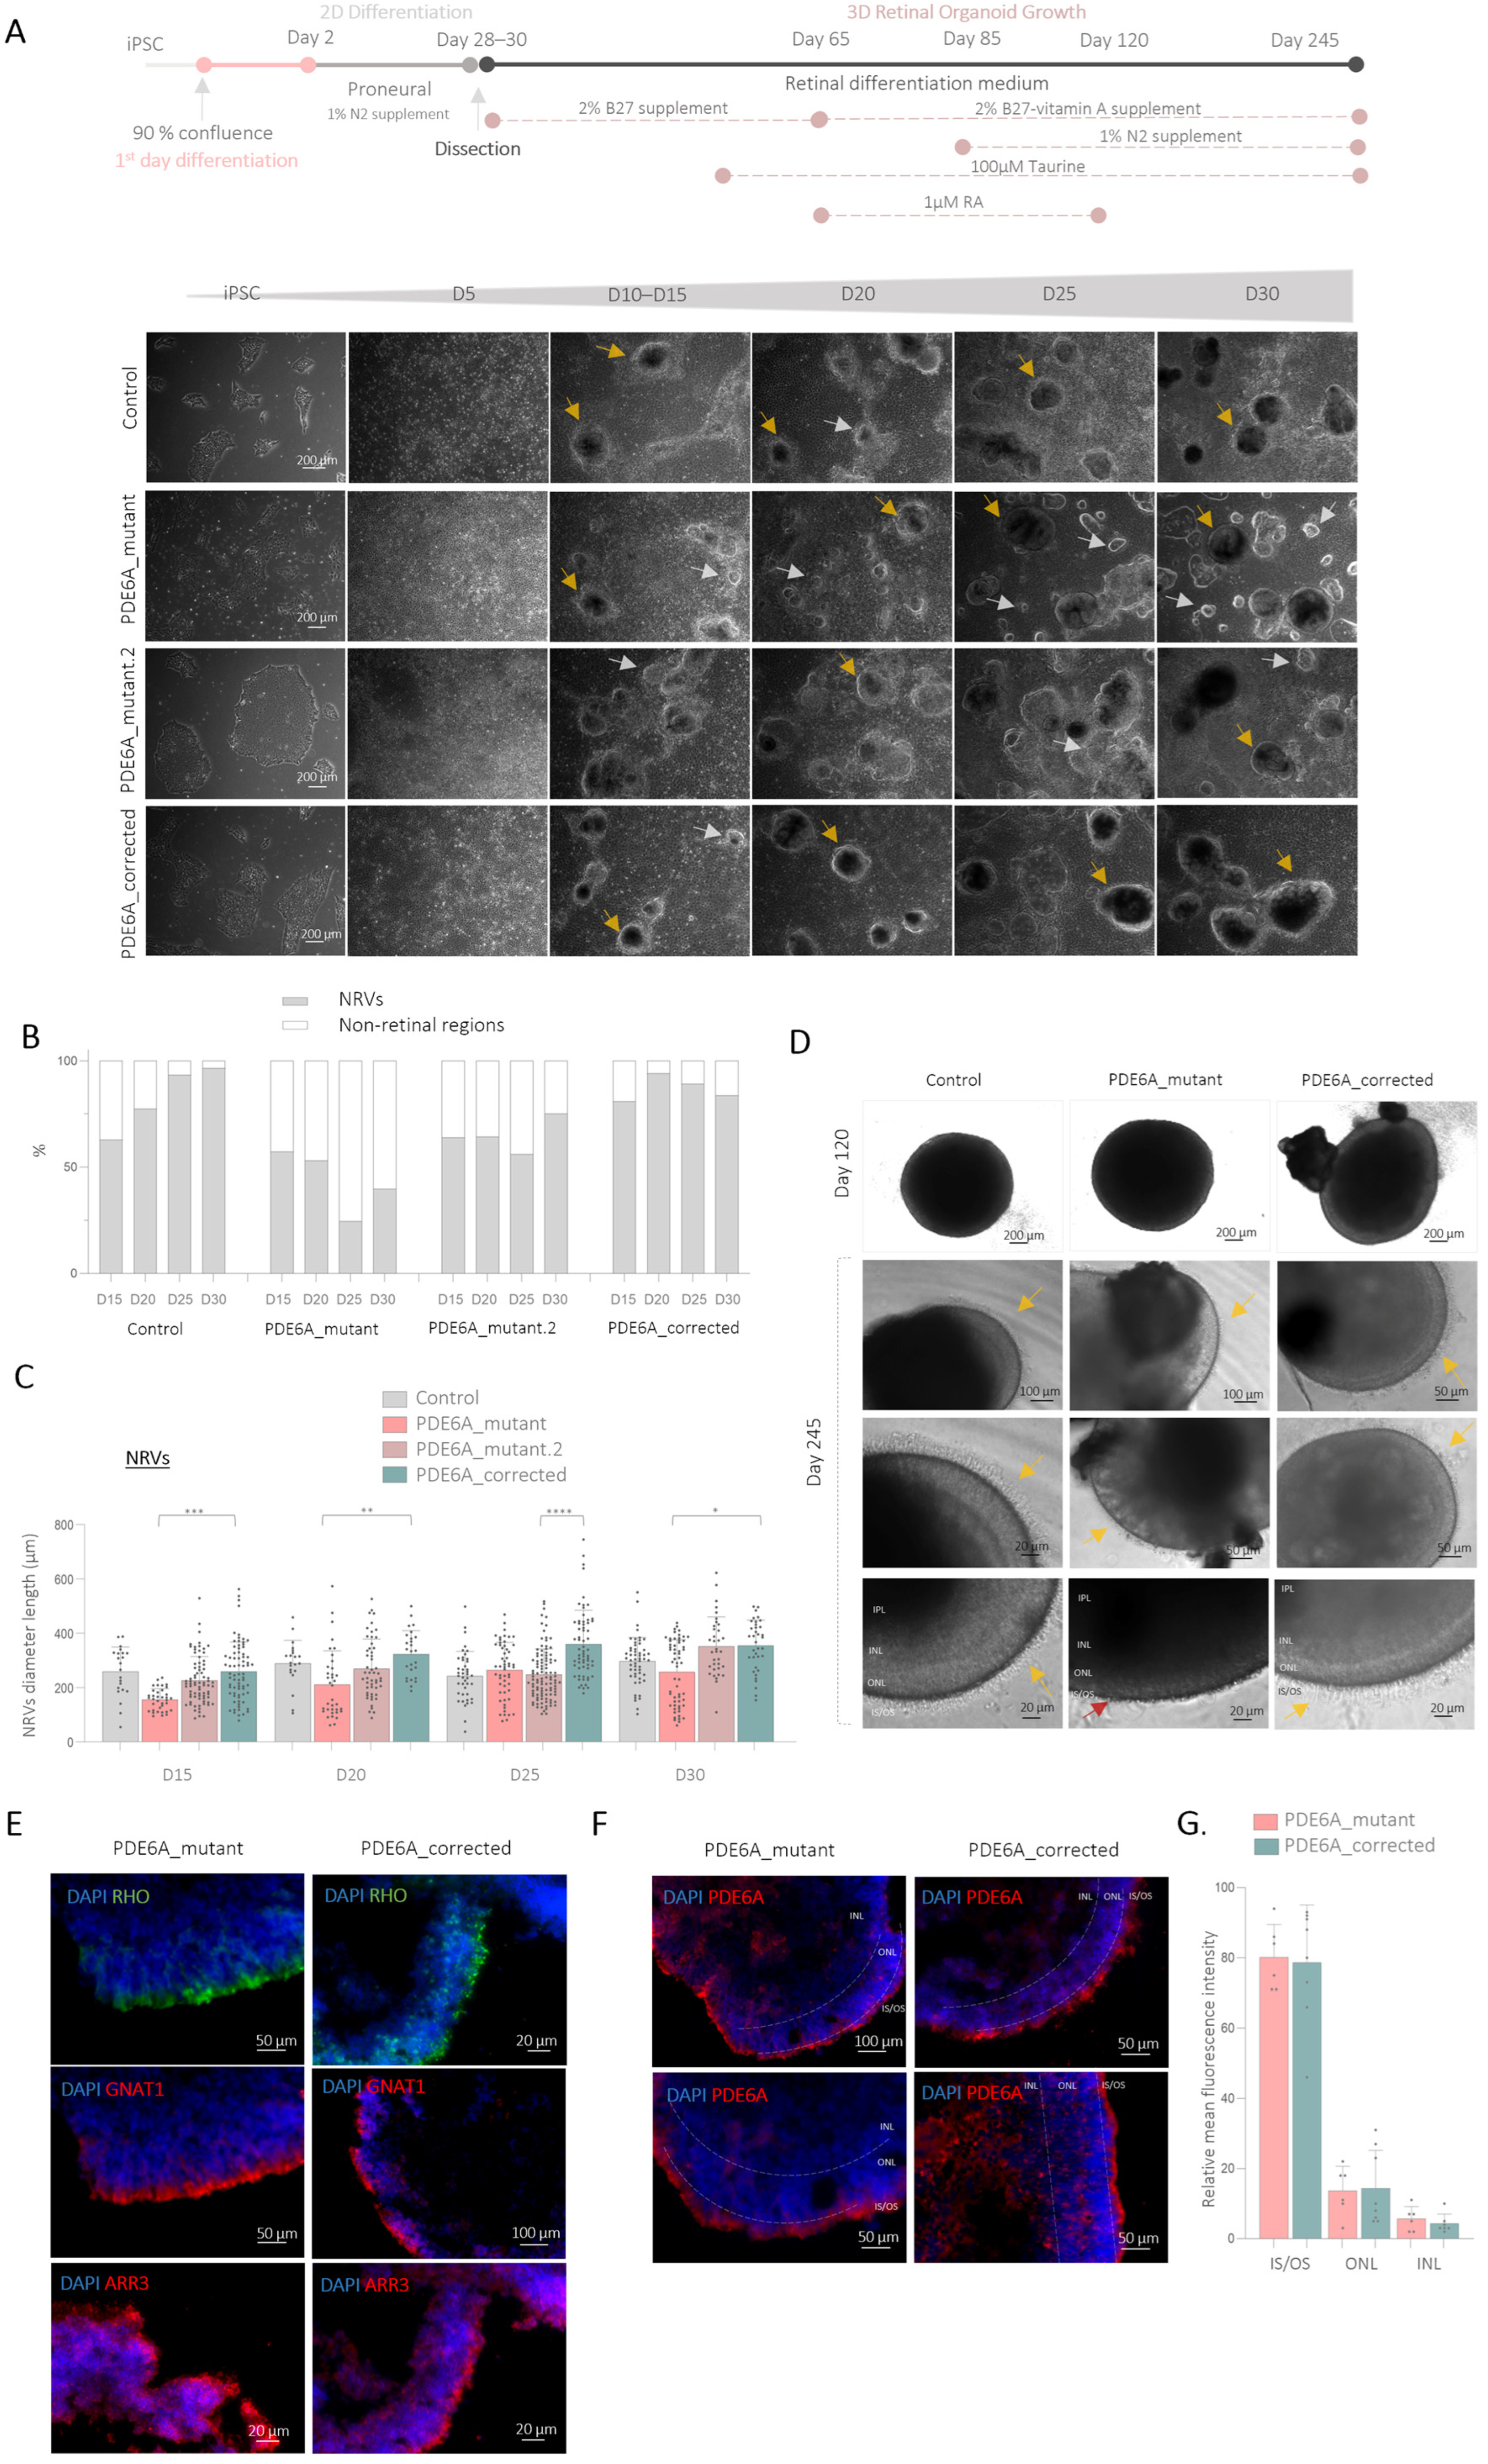
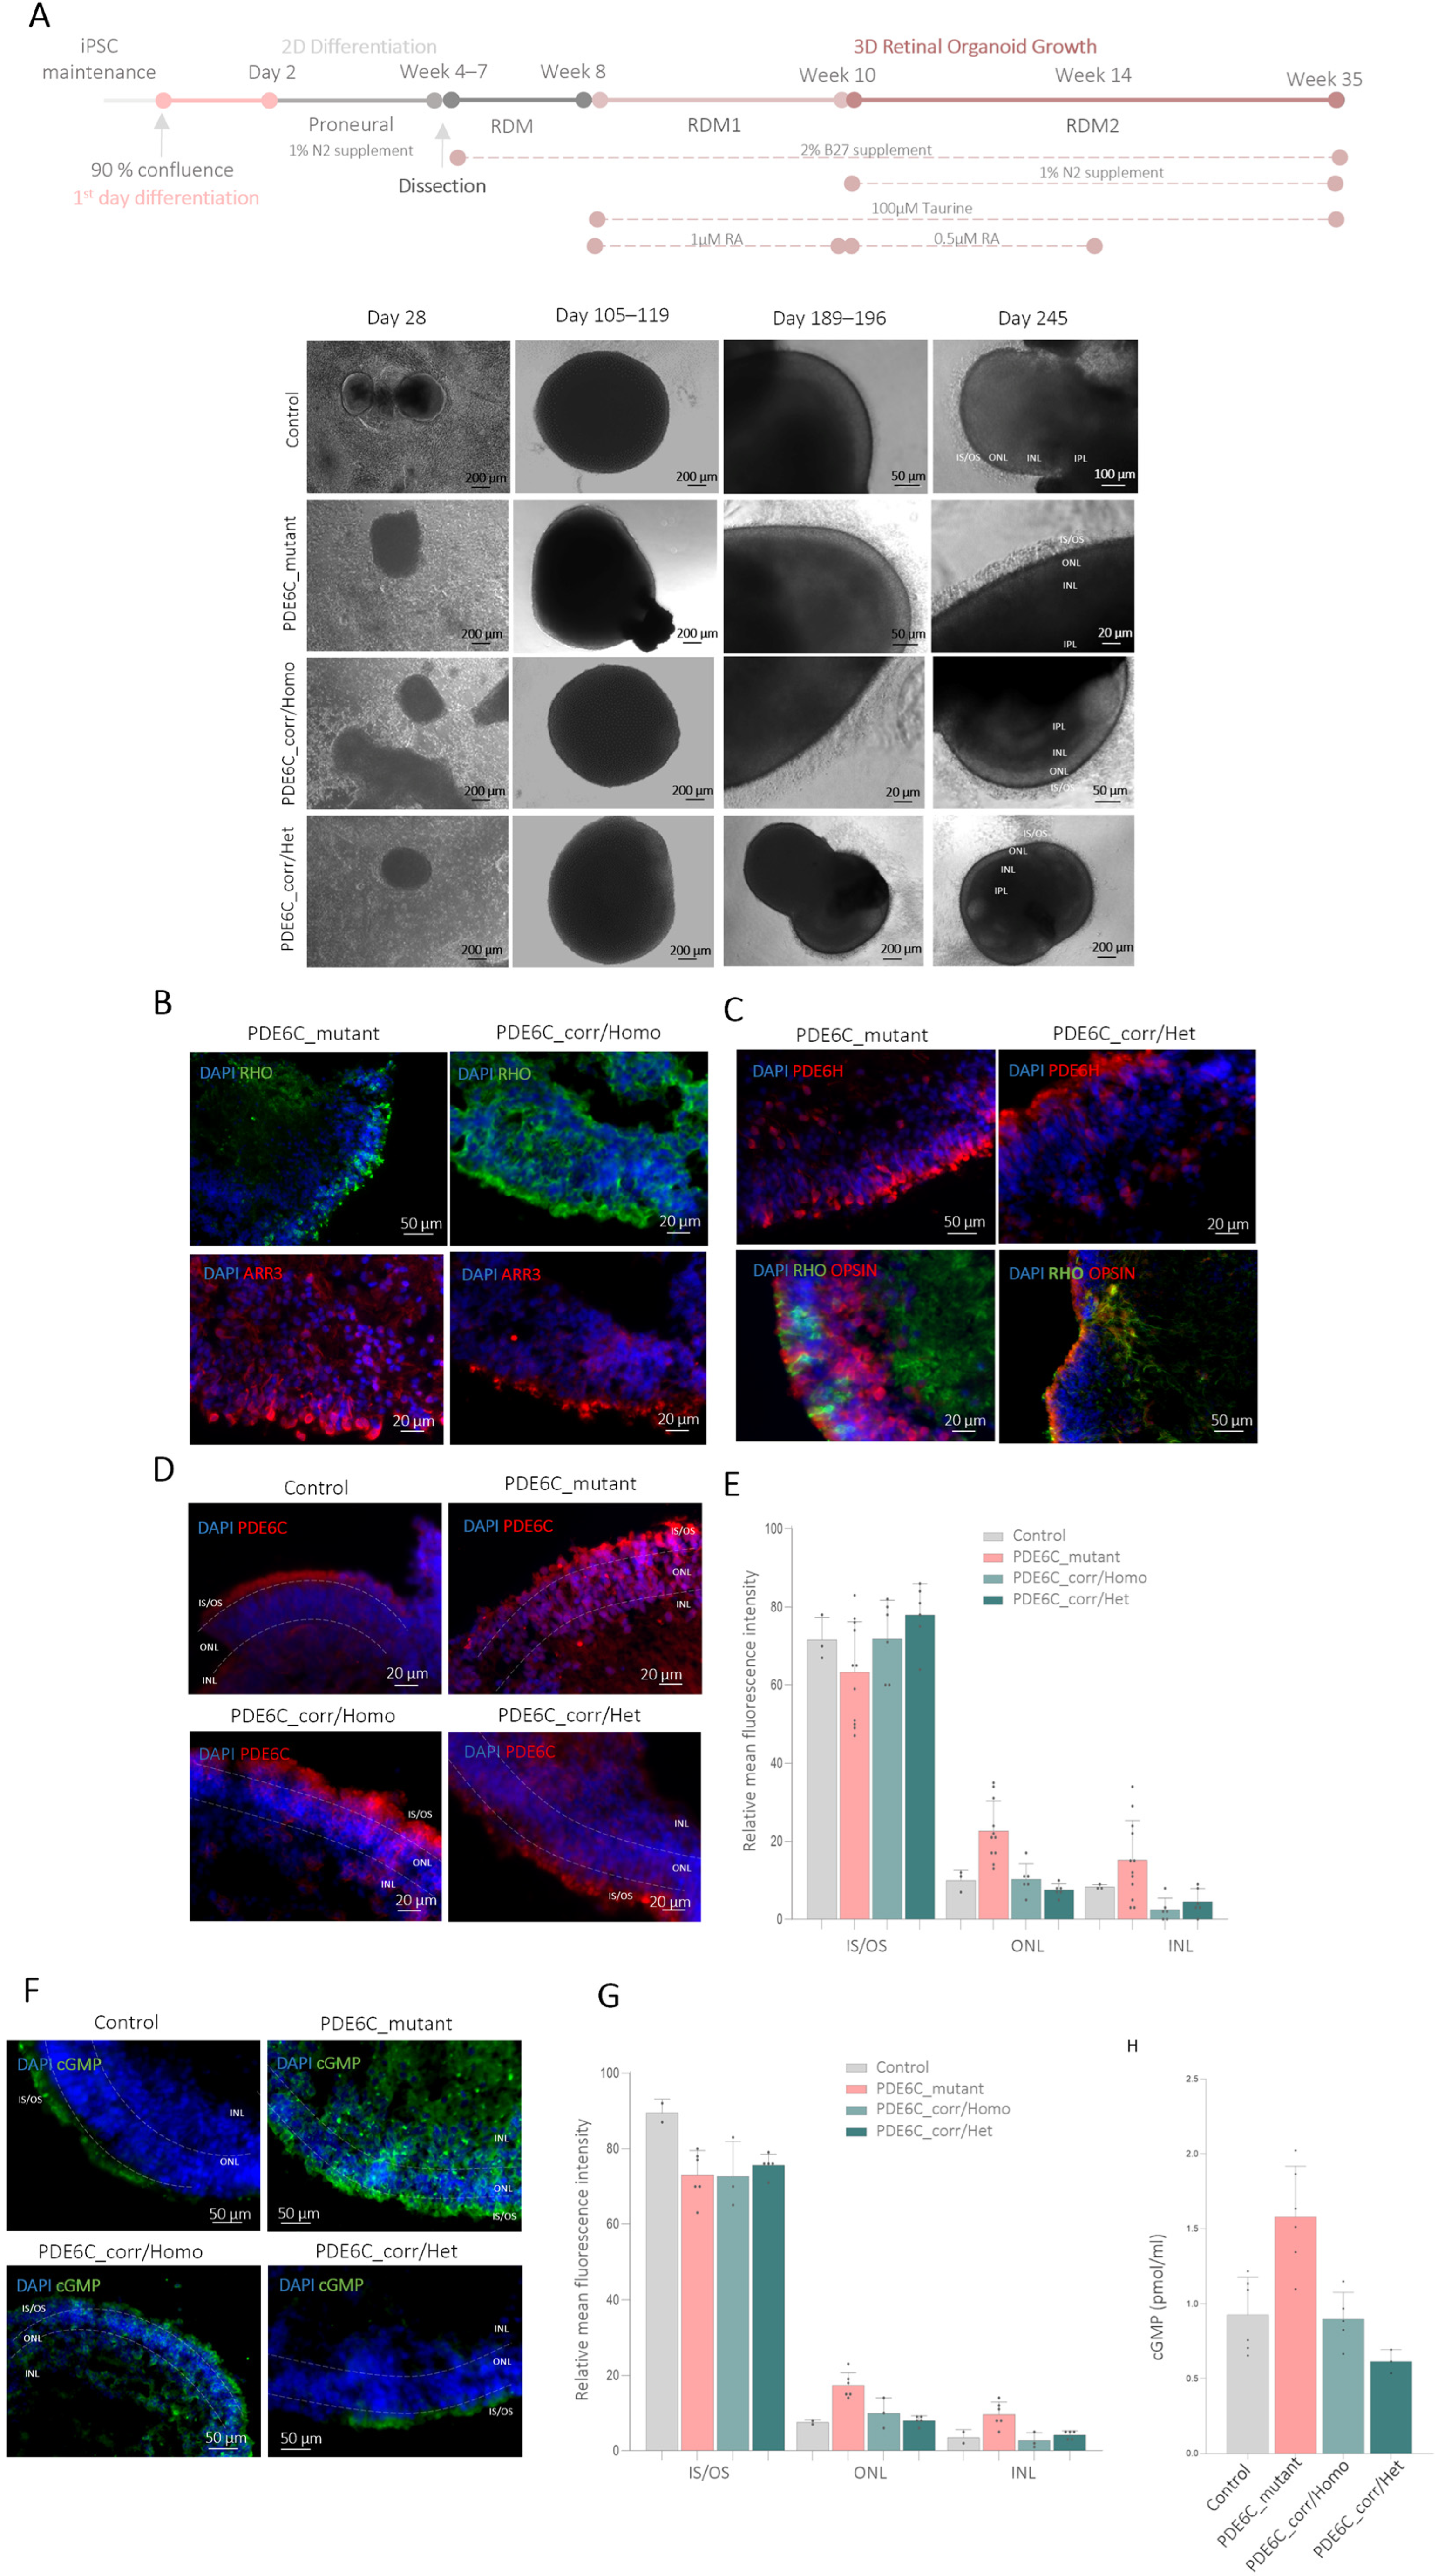
In the present study, we aimed to generate and characterize iPSC-ROs from a patient with RP carrying compound heterozygous PDE6A mutations, as well as ROs from iPSCs obtained from a patient with ACHM harboring a homozygous PDE6C mutation. In parallel, we used established isogenic models to analyze genotype–phenotype correlations and to investigate the molecular mechanisms underlying PDE6A- and PDE6C-associated pathogenesis. Notably, while the mutant PDE6A line exhibited impaired neuroretinal vesicle formation, a subset of RP-derived ROs matured appropriately and preserved functional features. In the case of the PDE6C-associated achromatopsia model, the mutant ROs exhibited normal structural maturation, although the homozygous PDE6C pathogenic variant likely impaired efficient cGMP hydrolysis within the photoreceptors. Together, those RO models offer a promising and robust approach for investigating the pathogenic mechanisms underlying IRDs.
2. Materials and Methods
2.1. Clinical Data
Both patients were clinically diagnosed at the Institut de Microcirurgia Ocular (Barcelona, Spain) based on standard ophthalmic evaluations. Patients with a suspected inherited retinal disease underwent multimodal imaging (retinography, autofluorescence retinography and optical coherence tomography), and both patients also underwent visual field testing. Our first patient was diagnosed with retinitis pigmentosa because of his symptoms and clinical findings. He reported nyctalopia and peripheral visual field limitation and a fundus examination revealed the typical findings of RP: mid-peripheral pigment disturbances with some scattered bone-spicule pigmentation and sparing of the macular area, waxy pallor of the optic disk, and attenuation of retinal vessels. Autofluorescence retinography showed patchy hypoautofluorescence at mid-periphery and central perimacular hyperautofluorescence in both eyes. Optical coherence tomography showed preserved external retinal layers at the foveal area, with perifoveal retinal atrophy. Visual field testing revealed peripheral perimetric constriction, with preserved visual field in the central 5° in both eyes. The second patient was diagnosed with achromatopsia due to the presence of low visual acuity, color vision deficiency and nystagmus since early childhood. Fundus examination revealed central macular pigmentary atrophy, no perimacular flecks, and no other signs of peripheral retinal involvement. Autofluorescence retinography showed marked hypoautofluorescence in the macular area, with no signs of peripheral involvement. Visual field testing confirmed the presence of a central scotoma in both eyes, but no involvement of the peripheral visual field. Optical coherence tomography showed foveal atrophy in both eyes.
2.2. CRISPR/Cas9 Gene Editing and iPSC Culture
The generation of FRIMOi001-A (PDE6A_mutant) and FRIMOi007-A (PDE6C_mutant) human iPSC lines was described in Riera et al., 2019, and Domingo-Prim et al., 2019, respectively [
18,
19]. Isogenic iPSC lines were established through CRISPR/Cas9-mediated correction as described in Siles et al., 2025, and Siles et al., 2023, respectively [
20,
21].
Briefly, sgRNAs and ssODNs were designed using the Invitrogen TrueDesign Genome Editor (Thermo Fisher Scientific, Waltham, MA, USA) and are the following: PDE6A sgRNA 5′-3′TCAGTCTTGACTCAATTTCT, PDE6A ssODN 5′-3′GTCTCTGATTCCTCCTTTCTTTCTTTTTCAGTCTTTGACTCAATTTCTCGGCTGGTCTGTCTTAAATCCTGACACCTAT, PDE6C sgRNA 5′–3′ AATTGTGGTAAGTGACAGCT, and PDE6C ssODN 5′–3′ TACCAGATGGATGTACACTGTGAGGAAAGGGTATCGAGCTGTCACTTACCACAATTGGCGGCATGGGTTCAACG. For gene editing, 1 × 10⁵ iPSCs were electroporated (Neon, Thermo Fisher Scientific) with two pulses of 20 ms at 1200 V for transfection with 10 pmol sgRNA, 15 pmol ssODN, and 10 pmol High-Fidelity (HiFi) SpCas9 protein (Thermo Fisher Scientific) as ribonucleotide particles. The iPSCs were seeded onto Matrigel-coated dishes and cultured in StemFlex medium supplemented with 10 μM ROCK inhibitor (Merck, Bedford, MA, USA), 10 μM of the HDR activator L755507 (Merck), and 0.5 μM of NHEJ inhibitor M3814 (Selleckchem, Houston, TX, USA) for 24 h. Individual clones were picked and cultured individually in 96-multiwell plates and Sanger-sequenced (Macrogen, Madrid, Spain) to assess gene editing outcomes. The iPSCs were routinely maintained on Matrigel-coated dishes (Merck) in Stem Flex Medium (Thermo Fisher Scientific) and were renewed with fresh medium every two days. Passages were performed with 0.5 mM EDTA (Invitrogen, Carlsbad, CA, USA).
2.3. Characterization of Human iPSCs
Mutant and corrected clones were characterized to ensure genomic stability and proper differentiation potential.
For lineage differentiation, the cells were seeded into Matrigel-coated plates, and when the desired confluence was reached, the cells were cultured in differentiation medium using the Human Pluripotent Stem Cell Functional Identification Kit (R&D Systems, Minneapolis, MN, USA) according to the manufacturer’s instructions. Karyotype analysis was performed on twenty G-banded metaphase cells at 300-band resolution (Reference Laboratory S.A., Barcelona, Spain).
2.4. Differentiation of iPSC into Retinal Organoid
ROs were generated using two distinct 2D-3D differentiation protocols. In order to study the rod-specific protein PDE6A, the ROs were produced following the protocol described by Sanjurjo-Soriano et al. 2022 [
22]. For the cone-specific studies of PDE6C, ROs were obtained using the protocol described by Gonzalez-Cordero et al. 2017 [
23]. Briefly, the ROs were generated from the iPSCs. To minimize variability between differentiations and lines, we carefully standardized the initial seeding conditions: all differentiations were initiated at 90% confluence, using the same cell density for each iPSC line, ensuring consistent starting conditions across all experiments. This resulted in the formation of neuroretinal vesicles (NRVs), which were manually isolated between weeks 4 and 7 and cultured individually in low-attachment plates under free-floating conditions. Organoid maturation was achieved through stage-specific supplementation with fetal bovine serum (FBS), taurine, N-2 supplement, B-27 supplement, and retinoic acid (RA), with protocol-specific differences in the timing of supplementation and proneural induction steps. Between three and four independent RO differentiations were carried out.
2.5. Quantification of NRVs, Non-Retinal Regions, and Retinal Organoids
Structures were classified as NRVs or non-retinal regions based on predefined morphological criteria [
23]. NRVs were identified as well-organized, phase-bright vesicular structures with a defined border and characteristic neuroepithelial-like morphology. In contrast, non-retinal regions were defined as irregularly shaped, poorly organized structures lacking a defined border and typical NRV morphology.
NRVs and non-retinal regions were quantified by manual counting from culture images acquired at each time point. For each cell line and time point, 6–10 randomly selected fields per differentiation were analyzed. Three independent differentiations were included for each of the two mutant lines and the corrected line, and two independent differentiations for the control line.
The total number of structures per field was recorded, and the proportion of each category was calculated. For each cell line and time point, data were expressed as the percentage of NRVs and non-retinal regions relative to the total number of structures (NRVs + non-retinal aggregates), which was set to 100%. The results were represented graphically, with NRVs shown in gray and non-retinal regions in white. All the analyses were performed using consistent criteria across conditions.
The size of the NRVs was measured using ImageJ software 1.53k (NIH, Bethesda, MD, USA). For each vesicle, the longest axis (diagonal) was traced and recorded as the diameter. Measurements were performed using consistent criteria across all conditions. A total of 20–100 NRVs per line per time point were measured, pooled from 6 to 10 randomly selected fields across 2–3 independent differentiations.
ROs exhibiting POS or lacking POS were quantified by manual counting from culture images acquired at day 245 of differentiation. Thirty organoids per cell line were analyzed. The data were expressed as percentages of POS-positive (POS+) and POS-negative (POS−) organoids (total set to 100%). The results were plotted with POS+ organoids shown in gray and POS− organoids in white. Analyses were performed using consistent criteria across all conditions.
2.6. Organoid Fixation and Cryosectioning
The ROs were rinsed twice with phosphate-buffered saline (PBS, Thermo Fisher Scientific) and fixed in 4% paraformaldehyde (PFA, Thermo Fisher Scientific) for 15 min at 4 °C. After fixation, the organoids were washed three times with PBS, and incubated in 30% sucrose (in PBS) at 4 °C. On the following day, the ROs were pre-stained with trypan blue (20 min) to aid visualization during cryosectioning. Embedding molds were embedded in O.C.T. mounting media (VWR International, Radnor, PA, USA), placed on dry ice, and stored at −80 °C. Cryosections were prepared at 14 µm thickness using a cryostat.
2.7. Immunostaining and Quantitative Analysis
The iPSCs were fixed in 4% PFA in PBS for 15 min at 4 °C and washed twice with PBS. The RO cryosections and fixed iPSCs were permeabilized with 0.25% Triton X-100 (Merck) (15 min, room temperature, RT), and washed and blocked with 5% FBS and 0.5% Tween-20 (Thermo Fisher Scientific) in PBS for 1 h at RT. Primary antibodies (
Table S1) were incubated overnight at 4 °C in the same blocking solution. The day after, the samples were washed twice with PBS and incubated with secondary antibodies (
Table S1) for 1–2 h at RT and counterstained with DAPI (Thermo Fisher Scientific). Immunofluorescence imaging was acquired on a Zeiss Axiovert microscope equipped with an Axiocam 503 mono camera (Carl Zeiss Inc., Jena, Germany), and images were processed using ImageJ software 1.53k (NIH, Bethesda, MD, USA).
Quantitative analysis was performed by defining regions of interest corresponding to the inner segments/outer segments (IS/OS), outer nuclear layer (ONL), and inner nuclear layer (INL), based on morphological features and the layer borders delineated by dashed lines in the figures. Measurements were performed on at least three independent samples per staining, ensuring consistency across experimental conditions. Mean fluorescence intensity was measured for each region using identical acquisition and analysis settings across all experimental conditions.
2.8. RT-PCR and qPCR
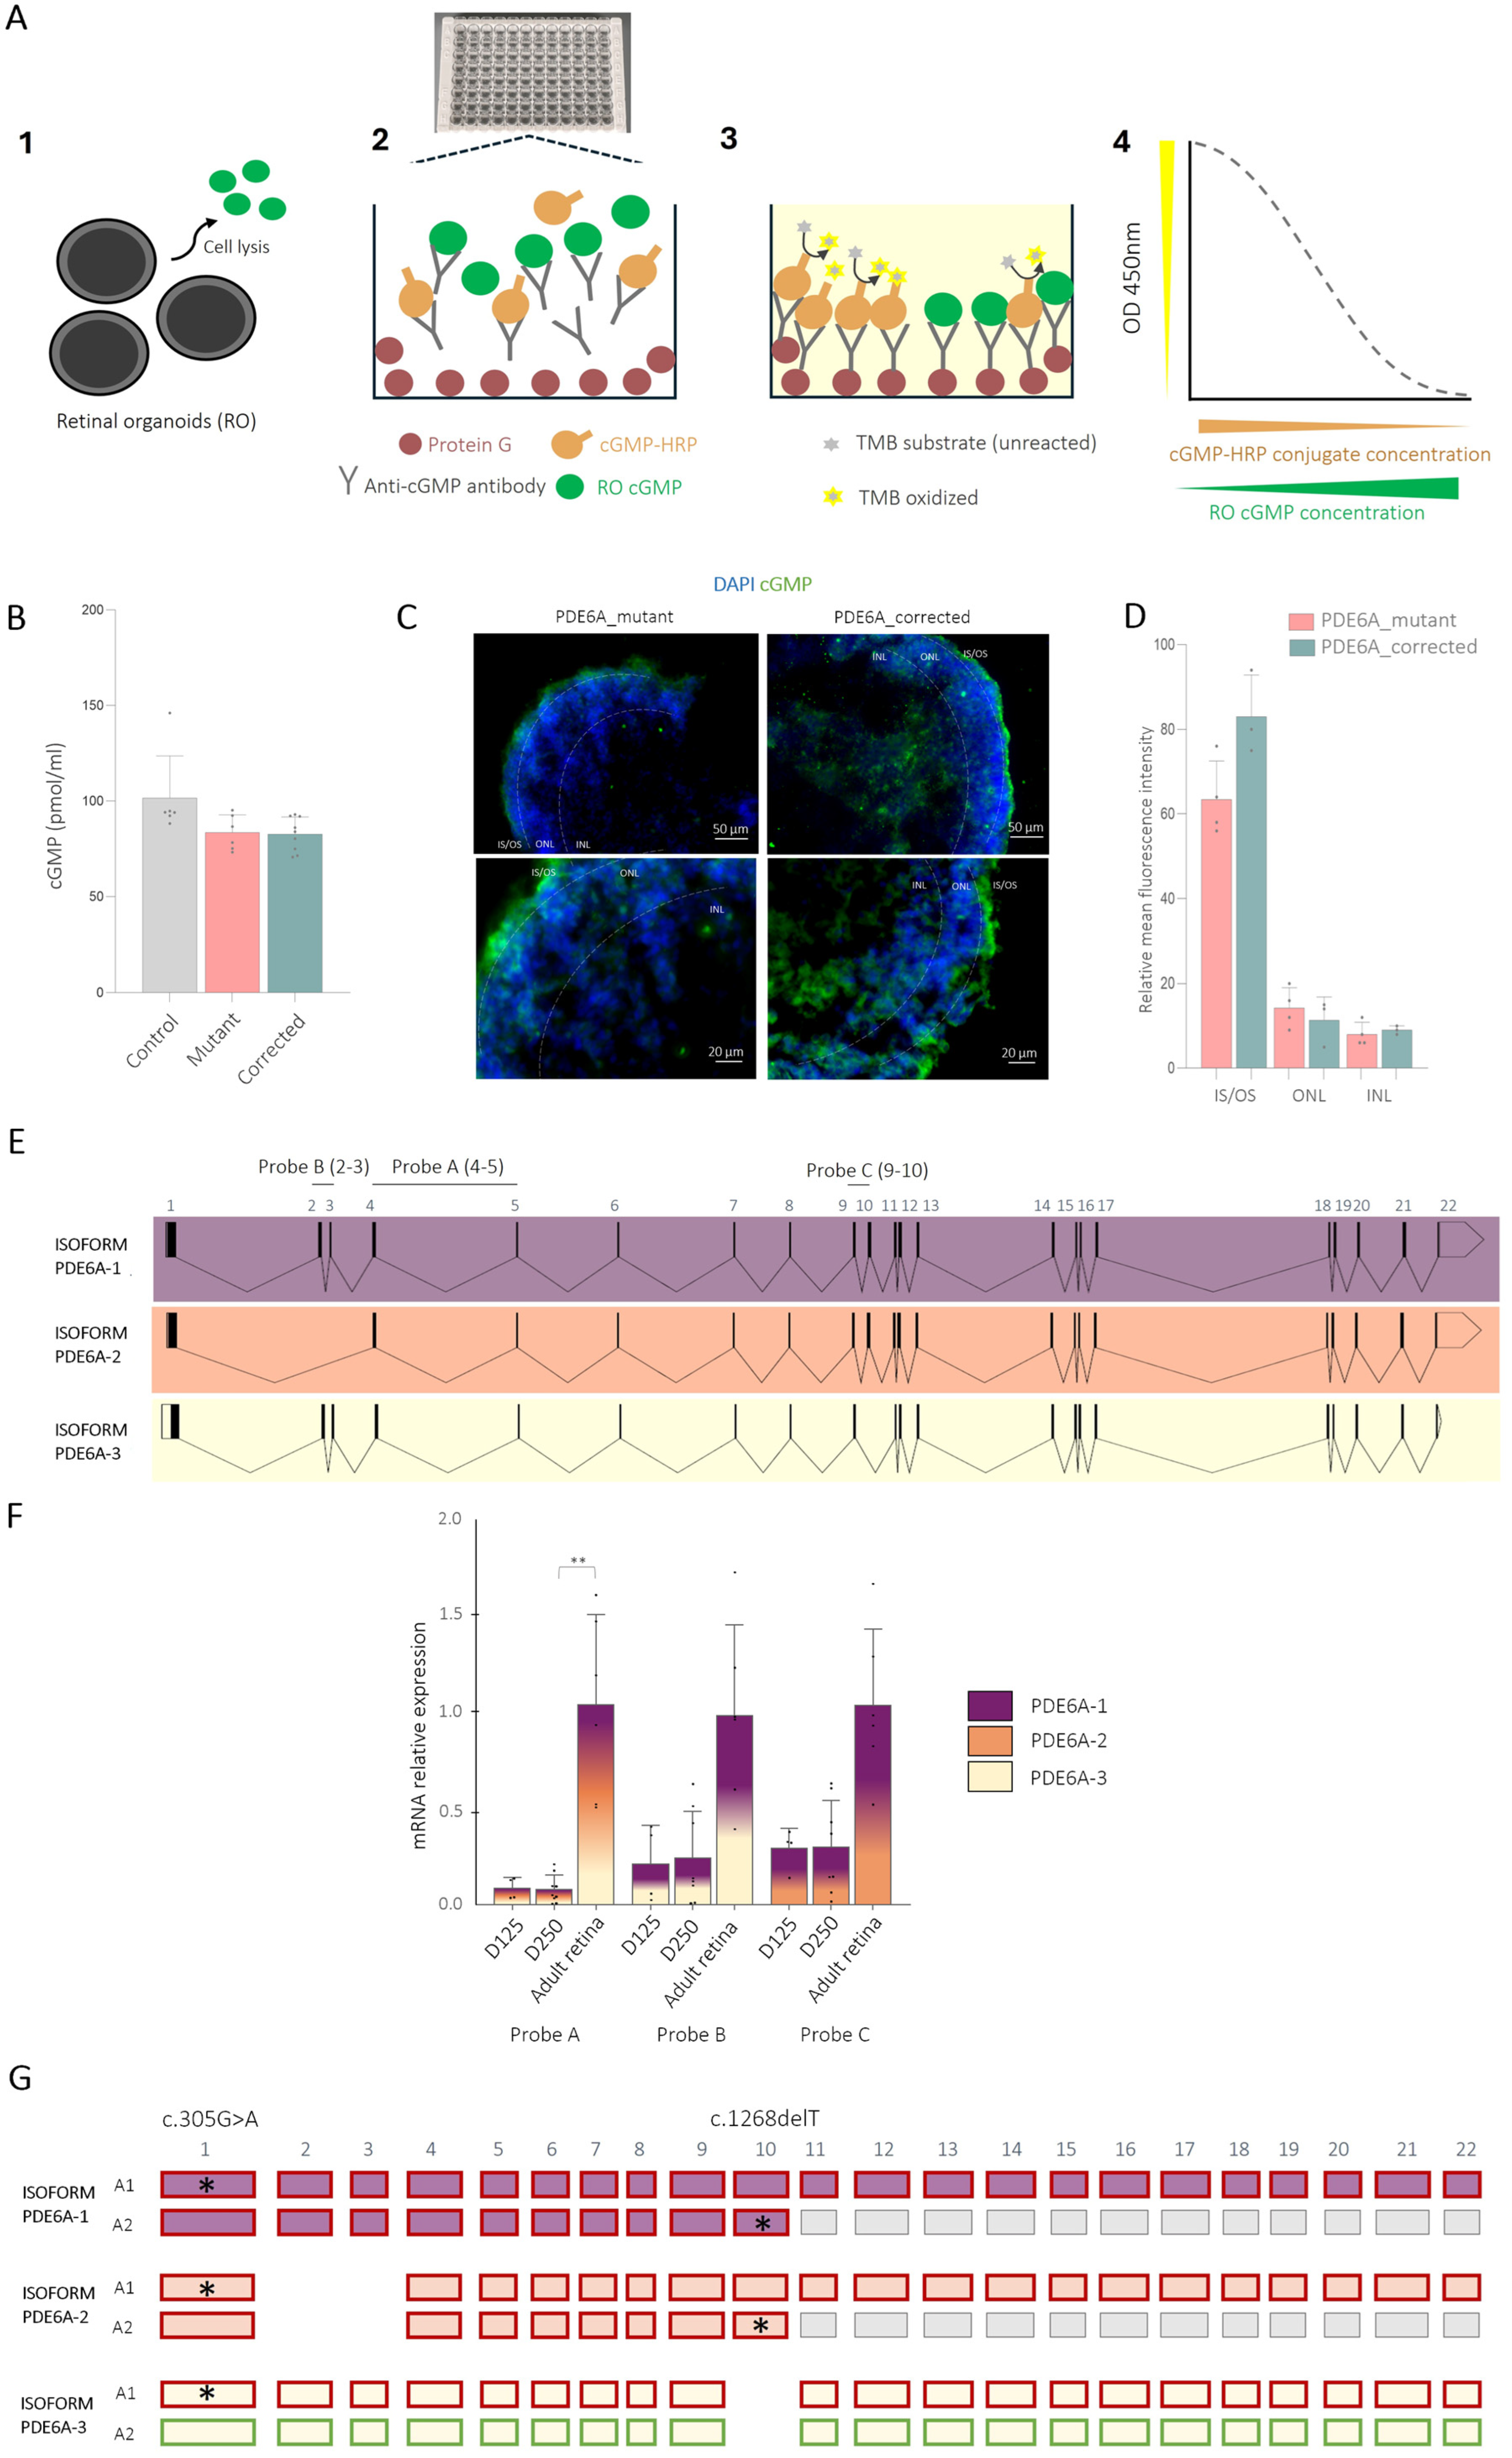
Total RNA from 1 to 2 ROs or from iPSC samples was isolated using TRIzol (Thermo Fisher Scientific) following the manufacturer’s instructions. RNA concentration was determined using a Qubit 3.0 fluorometer. Each RNA sample consisted of 1–2 pooled organoids representing one biological replicate from independent differentiations. First-strand cDNA was synthesized from 0.25 µg of total RNA with the Transcriptor First Stand cDNA Synthesis Kit (Roche Diagnostics, Basel, Switzerland). Commercial retinal cDNA acquired from a 77-year-old human donor was sourced from BioChain Institute Inc. (Newark, CA, USA). Relative quantification was performed using TaqMan Gene Expression master mix in QuantStudio 3 (Thermo Fisher Scientific). Three PDE6A TaqMan probes were used to detect the region spanning exons 4–5 (Hs00959619_m1), the exon 2–3 boundary (Hs00959617_g1), and the exon 9–10 junction (Hs00959624_m1). These probes are referred to throughout the text as Probes A, B, and C, respectively. Gene expression values were normalized to the housekeeping gene glyceraldehyde-3-phosphate dehydrogenase (GAPDH, Hs02758991_g1) using the ΔΔCt (delta Ct) method.
2.9. Retinal Organoid Protein Quantification and Cyclic GMP Measurement
RO protein was extracted with 0.1 M HCl and homogenized by vortex agitation. The samples were incubated during 20 min at 4 °C, then centrifuged for 10 min, 1000× g, and the supernatant was quantified using the Pierce Detergent Compatible Bradford Assay Kit (Thermo Fisher Scientific), following the manufacturer’s instructions. The same supernatant was then used for cGMP quantification using the cGMP Direct Immunoassay Kit (Abcam, Cambridge, UK), following the manufacturer’s instructions. Briefly, the assay is based on a competitive ELISA in which cGMP extracted from an RO competes with an HRP-conjugated cGMP tracer for binding to a cGMP-specific antibody. Upon the addition of a TMB substrate, HRP catalyzes its oxidation, generating a colorimetric signal quantified by measuring absorbance at 450 nm. Therefore, the OD450 nm intensity is directly proportional to the amount of cGMP-HRP and inversely proportional to the cGMP levels in the RO. The samples were acetylated prior to absorbance measurement using the Varioskan™ LUX multimode microplate reader (Thermo Fisher Scientific). cGMP concentrations were calculated from a standard curve generated using known cGMP standards, with background subtraction applied. cGMP levels were normalized to total protein content. The data are expressed as mean values ± SD from one experiment including three independent samples, each derived from two independent differentiations and measured in technical triplicates. Each sample contained at least three ROs.
2.10. DynaMut2 Prediction
DynaMut2 was employed to evaluate the structural and dynamic effects of the identified pathogenic variants in PDE6A and PDE6C (using the DynaMut2 web server, version 2.0).
2.11. Statistical Analysis
Statistical analysis was performed using the non-parametric Kruskal–Wallis test to compare patients, isogenic controls, and control lines with Prism 9.3.1 (Graph Pad Software, La Jolla, CA, USA). A statistically significant difference was defined as p < 0.05 (ns p > 0.05). The results were expressed as mean ± SD.
4. Discussion
Despite the identification of numerous pathogenic genes associated with inherited retinal dystrophies, effective therapies for most retinal degenerations remain limited. In recent years, disease modeling has emerged as a powerful approach for investigating human retinal development and disease mechanisms. ROs recapitulate key aspects of human retinal architecture through the final stages of development and exhibit all major retinal cell types, expressing appropriate neuronal markers. In this work, two IRDs, retinitis pigmentosa and achromatopsia, were modeled using iPSC-derived ROs from patients carrying mutations in PDE6A and PDE6C, respectively. In parallel, phenotypic rescue was assessed using isogenic control lines generated through CRISPR/Cas9-mediated genome editing, allowing for the direct evaluation of mutation-specific effects.
The patient-specific PDE6A mutations were associated with altered early stages of retinal organoid development, as evidenced by impaired neuroretinal vesicle formation and reduced vesicle growth. Given that PDE6A expression is restricted to rod photoreceptors at later developmental stages, the mechanism underlying this early phenotype remains unresolved and may involve indirect effects on neuroepithelial organization. Although RO differentiation was initiated in all the studied lines, the mutant one exhibited an increased proportion of non-retinal, forebrain-like regions during early differentiation. Importantly, this phenotype was consistently observed in a second patient-derived iPSC clone and was rescued upon CRISPR/Cas9-mediated correction, demonstrating that the observed defects were mutation-dependent rather than attributable to intrinsic properties of the patient iPSCs. Despite these early developmental alterations in mutant lines, both the mutant and control lines expressed key retinal progenitor markers and retained the capacity to differentiate into mature RPE cells. These findings indicate that PDE6A mutations are associated with early developmental differences in RO organization.
Regarding the mature mutant ROs, a subset of them did not properly develop POSs, whereas the rest successfully generated them, exhibiting normal photoreceptor morphology, PDE6A expression and localization, and cGMP levels, compared to the controls. Notably, the presence of functionally competent ROs within the mutant population may help explain the clinical stability observed in the patient during adulthood.
To further contextualize the phenotypic variability observed in the mature ROs, and in light of the early developmental alterations observed in the PDE6A_mutant organoids, we examined the developmental regulation of the
PDE6A transcript isoforms. The analysis revealed shifts in isoform expression during organoid maturation, with alternative splice isoforms (non-canonical) becoming more prominent at later maturation stages. In the RP cell line analyzed here, the compound heterozygous variants affecting exons 1 and 10 are predicted to impact multiple
PDE6A isoforms, whereas the skipping of exon 10 in the
PDE6A-3 isoform may preserve residual protein function. These findings may suggest that
PDE6A mutations primarily affect early retinal development, consistent with the defects in NRV formation and limited vesicle growth. In contrast, the partial preservation observed at later stages in a subset of mature mutant ROs may reflect developmental changes in
PDE6A isoform expression and could contribute to phenotypic variability. Consistent with this, we did not observe a marked accumulation of cGMP in the PDE6A_mutant ROs, in contrast to the animal models of complete PDE6A loss, in which retinal cGMP levels are significantly elevated in affected retinas and photoreceptor degeneration is linked to cGMP dysregulation [
29]. One plausible explanation for this difference is that residual PDE6A activity, potentially supported by exon-skipping transcripts and partial function of the missense allele, is sufficient in this system to maintain cGMP homeostasis despite other aspects of dysfunction. These considerations suggest that variant-dependent residual function and isoform expression patterns can influence both morphological and biochemical phenotypes in human retinal organoids.
Importantly, the potential for residual PDE6A function underscores the relevance of developmental timing and isoform-specific expression for therapeutic interventions, as strategies targeting canonical versus alternative isoforms may have differential efficacy depending on the stage of the disease.
In the PDE6C-associated achromatopsia RO model, the mutant and control cell lines were differentiated efficiently into mature ROs and expressed comparable levels of rod- and cone-specific markers. However, the mutant ROs exhibited a pronounced mislocalization of PDE6C, with the protein abnormally distributed throughout multiple retinal layers rather than being restricted to the inner and outer segments, as observed in the corrected and wild-type ROs. Functionally, this mislocalization was associated with elevated and abnormally distributed cGMP levels, consistent with the reduced catalytic efficiency of PDE6C. Prolonged cGMP accumulation is expected to maintain CNG channels in an open state, promoting pathological Ca
2+ influx and thereby creating a toxic intracellular environment that may predispose cones to degeneration [
30].
Importantly, the correction of the PDE6C mutation in the isogenic clones restored proper protein localization and normalized cGMP distribution, closely resembling the wild-type organoids. Notably, the rescue of PDE6C function was achieved upon monoallelic correction, consistent with the autosomal recessive inheritance of achromatopsia and indicating that a single functional PDE6C allele is sufficient to sustain cone photoreceptor function.
Previous studies using
PDE6A- and
PDE6C-mutant animal models have reported therapeutic benefits following gene replacement. Notably, in canine models of PDE6A-linked retinitis pigmentosa, gene supplementation using AAV vectors partially restored retinal structure and function [
31,
32]. More recently, subretinal delivery of AAV8.hPDE6A was evaluated in patients with
PDE6A-associated RP [
33,
34], although no functional improvements were detected within the first year of follow-up. These findings suggest that isoform selection and the timing of intervention may critically influence therapeutic efficacy. For PDE6C, a spontaneous non-human primate achromatopsia model carrying a missense mutation recapitulates key features of ACHM, including photophobia-like behavior and macular abnormalities [
35]. Although the mutant PDE6C protein was expressed and correctly localized, it failed to hydrolyze cGMP. Notably, recent AAV-mediated gene supplementation partially restored cone function in this model [
36], highlighting the translational potential of gene-based approaches for
PDE6C-associated disease.
Despite advances made in animal models, patient-derived ROs provide a complementary and indispensable platform for translational research. This approach preserves the complete genetic background of each patient, and the use of isogenic controls enables the direct attribution of observed phenotypes to specific pathogenic variants. Furthermore, standardized protocols for RO generation are increasingly available. Notably, the successful phenotypic rescue observed in the isogenic control lines underscores the promise of gene editing strategies as potential therapeutic approaches for these patients.
In conclusion, our findings directly link the disease-associated phenotype to specific PDE6A or PDE6C variants, underscoring the value of retinal organoids to elucidate disease mechanisms and advancing personalized therapeutic strategies for inherited retinal dystrophies.