1. Introduction
Transaction speed and cost are defining competitive dimensions of all financial markets. Equity markets have long set the standard, offering free commissions and millisecond execution for retail orders,
https://www.fidelity.com/trading/execution-quality/overview, accessed on 1 September 2026. Recent Ethereum blockchain upgrades are enabling the Mainnet and its adjacent Layer 2 networks (L2s) to close the gap with traditional financial markets and the fastest blockchains, most notably Solana.
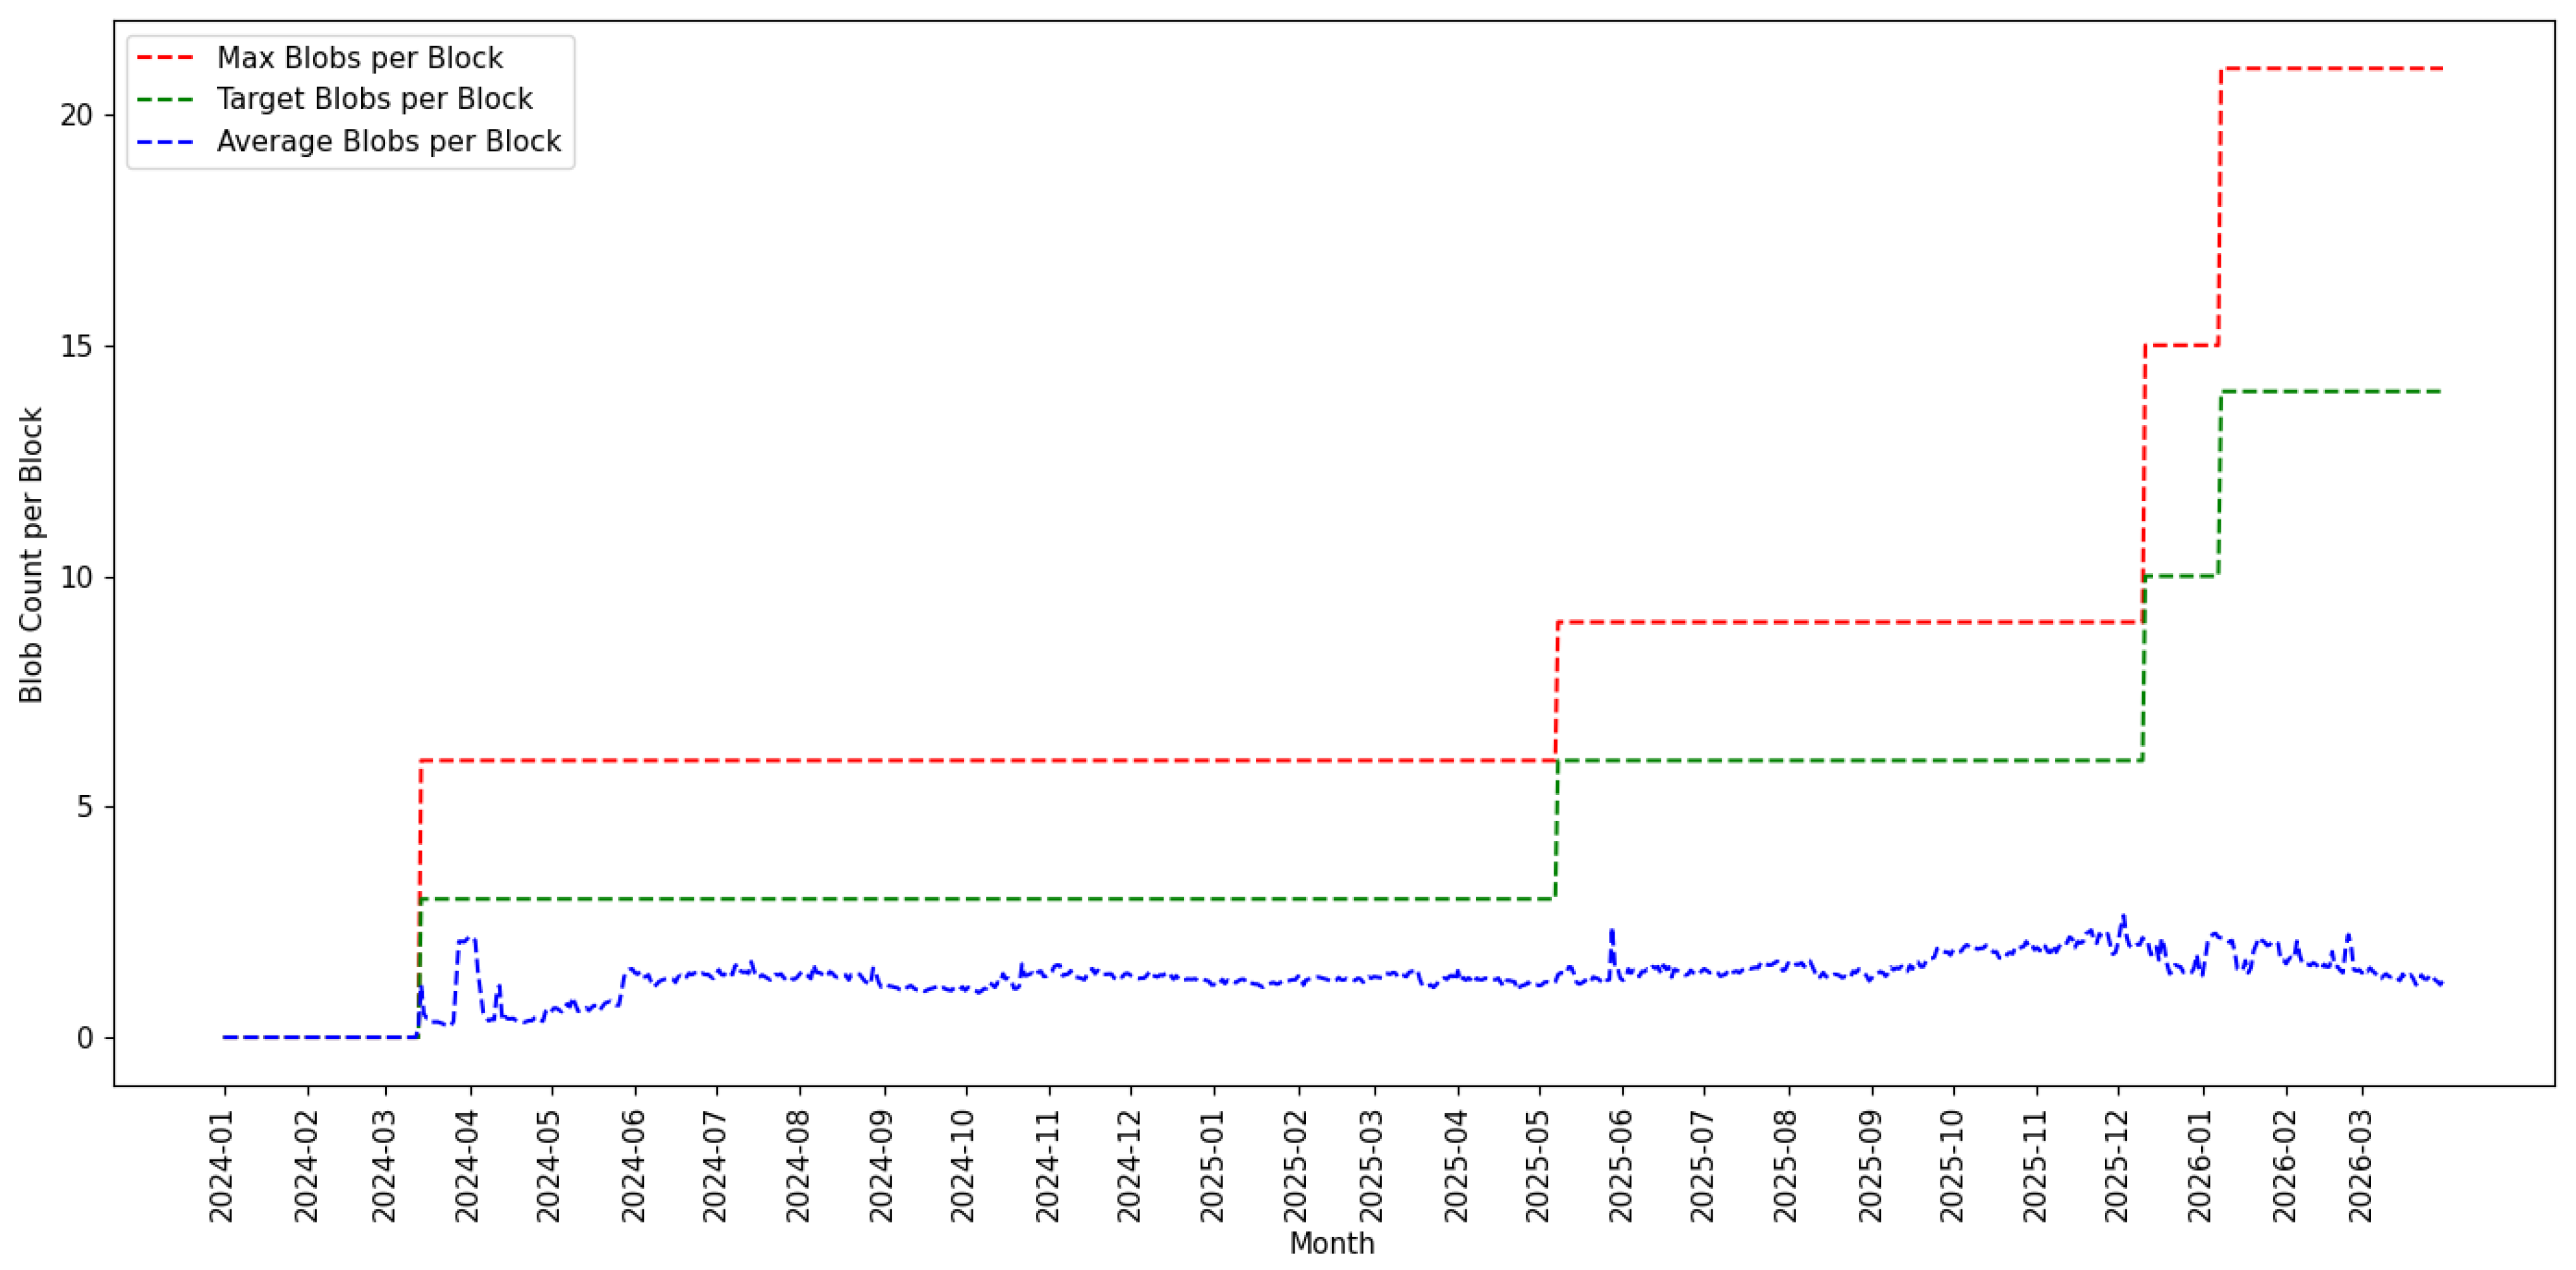
The two key improvements to the Mainnet and its L2s are increased gas limits and the introduction of blobs. A gas limit is defined as the maximum amount of computational work (gas) permitted into a block. The number of transactions that can be contained in a block on the Mainnet is constrained by the gas limit value. Binary Large Objects (blobs), introduced in the Dencun upgrade in March 2024, are the mechanism by which L2s post their compressed transaction data to the Mainnet.
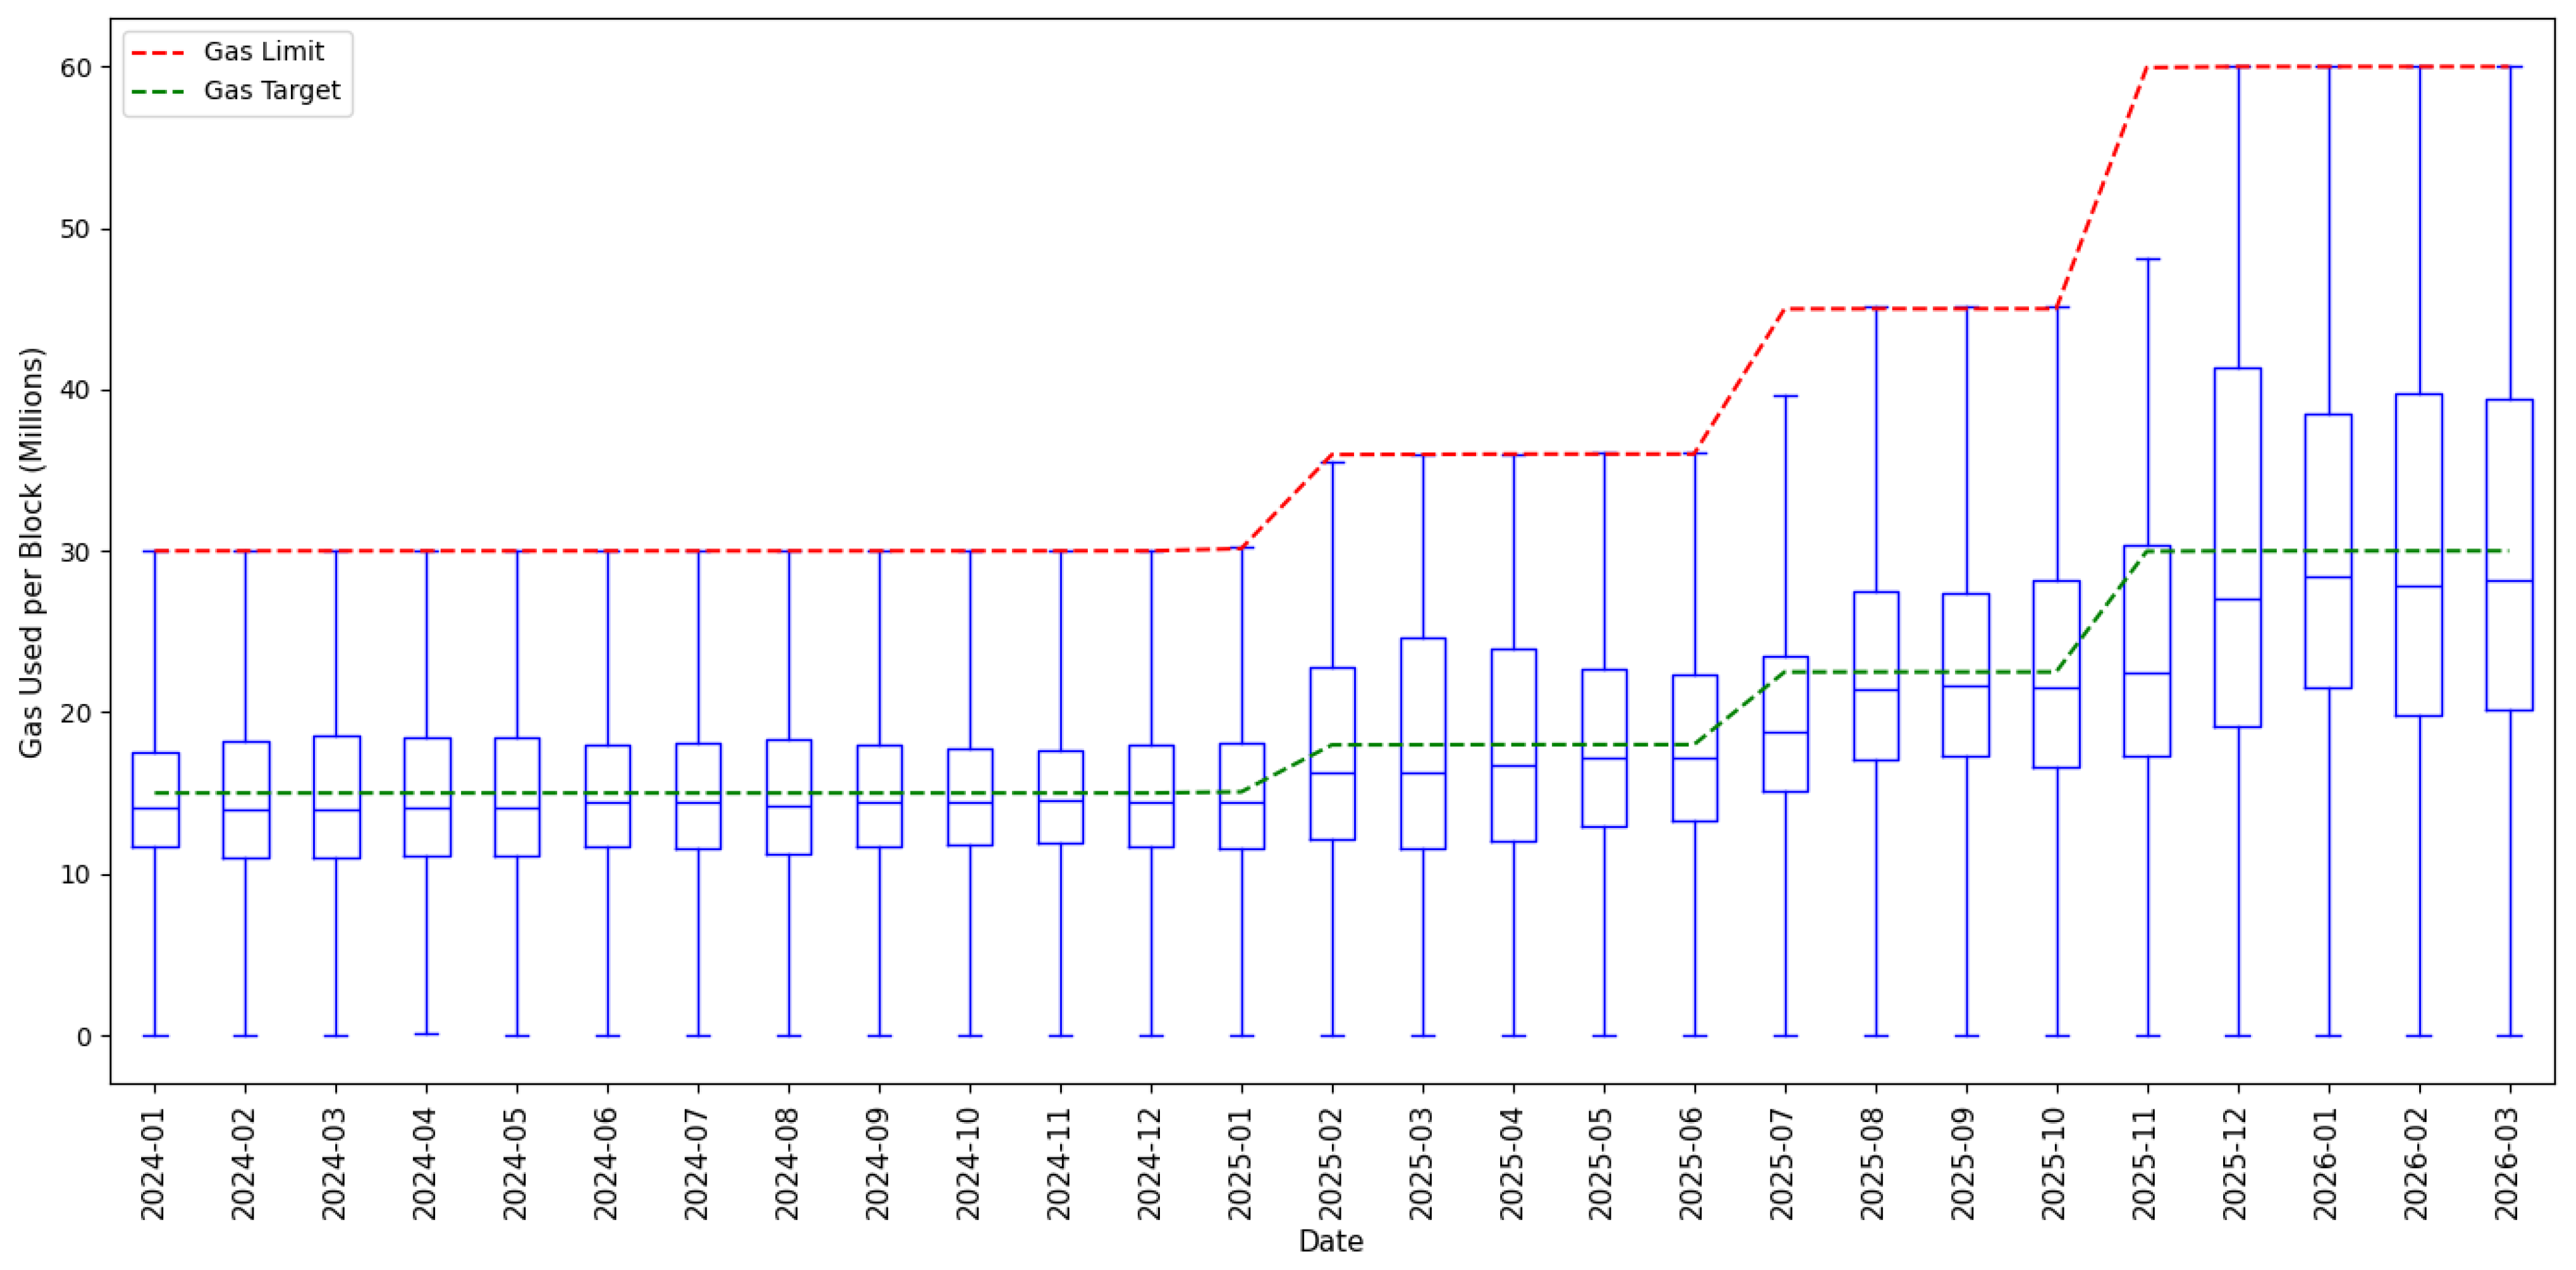
We compare transaction speeds and fees across Ethereum and its L2s with Solana and Polygon, from January 2024 through March 2026. This window captures the impact of the three most recent Ethereum protocol upgrades: Dencun in March 2024, Pectra in May 2025, and Fusaka in December 2025. Two blob-parameter-only (BPO) upgrades, which increase the number of blobs permitted per block, are activated in December 2025 and January 2026. The period also corresponds with significant increases to the block gas limit, rising from a median daily gas limit of 30 million in January 2024 to 60 million by December 2025.
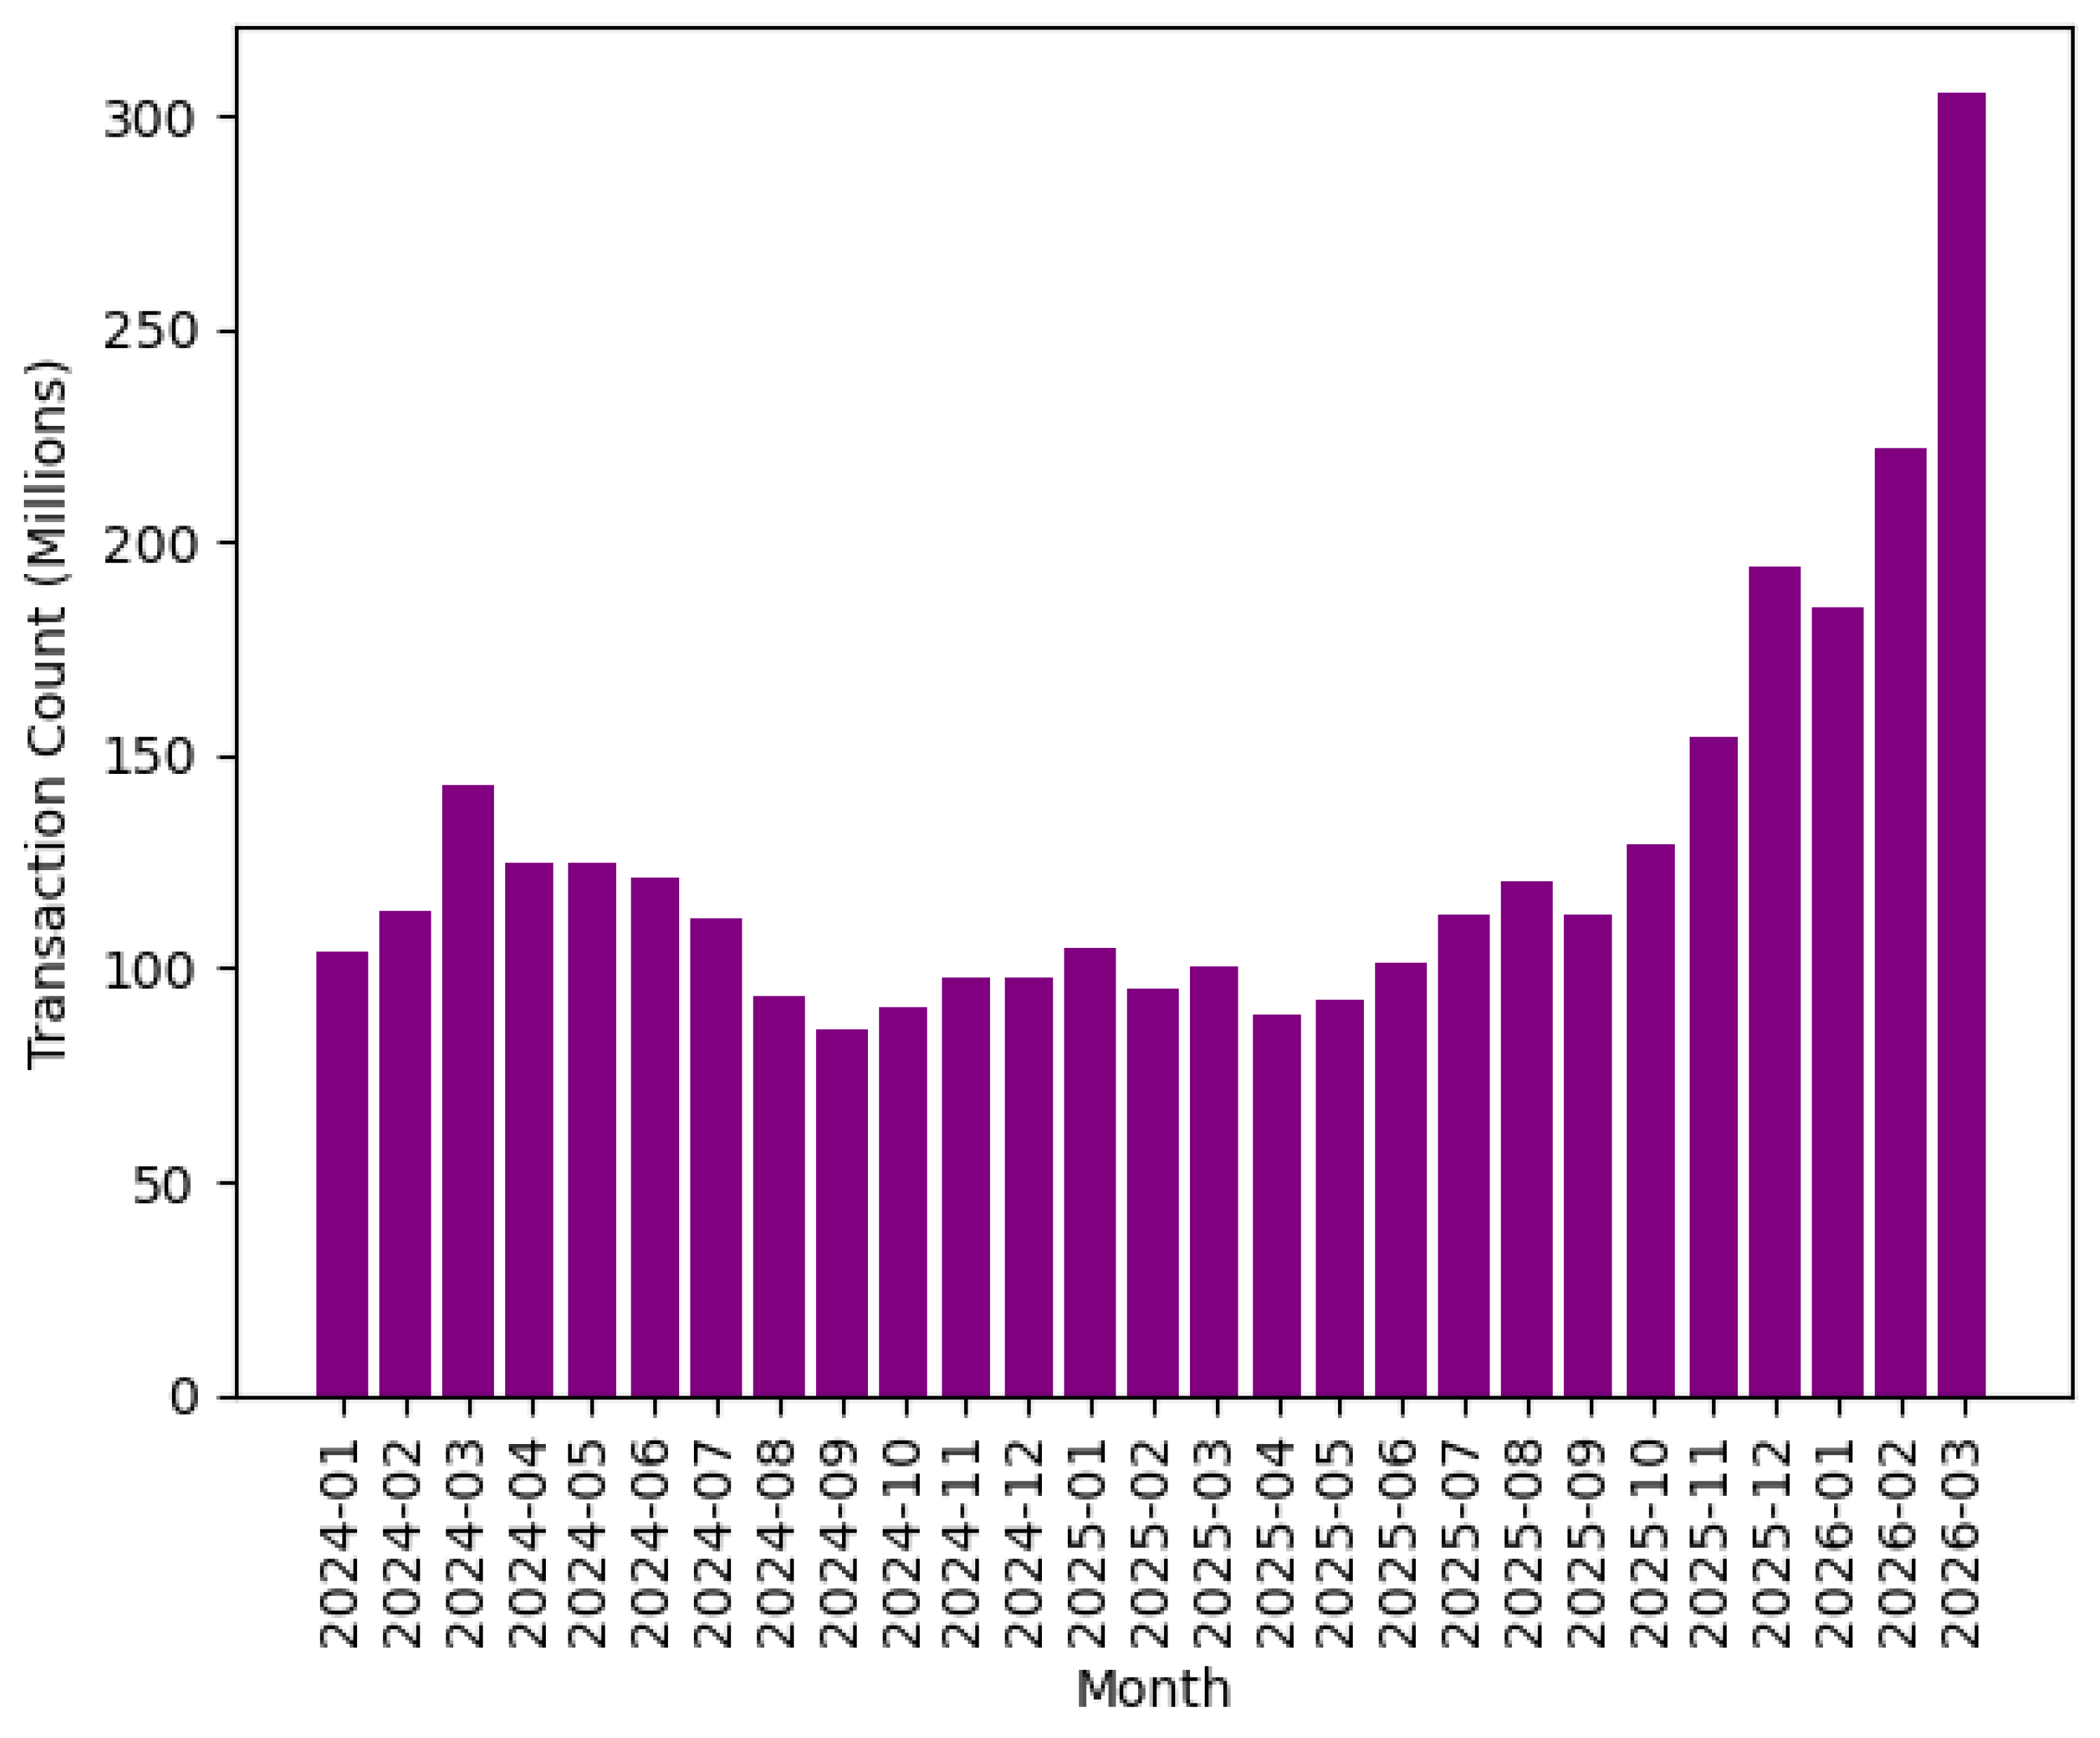
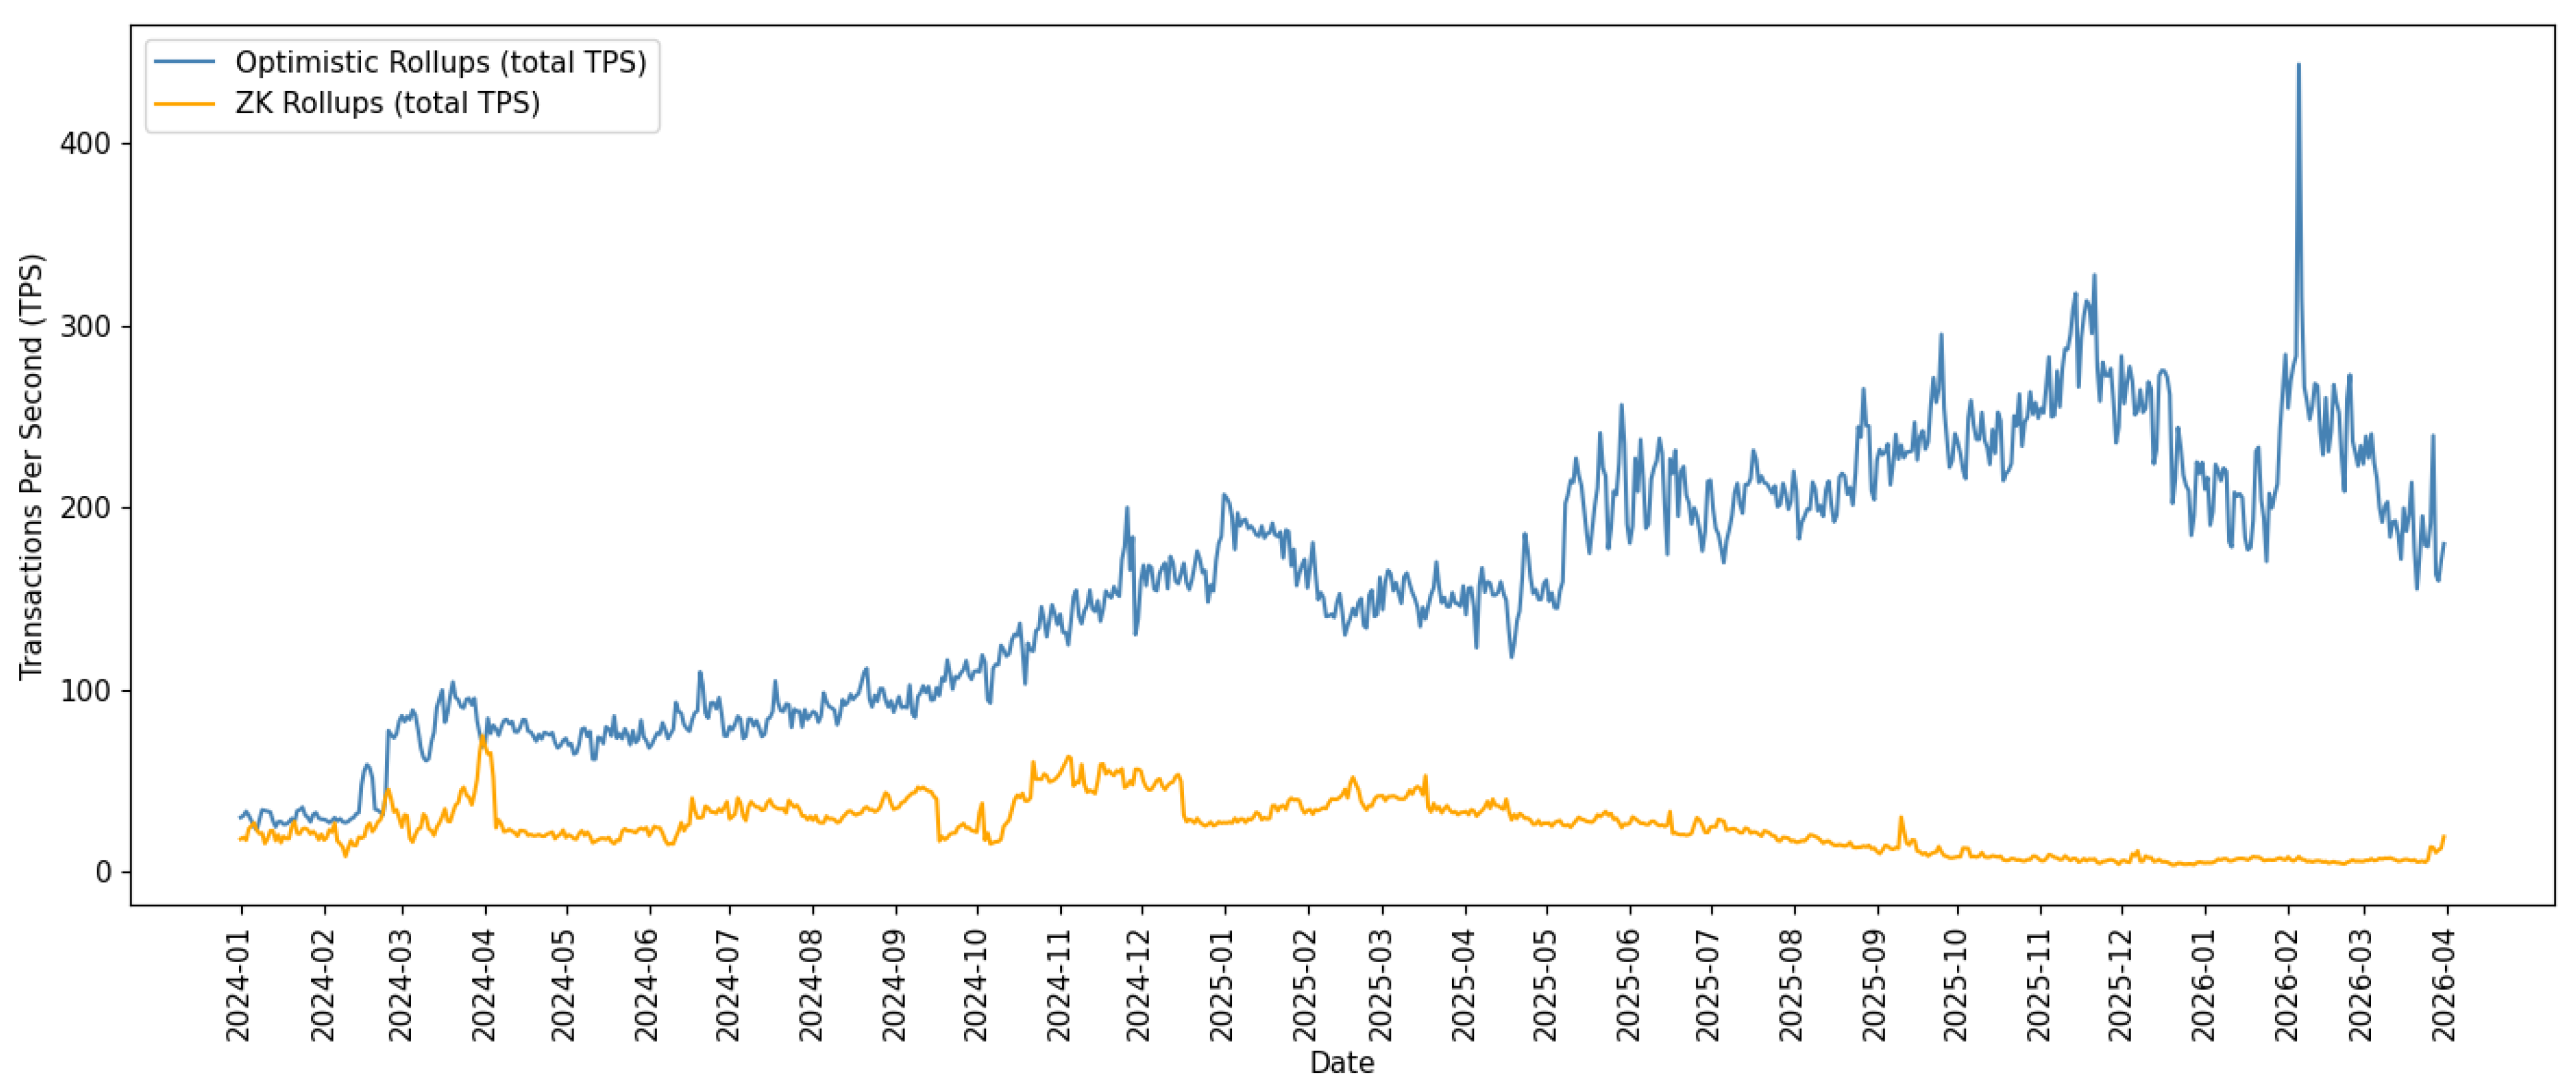
The daily average Mainnet transactions per second (TPS) rose from 13.67 in the first quarter of 2024 (2024 Q1) to 25.78 in the first quarter of 2026 (2026 Q1). The L2 totals rose from 78.60 to 226.92 TPS over the same time period. Solana TPS did not grow as quickly, rising from 804.72 in 2024 Q1 to 1303.46 in 2026 Q1; Polygon rose slightly faster than the Mainnet, rising from 45.72 TPS in 2024 Q1 to 91.51 TPS in 2026 Q1.
There is established literature covering Ethereum transaction speeds, and there are different methods of defining transaction time. Ref. [
1] finds no relationship between the amount of gas and gas price and the delay time in confirming transactions. Studying EIP-1559 [
2], which introduced the base fee, Ref. [
3] finds that the EIP reduced the time between when a transaction enters a mempool and when it is mined. Additionally, they find that, when Ether’s price is volatile, wait times increase. Conversely, Ref. [
4] finds that recent gas prices are the most important feature in explaining block inclusion. Our paper differs from this literature in that we measure transaction speed after block formation.
Ref. [
5] examines the ability of various clients, including Nethermind, to support higher gas limits and concludes that expanded block space increases TPS. Ref. [
6] finds that raising the block gas limit increases the number of transactions per block even at shorter block formation times.
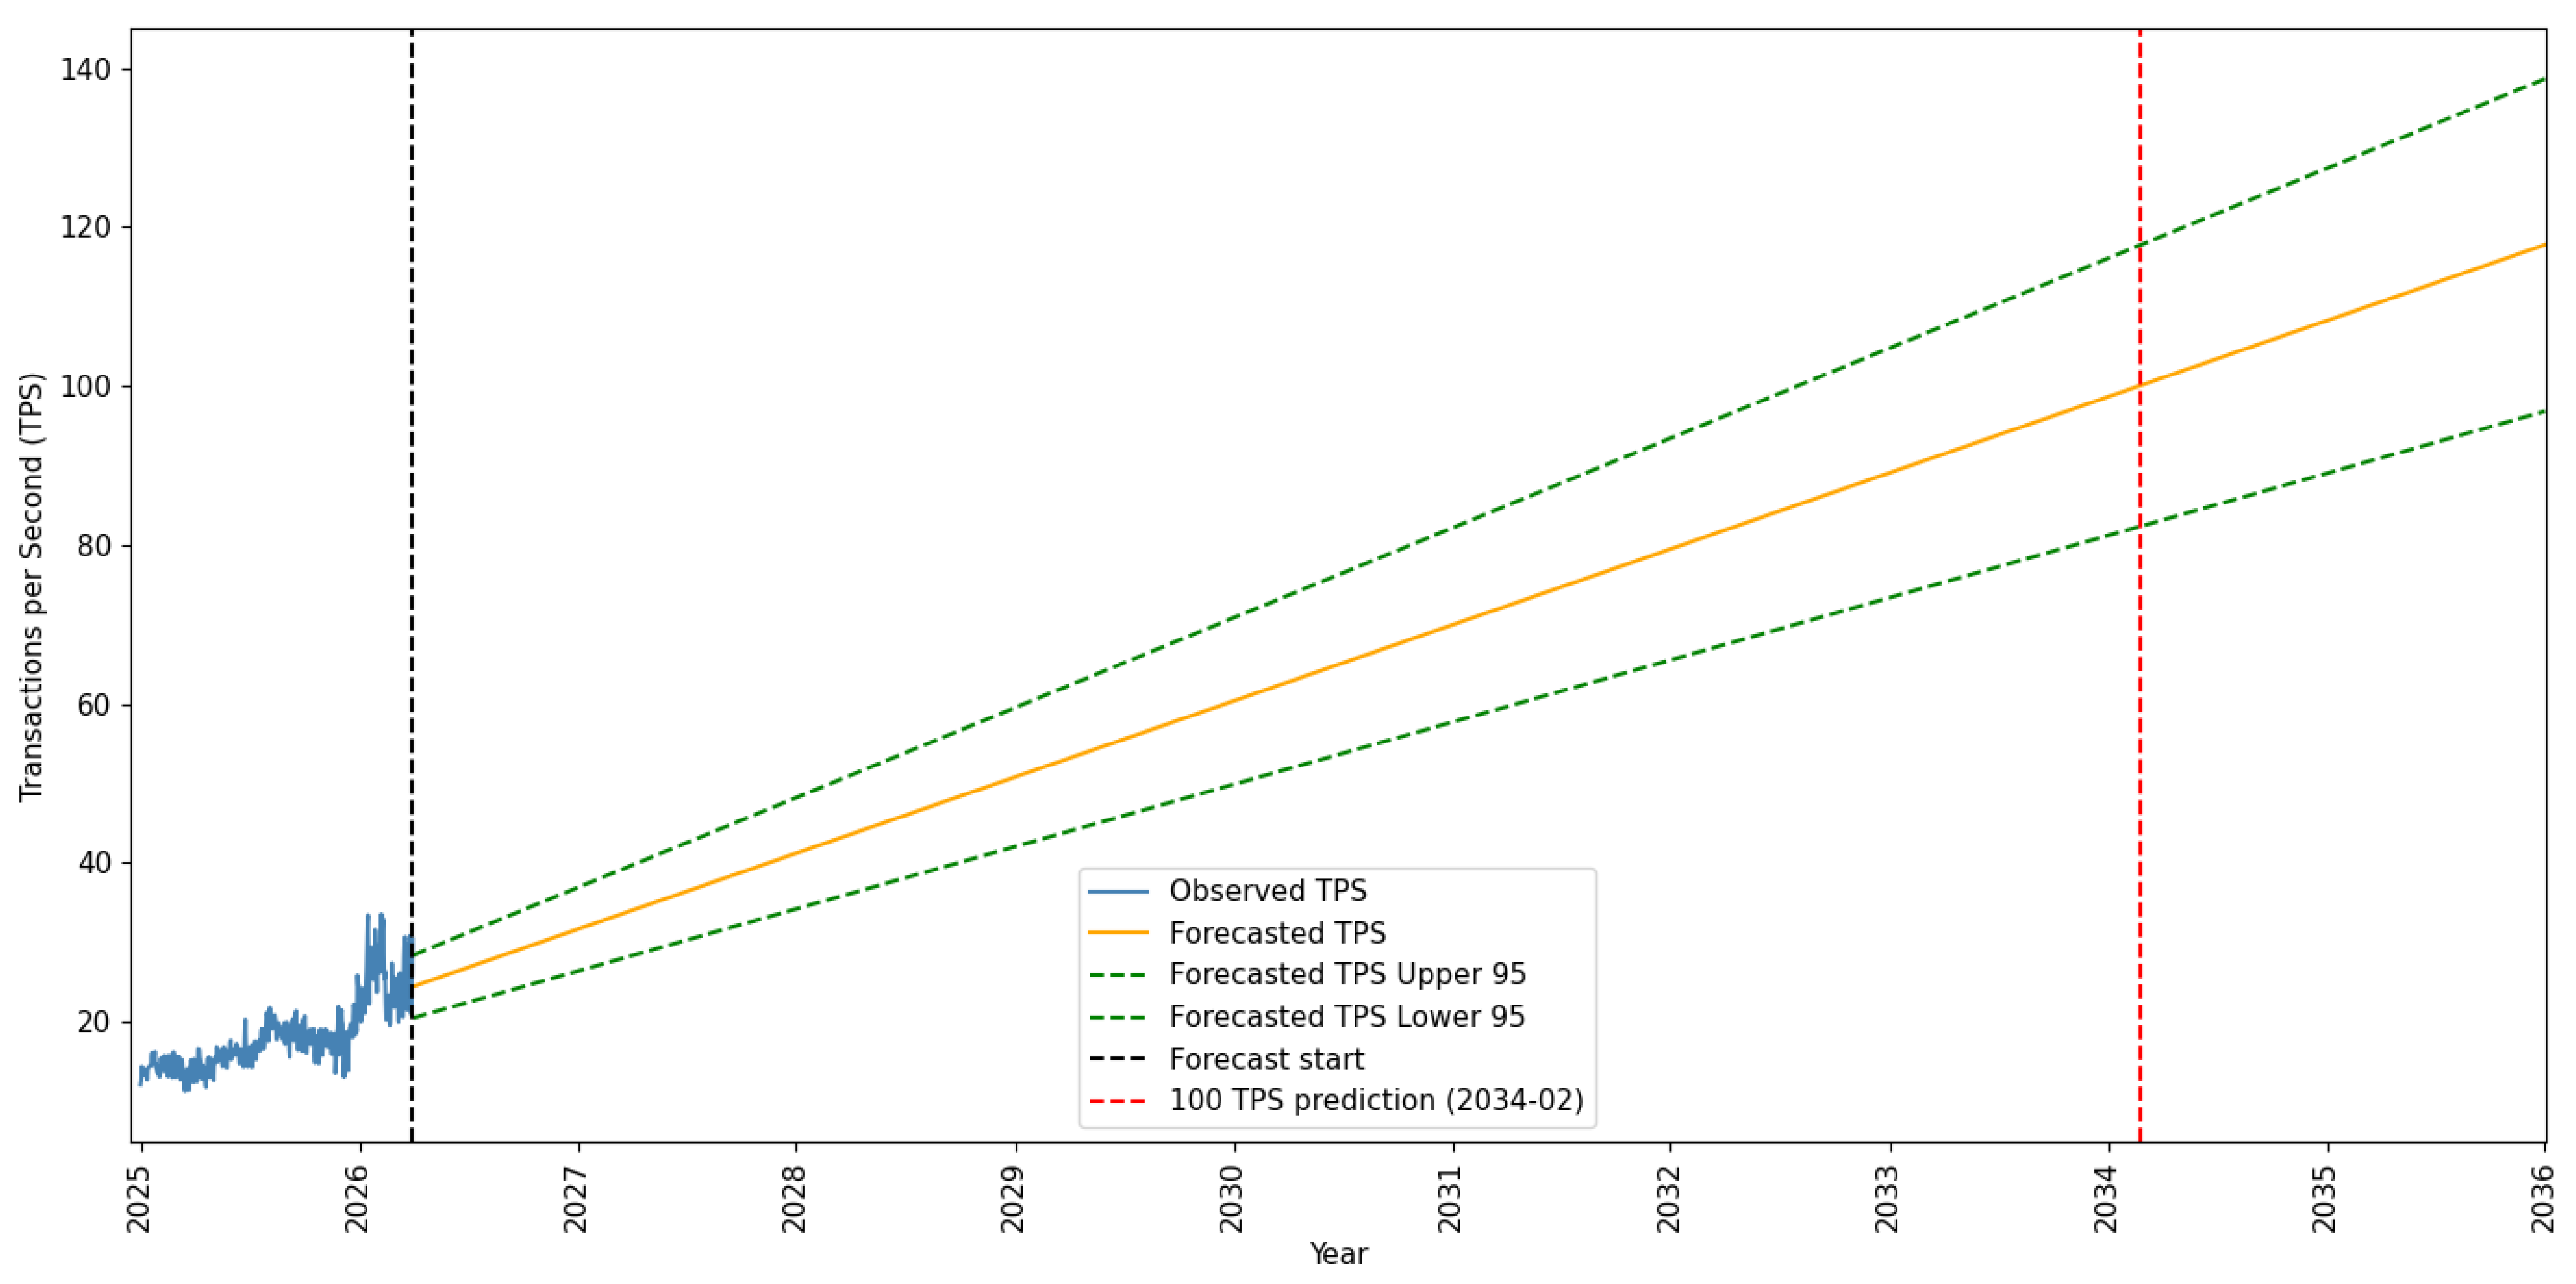
Mainnet speeds are increasing with the block gas limit. We estimate that a ten-million-unit increase in the gas limit is associated with 3.52 more TPS. The Mainnet, even with the gas limit at more than four times the current 60 million, is not projected to reach 100 TPS until February 2034, less than one-tenth of Solana’s current speed.
There are ongoing proposals to increase the gas limit as outlined in the L1 Strawmap,
https://strawmap.org, accessed on 1 September 2026. The Ethereum Improvement Proposal (EIP)-7938 [
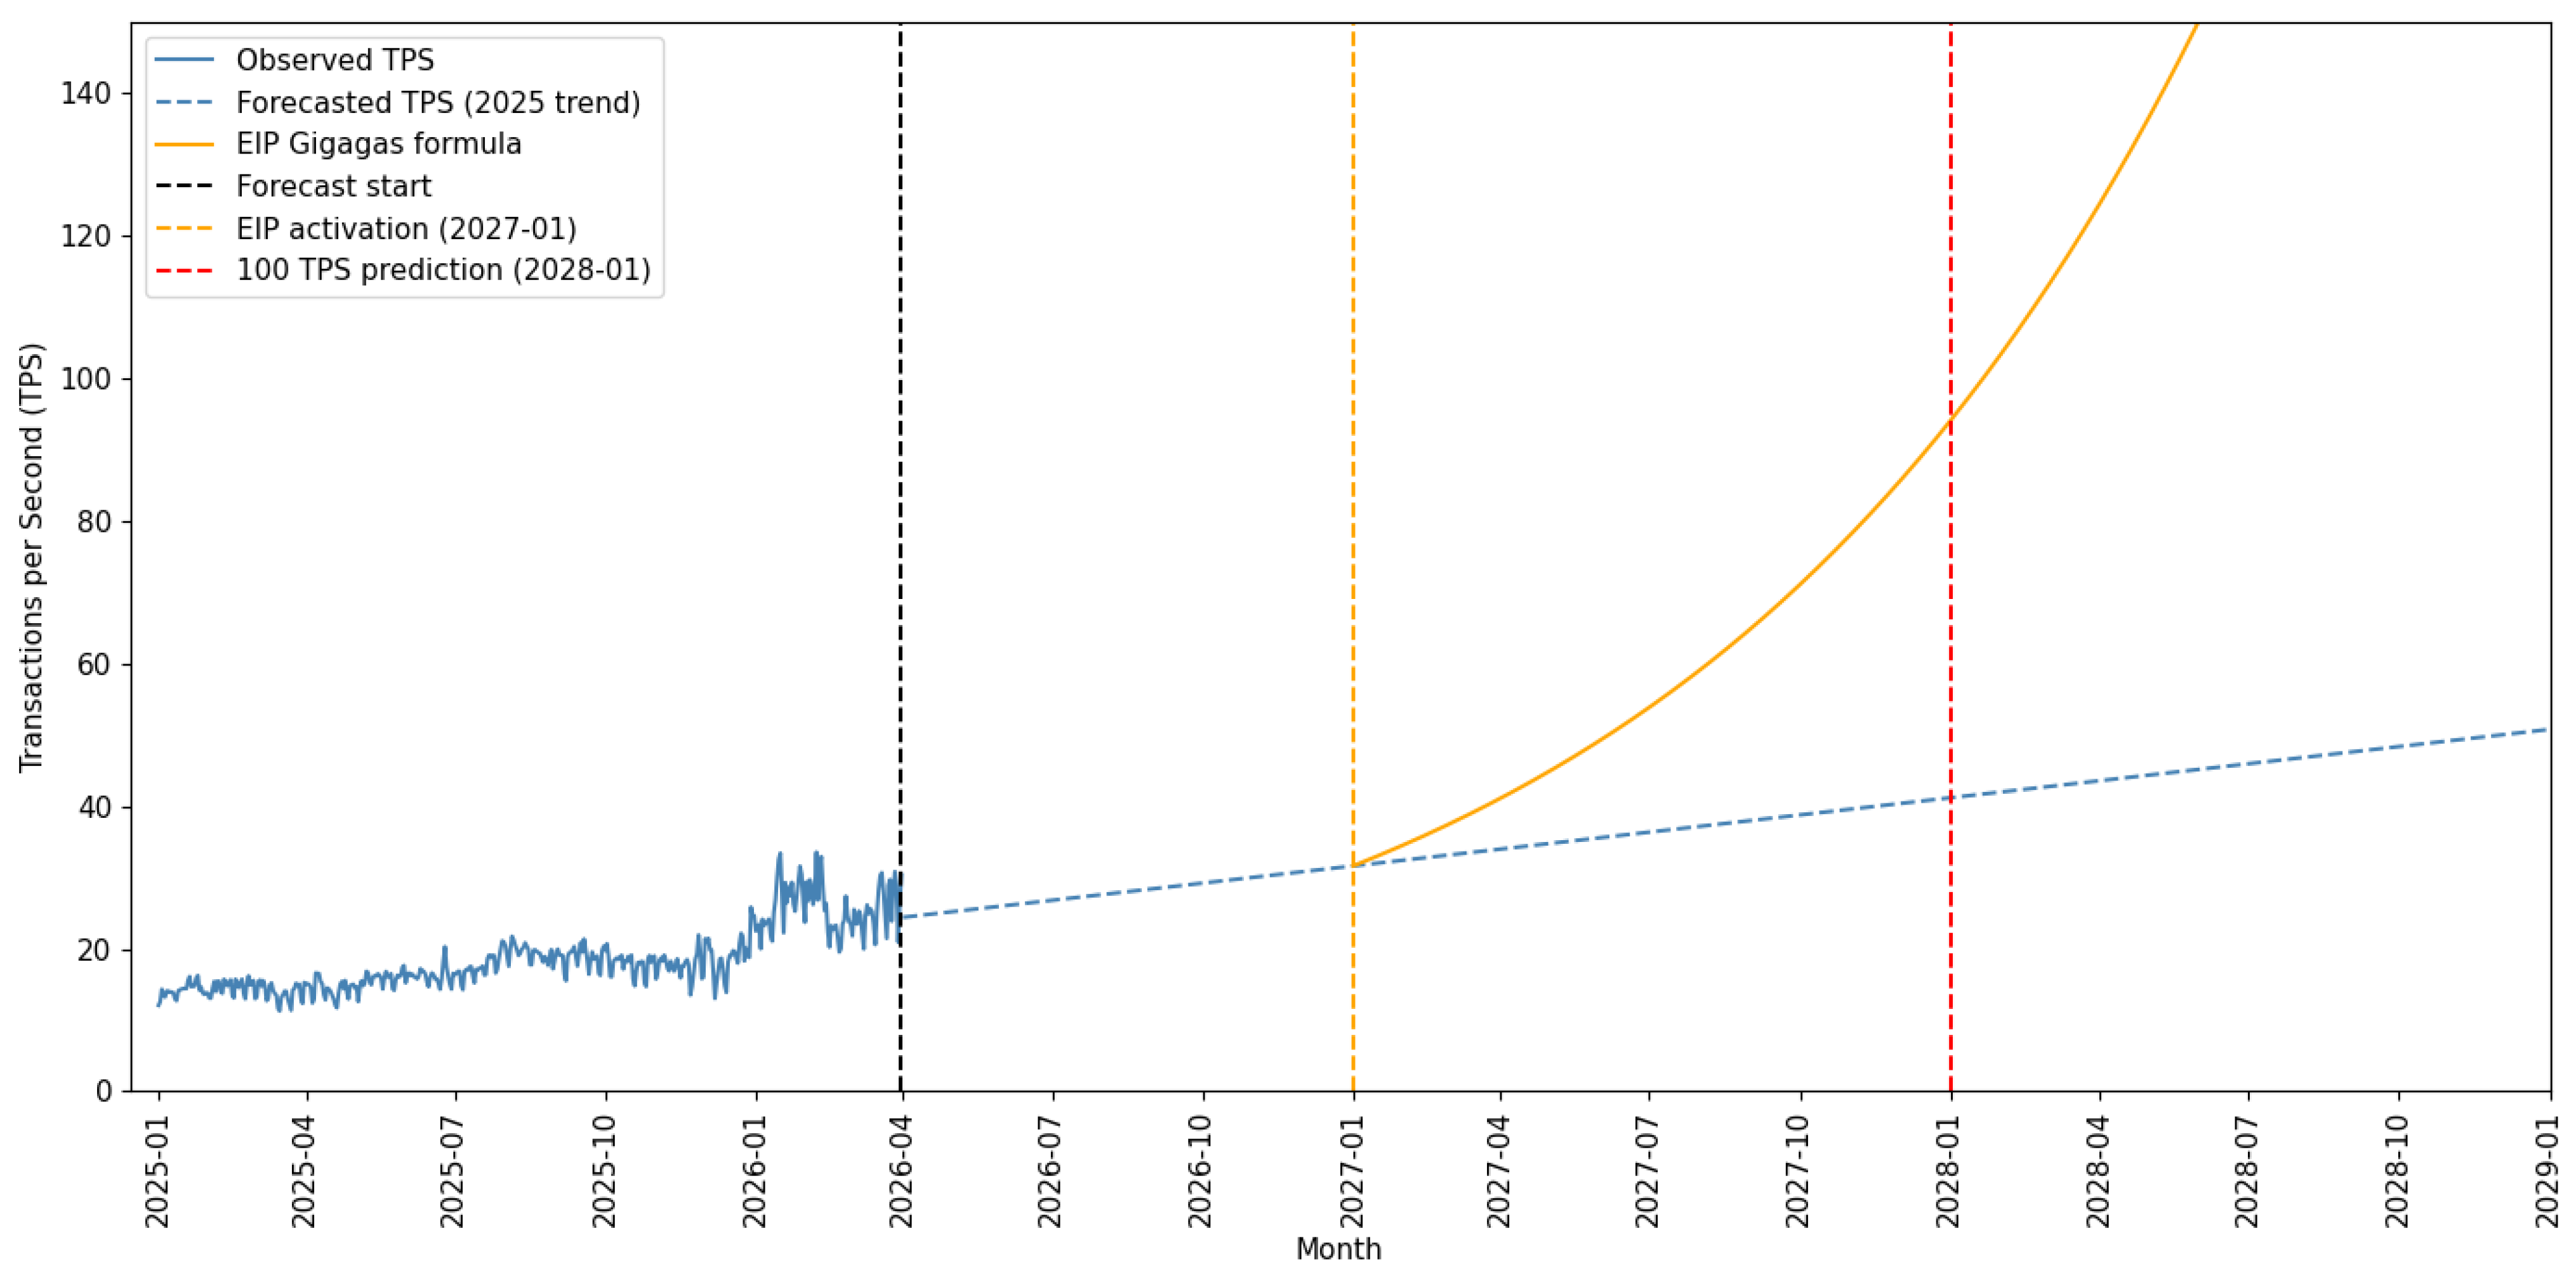
7] presents a hundred-fold gas limit increase for four years beginning in 2027. Applying this to our current Mainnet projection, we predict the Mainnet to reach 100 TPS by January 2028, six years earlier than our baseline trend. Ethereum Foundation researchers such as [
8] have raised concerns about the growing storage requirements of the network’s history (“state bloat”) as well as the impact on validator centralization.
Related literature looks at speed on Layer 2 networks. Ref. [
9] studies time to finality across the Mainnet, L2s (Arbitrum and Optimism), and Ethereum Virtual Machine (EVM) compatible blockchains (Avalanche, Binance Smart Chain, and Harmony). Ginting finds that Arbitrum has the fastest time to finality at 1.7 s for simple transactions and 2.1 s for smart contracts. Ref. [
10] notes that the combination of faster block times and private mempools reduces sandwich attacks: “across all L2s, we find no evidence of sustained or economically meaningful sandwich attacks.”
There is also a considerable amount of literature that uses simulations to analyze both fees and speed. Simulations in [
11] shows that when 90% of transactions are routed to L2s from the Mainnet, the throughput on the Mainnet can increase by up to 20%. Ref. [
12] show that EIP-4844 can reduce gas costs for L2 rollup submissions by up to 52%. Throughput can also nearly be doubled in larger blob sizes. They do find some saturation when blob sizes exceed 96 kb.
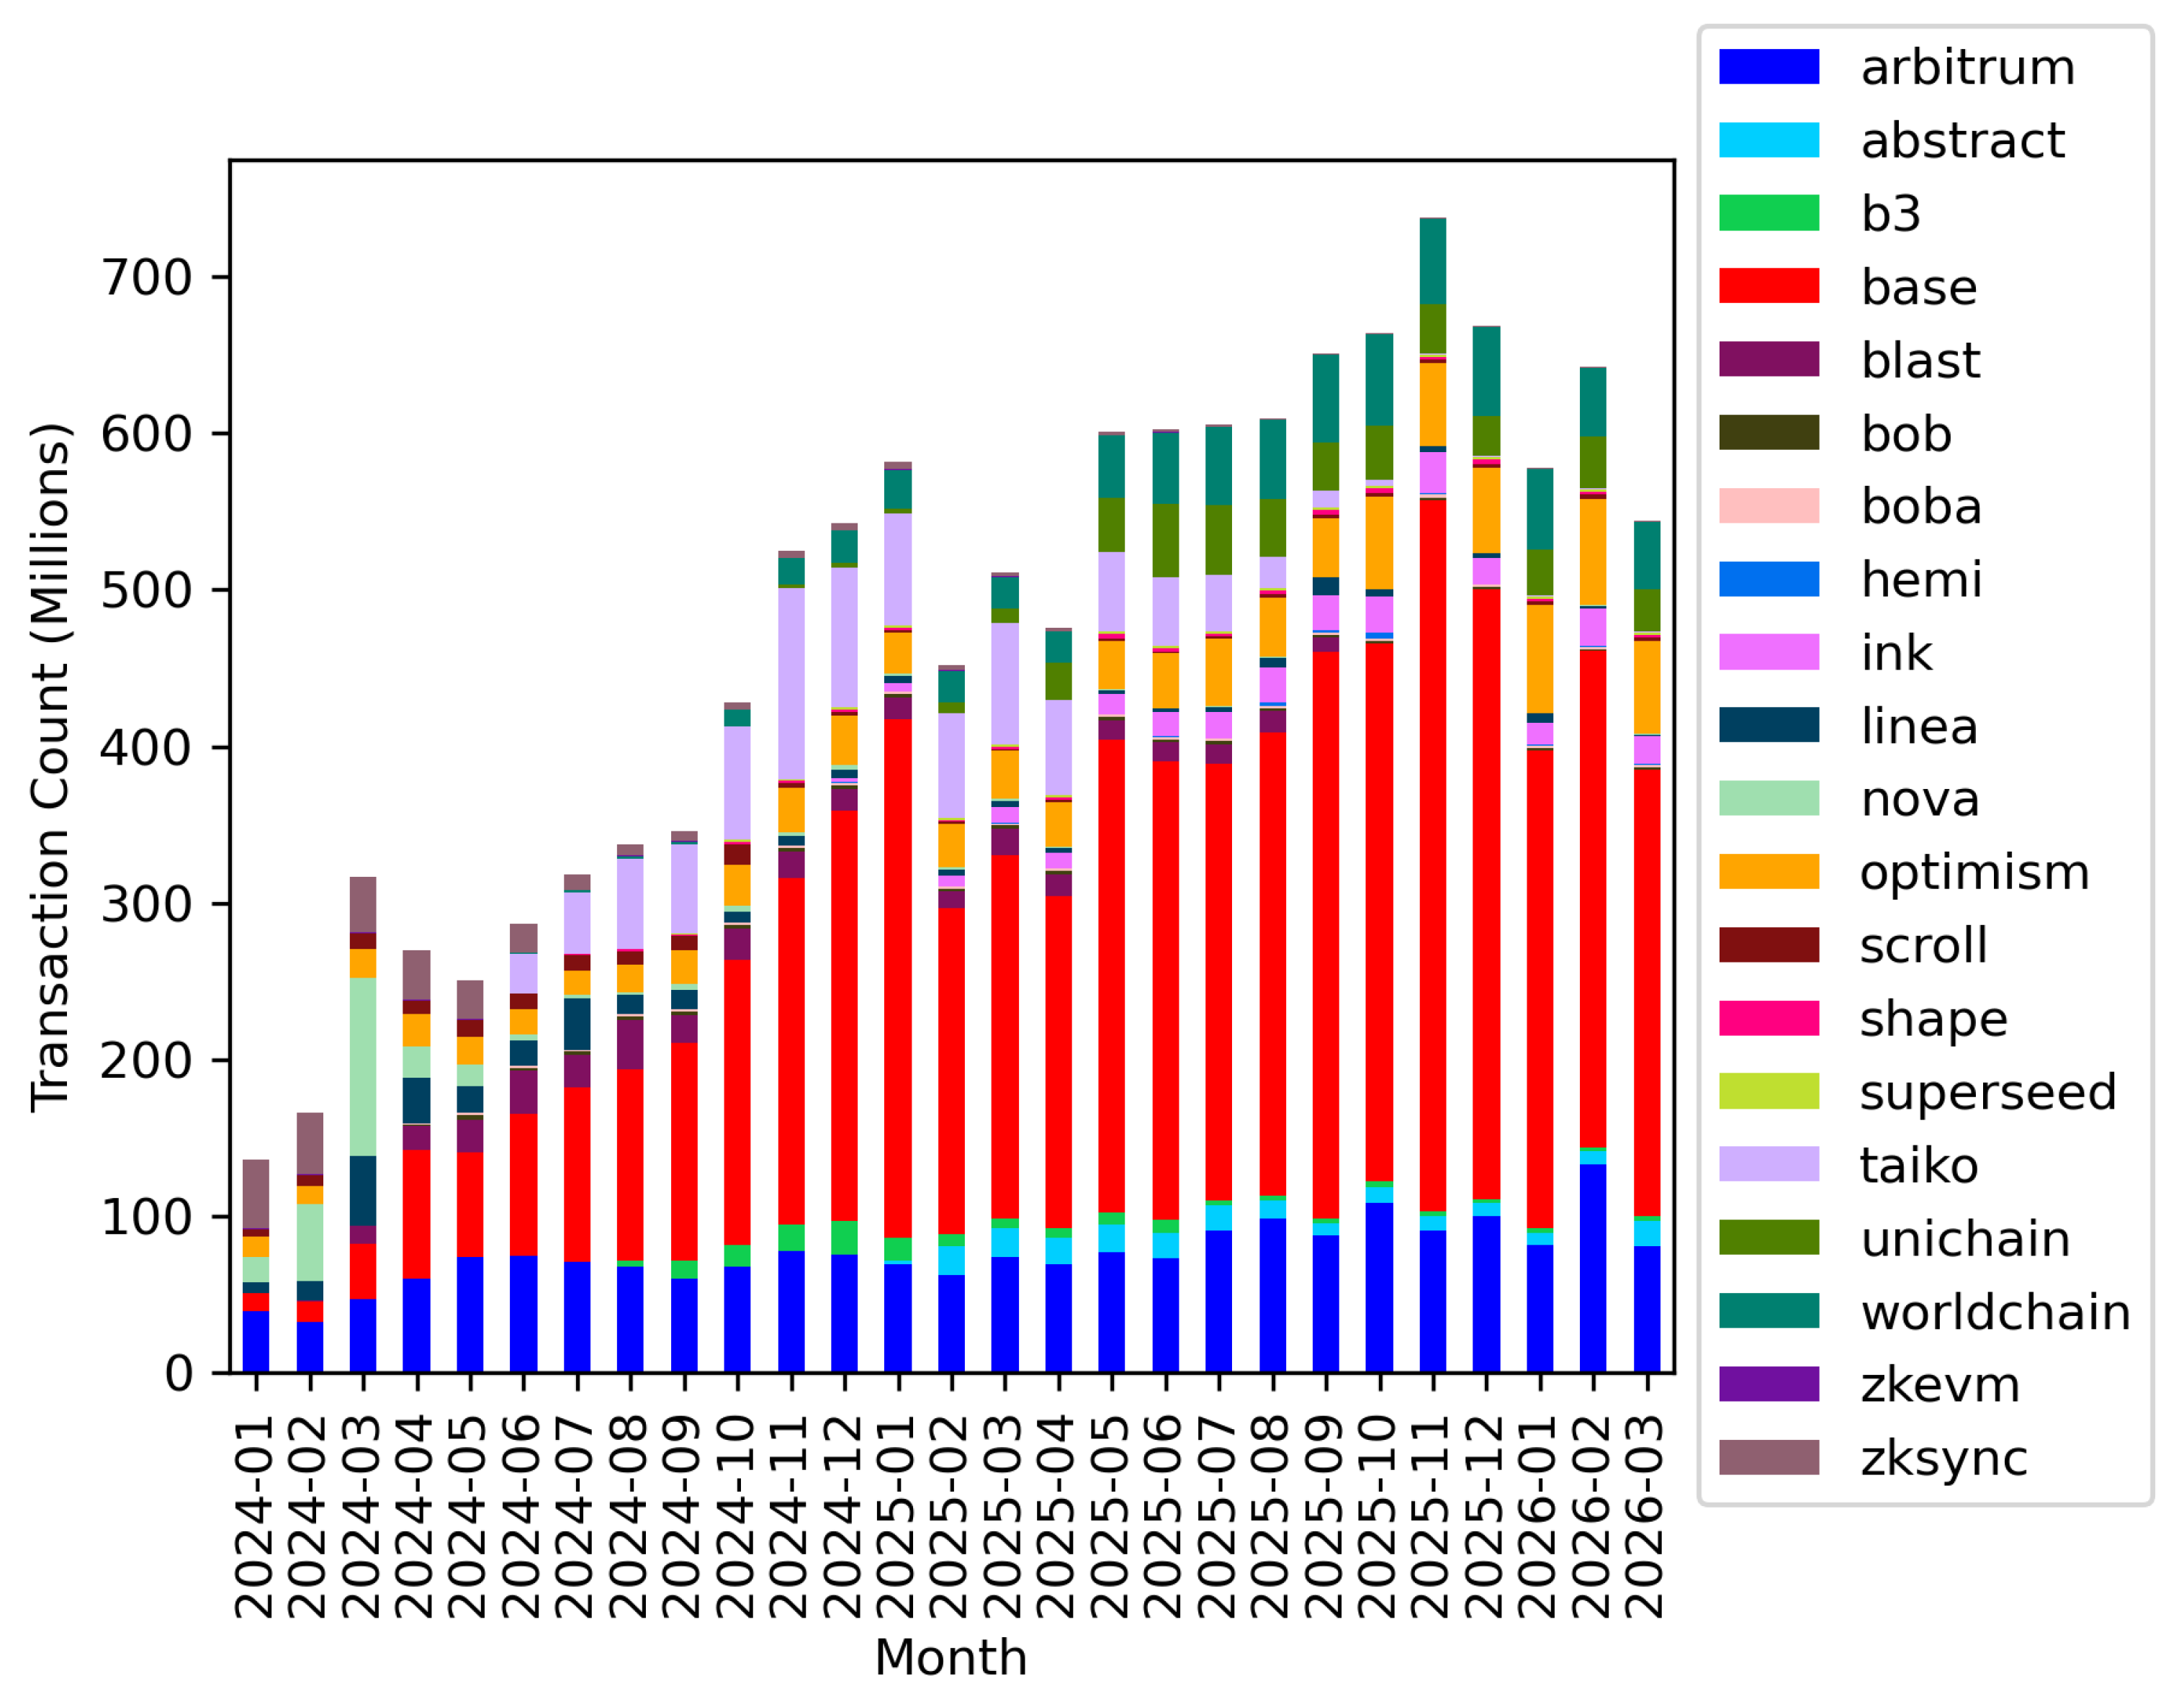
We find that blob parameter increases on the Mainnet have increased the speed of the L2s. We estimate that each additional target blob is associated with 10.75 additional L2 total TPS. With continued blob expansion at the BPO increment rate, L2 total TPS is projected to surpass Solana’s predicted TPS by March 2029, converging at 1820 TPS. We recognize that L2 TPS has slowed in 2026, however.
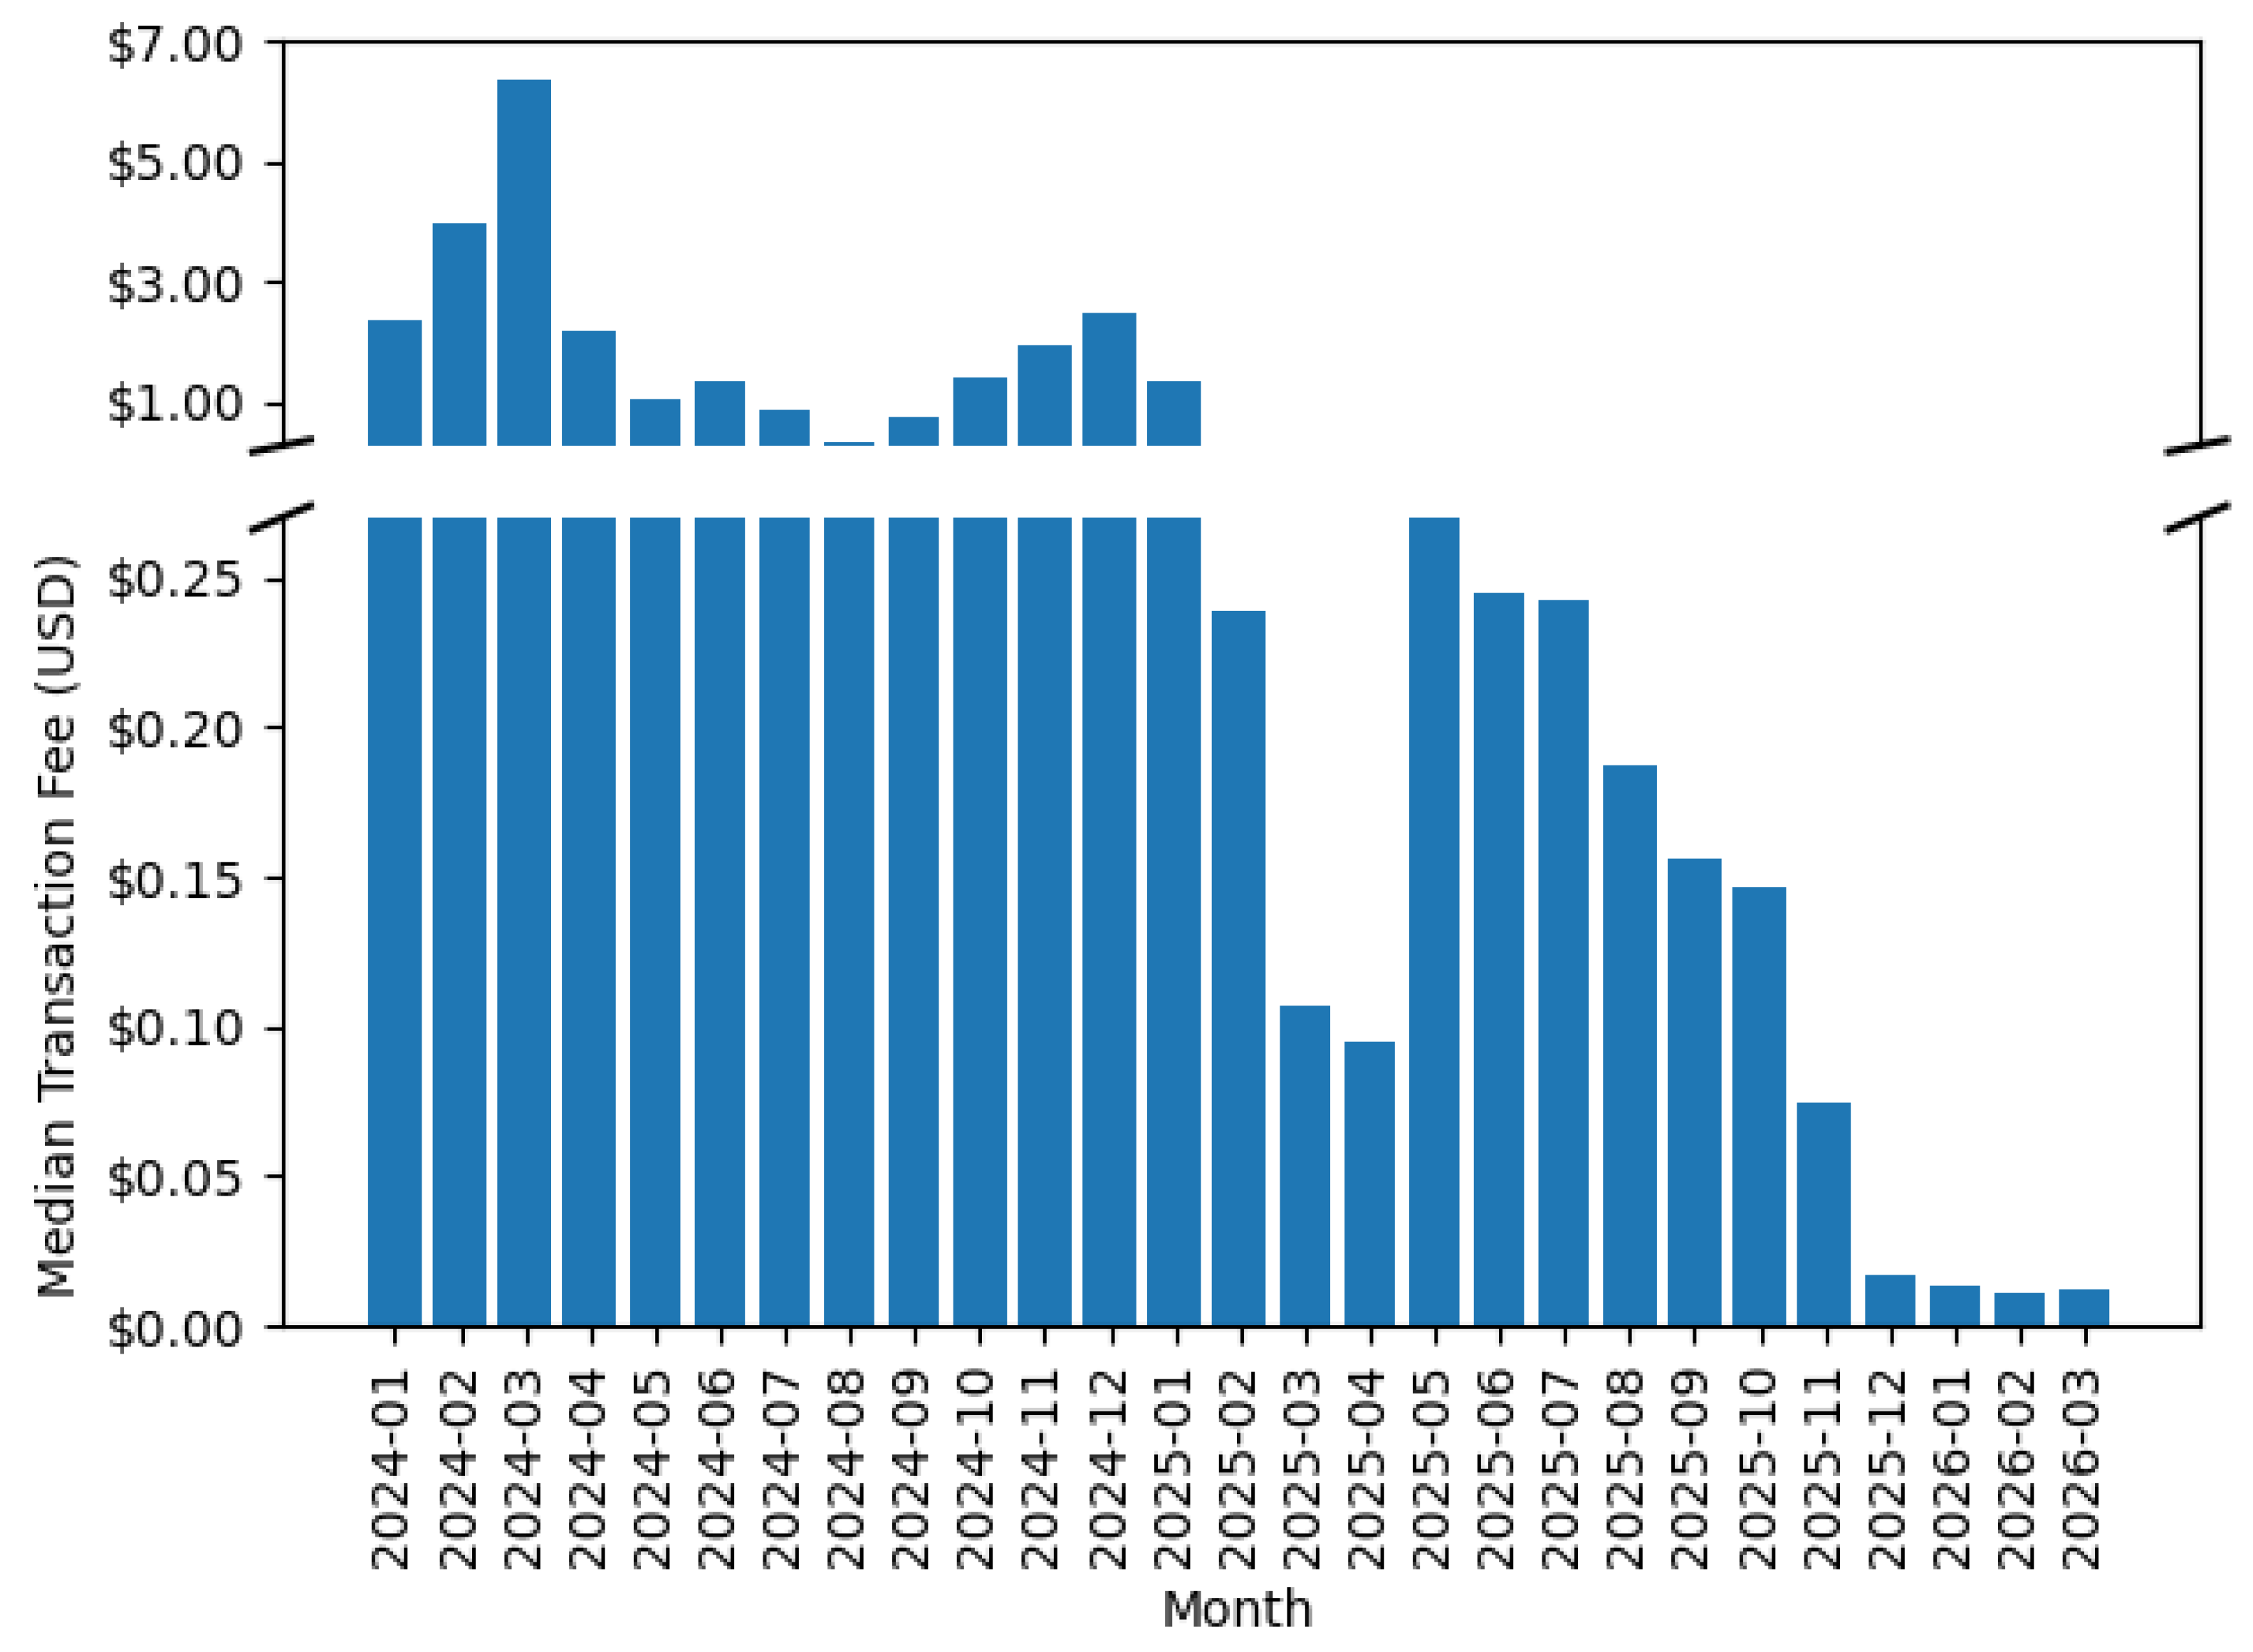
Our manuscript then turns to transaction costs. Transaction fees on the Mainnet have fallen substantially, with a median transaction fee of $3.786300 in 2024 Q1, declining 99.68% to $0.012283 in 2026 Q1. The average fees of the three highest-volume L2s: Arbitrum, Base, and Optimism, which we call the L2 leaders, declined 99.16% from $0.180219 in 2024 Q1 to $0.001512 in 2026Q1. While Solana’s fees also fell, the percentage decrease was slighter. Median fees fell from $0.000687 in 2024 Q1 to $0.000496, a decline of 27.80%. Polygon fees are an exception to this trend, rising 19.62% over this period from $0.005742 to $0.006868.
Studying fees from November 2017 through January 2019, Ref. [
13] finds that the effect of network congestion on Ethereum transaction fees is statistically insignificant until blocks reach 90% capacity. On the supply side, they find that increasing the block’s capacity limit is associated with lower fees. Studying the Ethereum network’s transition from Proof-of-Work (POW) to its current transaction method, Proof-of-Stake (POS), Ref. [
14] finds that Ethereum fees in USD increase nonlinearly with mempool count. In addition, it was found that fees decreased with the change from POW to POS. Using data from January 2021 through December 2022, Ref. [
15] confirms that a higher block gas limit is associated with lower transaction fees. Studying the period around the Dencun upgrade, Ref. [
16] finds that EIP-4844 [
17]. increased rollup usage on Ethereum while lowering rollup transaction fees. Ref. [
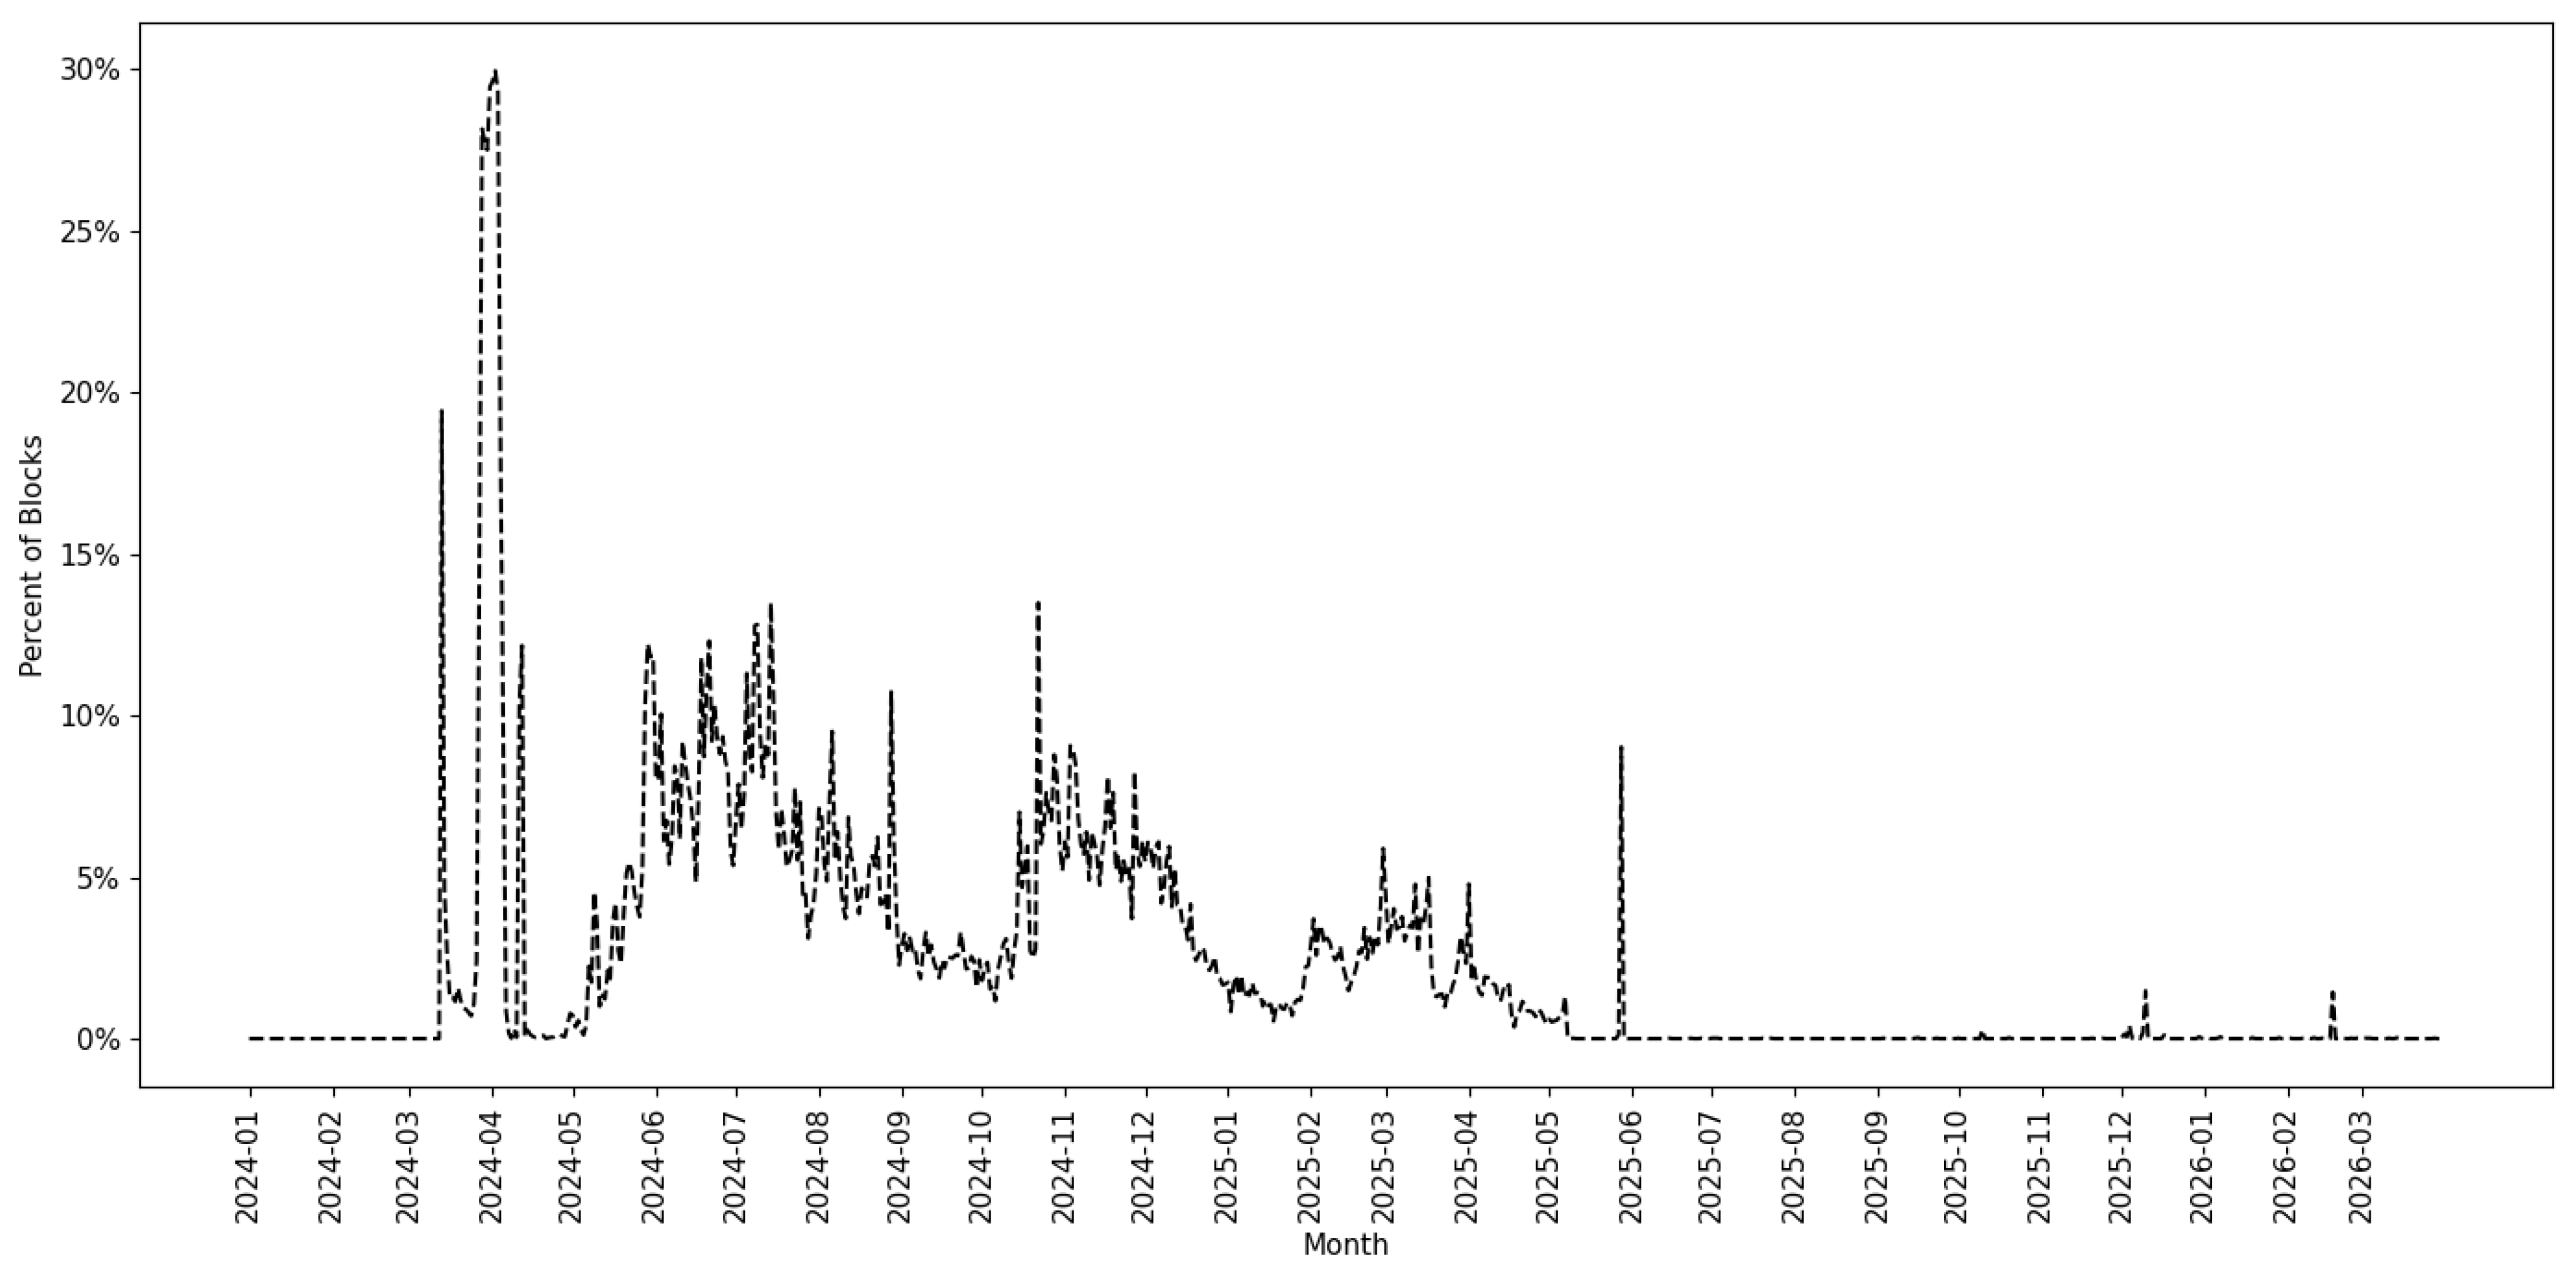
18] shows that after Pectra, fees on Arbitrum and Optimism show a weaker dependence on Mainnet fees.
We also compare the Mainnet and Layer 2 networks to competing blockchains. Ref. [
19] compare Solana and Ethereum using two submission patterns: sequential submission, where transactions are sent one after another, and parallel submission, where they are sent simultaneously in batches. They measure TPS, latency, and gas fees and find that Solana outperforms Ethereum across all three metrics in both modes. Ref. [
20] finds that lower costs on Arbitrum and Polygon attract smaller orders away from the Mainnet.
Ref. [
21] cautions that speed can have drawbacks. They study the period from November 2023 through March 2024, and find that Solana has a transaction failure rate of approximately 20%, whereas Ethereum has only 0.1%. Solana also has a 7.6% zero-value transfer rate, while Ethereum has a 0.66% rate.
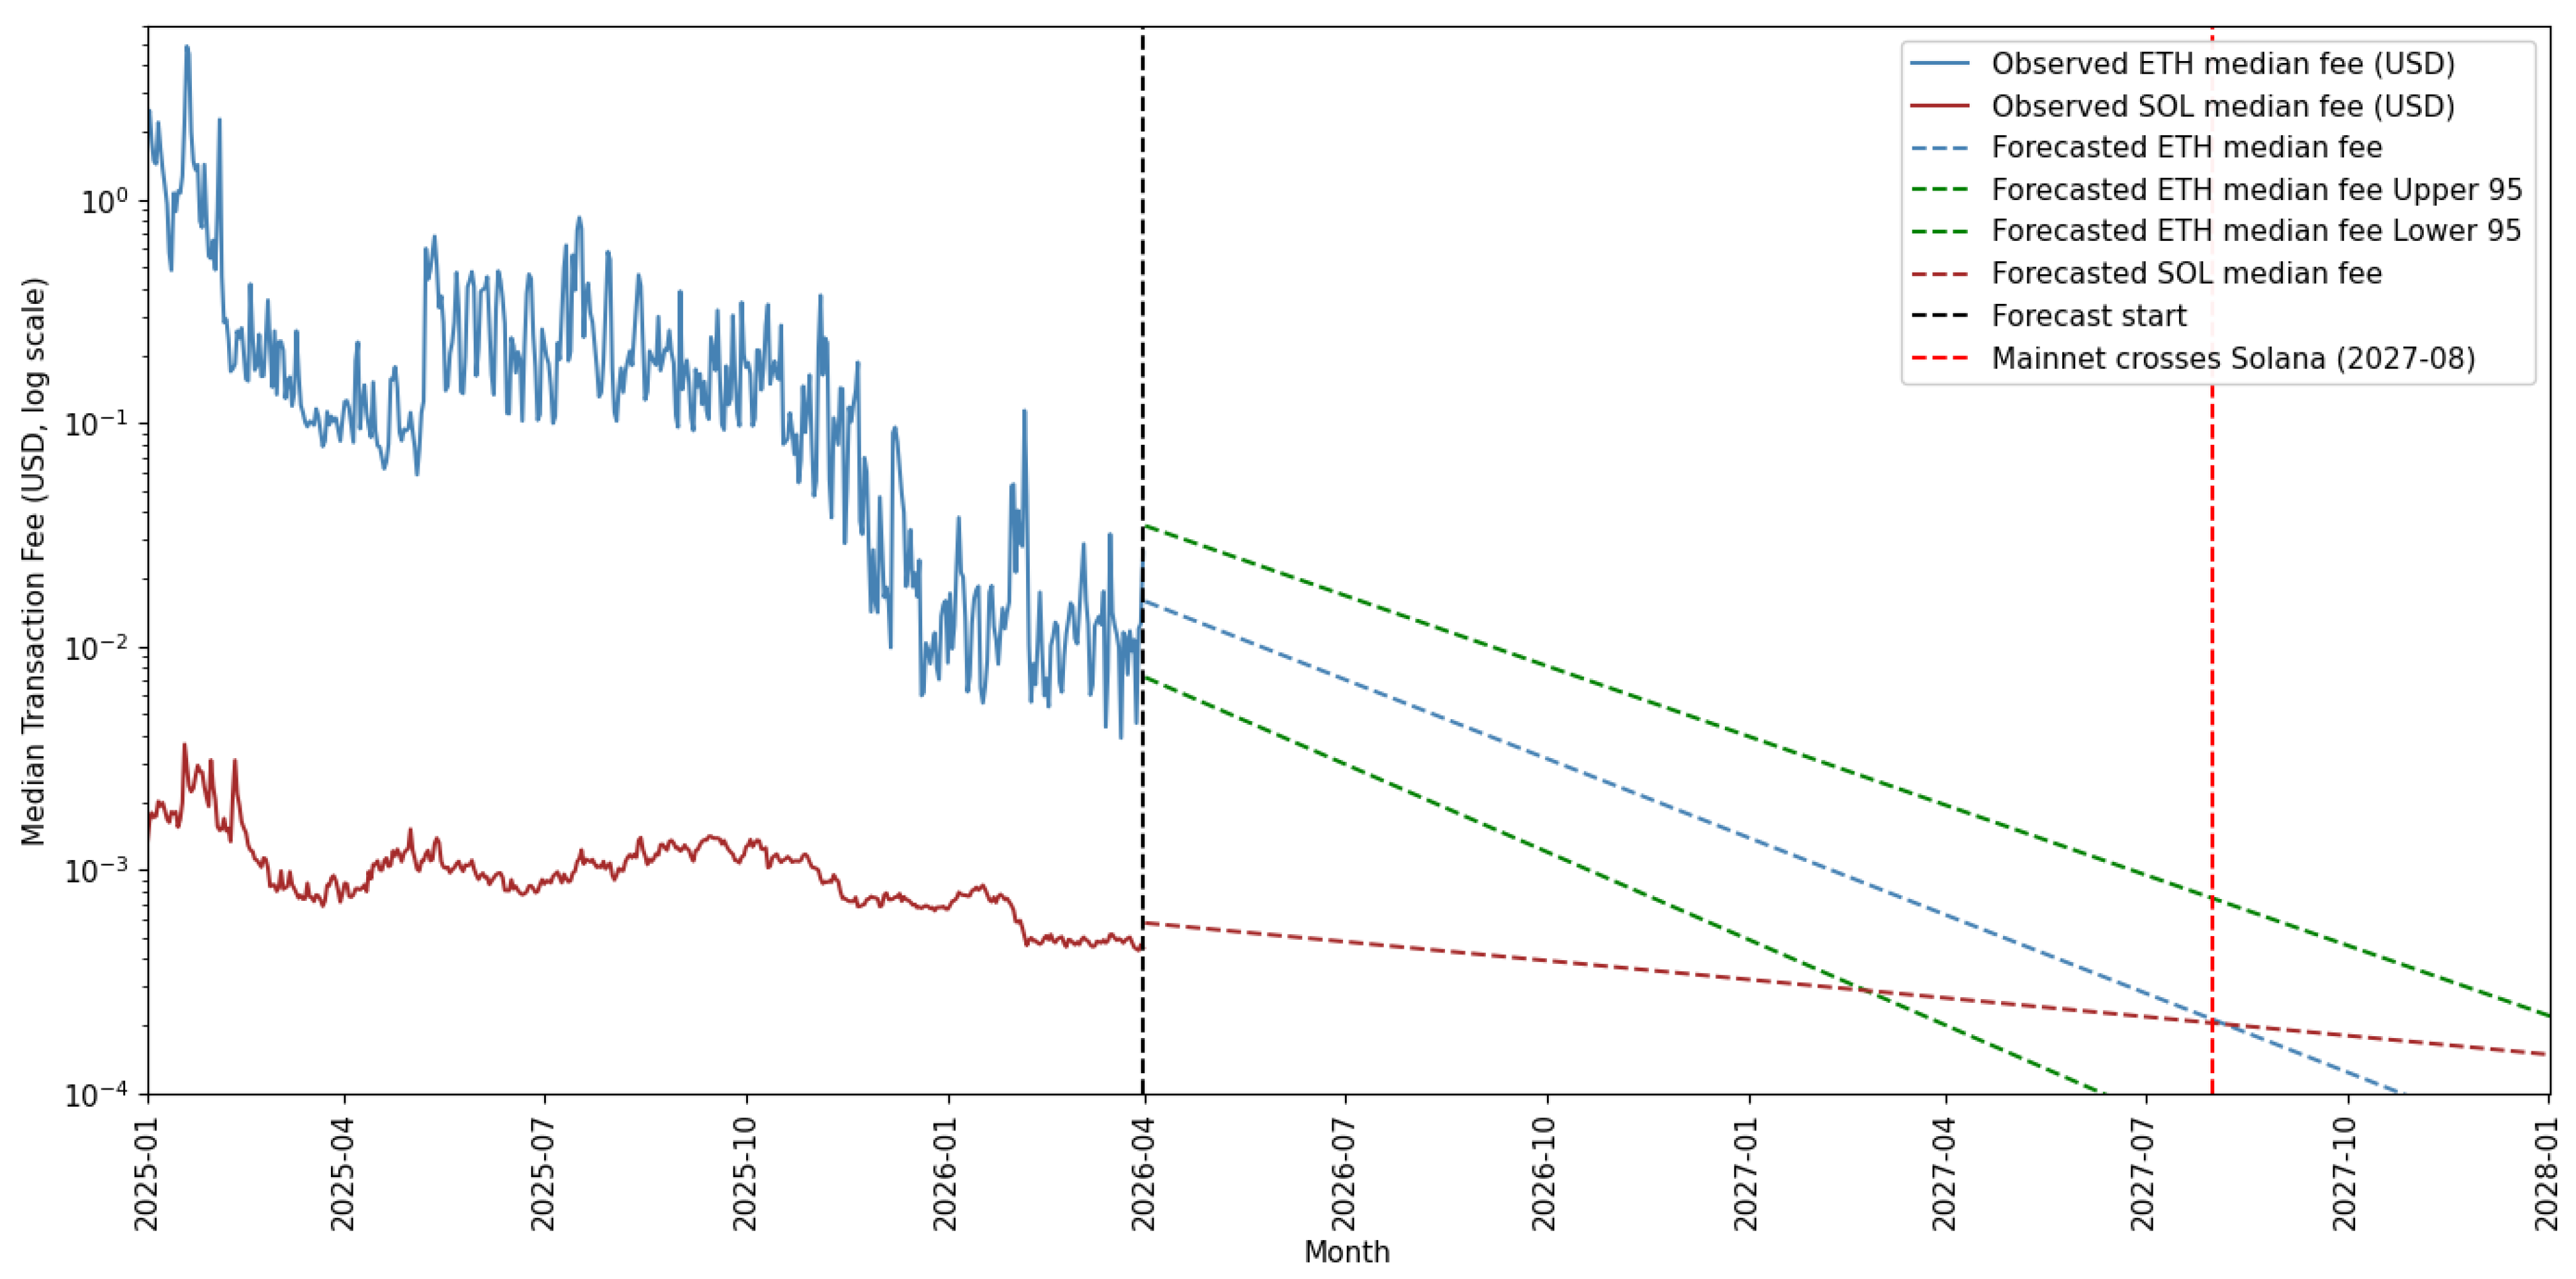
As with speed, we find that gas limits are a key factor in declining transaction costs. We estimate that every five-million-unit increase in the gas limit is associated with a 59.2% decline in median transaction fees. The Mainnet is projected to converge with Solana’s predicted median transaction fee in August 2027.
For the L2 leaders, each additional target blob is associated with a 4.3% decline in median transaction fees. Assuming continued blob expansion at the BPO increment rate, we project that the L2 transaction fees will converge with Solana’s predicted fee in October 2026.
Our paper contributes to this literature in three ways. First, we document the joint effects of the Dencun, Pectra, Fusaka, BPO, and gas limit upgrades on Mainnet transaction speed and fees from January 2024 through March 2026. To our knowledge, no prior work covers all these upgrades. We extend the cross-chain comparison literature by jointly studying the Mainnet, L2s, Solana, and Polygon. We also provide quantitative forecasts of Mainnet and L2 speeds under extrapolated trends and the EIP-7938 proposal in the February 2026 L1 Strawmap, which has not yet been empirically studied.
We then examine the effects of higher block gas limits and blob targets on fees. Our analysis also predicts dates at which the Mainnet and Layer 2s will reach lower fees than Solana.
This study examines whether observed changes in Ethereum’s available block and blob capacity are drivers behind transaction throughput and fees. We recognize that realized performance also depends on network demand and transaction composition. Capacity expansions may remain underutilized. As [
22] notes, protocol capacity should be interpreted as an enabling condition. Effective use depends on technological development and adoption, user demand and the organization of the entire ecosystem.
The remainder of our paper is organized as follows.
Section 2 describes the Ethereum network architecture and documents the sequence of recent protocol upgrades.
Section 3,
Section 4 and
Section 5 cover Polygon, Solana, and the L2s.
Section 6 reports transaction speed and fee comparisons across blockchains.
Section 7 and
Section 8 estimate the effects of gas limits and blobs on speed and transaction costs. From these models, we produce forecasts for both the Mainnet and the Layer 2s for TPS and fees.
Section 9 concludes.
6. Blockchain Comparison
We now quantify the differences between the Mainnet, its L2s, Solana, and Polygon by comparing DEX volume and TPS from January 2024 through March 2026.
6.1. Volume
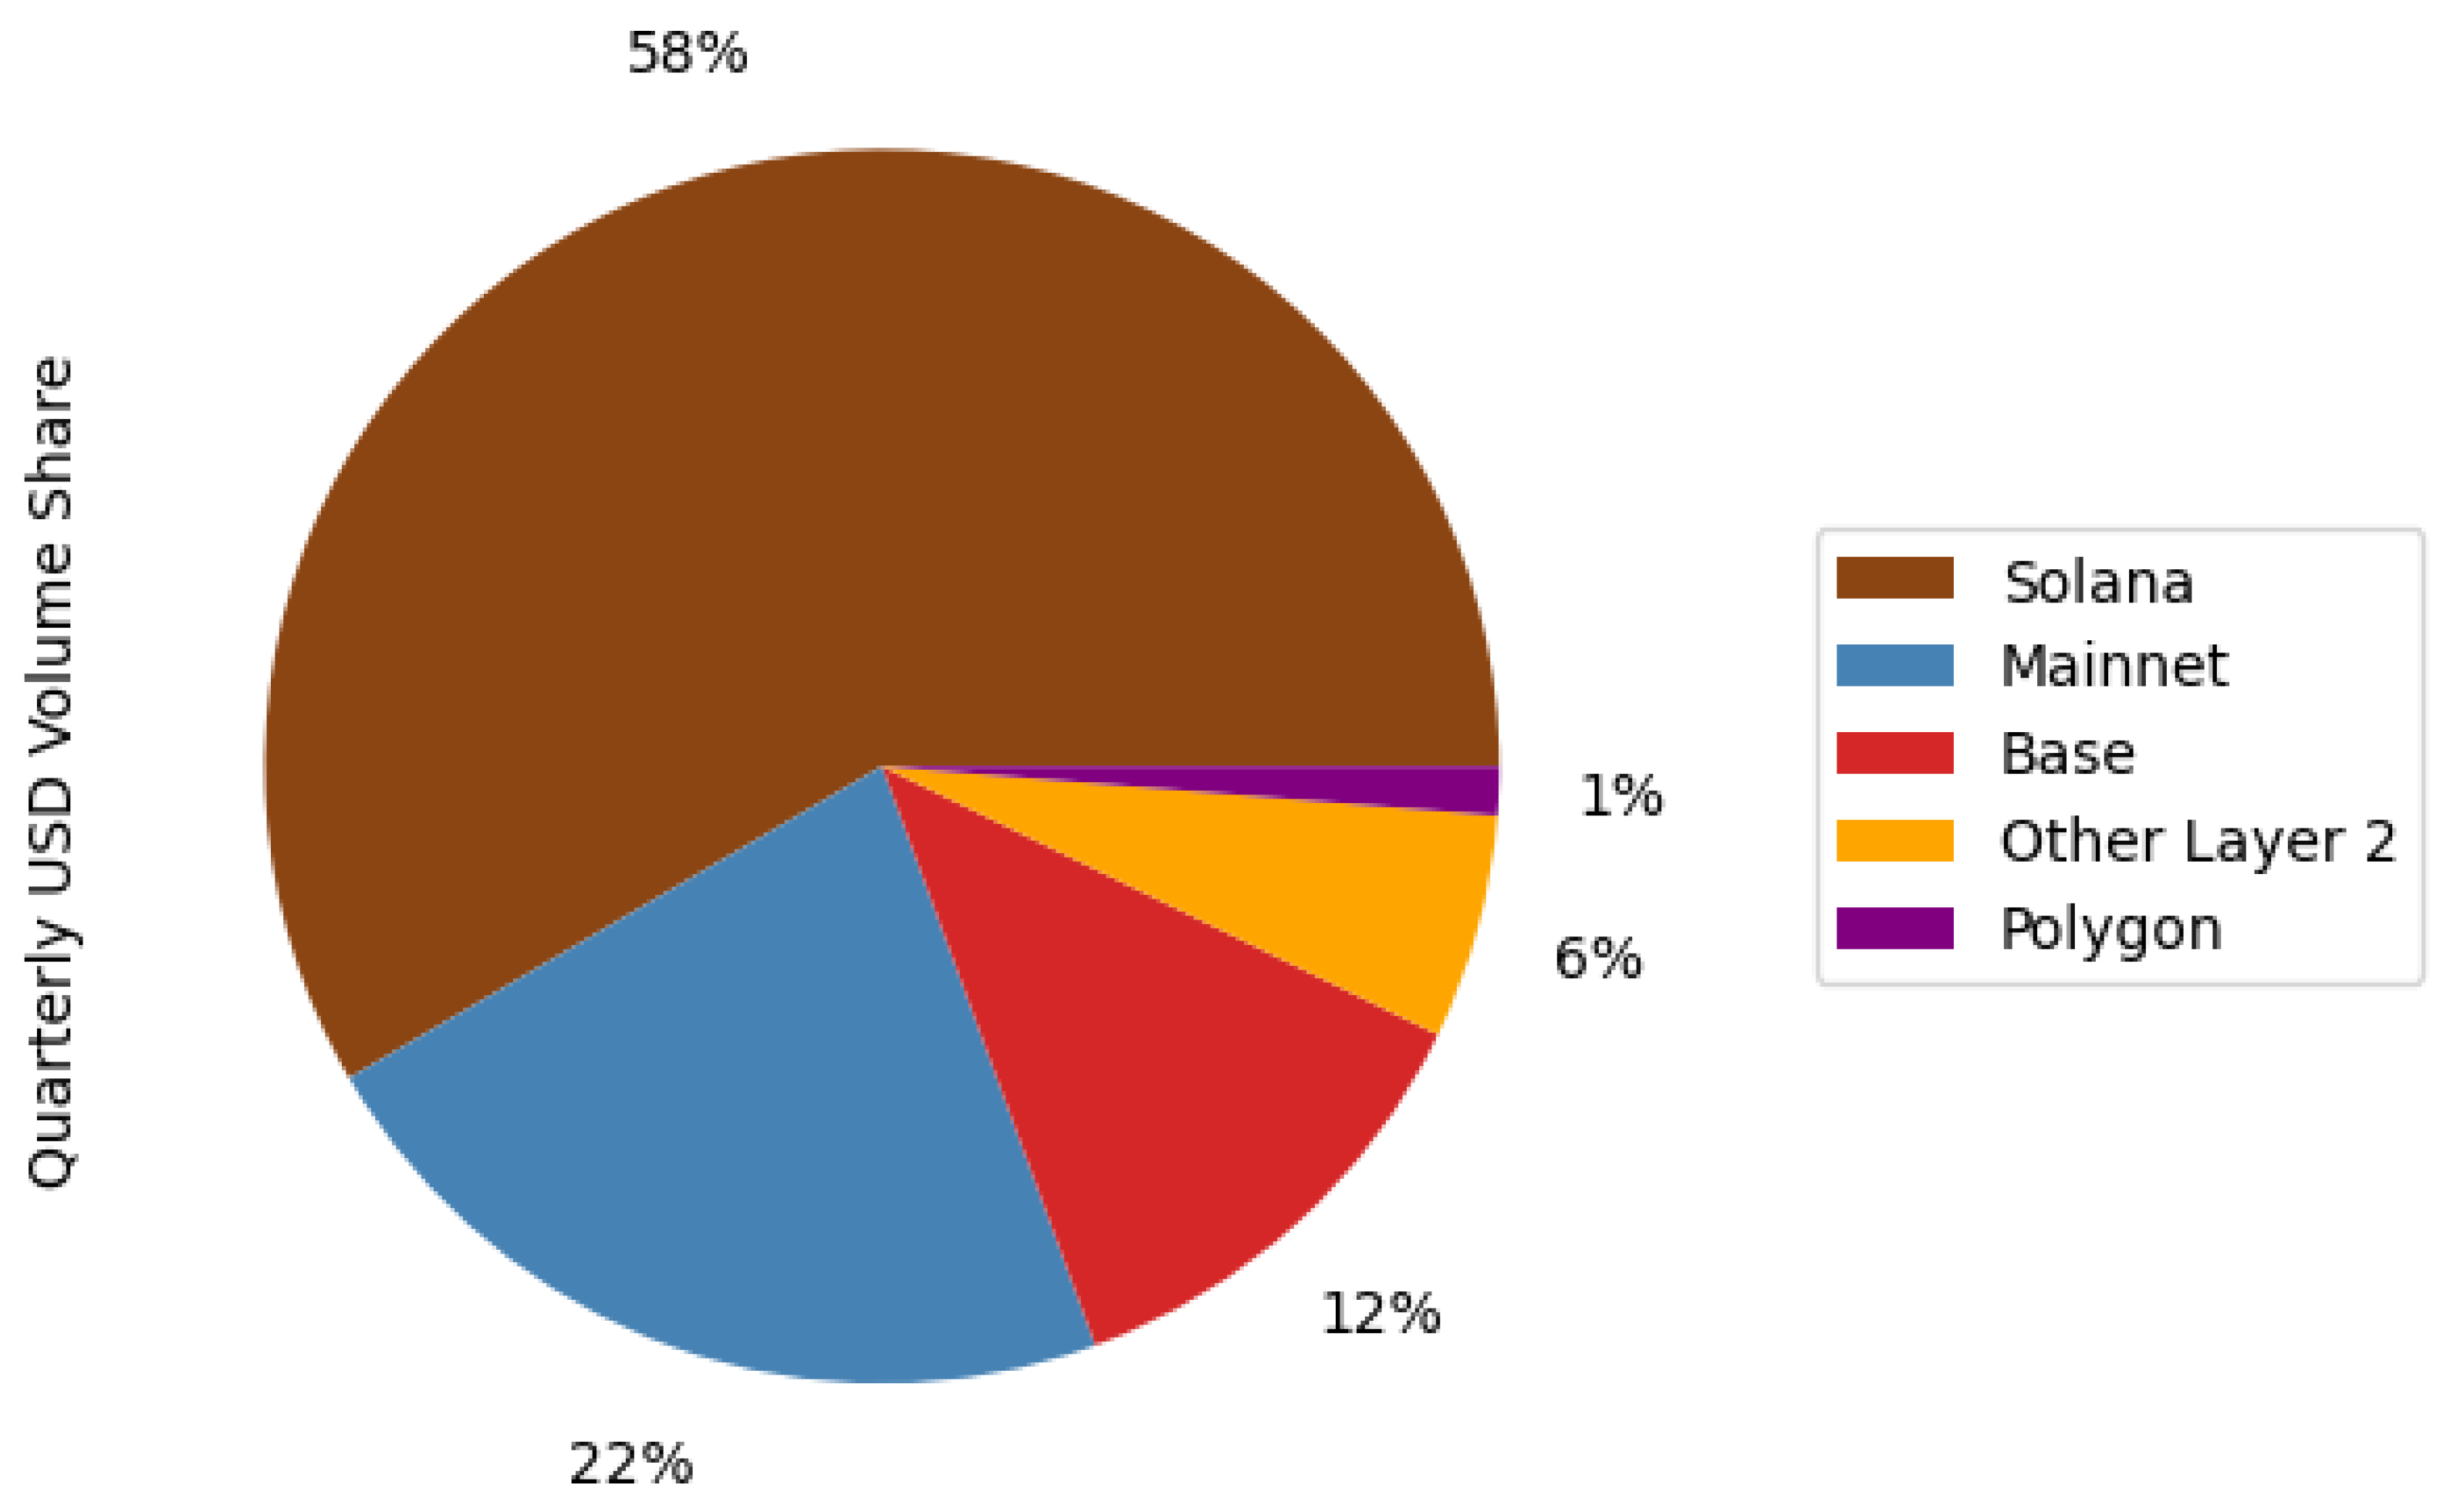
To analyze trading activity, we aggregate 2026 Q1 DEX volumes across all trading pairs and convert them into USD equivalents. This measure captures the total dollar value of DEX trades executed on each blockchain. We compute this metric for the Mainnet, Base, Solana, and Polygon. We group all the other L2s, which each have less than
$50 billion of DEX volume, into another group, ‘Other Layer 2’.
Figure 14 therefore represents the distribution of trading volume measured in USD across DEX on each blockchain.
Solana leads with 58% of total volume, followed by Ethereum at 22%. Base has the greatest volume percentage compared to all other L2s at 12%, leaving other L2s to make up 6% of volume. Polygon has the lowest volume at 1%. Combined, Ethereum and its L2 networks account for 40% of DEX volume.
6.2. Transactions per Second
We begin by comparing 2026 Q1 TPS to the same quarter back in 2024. To study L2 speed, we aggregate the daily TPS across all L2 networks introduced in
Section 5 to obtain a combined L2 TPS measure. We refer to this as L2 Total TPS.
Table 1 reports the 2024 Q1, 2024, 2025, and 2026 Q1 TPS values for Ethereum, L2 Total, Polygon, and Solana.
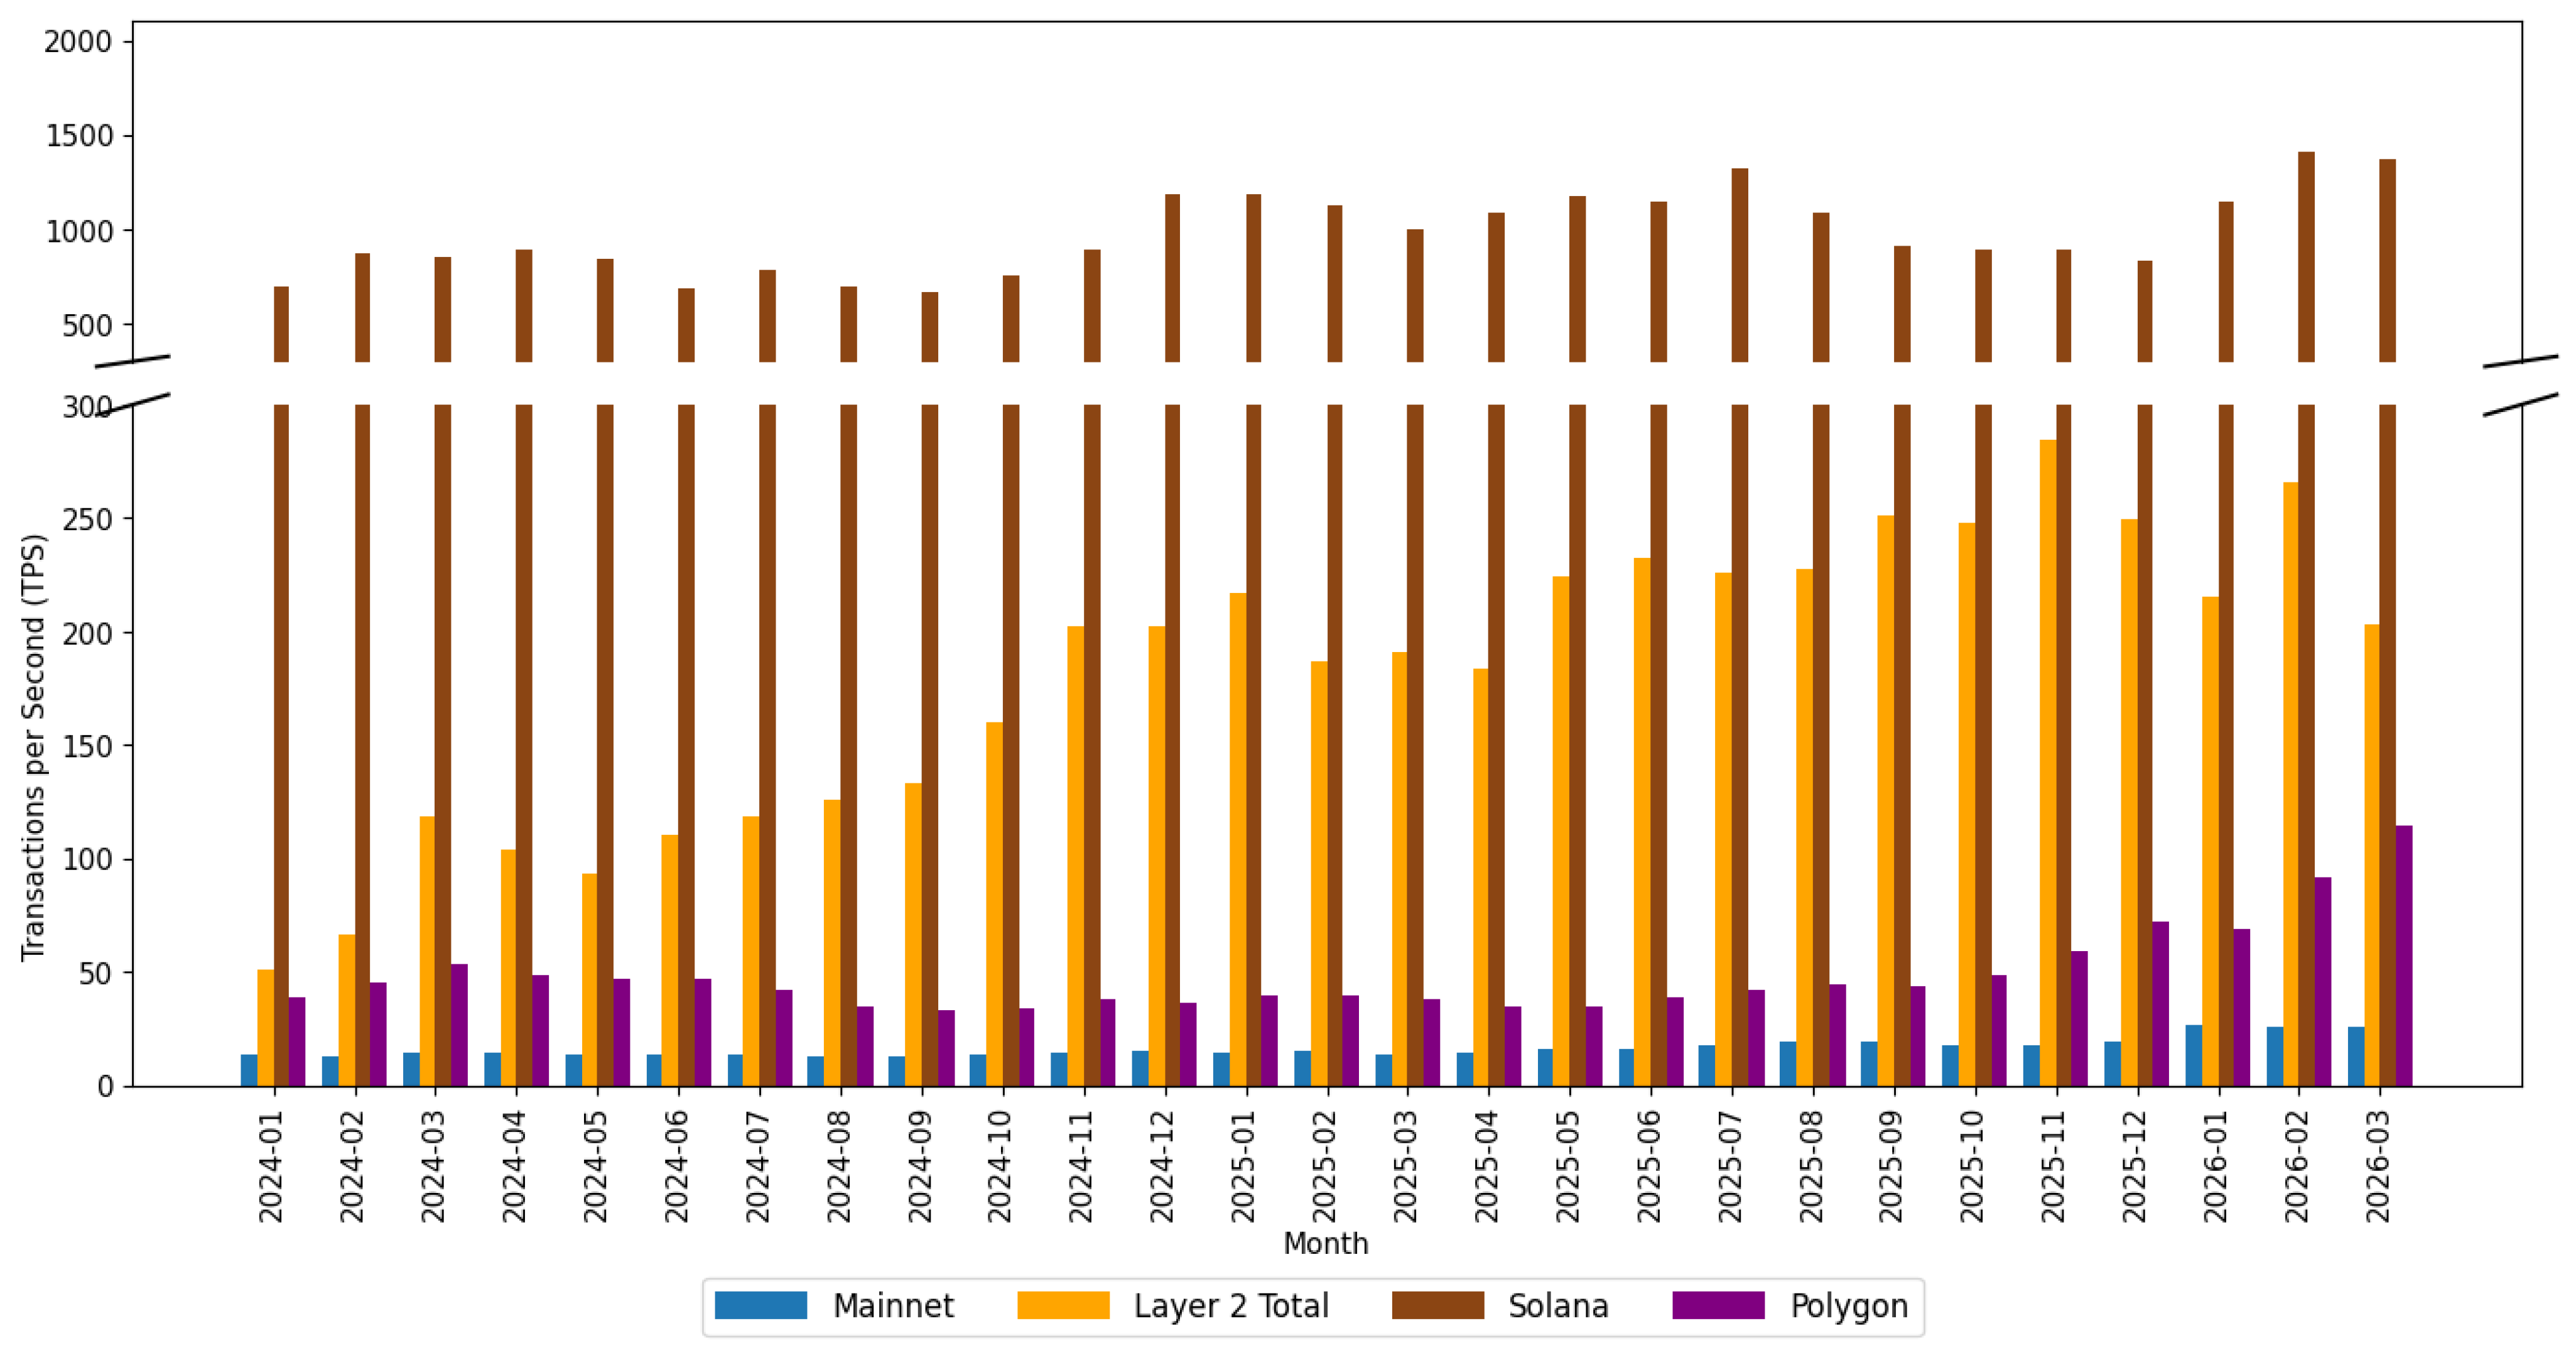
Solana remains the fastest network throughout the sample, averaging 804.72 TPS in 2024 Q1 and rising to 1,303.46 TPS by 2026 Q1. The L2 ecosystem has closed the gap with Solana, rising from 78.60 TPS in 2024 Q1 to 226.92 TPS in 2026 Q1. Polygon doubled its TPS rising from 45.72 in 2024 Q1 to 91.51 TPS in 2026 Q1. The Mainnet grew almost as quickly from 13.67 TPS in 2024 Q1 to 25.78 TPS in 2026 Q1.
Figure 15 visualizes the TPS of all networks monthly from January 2024 through March 2026.
All three networks show uptrends in TPS. We will extrapolate time trends in Solana. For the Mainnet, we will link TPS improvements to increases in the gas limit. For the Layer 2s, we will model their trend growth using blobs.
6.3. Transaction Fees
To present a representative fee measure, we focus on the L2 Leaders, defined as the mean of daily median fees across Arbitrum, Base, and Optimism. These three networks account for 79.39% of total L2 transactions and 18% of total DEX volume in Q1 2026.
Table 2 reports the median of daily median transaction fees in USD for Mainnet, Solana, L2 Leaders, and Polygon across the sample period.
The L2 Leaders declined continuously across the sample, falling 99.16% from $0.180219 in 2024 Q1 to $0.001512 in 2026 Q1. Mainnet fees observed a sharp decline across the sample, falling 99.68%from an average of $3.786300 in 2024 Q1 to $0.012283 in 2026 Q1. Polygon was the only network to see an increase in fees, which occurred in 2026 Q1. Solana fees remained consistently low throughout the sample, with a median of $0.000687 in 2024 Q1 and declining further to $0.000496 in 2026 Q1.
Although the gap between the Mainnet and Solana fees has narrowed substantially, Solana continues to offer the lowest transaction costs.
We also present a cross-chain comparison of fees in native units in
Table 3.
The clear outlier here is Polygon, and Polygon would not be competitive if POL prices were to return to their early 2024 levels.
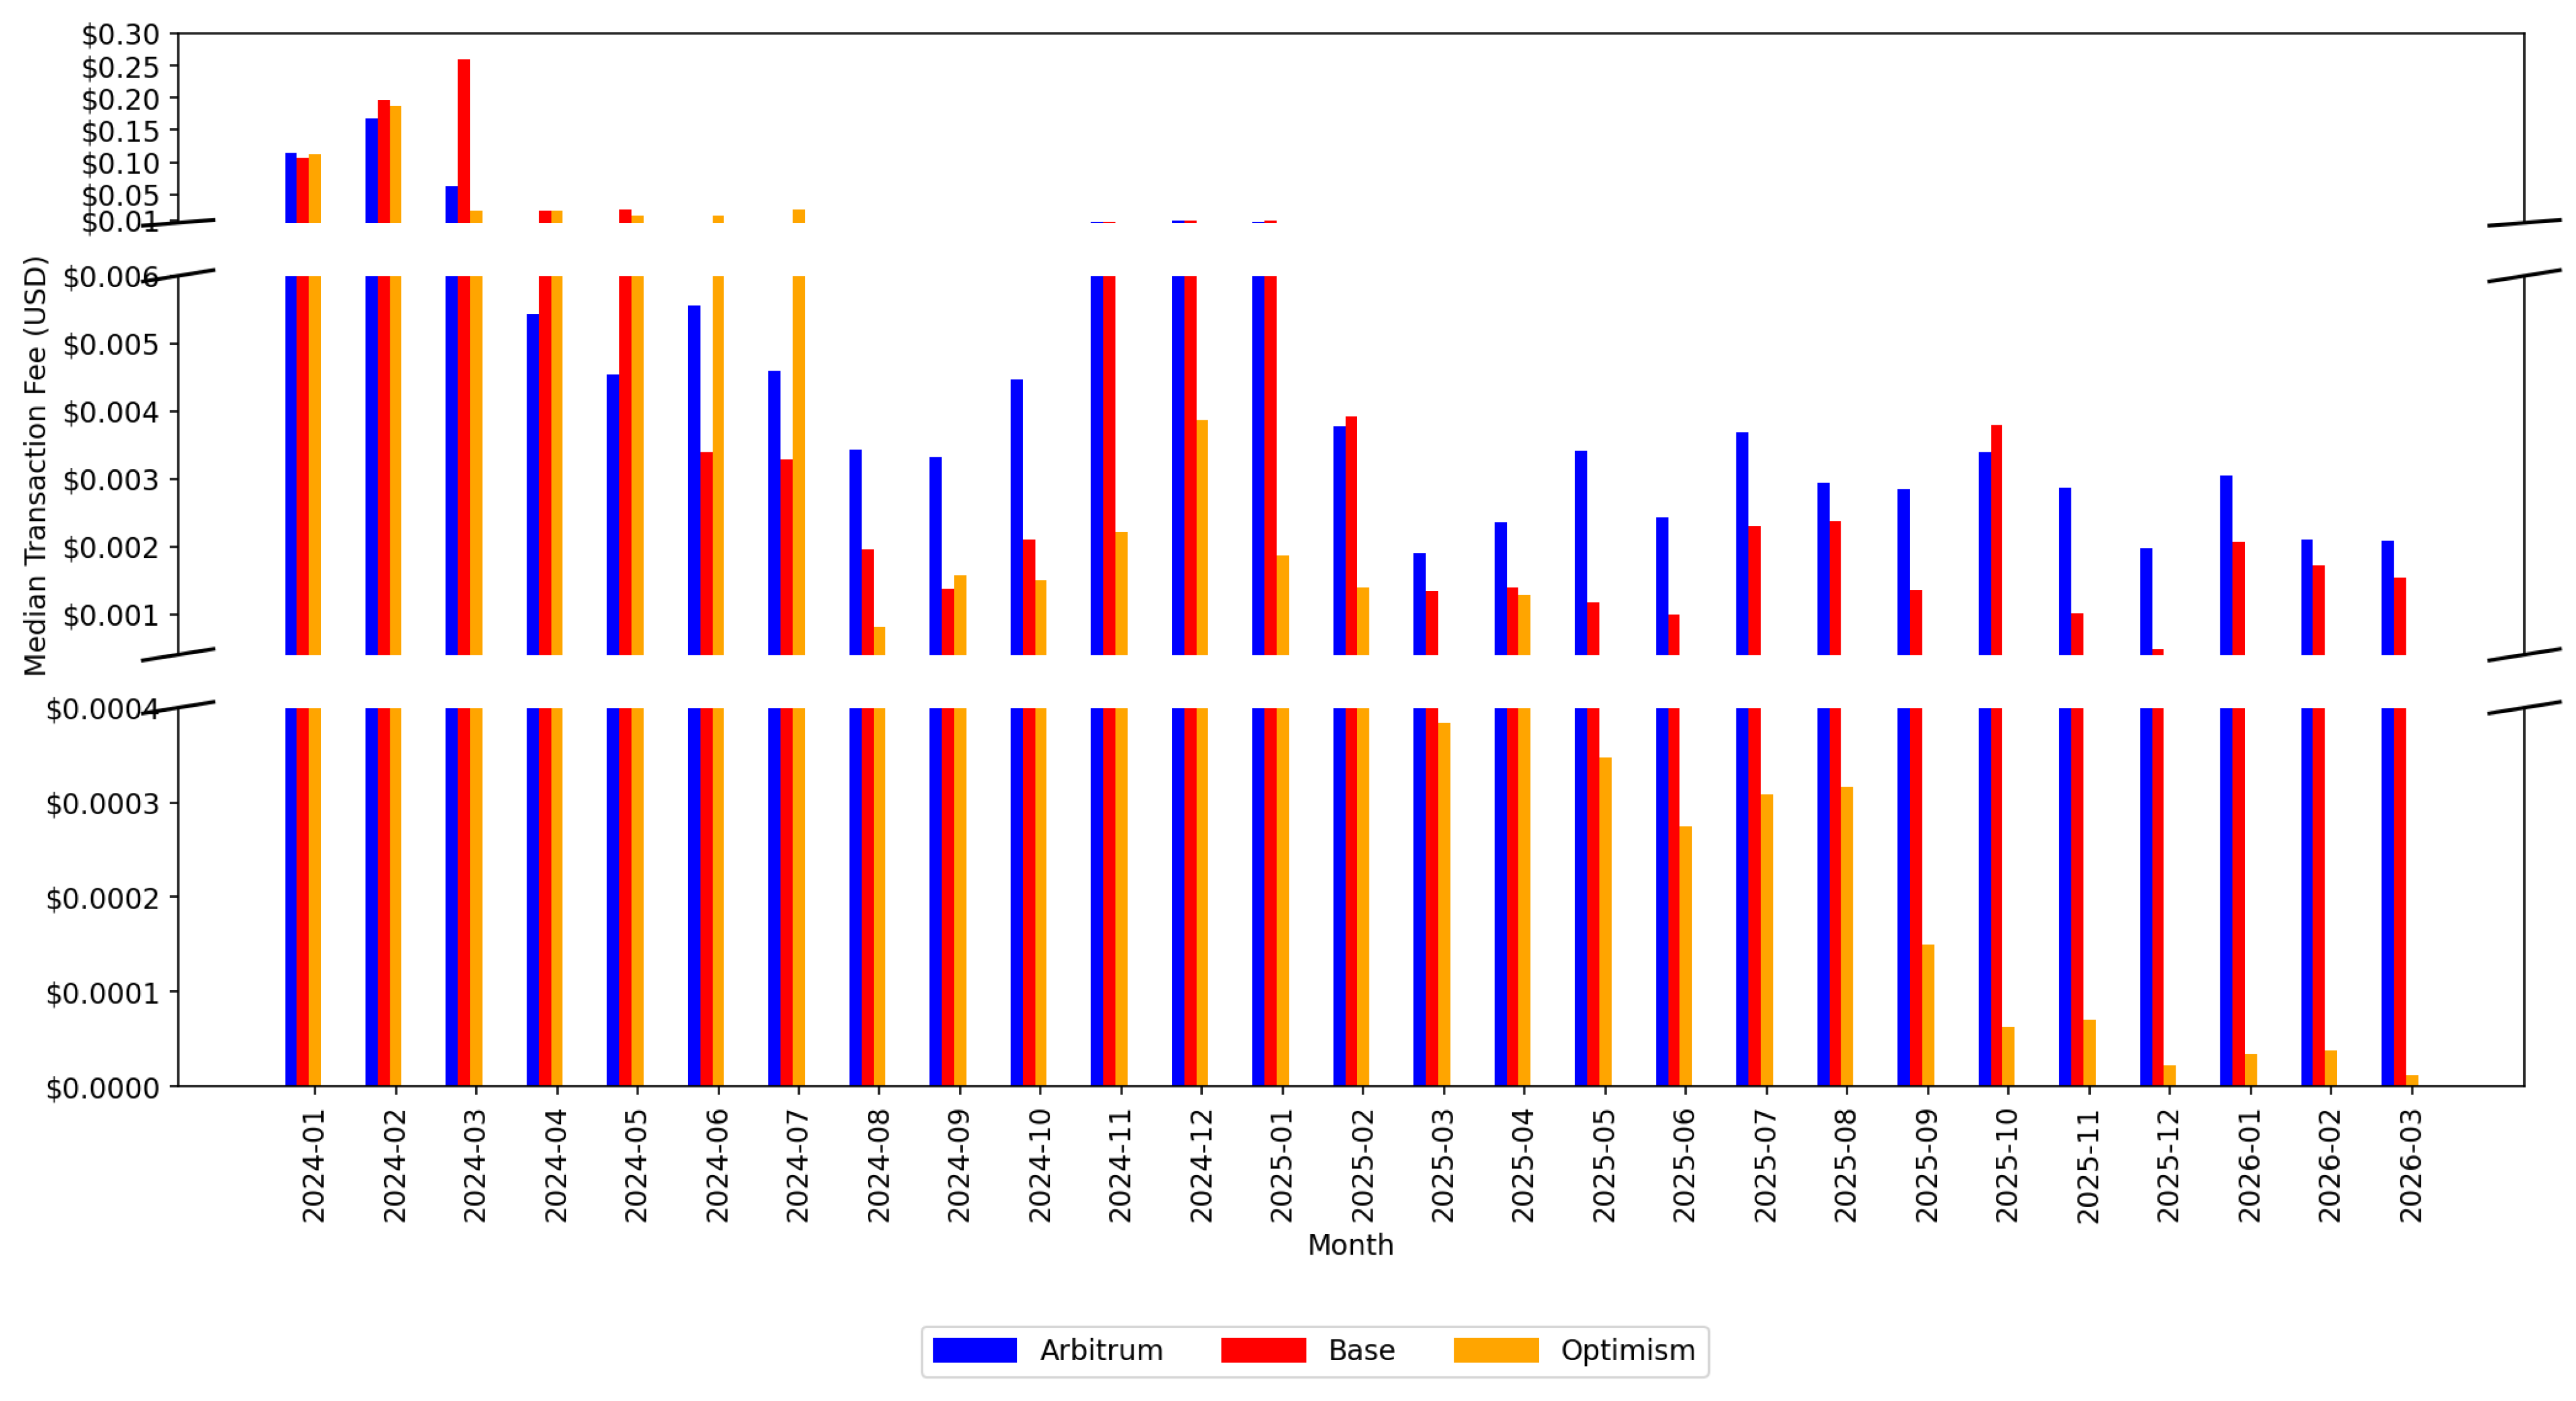
Figure 16 displays median transaction fees in USD for Arbitrum, Base, and Optimism from January 2024 through March 2026.
Following the Dencun upgrade in March 2024, all three networks experienced fee declines. Fees spiked again in late 2024 before falling further after the Pectra upgrade in May 2025, after which all three networks converged to their lowest levels of the sample period.
Optimism became consistently below Arbitrum in August 2024 and Base in October 2024. It remains, on average, 78.1% below Arbitrum and 75.2% below Base.
Since May 2025, Optimism’s median transaction fees have fallen below Solana’s, averaging 81.7% lower across the eleven months. All three L2s have consistently been below Mainnet fees for the entire period.
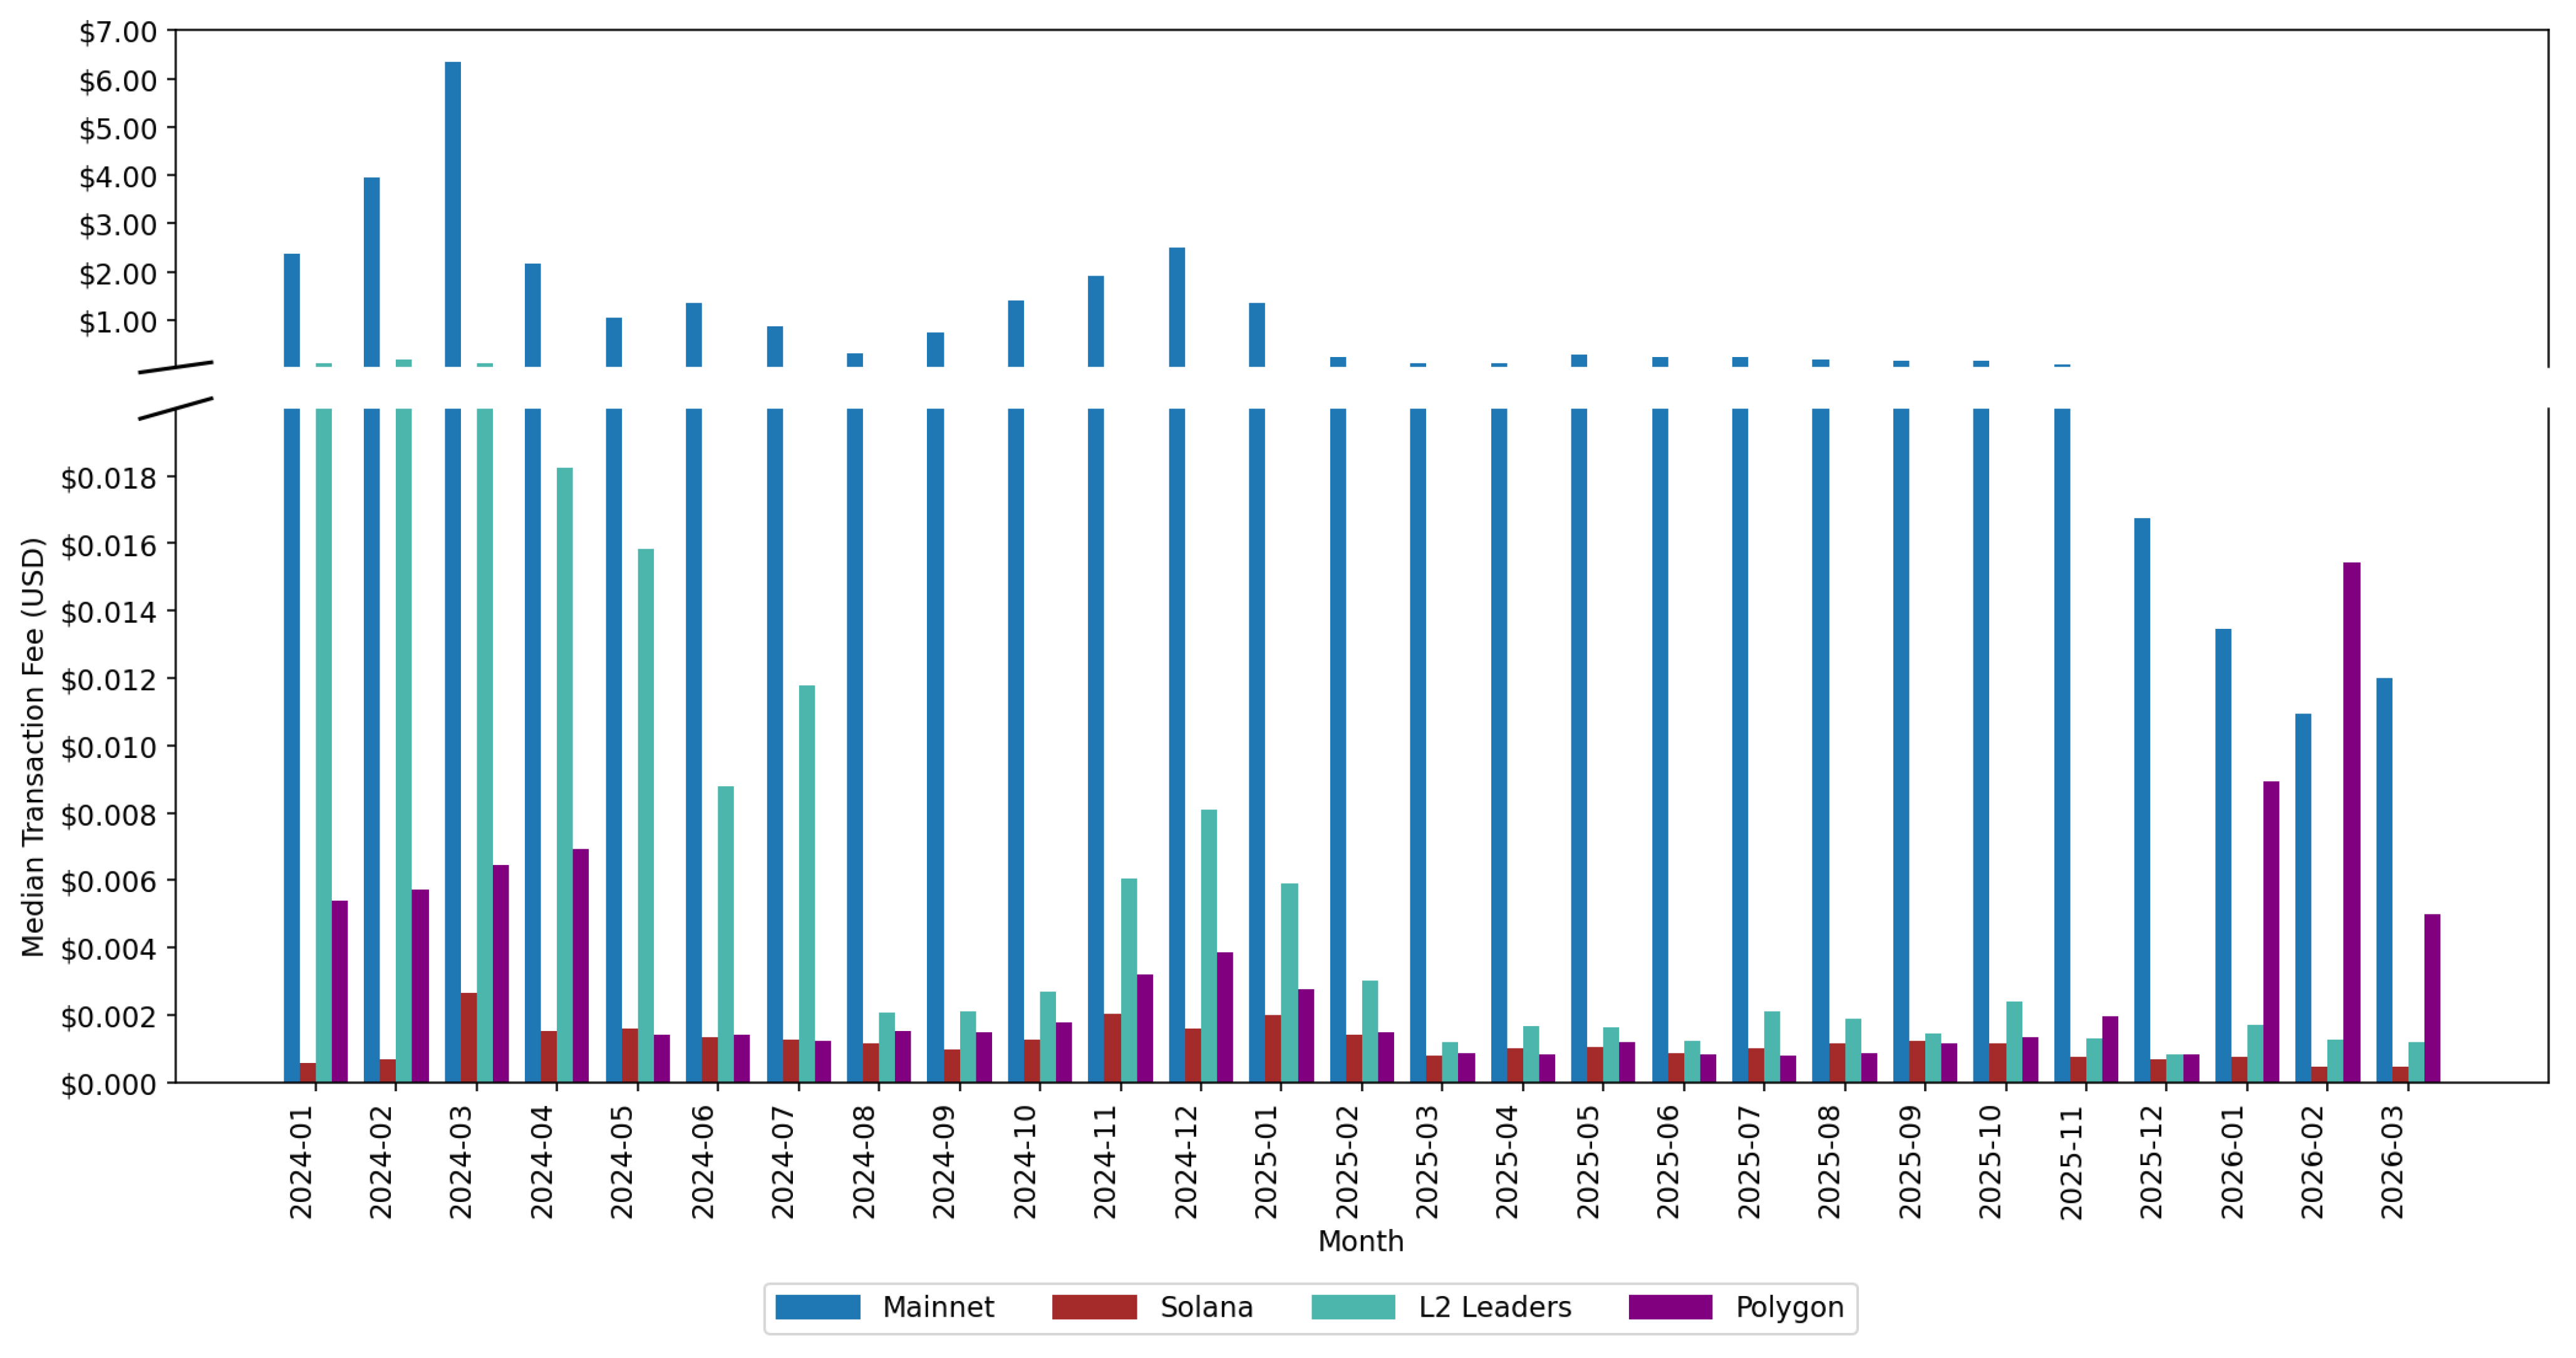
Figure 17 shows the monthly median transaction fees in USD for the Mainnet, the L2 Leaders, Solana, and Polygon from January 2024 through March 2026.
Each increase in the target blob count was associated with lower L2 transaction fees. Before the introduction of blobs through the Dencun upgrade, the L2 Leader fee was $0.2107. The introduction of three target blobs under Dencun reduced this by 95.5% to $0.0095. Subsequent increases to six blobs under Pectra and 10 blobs under BPO-1 further reduced the fees to $0.0019 and $0.0013. The most recent increase to 14 blobs under BPO-2 saw fees rise slightly to $0.0015.
As reported in
Table 2, Solana provided, on average, the lowest median transaction fees across our sample period. However, there were seven months when Polygon had lower median fees than Solana, during the second and third quarters of both 2024 and 2025. During these months, Polygon was on average 10.9% below Solana.
7. Transactions per Second Forecasts
The previous sections study the historical differences in transaction speed and cost across the Mainnet and its competitors. We now examine how the gas limit affects Mainnet TPS and how the target blob count affects L2 TPS. We extend this study to include forecasts for both Mainnet and L2 TPS and compare the forecasts to our projected Solana speeds.
Our first step is to show that gas limits are causal for Mainnet TPS and blobs for Layer 2 TPS. Dickey-Fuller [
29] and KPSS [
30] tests confirm that the data are difference stationary. Our tests for cointegration are mixed, so we use Toda-Yamamoto [
31] tests for causality. The results are shown in
Table 4:
The [
31] tests do not only show causality from the protocol changes to TPS; they also show that the impact is significant for five to seven days.
To rule out spurious regression influences, we also confirm using Granger–Newbold [
32] tests that the Durbin–Watson statistic exceeds the
for the models in
Table 4.
7.1. Transactions per Second on the Ethereum Mainnet
To study the impact of the gas limit on Mainnet TPS, we begin our sample in January 2025, when the gas limit began to increase toward 35 million.
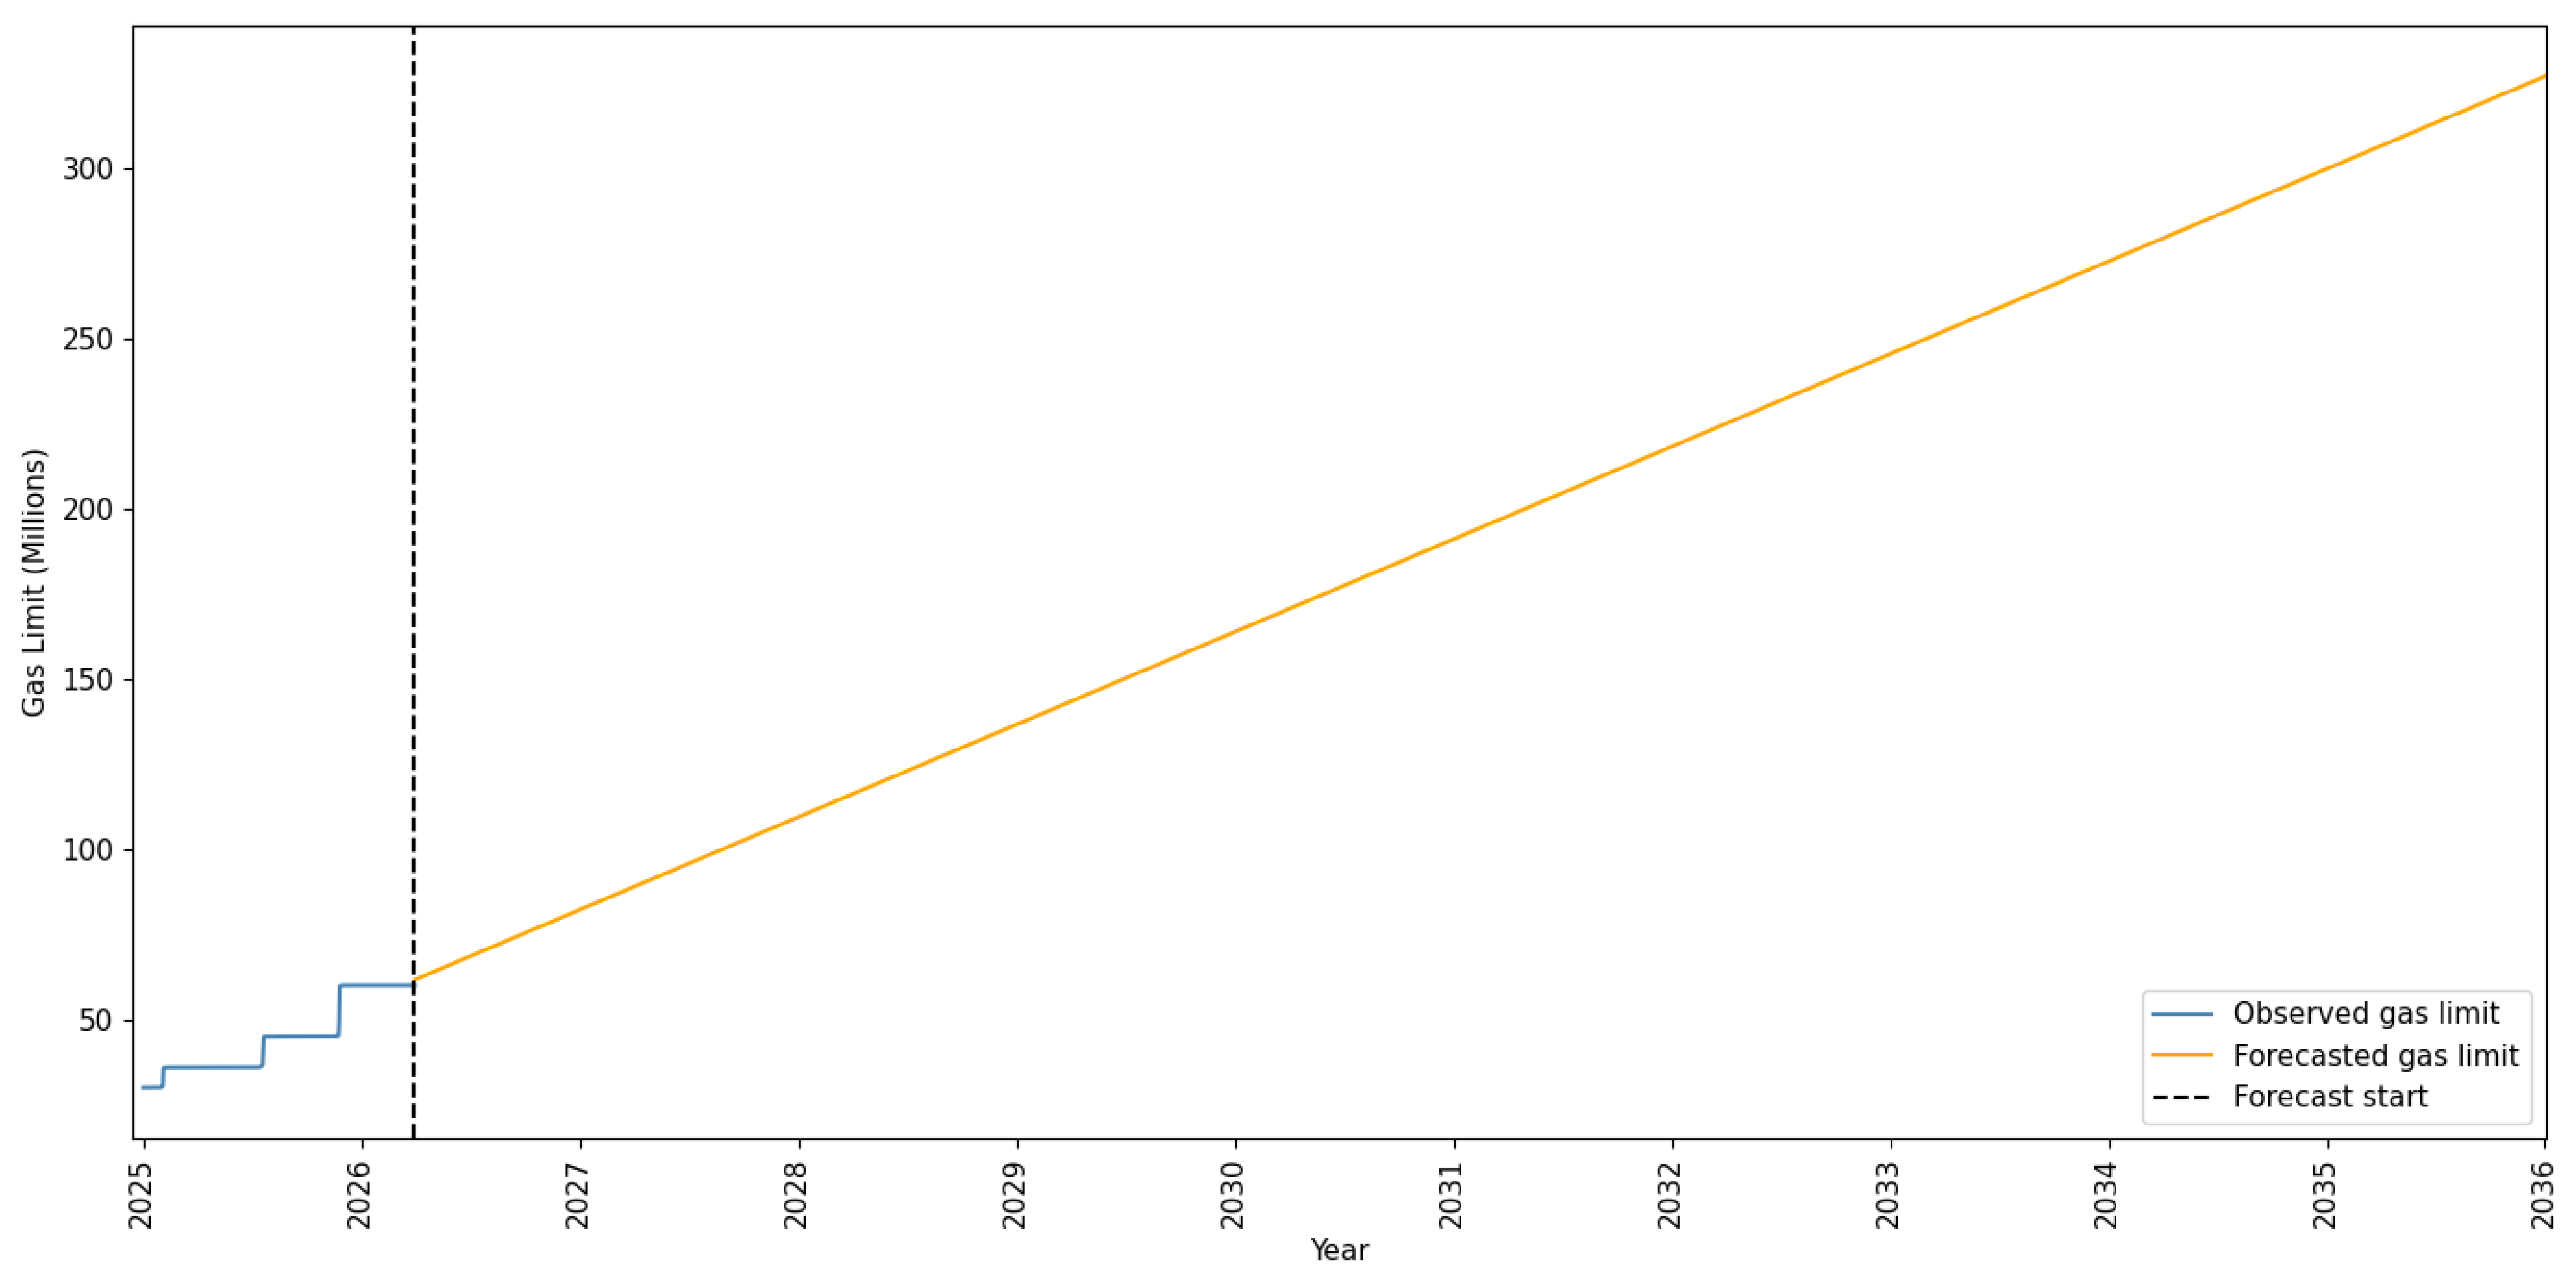
Table 5 reports the estimates from a linear time trend regression of the gas limit over the period of 1 January 2025 through 31 March 2026. The time trend coefficient of
indicates that the gas limit increases by 2.2 million units per month under the current growth trajectory.
Applying the results from
Table 5, we first utilize this forecasting model for the gas limit,
where
with
corresponding to 1 January 2025 and
corresponding to 31 March 2026, and
indexing days into the forecast horizon.
Figure 18 presents the forecast of gas limit values until 2036.
Having established the trajectory of the gas limit under the current growth trend, we now determine the impact that the gas limit has on the Mainnet TPS.
Table 6 reports the regression results.
Each additional unit of gas limit capacity is associated with roughly more transactions processed per second. Therefore, a 10,000,000-unit increase in the gas limit is associated with 3.52 more transactions processed every second. Doubling the gas limit to 120 million would result in 21 additional transactions processed every second on top of the baseline. At the current gas limit of approximately 60 million, the model estimates 24 transactions per second. For March 2026 the average Mainnet TPS was 25.59.
Given the substantial gap between the Mainnet and Solana TPS, we accordingly narrow the analysis to forecast when the Mainnet will reach 100 TPS. Solving for the gas limit required to achieve 100 TPS using
Table 6 estimated coefficients yields:
The model predicts that 100 TPS on the Mainnet requires a gas limit of approximately 276.5 million. At the current gas limit of approximately 60 million, this represents a 4.6-fold increase from current levels. Substituting the predicted gas limit values using
Table 5 results, we define our model as follows:
where
with
corresponding to 1 January 2025 and
corresponding to 31 March 2026, and
indexing days into the forecast horizon. We predict that Mainnet will reach 100 TPS by February 2034, as seen in
Figure 19.
To provide confidence intervals for our forecast, we use the HAC standard errors for the marginal effect of the gas limit on Mainnet TPS from
Table 6. The 95% confidence interval for our forecast ranges from August 2032 to a period after the end of our sample in March 2036.
We compare our Mainnet TPS forecasts to 30-day and 90-day random walks using the [
33] test for forecast accuracy. The model improves upon both random walks at the 99% confidence level.
As a final robustness check, we consider the implications of a model where TPS does not scale linearly with the gas limit but rather as a square root. With this specification, the Mainnet TPS does not reach 100 TPS prior to the end of our sample in March 2036. This is consistent with our conservative forecast for the linear model.
7.2. Gigagas
Under the current growth trajectory, 100 TPS will take almost eight years to reach. However, the Ethereum Foundation has outlined a more aggressive path forward with a goal to reach one gigagas per second.
The L1 Strawmap proposes an increase in the gas limit by a factor of ten every two years, totaling a 100-fold increase over four years under EIP-7938 [
7]. This upgrade is not expected to activate until 2027. Therefore, we use the time trend model in
Table 5 to forecast the gas limit until 2027, at which point the EIP formula is applied.
where
with
corresponding to 1 January 2025 and
corresponding to 31 March 2026, and
indexing days into the forecast horizon.
corresponds to 1 January 2027,
corresponds to 31 December 2030. The gas limit increases by a factor of ten every two years, with the upper threshold at
after four years. Mainnet TPS is then forecast using the first line of Equation (
3)
Figure 20 presents the forecast gas limit under the combined 1 January 2025 to 31 March 2026 trendline and EIP-7938 exponential growth schedule.
The gas limit grows gradually through 2027 following the observed 2025 trend, after which the EIP formula takes effect, producing a sharp exponential increase. Under EIP-7938, the Mainnet reaches 100 TPS by January 2028, more than six years earlier than when using current trends. The gas limit is projected to level off at 8.22 billion at the end of 2030 with the Mainnet at 2896 TPS.
7.3. Transactions per Second on the L2 Networks
We now study the impact of the target blob count on L2 total TPS.
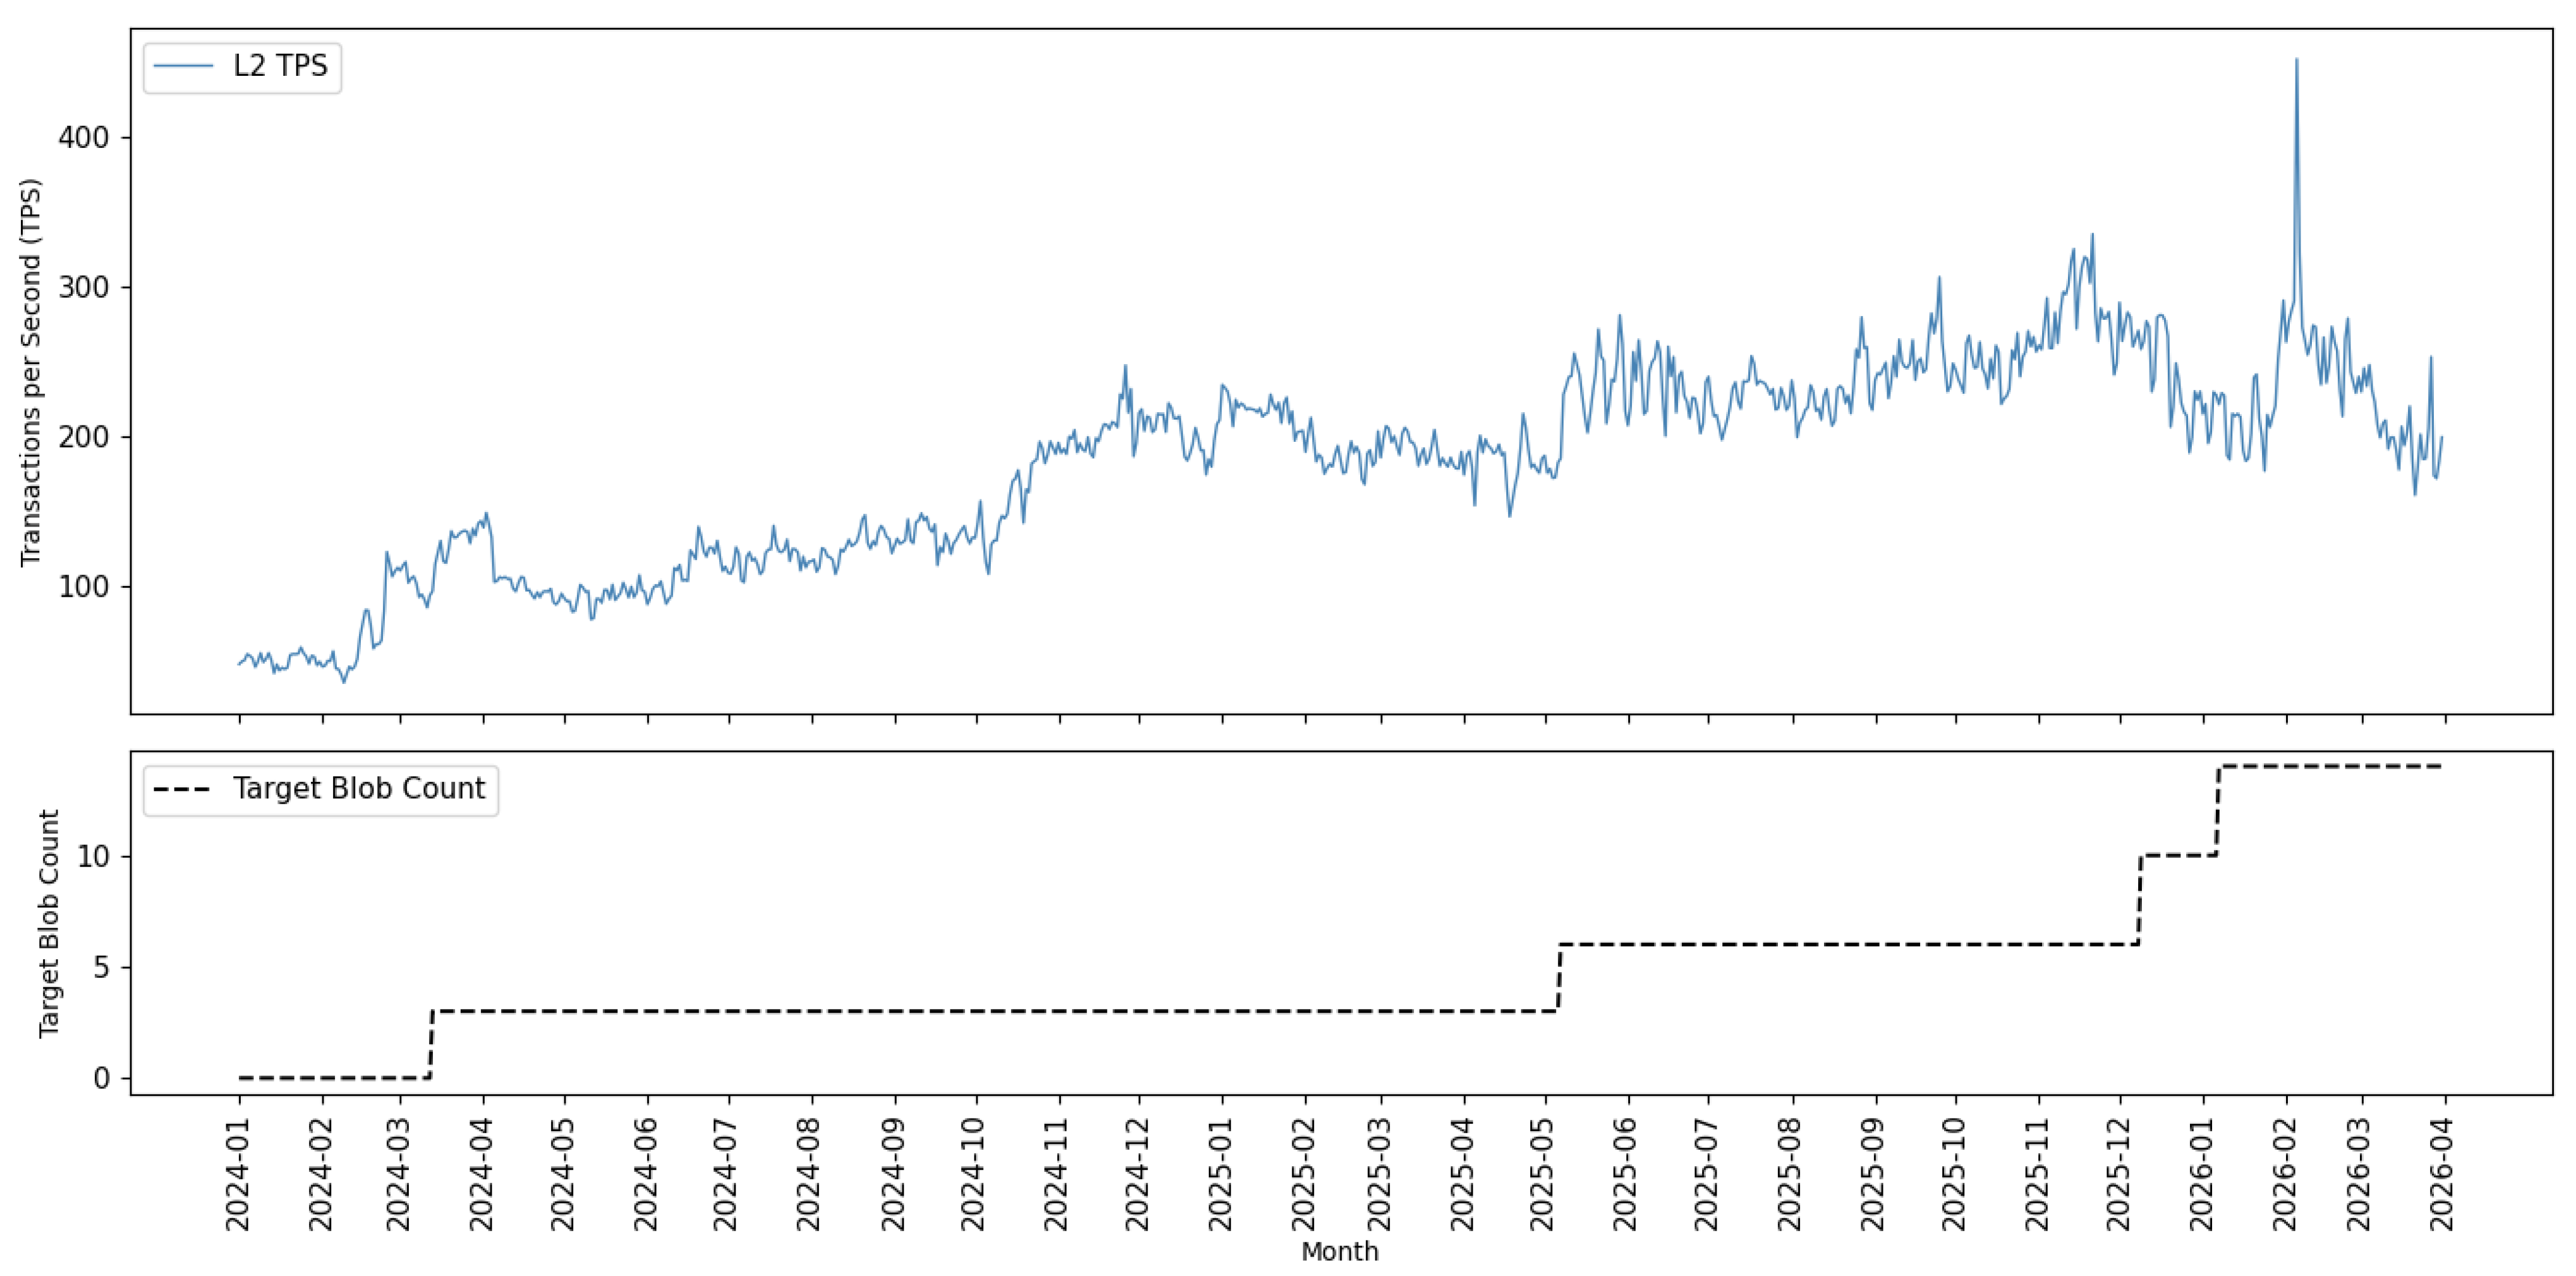
Figure 21 plots L2 total TPS alongside the target blob count from January 2024 through March 2026.
The step increases in the target blob count correspond to the Dencun upgrade in March 2024, the Pectra upgrade in May 2025, and the BPO activations in December 2025 and January 2026. From January 2024 through November 2025, TPS rose broadly in line with each increase in the target blob count. Following the second BPO activation in January 2026, TPS spiked sharply before declining through 2026 Q1, ending with TPS below pre-BPO levels.
Table 7 quantifies the impact target blobs have on TPS.
Each additional target blob is associated with 10.75 more L2 total TPS. Increasing the blob count by four, as it was with both BPOs, results in an increase of 43 TPS. At the current target blob count of 14, the model predicts a baseline of 278.96 L2 total TPS. The average TPS since the second BPO activation was 227.77.
We now turn to our forecast of TPS and construct our projection to maintain the stepwise nature of the target blob increases. BPO-1 and BPO-2 each added four blobs to the target, 30 days apart, giving an increment rate of four blobs per 30 days defined as:
where
t is 1 April 2026 and
indexes days into the forecast horizon. We apply this same increment schedule going forward until the target blob count reaches 300. The Strawmap projects one gigagas per second for the Layer 2s, so this target is very conservative. The projected target blob count is then used to forecast L2 TPS using the coefficients from
Table 7:
where
denotes L2 total TPS and
denotes the projected target blob count from Equation (
5).
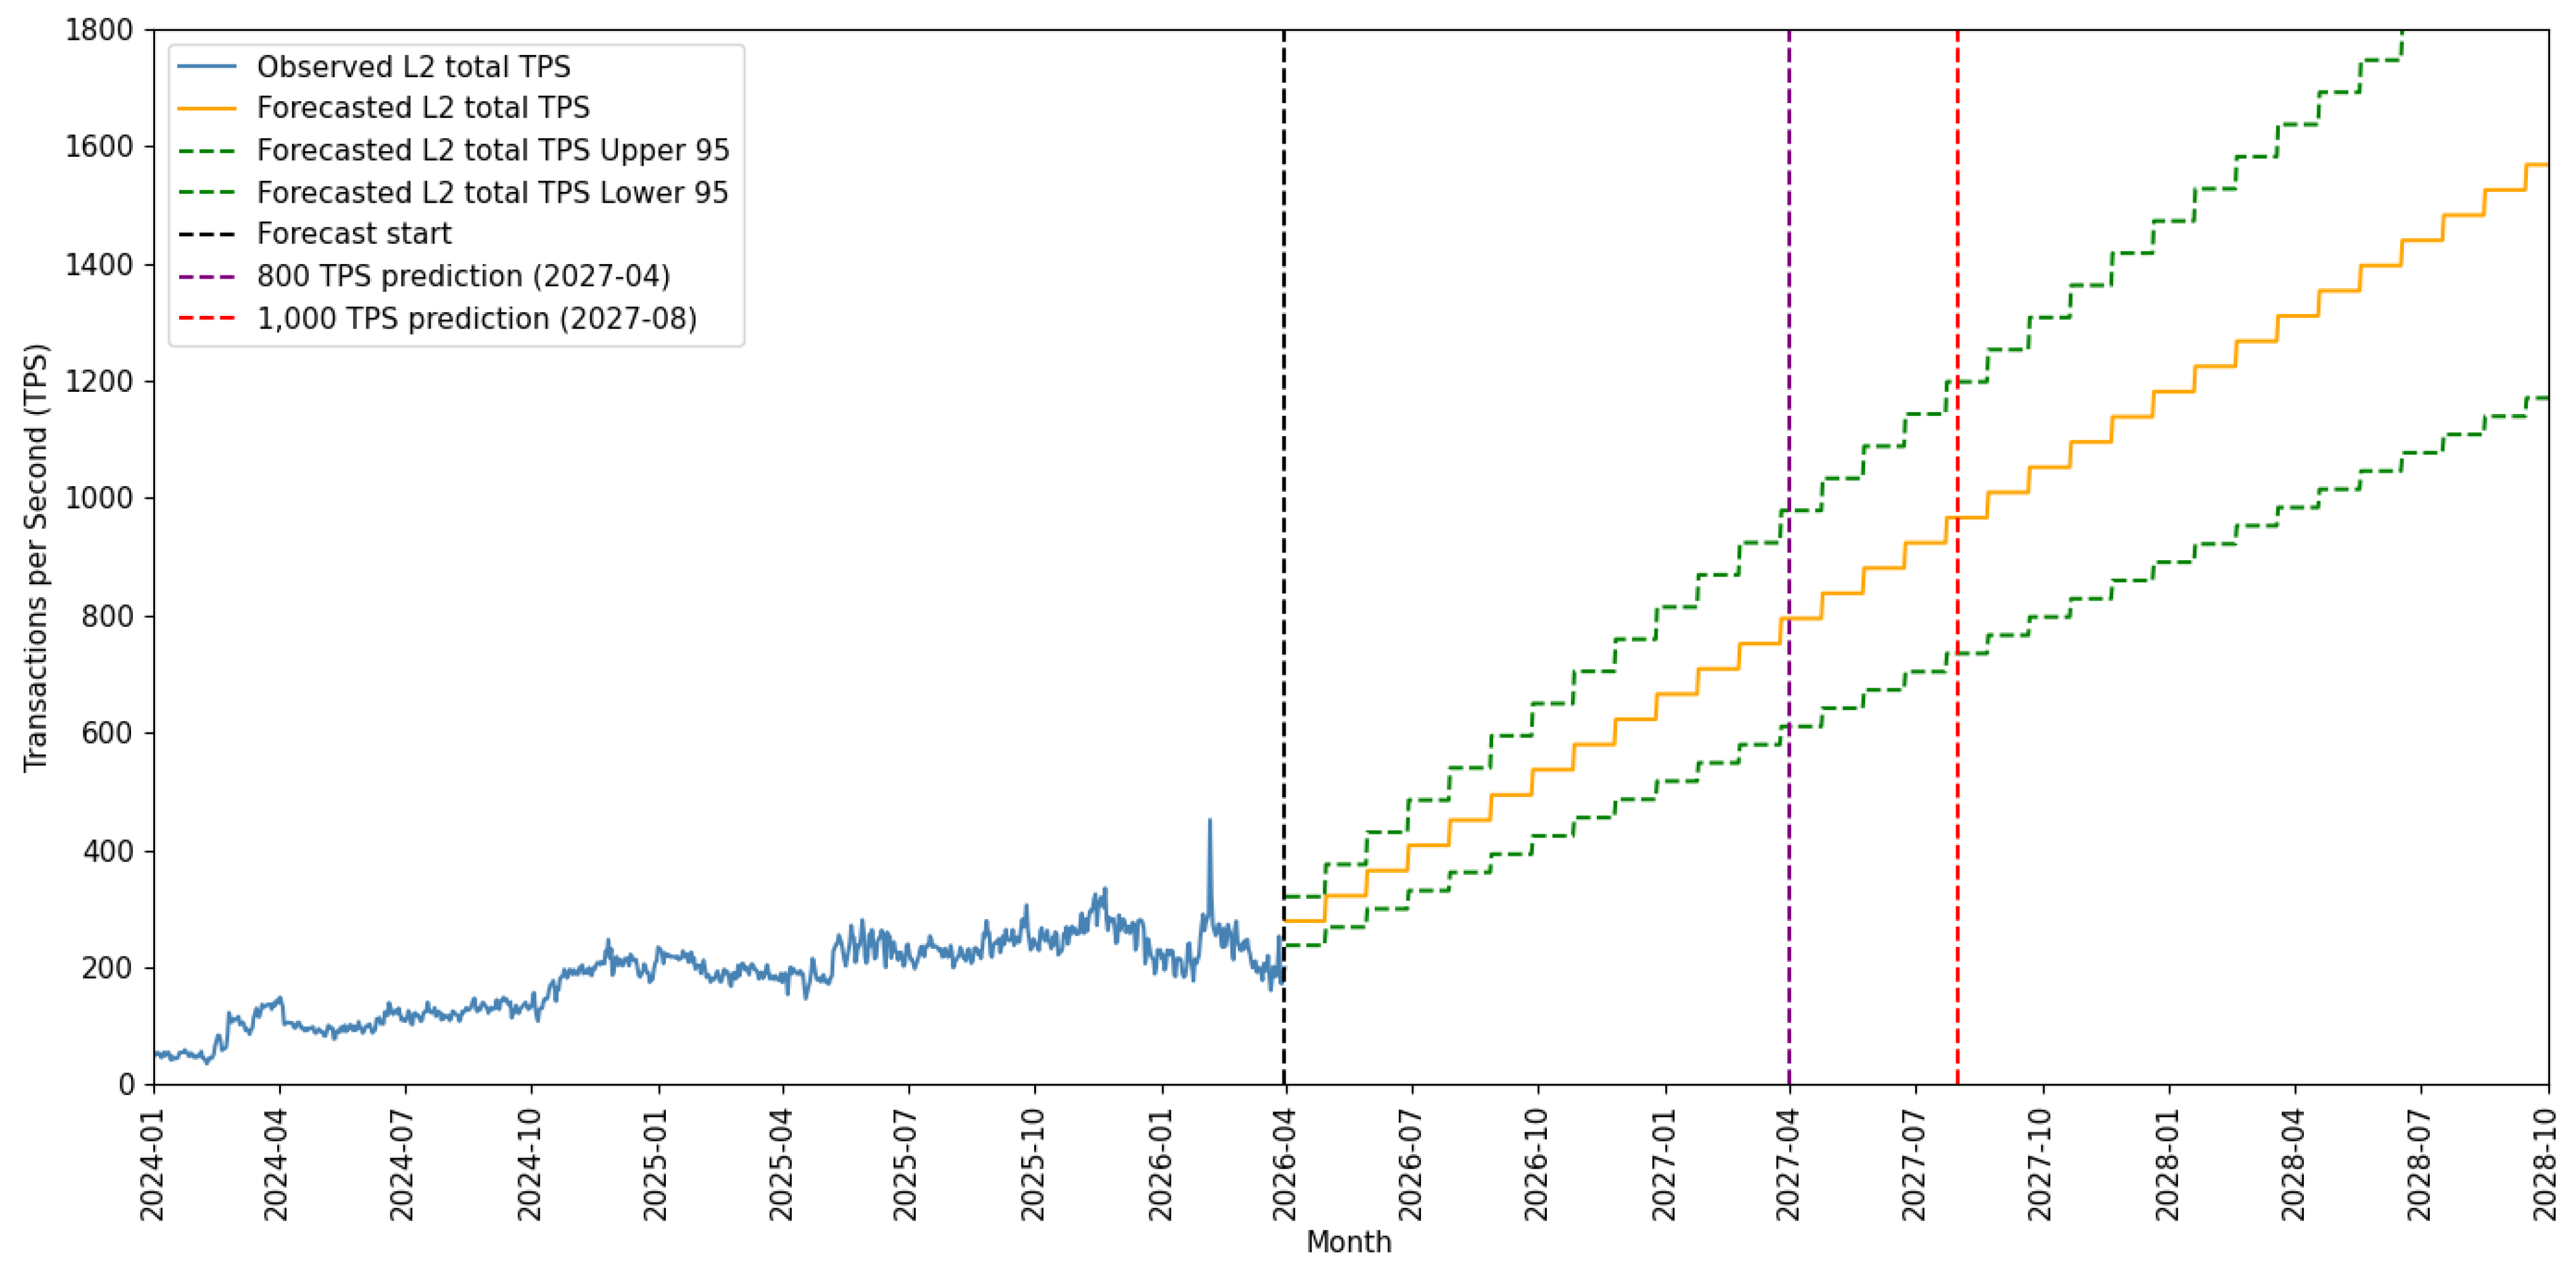
Figure 22 displays the forecasted L2 total TPS under our defined blob count increase structure.
We construct confidence intervals for these forecasts as we did for the Mainnet, using the HAC standard errors for the marginal effect of the blob target from
Table 7.
L2 total is expected to reach 800 TPS in April 2027 at 66 blobs and 1000 TPS in August 2027 at 82 blobs. The 95% confidence interval for our forecast ranges from December 2026 to October 2027 for 800 TPS and from April 2027 to April 2028 for 1000 TPS.
We compare our Layer 2 TPS forecasts to 30-day and 90-day random walks using [
33]. The model does not provide a significant improvement over the 30-day random walk, but it does improve upon the 90th day at the 95% confidence level.
Using the square root specification for the blob target, the Layer 2 total TPS reaches 800 TPS in December 2029. It does not reach 1000 TPS prior to the end of our sample in March 2036.
7.4. Solana Crossover Prediction
We now examine when L2 total will close the speed gap with Solana. For 2026 Q1, Solana had an average daily TPS of 1303.46 and the combined total for the L2s was 226.92, a difference of 1076.54 TPS.
The L2 total forecast is directly from
Section 7.3. Solana TPS is extrapolated using a linear time trend fit to historical data from 1 January 2024 to 31 March 2026 shown in
Table 8:
where
with
corresponding to 1 January 2024 and
corresponding to 31 March 2026, and
indexes days into the forecast horizon.
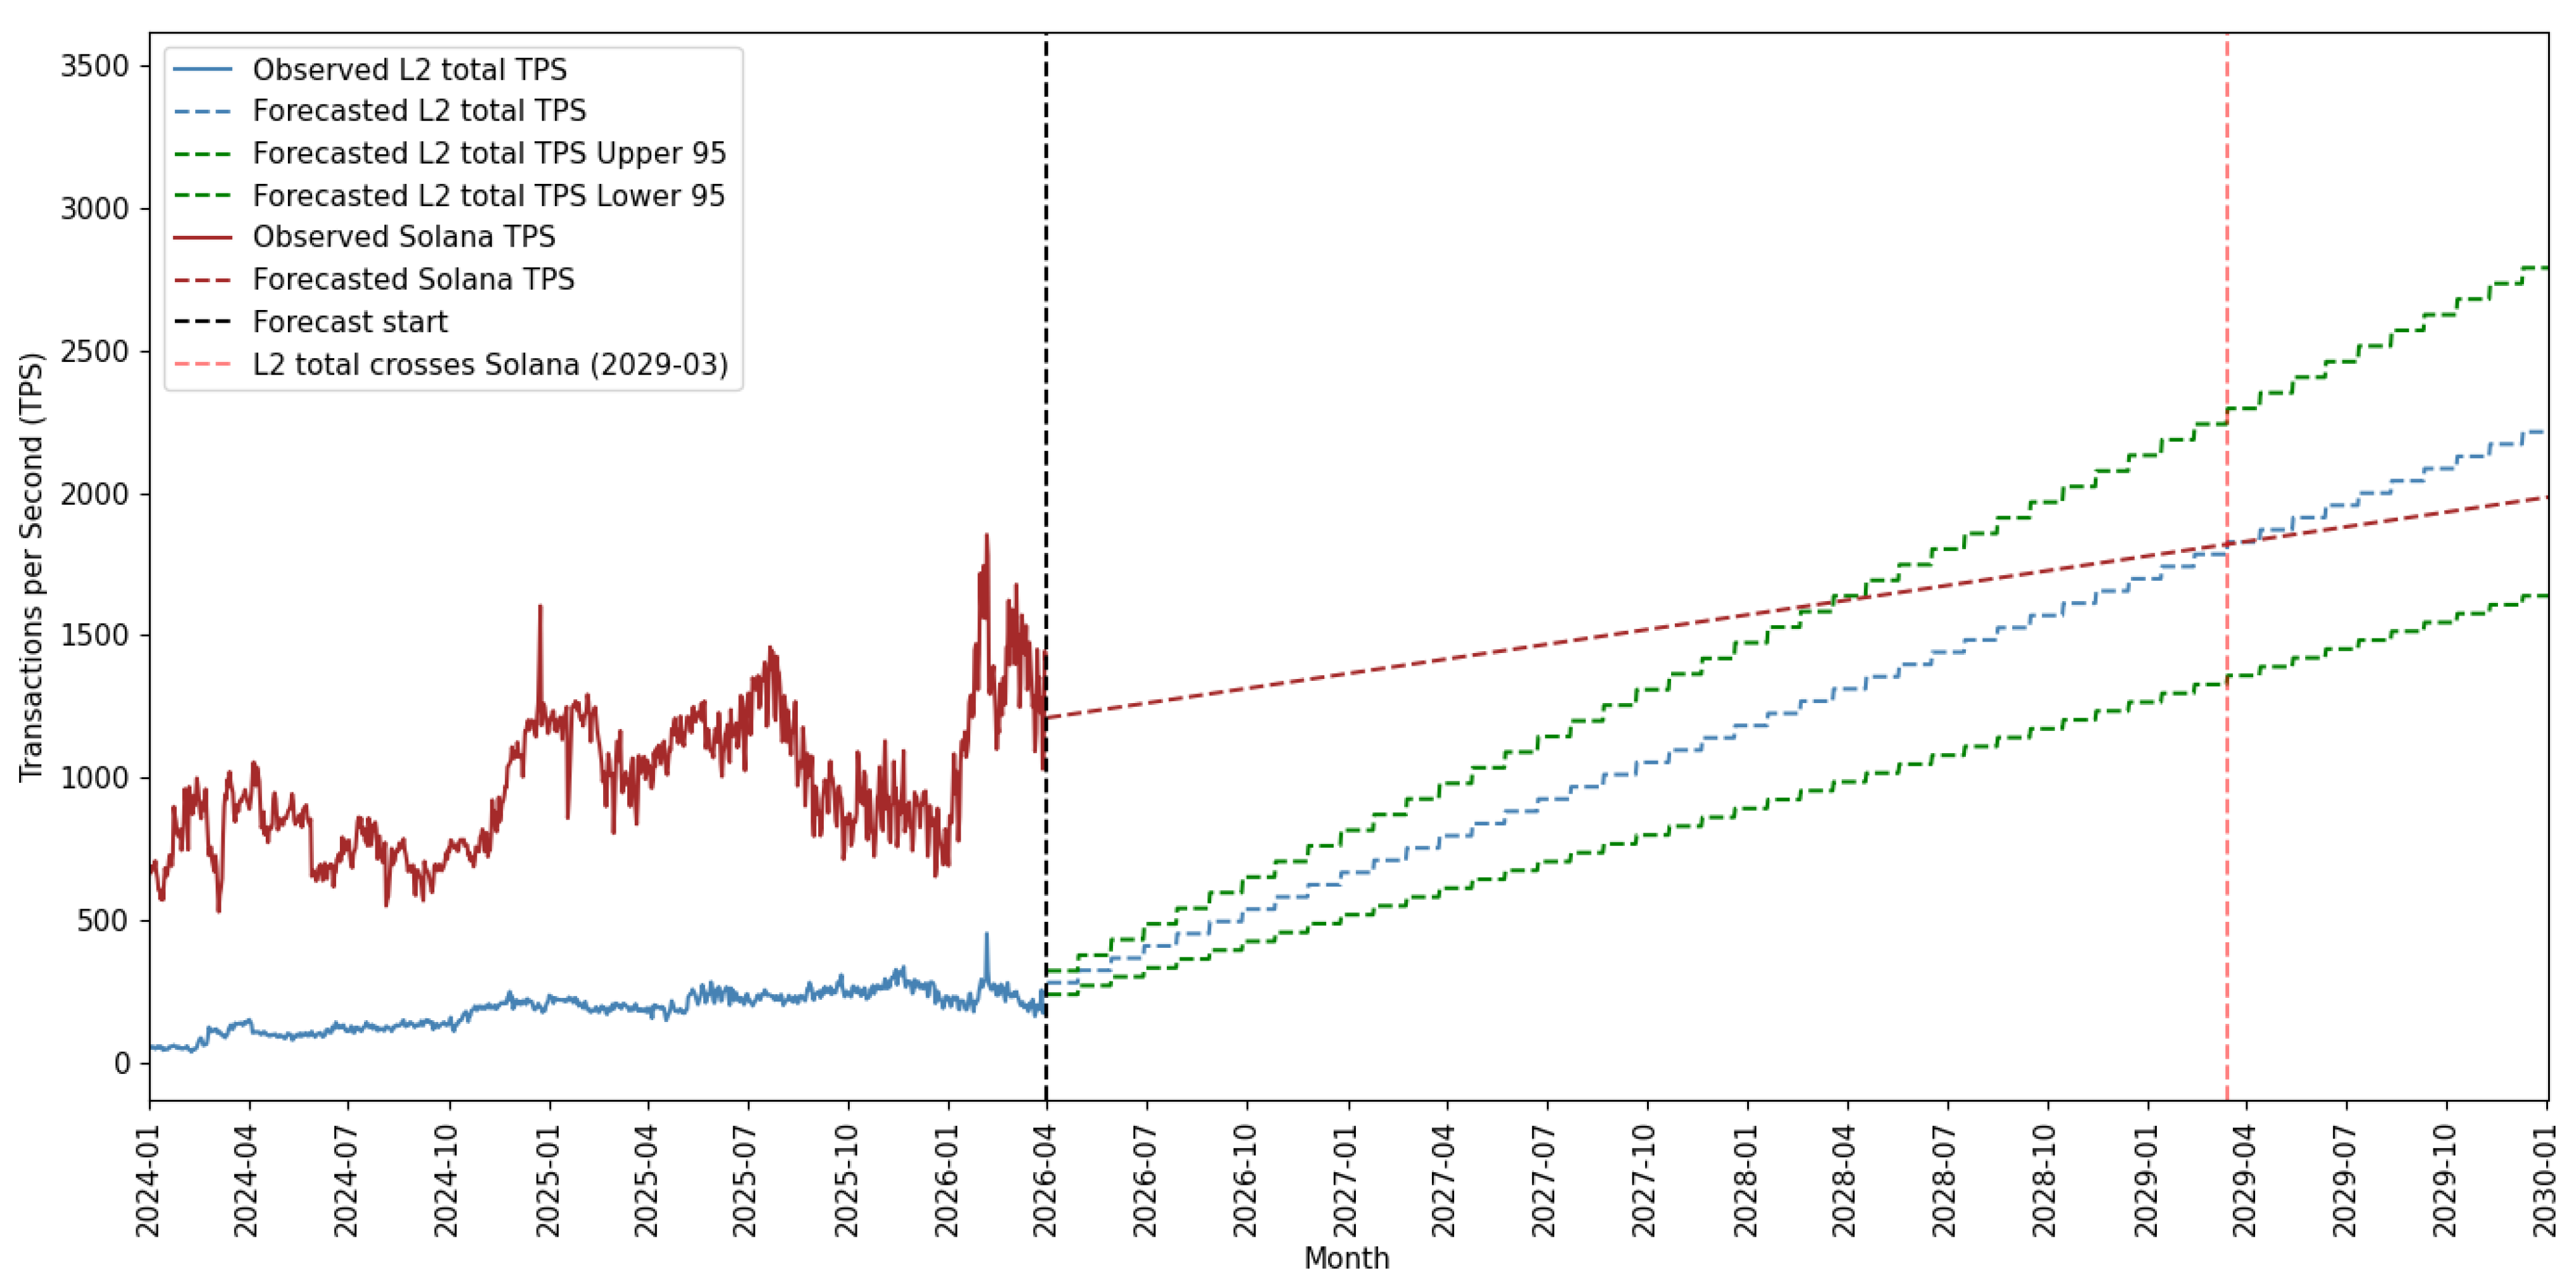
Figure 23 presents historical and forecasted TPS for L2 Total and Solana until 2030.
L2 total TPS is projected to surpass Solana TPS in March 2029, with both networks at approximately 1820 TPS at the crossing point.
We construct confidence intervals for these forecasts as we did for the Mainnet, using the HAC standard errors for the marginal effect of the blob target from
Table 7. The 95% confidence interval for the Solana crossover ranges from March 2028 to November 2031.
Before concluding this section, we provide some analysis of coefficient stability for both TPS forecasts.
Table 9 shows that the effect of the gas limit has remained stable as the gas limits have reached 45 million. It also shows that the effect of blobs on Layer 2 TPS was stable through the end of December 2025.
Our fits for the Layer 2 TPS and blob target models are not as strong as for the gas limit on Mainnet TPS. We can also see a clear slowdown in the growth of Layer 2 TPS in
Figure 21. If demand remains sluggish, the additional blob capacity we forecast may not be utilized by the Ethereum ecosystem.
8. Median Transaction Fee Forecast
The Mainnet is not expected to reach Solana speeds within the next 10 years under the current gas limit trajectory, but the outlook for transaction fees is more favorable. This section will cover predictions for Mainnet fees and compare them with Solana’s forecasted fees.
Our methodology is similar to the forecasts we generate for TPS. After finding the data to be difference stationary, we first show causality from gas limits and blobs to fees using the Toda–Yamamoto [
31] tests in
Table 10.
Granger–Newbold tests [
32] again confirm that the Durbin–Watson test exceeds the
, ruling out a possible spurious relationship.
8.1. Ethereum Mainnet
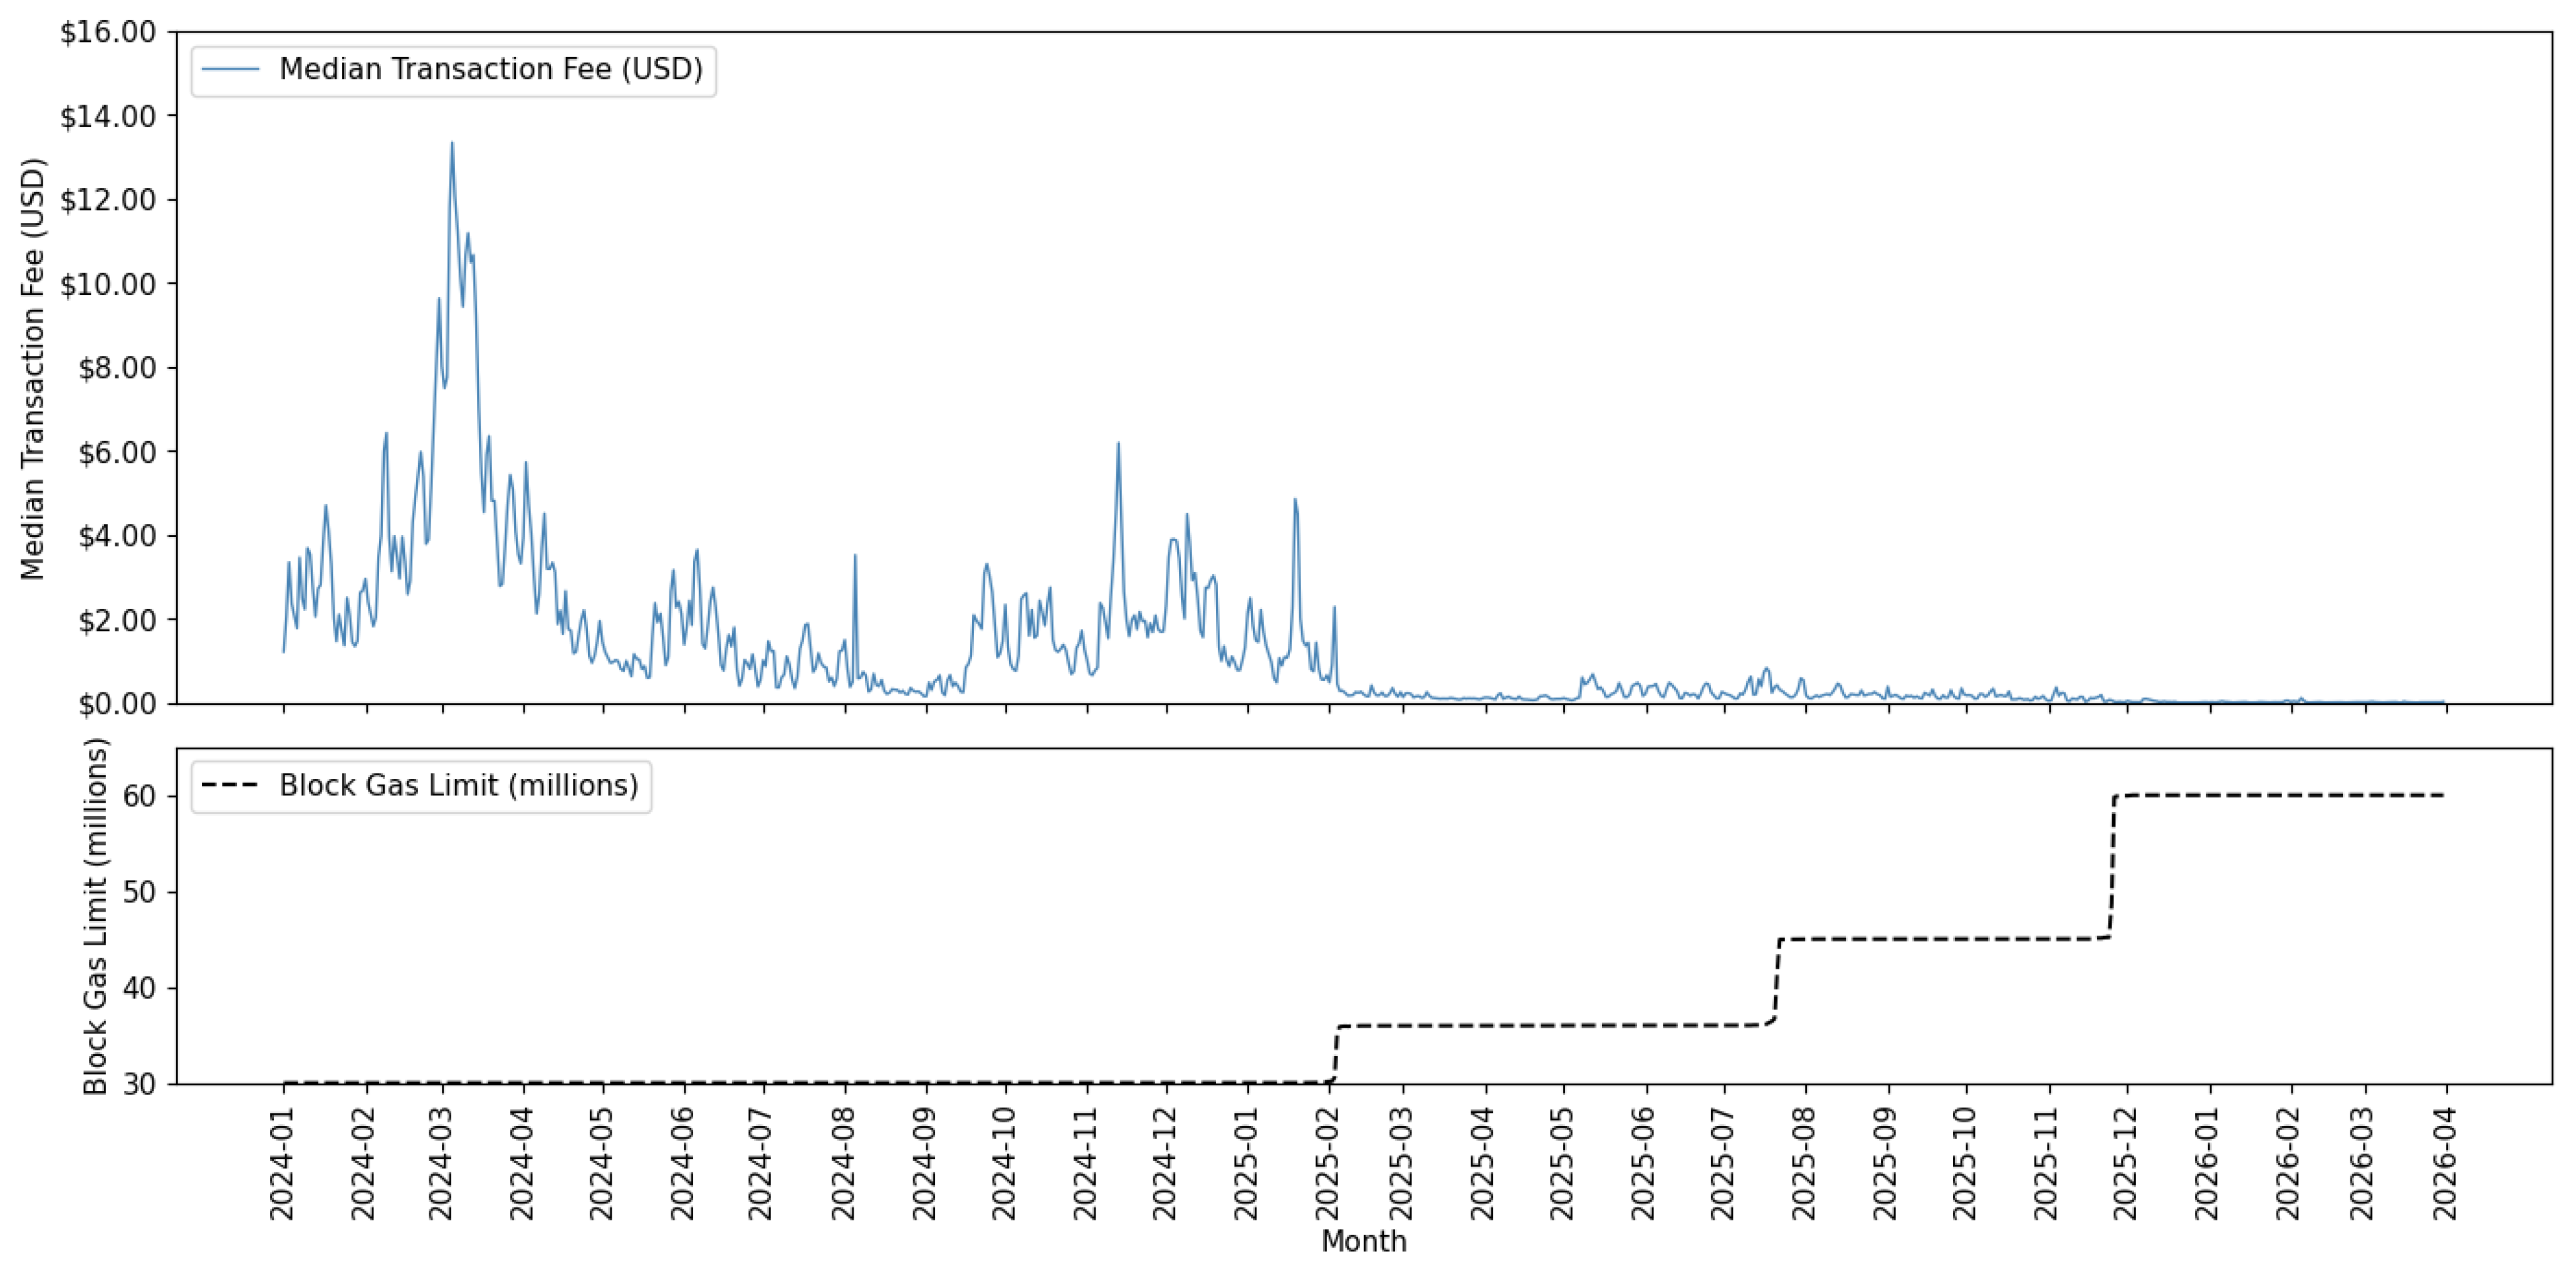
Figure 24 plots the daily median transaction fees on the Mainnet from 1 January 2024, through 31 March 2026.
Fees have declined substantially over this period. The daily median transaction fee for 2024 Q1 was $3.786300, and the fee for 2026 Q1 was $0.012283, a 99.68% decline. Overall, as the gas limit increased, median transaction fees declined. Between 1 January 2024 and 3 February 2025, the gas limit was roughly 30 million. The median transaction fee for this period was $1.317987. Between 4 February 2025 and 20 July 2025, the gas limit was roughly 36 million. The median transaction fee for this period was $0.172602. Between 21 July 2025 and 25 November 2025, the gas limit was roughly 45 million. The median transaction fee for this period was $0.162836. Between 26 November 2025 and 31 March 2026, the gas limit was roughly 60 million. The median transaction fee for this period was $0.012753.
As of 2026 Q1, the median transaction fee is
$0.012283. We are interested in forecasting when the Mainnet median fee will fall to
$0.0005, which is the 2026 Q1 Solana median fee. The estimation results are in
Table 11, which reports the impact of the gas limit on the log median transaction fee. We take the log of the median fee to ensure that the forecasted values remain positive.
A 5-million-unit increase in the gas limit is associated with fees falling by approximately 59.2%. At a gas limit of 60 million, the model predicts that the median fee will be $0.016, which is quite close to Mainnet’s average median fee of $0.013 since the gas limit reached 60 million on 26 November 2025.
To forecast the median fee, we extrapolate the gas limit from the 2025 time trend as estimated in
Table 5. Therefore, recall the gas limit forecast model:
where
with
corresponding to 1 January 2025 and
corresponding to 31 March 2026, and
indexes days into the forecast horizon. Our fee forecast model then becomes:
is given by Equation (
8) and
denotes the daily median transaction fee of the Mainnet.
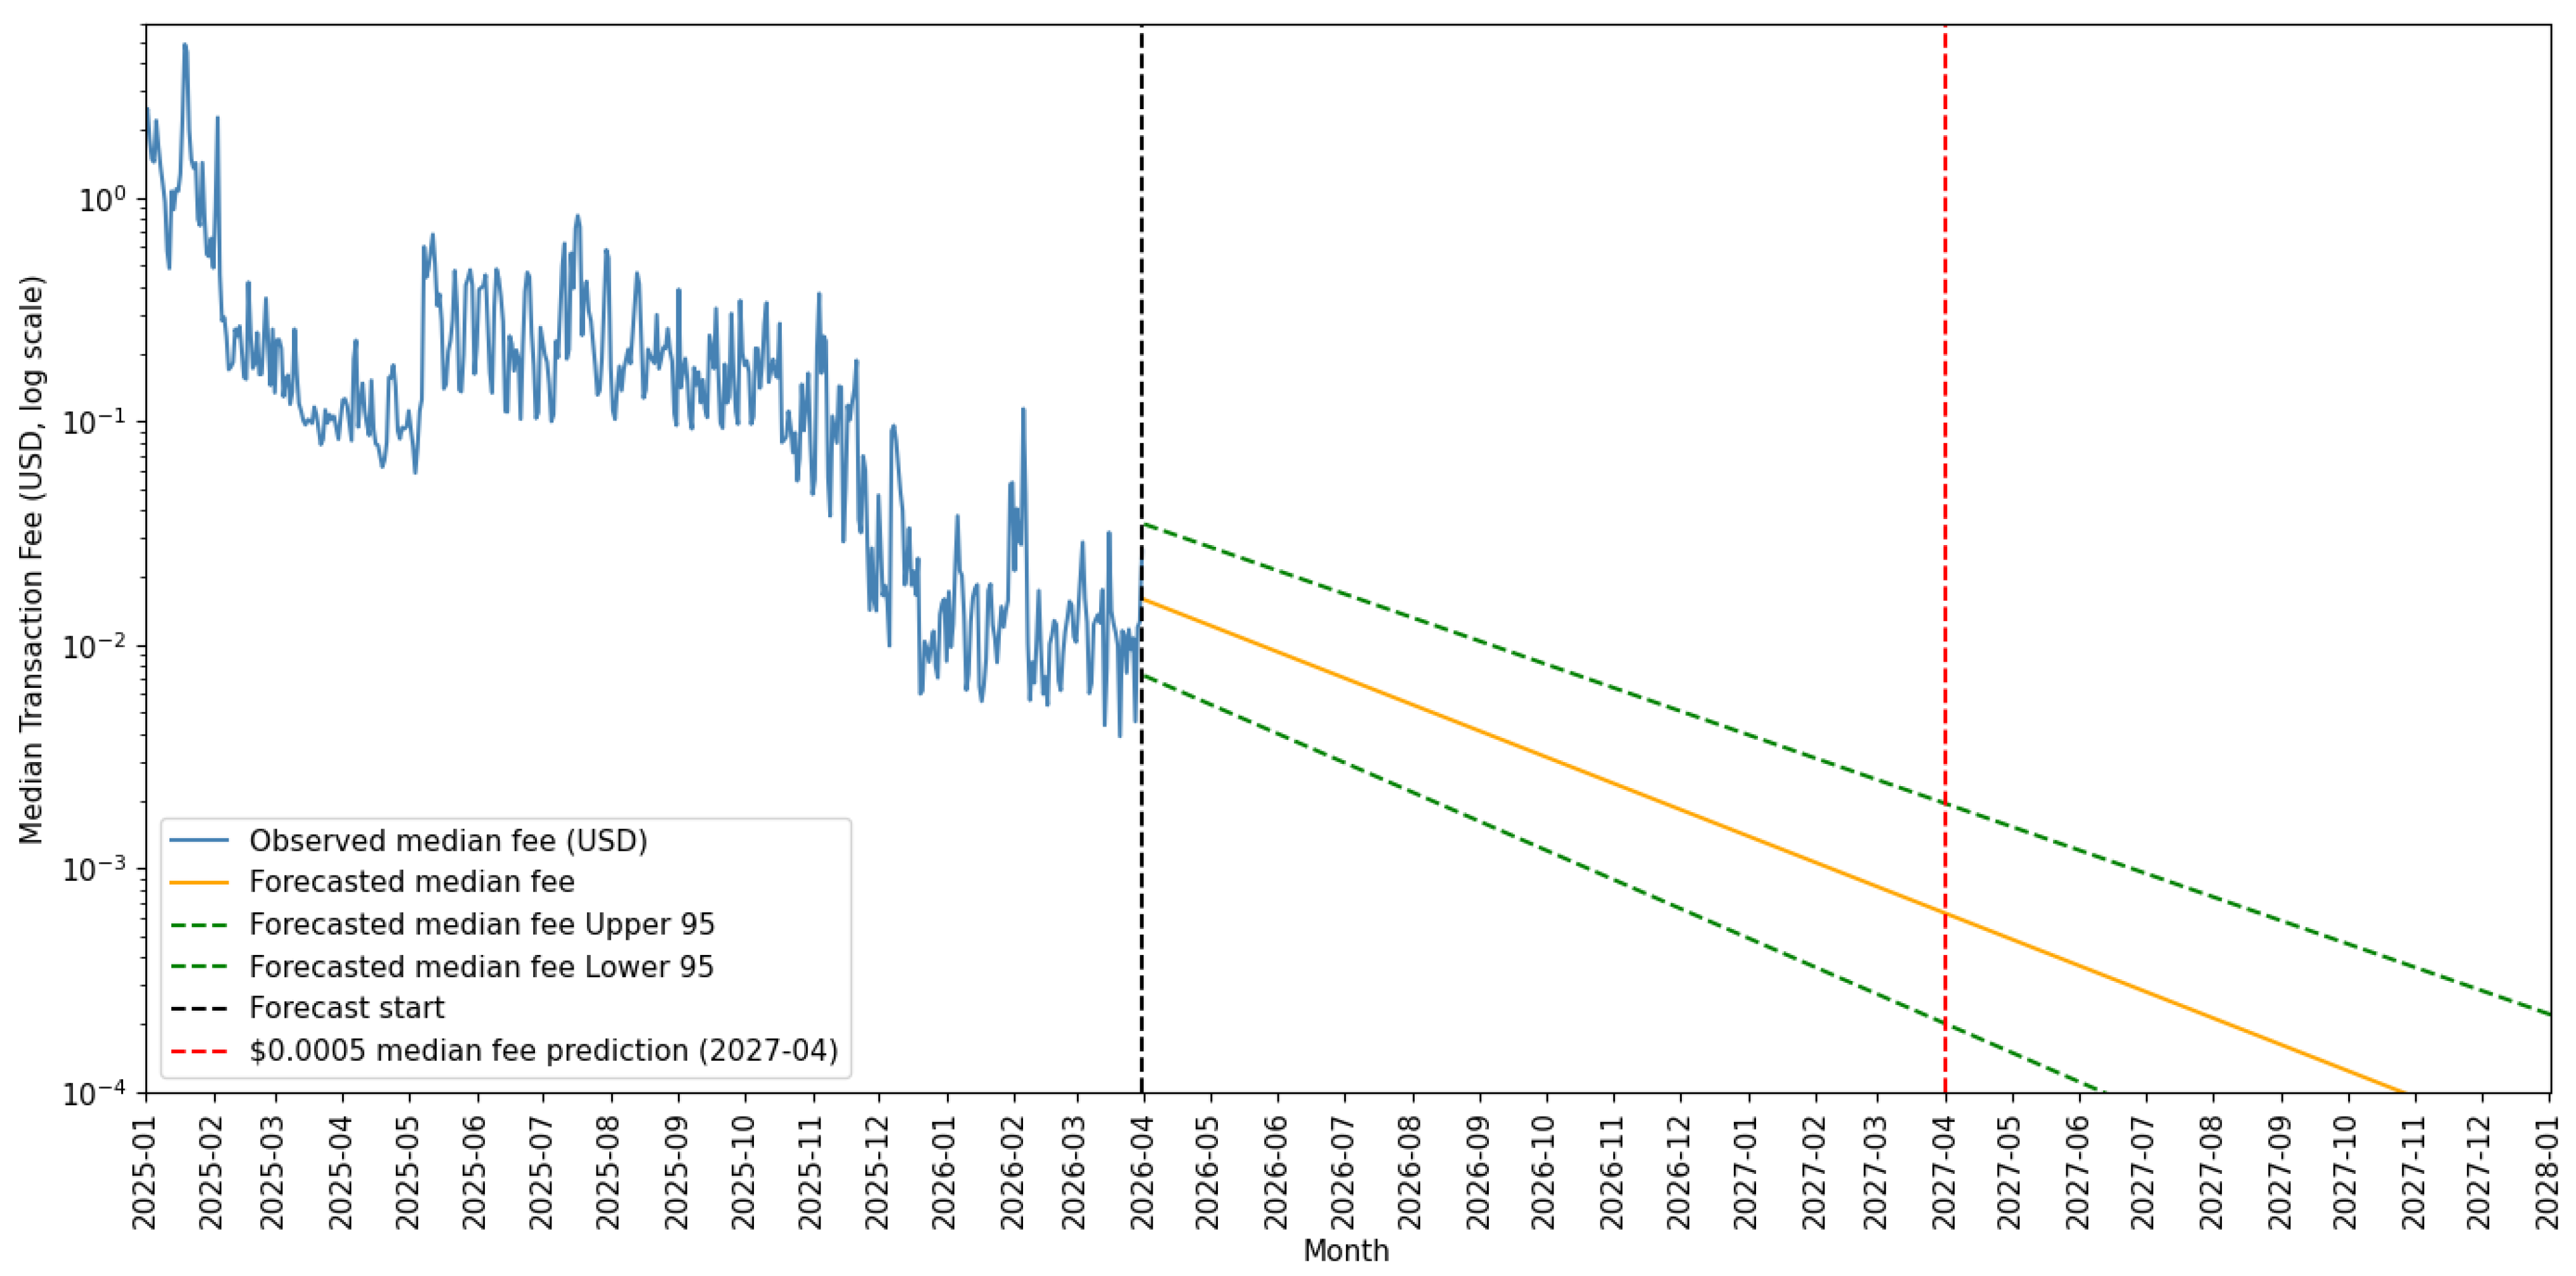
Figure 25 displays the forecasted Mainnet median transaction fees under our model Equation (
9) for the effect of gas limits on fees. We produce confidence intervals as we did in the prior section on TPS using the standard errors of our gas limit estimates.
Mainnet median fees are expected to reach $0.0005 in April 2027 at a gas limit of 89.2 million. The 95% confidence forecast interval ranges from January to September 2027.
We compare our Mainnet fee forecasts to 30-day and 90-day random walks using [
33]. The gas limit model improves upon both random walks at the 99.9% confidence level.
For Mainnet fees, the square root specification predicts a crossover of the $0.0005 fees in August 2027. This is again similar to the conservative bound on the linear forecast.
8.2. Ethereum and Solana Crossover Prediction
We first estimate a time trend extrapolation for Solana in
Table 12.
Having shown that Mainnet fees are projected to reach Solana’s 2025 median fee level by early 2027, we now examine when Mainnet fees can converge with Solana’s projected fee level.
Our Mainnet median fee forecast is directly from
Section 8.1. We forecast Solana fees by fitting a time trend to the log of historical fees. Our model is as follows:
where
with
corresponding to 1 January 2025 and
corresponding to 31 March 2026, and
indexes days into the forecast horizon.
denotes the logged daily median transaction fee on Solana.
Figure 26 presents historical and forecasted daily median transaction fees for the Mainnet and Solana until 2028. Confidence intervals for the Mainnet fees are from the standard errors of the gas limit effect.
The Mainnet is projected to achieve Solana median transaction fees in August 2027, with both networks’ fees at $0.000204. The 95% confidence interval date range is between January and September 2027.
The in-sample fits are strong here, and the interval around the Solana forecasts is just slightly more than a year.
8.3. Layer 2 Leader Fee Trends and Solana Crossover
Fees on the cheapest of the largest L2 networks are already below Solana levels in the first quarter of 2026. Optimism, the third largest L2, has fees of $0.000027 for 2026 Q1, 94.6% lower than Solana’s at $0.000496.
We now consider when the larger set of L2 leaders, adding Base and Arbitrum to Optimism, will reach fee Solana fee levels. We use the same explanatory variables that we use for L2 TPS, regressing log fees on target blobs in
Table 13.
Our estimates in
Table 13 imply that every 30 days when the blob target rises by four, L2 median fees fall by −17.34%.
We create a forecast using the coefficients from
Table 13 and our blob growth rule
where
denotes L2 leader fees, and
denotes the projected target blob count from Equation (
5).
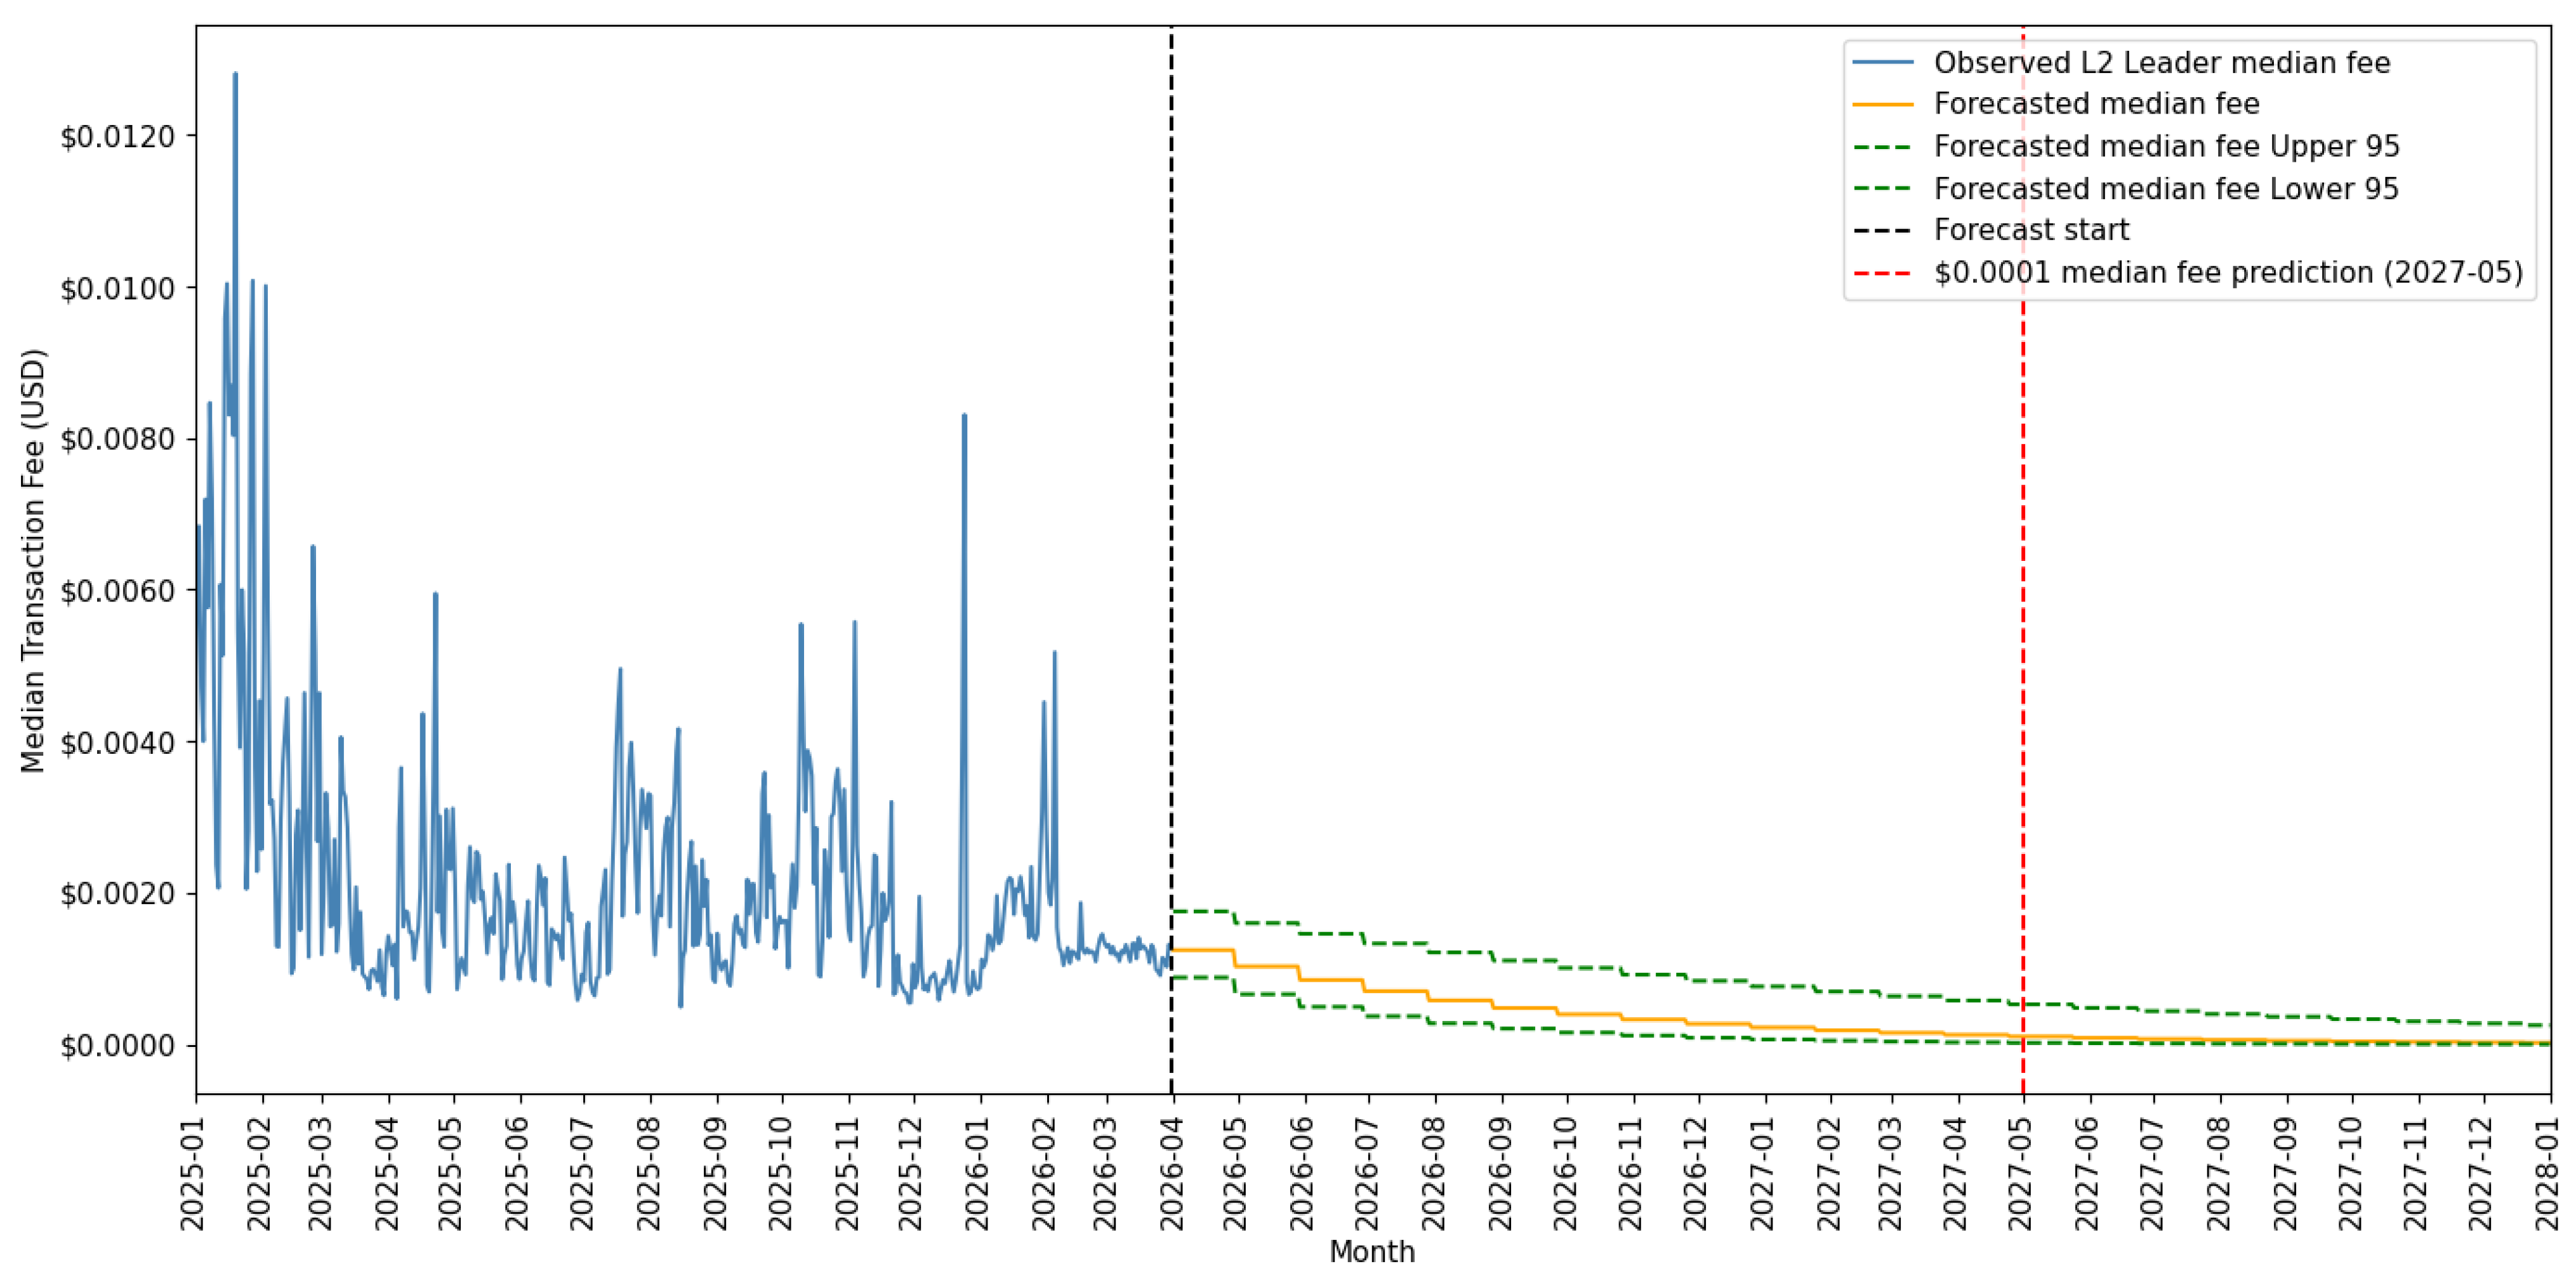
Figure 27 shows that the leading L2 networks will reach
$0.0001 fees in May 2027. Our confidence bounds on the marginal effects place a 95% region between November 2026 and a date beyond our sample end of March 2036.
We compare our L2 leader fee forecasts to 30-day and 90-day random walks using [
33]. The blob target model improves upon both random walks at the 99.9% confidence level.
For Layer 2 fees, the square root specification predicts a crossover of the $0.0001 fees in March 2029. The square root scaling slows down the predicted crossover by approximately 22 months.
In predicting a crossover with Solana, we use the same time trend model as Equation (
10).
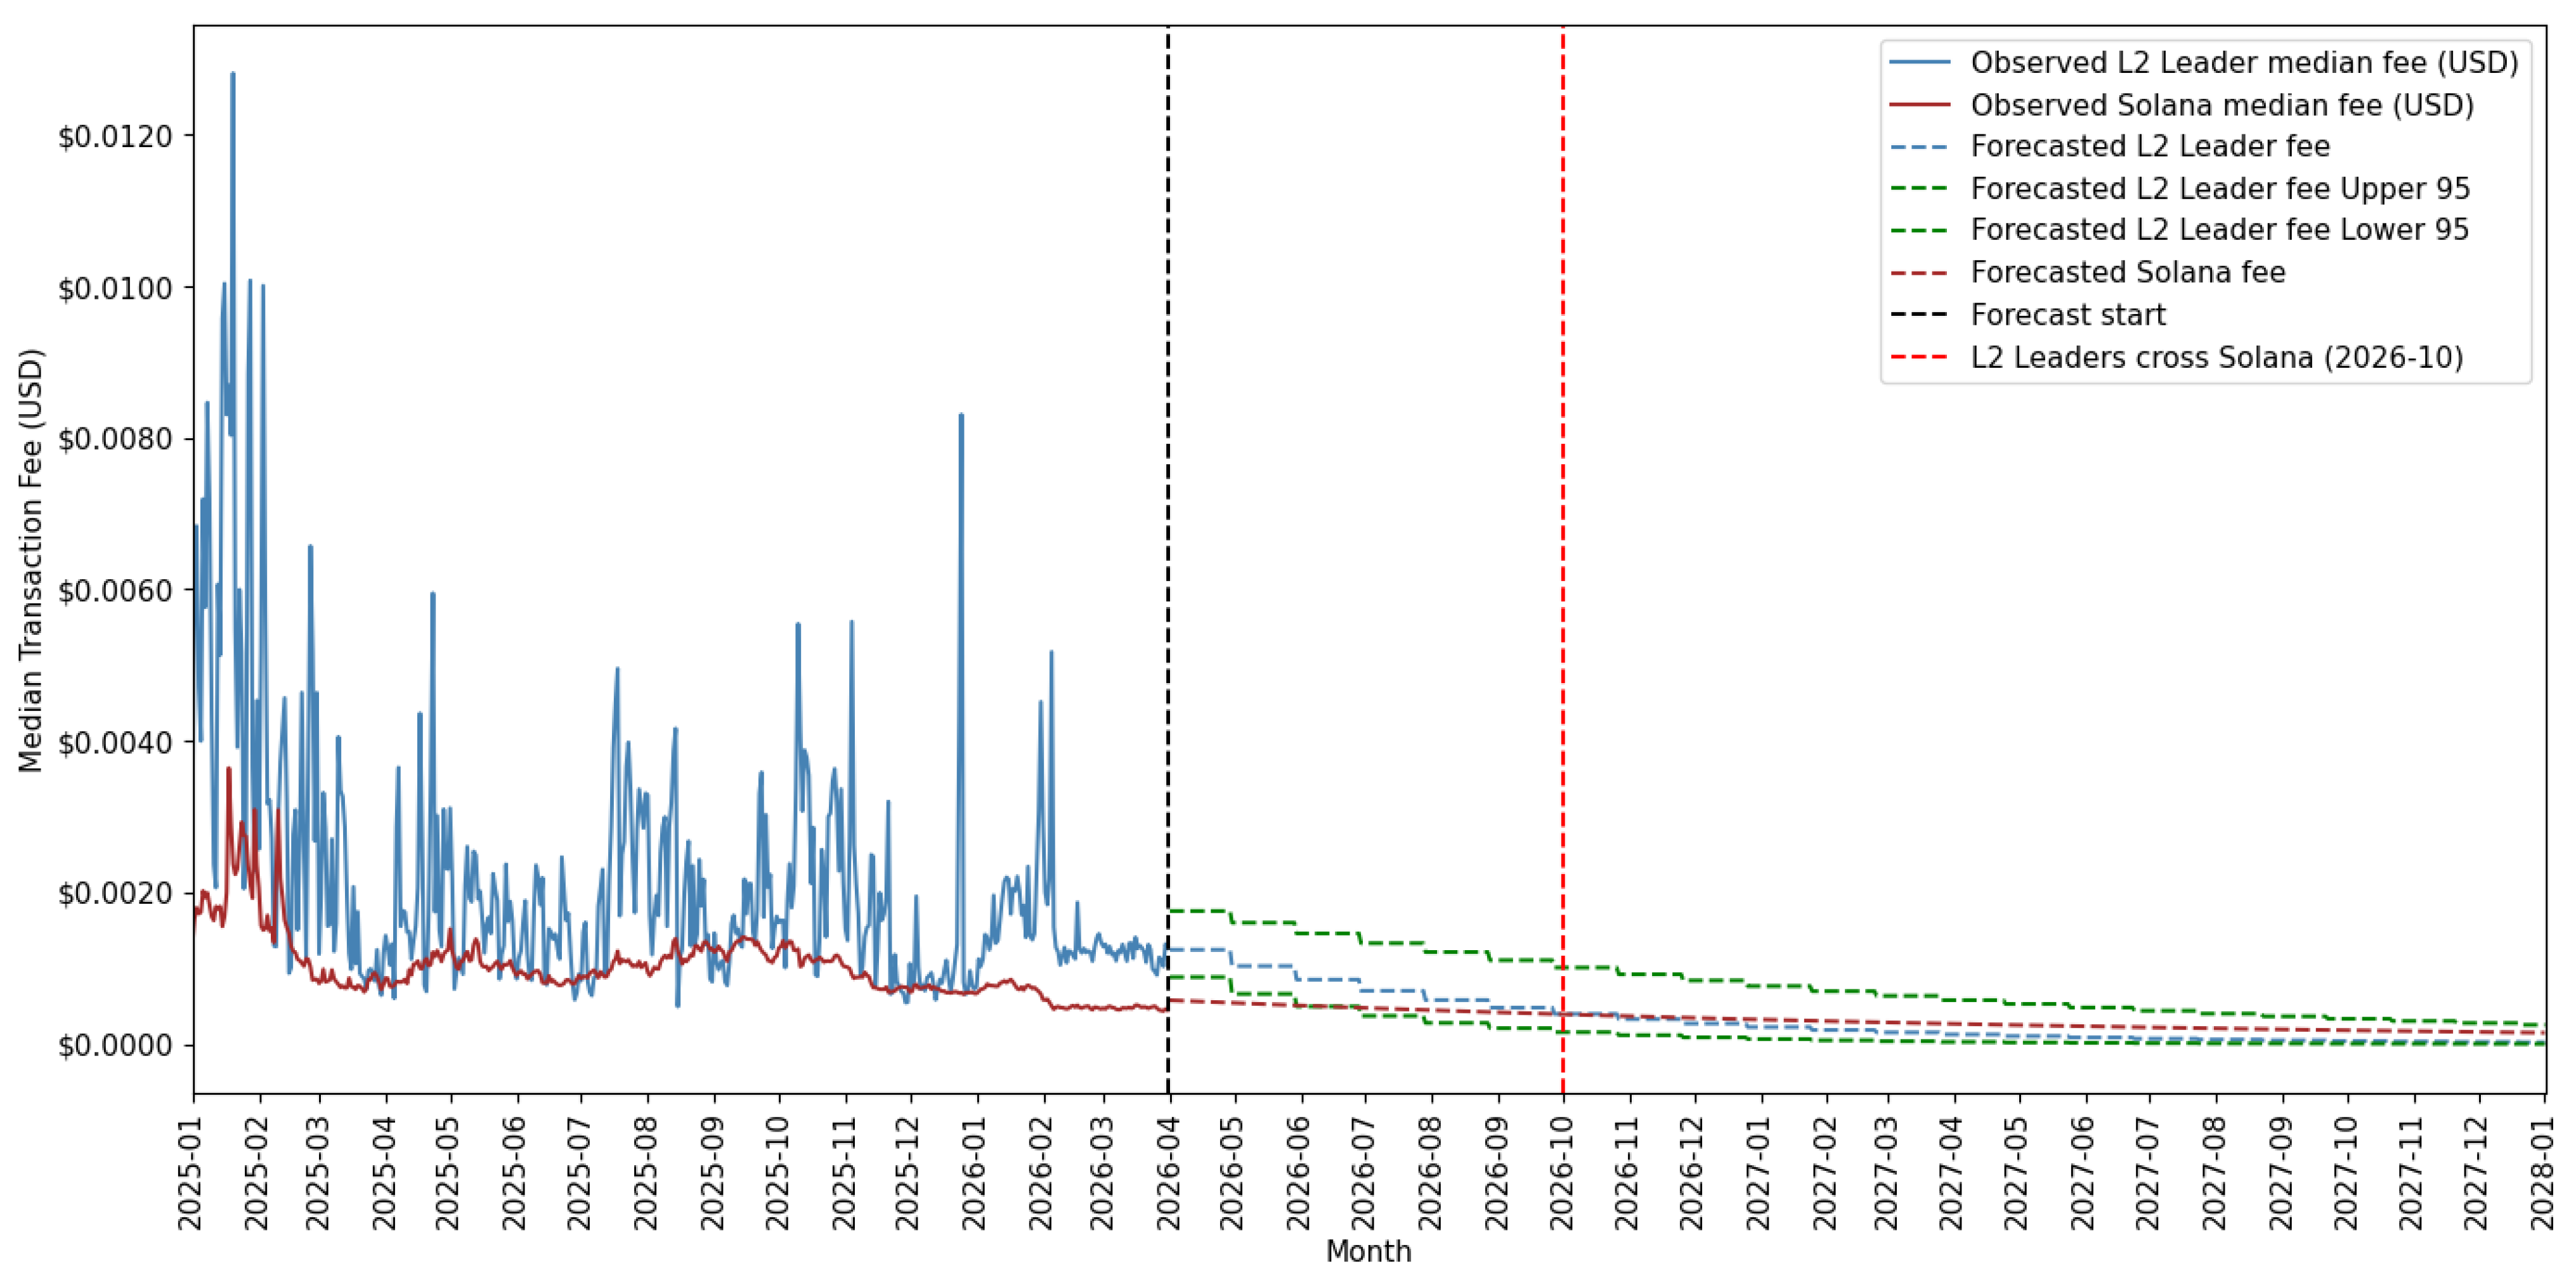
Figure 28 displays our predicted crossover in October 2026 with a 95% confidence band between May 2026 and a date beyond our March 2036 sample end.
Layer 2 fees are falling more quickly than Solana’s. Our forecast predicts that the Layer 2 per-transaction fees of $0.000328 cross Solana’s $0.000371 at 42 blobs in October 2026.
The model fits for Layer 2 gas fees on target blobs are weaker, and this is reflected in wide confidence intervals for our forecasts.
For both crossover dates, we cannot rule out at the 95% confidence interval that they will take place outside of our terminal date of March 2036.
We close this section with a discussion of coefficient stability based on recent samples for the marginal effects in
Table 14. As with our Mainnet TPS forecasts, the marginal effect of the gas limit on fees has been stable since the increase to 45 million. Layer 2 fees have the weakest fit, and we find the coefficients are less stable after November 2025.
9. Conclusions
This paper documents the evolution of transaction speed and cost from January 2024 through March 2026 across the Ethereum network, its L2 ecosystem, Polygon, and Solana. This period is defined by Dencun, Fusaka, and Pectra, three major Ethereum protocol upgrades, and BPO-1 and BPO-2, two blob parameter-only upgrades.
Confidence intervals around these forecasts are larger, particularly for the Layer 2 results. The confidence intervals should not be interpreted independently. A slowdown in gas limit increases or a decline in blob utilization will move all of the estimated targets further into the future.
The ability of Ethereum to function with gas limits proposed in the Strawmap is a work in progress. Ref. [
34] suggests that massive parallelism may make these goals achievable on standard hardware. Nonetheless, if transactions and fees are not able to scale linearly as we have modeled, it may substantially delay the milestones in
Table 15.
In terms of speed, Solana remains the fastest network, averaging 1303 TPS in 2026 Q1. Mainnet speed has nearly doubled since 2024, reaching 25.78 TPS in 2026 Q1. We estimate that each 10-million-unit increase in the gas limit is associated with 3.52 additional TPS, meaning the Mainnet cannot reach 100 TPS under current gas limit trajectories until February 2034. The proposed Strawmaps’ EIP-7938 gas limit increase, if activated in 2027, would accelerate that timeline considerably, allowing the Mainnet to reach 100 TPS by January 2028.
We anticipate a much faster growth in TPS for the L2 networks. Extending the BPO upgrade schedule, with a 4-blob increase every 30 days, L2 TPS is projected to cross Solana’s time-trend extrapolated TPS by March 2029 at 1820 TPS.
Solana is an adapting protocol as well, and the Apenglow upgrade could provide block space for upwards of 4500 TPS. If organic transaction demand arises to fill the space on Solana, the Layer 2s will still substantially lag behind Solana in speed.
Our analysis indicates the Mainnet should reach Solana fee levels in less than two years. A 5-million-unit increase in the gas limit is associated with fees falling by approximately 59.2%. Even if EIP-7938 is not adopted, the Mainnet will reach Solana’s extrapolated time-trend fees of $0.0002 by August 2027. The L2 networks are currently competitive with Solana on fees, but we forecast declining fees across the leading networks as target blobs increase. We project that average fees across Arbitrum, Base and Optimism will fall below Solana’s by October 2026.
With projected gas limit increases, the Mainnet may soon be competitive with Solana on fees. Without a healthy L2 ecosystem, though, the Mainnet will be a sluggish alternative to faster blockchains. It will likely continue to lag Solana on speed-sensitive DEX trading.