1. Introduction
Saudi Arabia’s financial landscape has undergone a profound transformation. Within a decade, the share of adults holding a formal bank account increased from 46% in 2011 to 79% in 2024. Earlier data indicated a persistent gender gap, peaking at an 18-percentage-point (ppt) difference in 2021. However, the 2024 Global Findex data—a demand-side survey on financial inclusion conducted by the World Bank—indicate a sharp narrowing. The gender gap in account ownership declined to approximately 3.4 ppt, placing Saudi Arabia below the 2024 global average of 4.5 ppt and well below the Middle East and North Africa (MENA) average of roughly 11 ppt [
1]. This rapid convergence positions Saudi Arabia as an informative case study for examining how institutional reforms and digital financial infrastructure interact to reduce gender disparities in financial access.
While rapid gender-gap closure of this scale is unusual globally, similar episodes have followed major institutional or policy shifts in other contexts. For example, digitized government transfer programs in South Asia have been associated with increases in women’s account ownership [
2], and expansions in women’s legal rights have been linked to lower levels of involuntary financial exclusion across 117 economies [
3]. Saudi Arabia’s case is distinctive because it combines legal reforms affecting women’s economic participation, a high-income environment, near-universal internet penetration, and an explicit policy push toward cashless payments within a relatively compressed timeframe.
This article examines whether the observed convergence is consistent with the interaction of three structural developments. First, the 2018–2019 legal reforms—especially the lifting of the driving ban and the easing of guardianship requirements for business registration—were associated with a significant shift in women’s economic participation. Second, this period overlapped with rapid digitalization of financial services. Venture capital investment in Saudi fintech reached USD 182 million in 2024, with start-ups increasing from 89 to over 200 within one year [
4]. Third, Saudi Arabia’s position as a high-income emerging market with universal internet penetration and an explicit “cashless” mandate under Saudi Vision 2030 provided the institutional and technological infrastructure through which legal and labor-market changes translated into greater use of formal financial services.
The central hypothesis explored in this paper is that the convergence in account ownership is consistent with a “labor–financial nexus.” In this mechanism, the expansion of women’s legal rights coincided with increased female labor market participation, which in turn was linked to the use of formal payment ‘rails’ for salary transfers and business transactions.
Existing research provides partial support for elements of this mechanism. Focusing on digital inclusion in rural India, ref. [
5] demonstrates that policy and fintech can jointly transform inclusive finance. Similarly, ref. [
6] shows that planning foresight that aligns policies across sectors can accelerate digitalization and its externalities. These findings align with broader literature that does not focus specifically on the gender gap. For instance, ref. [
2] demonstrates that shifting workers from cash wages to payroll accounts can increase engagement with formal financial services. Randomized evaluations of electronic wage payments document measurable downstream effects relative to cash compensation. In parallel, digitizing disbursements in large employment- or transfer-linked programs has been shown to shift payment delivery toward account-based infrastructure [
7]. Although some studies examine gender disparities in financial inclusion in the MENA region, they do so either broadly [
8] or by focusing primarily on traditional banking [
9], largely predating the recent expansion of fintech-based financial services in the region.
Related evidence from other settings shows that shifting wages and transfers from cash to account-based payments can change financial behavior and increase engagement with formal finance [
10]. More broadly, fintech can lower the transaction costs of making payments and accessing accounts. However, technology adoption also depends on behavioral factors such as perceived usefulness, ease of use, and trust in the system [
11,
12]. These behavioral channels are particularly relevant for digital payments, where perceived risk and trust in institutions shape uptake and sustained use. Employment may therefore operate through two complementary channels: a functional one, in which wage receipt requires a formal financial account, and a familiarity one, in which repeated exposure to digital transactions gradually reduces perceived uncertainty and builds trust in digital financial systems.
To examine these mechanisms and address the above-mentioned gaps in the literature, the article investigates how the interaction between labor market participation and digital finance adoption is associated with female financial inclusion during the 2014–2024 period.
The analysis relies on four waves of Global Findex microdata (2014, 2017, 2021, and 2024) and follows a threefold empirical strategy. First, it estimates the determinants of account ownership and digital-payment adoption using sampling-weighted logit models and reports average marginal effects. Second, it employs a Kitagawa and nonlinear Blinder–Oaxaca (BO) decomposition framework to identify endowment factors, primarily employment, that explain the narrowing gap. Third, it examines reform-era dynamics using a dynamic lead–lag (event-study-style) specification that tracks changes in the female–male gap across survey waves. Given the limited number of pre-period observations, this design is interpreted as evidence on timing and discontinuities (a structural shift relative to earlier dynamics) rather than a clean separation of reform effects from other concurrent changes. Moreover, these estimates reflect the resident population, which includes a large male-dominated expatriate workforce. Therefore, the analysis should be interpreted as resident-population convergence rather than citizens-only convergence.
This study makes several contributions to the literature on gendered financial inclusion. First, it provides one of the earliest microdata-based analyses of the 2024 Saudi Findex wave, documenting the magnitude of recent gender convergence and quantifying the role of workforce attachment using decomposition and heterogeneity. Second, it identifies employment status as a plausible channel associated with this shift; decomposition results reveal that workforce participation accounts for a substantial share of the observed reduction in the gender gap in account ownership. Third, the event-study design indicates that while account ownership converged more quickly, the gender gap in digital-payment usage followed a more gradual trajectory, suggesting that fintech diffusion may require substantial institutional changes to reach its full inclusive potential. Finally, the study introduces a harmonized measurement toolkit for digital payment indicators across all Findex waves, facilitating future research in emerging markets.
The remainder of the article is structured as follows.
Section 2 critically reviews the literature on gendered financial inclusion and situates the analysis within the Saudi reform context.
Section 3 details the data and outlines the empirical strategy.
Section 4 presents the results, including tests of the proposed labor–financial nexus and an examination of reform-era dynamics.
Section 5 concludes by outlining policy implications for other emerging economies.
3. Data and Methodology
3.1. Data
The primary data source is individual-level microdata from four survey waves—2014, 2017, 2021, and 2024—drawn from the World Bank’s Global Financial Inclusion (Findex) database. Each wave comprises approximately 1000 nationally representative interviews of individuals aged 15 and older in Saudi Arabia. A key challenge in the Saudi context is the large expatriate population, which is predominantly male and employed. While the Findex survey captures both Saudi and non-Saudi residents, it does not include identifiers for citizenship. Consequently, the analysis reflects the gender gap within the resident population, which is influenced by the high labor force participation of the male expatriate workforce. According to the 2022 Saudi Census, Saudi nationals are 50.2 percent male and 49.8 percent female, whereas non-Saudis are 76.5 percent male and 23.5 percent female. An important implication is that male employment rates in the resident sample are elevated due to the predominance of working-age male expatriates. This compositional difference mechanically inflates the measured gender gap in financial inclusion relative to a citizens-only comparison. Accordingly, all conclusions should be interpreted in terms of the resident population gender gap. The primary contribution of this analysis lies in documenting patterns within the resident population and their heterogeneity across employment status. As a further robustness check, this study replicates key results within observable strata—including education, income, and age—that are correlated with expatriate composition.
The analysis focuses on two primary financial inclusion outcomes: account ownership and digital payment usage. Because the latter aggregate variable was introduced only in the 2021 wave, data from 2014 and 2017 are harmonized by aggregating individual components—including mobile payments, online bill payments, and digital merchant transactions—in line with the [
1,
34] technical definition. Details on the harmonization are given in
Appendix A. The independent variables include age, educational attainment, household income quintiles, and a binary indicator of workforce participation (employed vs. not employed). Because employment information was not collected in the 2014 Findex wave, two distinct samples are used: the full 2014–2024 sample for the reform-era dynamics analysis and the 2017–2024 sample for labor-market mechanism tests and decomposition analyses. All variables are reported in
Table 1.
All estimates incorporate Global Findex probability weights to ensure national representativeness. Because the public-use microdata for Saudi Arabia do not include Primary Sampling Unit (PSU) or strata identifiers, robust standard errors are used. This approach is consistent with the World Bank’s reporting methodology for single-country studies, in which complex survey design variables are suppressed for confidentiality. Although design-based standard errors—which account for within-cluster correlation and stratification—may differ from robust standard errors, key estimates remain unchanged when survey-weight commands are applied using the available weight variable alone, without PSU or strata specification. Given the absence of design identifiers, the direction of any remaining standard error bias is ambiguous; however, positive intra-cluster correlation would tend to make robust standard errors conservative relative to fully design-based estimates.
Table 2 reports the weighted means of the variables used in this study. In 2024, 78% of the population aged 15 years or older owned a financial institution account, with 81% of males and 72% of females holding a formal account. Regarding digital payment adoption, 76% of the population reported having made or received a digital payment, including 79% of males and 70% of females.
Compared with 2017 and 2021, female account ownership and digital payment usage increased substantially relative to males, indicating a narrowing gender gap. While male inclusion remained relatively stable at high levels, female account ownership and digital payment usage increased by 14 and 22 percentage points, respectively.
3.2. Methodology
To examine the dynamics of the gender gap in financial inclusion in Saudi Arabia, the study employs a three-stage empirical strategy. First, it identifies micro-level determinants of inclusion using multivariate logit models, with particular attention to interactions among gender, employment, and year to assess the “labor–financial nexus” hypothesis and its dynamics. Second, it quantifies the extent to which the observed gender gap is associated with differences in observable characteristics using decomposition methods. Third, it characterizes reform-era dynamics in the gender gap using an interaction-based event-study framework across Findex waves.
3.2.1. Determinants and Heterogeneity: Logit Estimation
The article first estimates the probability of an individual being financially included using a pooled binomial logit model across the 2017, 2021, and 2024 waves. The baseline specification is presented in Equation (1).
where
is the logistic CDF,
are year indicators
for with 2017 omitted, and
is the vector of controls as listed in
Table 1.
The analysis includes the full set of two-way and three-way interactions among female, workforce status, and survey wave (year), allowing gender gaps and employment gradients to vary over time. Because logit coefficients are non-linear, Average Marginal Effects (AMEs) are reported to provide interpretable magnitudes, as outlined in [
35]. The analysis focuses on the average “employment premium” for women on the outcome variable.
3.2.2. Quantifying the Gap: Kitagawa Decomposition and Blinder–Oaxaca Decomposition
To quantify the gender gap estimated from the logit model, a Kitagawa-type two-component decomposition is applied to separate the overall gap into a composition component—capturing gender differences in employment shares—and a within-status component—capturing gaps in financial inclusion across employment categories. This approach distinguishes whether the aggregate gender gap is primarily driven by “labor force attachment,” whereby lower female employment mechanically reduces inclusion, or by “unequal returns,” whereby women remain less financially included even when they share the same employment status as men.
Formally, the Kitagawa decomposition partitions the total gap into a composition effect, capturing differences in the distribution of employment between women and men, and a within-group effect, capturing differences in inclusion rates among employed and non-employed individuals.
The specification of the Kitagawa decomposition is as follows: for each survey wave
, the employment share for men and women is defined as:
Next, the predicted probability of financial inclusion in each gender–employment cell is defined as:
where the
terms are obtained from the year-specific logit model (aligned with Equation (1)’s covariates) via post-estimation predicted probabilities.
The implied mean inclusion rate for men and women in year
t can be written as:
We define the total gender gap (men minus women) in year
t as:
Following the symmetric Kitagawa decomposition, Δ
t is partitioned into a composition component and a within-employment-status component. The corresponding averages are defined as:
Then, the Kitagawa decomposition is:
The first term captures the portion of the gap attributable to gender differences in labor force attachment, evaluated at the average “inclusion premium” of being employed . The second term captures within-status gender disparities by averaging male–female differences across employed and non-employed groups, weighted by the average employment share . For interpretability, Δt and both components are reported in percentage points.
Separately, a nonlinear Blinder–Oaxaca (BO)-style decomposition partitions the overall gap into ‘explained’ and ‘unexplained’ components. Conceptually, the ‘explained’ component captures the portion of the gender gap attributable to differences in observable characteristics between men and women, such as employment rates or education levels. The ‘unexplained’ component represents the residual difference that remains after accounting for these observable characteristics. Rather than reflecting a single factor, this residual may capture a range of unobserved influences, including differences in household financial arrangements, financial literacy, risk perceptions, product preferences, or the interaction between institutional settings and individual attributes. Accordingly, the BO decomposition is presented as complementary descriptive evidence.
To distinguish between the two components, the twofold BO decomposition for nonlinear models is employed, as outlined in [
36].
Let
index men and women, and let
be the logit estimates from a group-specific model. Define the average predicted probability for group
g as:
where
. The observed gender gap in the mean outcomes is:
Following the twofold nonlinear decomposition [
35], Δ can be written as:
The first term on the right-hand side of the equation represents the ‘explained’ component, capturing differences in the distribution of observable covariates (X) between men and women, evaluated using the male coefficient vector. The second term on the right-hand side of Equation (10) represents the portion of the differential attributable to differences in coefficients—the ‘unexplained’ component—which reflects differences in returns to observed characteristics. This unexplained portion should not be interpreted as discrimination, as it captures residual factors not accounted for in the model, such as household dynamics, financial literacy, preferences, or features of financial product design.
3.2.3. Reform-Era Dynamics: Event Study Interaction Design
Lastly, to trace the evolution of the female–male gap in financial inclusion across survey waves—particularly around the 2018–2019 reform period—the following interaction-based model is estimated using all four waves (2014, 2017, 2021, and 2024)
where 2017 (the last pre-reform survey wave) serves as the omitted (base) year. Because the design includes only one pre-period comparison (2014 versus 2017) and lacks an external control group, it is best interpreted as evidence on timing and discontinuities—a structural shift relative to earlier dynamics—rather than as a clean causal estimate of the 2018–2019 reforms.
Under this normalization, each measures the change in the female–male gap in year t relative to 2017. The coefficient provides a transparent diagnostic for pre-reform stability: a statistically insignificant estimate indicates that the gender gap in 2014 is not detectably different from that in 2017, which is consistent with a pre-period stability diagnostic test given the limited number of pre-reform waves. The coefficients and capture post-reform deviations from the 2017 benchmark.
Workforce participation is omitted from Equation (11) to avoid post-treatment bias—“bad control” as outlined in [
37]—given that the reforms were explicitly designed to influence women’s employment. This specification, therefore, captures the reduced-form evolution of the gender gap in inclusion without conditioning on a key endogenous channel.
While the heterogeneity analysis and the Kitagawa and BO decompositions are conducted using logit models, reflecting the binary nature of the outcomes, the event-study specification in Equation (11) is estimated using a linear probability model (LPM) with probability weights and heteroskedasticity-robust standard errors. The LPM is adopted in this setting because the interaction coefficients are directly interpretable as percentage-point changes in the gender gap relative to the 2017 baseline and can be plotted without further transformation. In contrast, a nonlinear event-study using logit would yield interaction effects that are not directly comparable across time and would require additional post-estimation adjustments. As a robustness check, the analysis confirms that the event-study dynamics are similar when covariates are excluded and when placebo (pre-period) tests are implemented. It is also important to note that, given the absence of an external control group and the presence of only one pre-period comparison, these estimates should be interpreted as evidence of a reform-era discontinuity rather than as causally identified treatment effects.
4. Results and Discussion
This section first presents results from the determinants and heterogeneity (logit) estimation, followed by a discussion of the decomposition evidence. It then reports findings from the event-study-style analyses. As discussed above, these three empirical strategies collectively provide a coherent account of both the micro-level correlates and the reform-era dynamics of women’s financial inclusion in Saudi Arabia.
4.1. Logit Estimation Results: Determinants and Heterogeneity
This section presents results from Equation (1), focusing on interactions among gender, employment status, and year.
Table 3 reports the AMEs of being female within each year–employment status cell, interpreted as the gender gap.
Table 4 presents predicted probabilities for each gender–employment status–year group. Coefficient estimates and AMEs for all control variables are reported in
Appendix C, while the raw logit coefficients are provided in
Appendix B.
As depicted in
Table 3 (column 3), in 2017 and 2021, women were significantly less likely than men to own an account, even when employed (AMEs of −0.101 in 2017 and −0.110 in 2021). By 2024, however, the conditional gender gap among the employed becomes economically negligible and statistically indistinguishable from zero (−0.4 ppt). Predicted probabilities reported in
Table 4 reinforce this finding, as employed men and women in 2024 exhibit nearly identical account ownership rates (0.825 vs. 0.821).
In contrast, sizable gender gaps persist among individuals outside the workforce. In 2024, non-employed women remain 13.3 ppt less likely than non-employed men to own a financial account (
Table 3, column 3), corresponding to predicted probabilities of 0.778 for men and 0.644 for women (
Table 4, column 4). Together, these results indicate that Saudi Arabia’s remaining national gender disparity in account ownership is increasingly concentrated among individuals not participating in the labor market.
A similar pattern emerges for digital payment usage. As shown in
Table 3 (column 4), in 2017 and 2021, women were significantly less likely than men to use digital payments among the employed (−14.1 ppt and −10.1 ppt, respectively). By 2024, the conditional gap among employed adults becomes statistically indistinguishable from zero (−1.1 ppt), with predicted usage rates of 82% for employed men and 81% for employed women. Among adults outside the workforce, the estimated gap in 2024 is smaller and not statistically significant.
These results indicate conditional parity in financial inclusion. By 2024, gender differences in account ownership and digital payment usage are statistically indistinguishable from zero among employed adults, while disparities remain concentrated among non-employed individuals. One institutional channel consistent with this pattern is the strengthened linkage between formal employment and regulated payment channels. For example, Saudi labor-market compliance systems, such as the WPS, which requires private-sector salaries to be paid electronically, likely increase the probability that labor-market entry is accompanied by formal account access and routine use of digital payment channels. Indeed, ref. [
38] reports that more than 99% of government outgoing payments were executed via electronic credit transfers in 2019, highlighting the broader policy environment supporting digitized payments.
The absence of a statistically significant gender gap in digital payments among non-employed adults in 2024, in contrast to the highly significant −13.3 ppt gap in account ownership, may reflect the post-2019 diffusion of fintech-based payment instruments. One plausible explanation is that some digital payment tools can be used without individual bank account ownership—for example, through prepaid or wallet-based instruments, delegated use within households, or similar channels—allowing adoption to outpace account ownership. This pattern suggests that payment adoption among non-employed women may be occurring through channels other than traditional bank accounts.
Additional mechanisms may include intra-household digital payment spillovers, whereby female household members use payment instruments through accounts held by employed relatives; government-to-person payment programs targeting women directly (e.g., household subsidy transfers); and the proliferation of consumer-facing fintech applications with minimal onboarding requirements. Identifying the relative contribution of these pathways would require granular data on transaction sources, intra-household payment arrangements, and instrument-level usage, which are not captured in the Findex microdata.
Moreover, because the public Findex microdata for Saudi Arabia do not identify citizenship, and the resident population includes a substantial expatriate workforce, compositional differences may influence measured gender gaps. Although nationals and non-nationals cannot be distinguished, the analysis assesses whether the “convergence among the employed” result is concentrated within a narrow socioeconomic segment. Specifically, Equation (1) is re-estimated separately by education (tertiary vs. secondary-or-less) and by income (upper-income vs. lower/middle-income), and the AME of being female is computed within each Year × employment cell. To further assess whether the main convergence patterns align with compositional changes among younger respondents, the core specification is re-estimated excluding individuals aged 15–24 and, separately, including age bands (15–24, 25–44, 45+). Results are reported in
Appendix D.
Three main findings emerge from the additional estimations. First, among respondents with secondary education or less, gender gaps among employed adults are large and significant in 2017 and 2021 but approach zero and become statistically insignificant by 2024 for both account ownership and digital payment usage. Second, within the lower- and middle-income group, the female–male gap remains substantial among non-employed adults in 2024—particularly for account ownership—while the gap among employed adults again approaches zero. Estimates for tertiary and upper-income groups are generally smaller and less precisely estimated. Third, the results remain consistent with the baseline: among individuals aged 25 and older, the gender gap within the workforce narrows to approximately zero by 2024 for both account ownership (−10.6 pp in 2017 to 0.2 pp in 2024) and digital payments (−13.5 pp in 2017 to −0.1 pp in 2024). Age-band estimates indicate that convergence is concentrated among individuals linked to formal employment, while sizable gaps persist among younger respondents outside the workforce, consistent with an employment-related payment channels mechanism. Collectively, these findings do not resolve nationality-related confounding but indicate that the main pattern—convergence concentrated among employed adults—is not confined to a single education or income subgroup and is not driven solely by younger cohorts.
The marginal effects of the remaining variables are consistent with the existing literature (
Appendix C). Individuals who are not in the workforce, are in lower income groups, or are younger are less likely to own a financial account or use digital payment services. For example, individuals in the lowest income quintile are 16 ppt and 15 ppt less likely than those in the highest income quintile to own a financial account and to use digital payment services, respectively. This finding is consistent with [
22], which shows that the likelihood of account ownership increases with income, as bank accounts facilitate both payments and savings. Moreover, higher-income individuals are more likely to be financially literate or to have access to information about financial products and services than those in lower-income groups, making them more inclined to adopt financial services [
22]. Educational attainment is positively associated with digital payment use, while its association with account ownership is weaker in this specification. These patterns are also consistent with behavioral research suggesting that higher income and education reduce barriers to adoption by improving risk assessment and familiarity with financial products [
39,
40]. For instance, higher levels of education and financial literacy are linked to improved risk assessment and financial decision-making skills, which moderate the influence of biases such as overconfidence [
28].
4.2. Kitagawa and Blinder-Oaxaca Decomposition Results
This section presents the Kitagawa decomposition results in
Table 5, which separate the overall gender gap in financial inclusion into a workforce participation (composition) component and a within–workforce-status component. This decomposition is motivated by the logit results, which show that financial inclusion outcomes vary sharply by workforce status and that gender gaps among employed adults have narrowed substantially by 2024.
Table 5 (columns 2 and 5) indicates that the total gender gap declines markedly over time, falling from 18.8 ppt to 8.7 ppt for account ownership and from 27.7 ppt to 9.4 ppt for digital payments between 2017 and 2024. By 2024, a substantial share of the remaining gap reflects differences in workforce participation. The participation component is 3.9 ppt for accounts (column 3) and 6.0 ppt for digital payments (column 6), both highly statistically significant. These results suggest that the aggregate gender gap increasingly reflects women’s lower likelihood of being in the workforce in a context where employment is strongly associated with financial inclusion.
At the same time, the within–workforce-status component declines substantially. For digital payments (column 7), the within-status gap is 3.4 ppt in 2024 and statistically indistinguishable from zero, consistent with the logit results indicating near parity among employed men and women. For account ownership, the within-status component declines to 4.8 ppt in 2024 and is only marginally significant (p-value = 0.07), suggesting that conditional gender differences are small relative to earlier years, though not fully eliminated.
To complement the workforce-based Kitagawa decomposition, a nonlinear BO decomposition is also implemented.
Table 6 summarizes the estimations, with detailed results reported in
Appendix E. Across years, the BO results are consistent with the sharp decline in the total gender gap. For account ownership, the total gap decreases from 22.4 ppt in 2017 to 8.9 ppt in 2024. By 2024, the explained component is small and statistically indistinguishable from zero, while the remaining gap is primarily captured by the residual unexplained component (7.4 ppt). Because this residual captures all factors not included in the model—including household financial arrangements, financial literacy differences, product preferences, and constraints on digital access—it should not be interpreted as evidence of discrimination or attributed to a single latent mechanism.
For digital payments, the total gap declines from 29.6 ppt in 2017 to 9.5 ppt in 2024. In 2024, the remaining gap is approximately evenly split between explained and unexplained components, with the explained portion statistically significant (4.9 ppt) and the unexplained portion not statistically different from zero.
The role of workforce participation is economically substantial and becomes increasingly salient over time. The workforce participation (explained) component accounts for 27% of the total gender gap (
Appendix D). This is notably larger than the 9% estimate reported by [
7] for the MENA region, which is based on a Fairlie decomposition using a multi-country sample with a different period, covariate set, and decomposition design; accordingly, ‘employment’ is not defined identically to the workforce-status contribution used here. Workforce status also accounts for 86% of the explained component, indicating that most of the explained portion of the gender gap reflects labor-market attachment. For digital payments, this contribution is even larger: the workforce participation component accounts for 38% of the total gap and 96% of the explained component.
Female labor force participation increased to 36% in 2024 from 11% a decade earlier [
1]. The share of established business ownership by women also rose to 14% in 2023, compared with less than 4% during 2016–2021 [
41]. These shifts occurred alongside policy initiatives under Saudi Vision 2030, including reforms enacted in 2018, as well as gradual changes in household and societal norms regarding women’s roles in the economy. Although difficult to measure directly, shifts in cultural and societal norms in Saudi Arabia have been documented in several studies [
39,
40].
Taken together with the Kitagawa decomposition, the BO results indicate that the declining national gap is increasingly shaped by compositional differences linked to labor-market attachment and observable characteristics, while the residual unexplained gaps—particularly for account ownership—likely reflect factors beyond the scope of the covariates available in the Global Findex data.
4.3. Reform-Era Gap Dynamics
To evaluate whether women’s financial inclusion exhibits a discrete shift around the 2018–2019 reform period, an event-study-style interaction model is estimated. Because only one pre-reform comparison year is available (2017 relative to 2014), the resulting estimates should be interpreted as indicative evidence of a structural break associated with the reform period rather than as definitive causal estimates. An advantage of this approach is that it provides a transparent diagnostic of differential pre-trends through the coefficient on the interaction between female and 2014, allowing the post-reform coefficients for 2021 and 2024 to be interpreted as deviations relative to the 2017 pre-reform baseline.
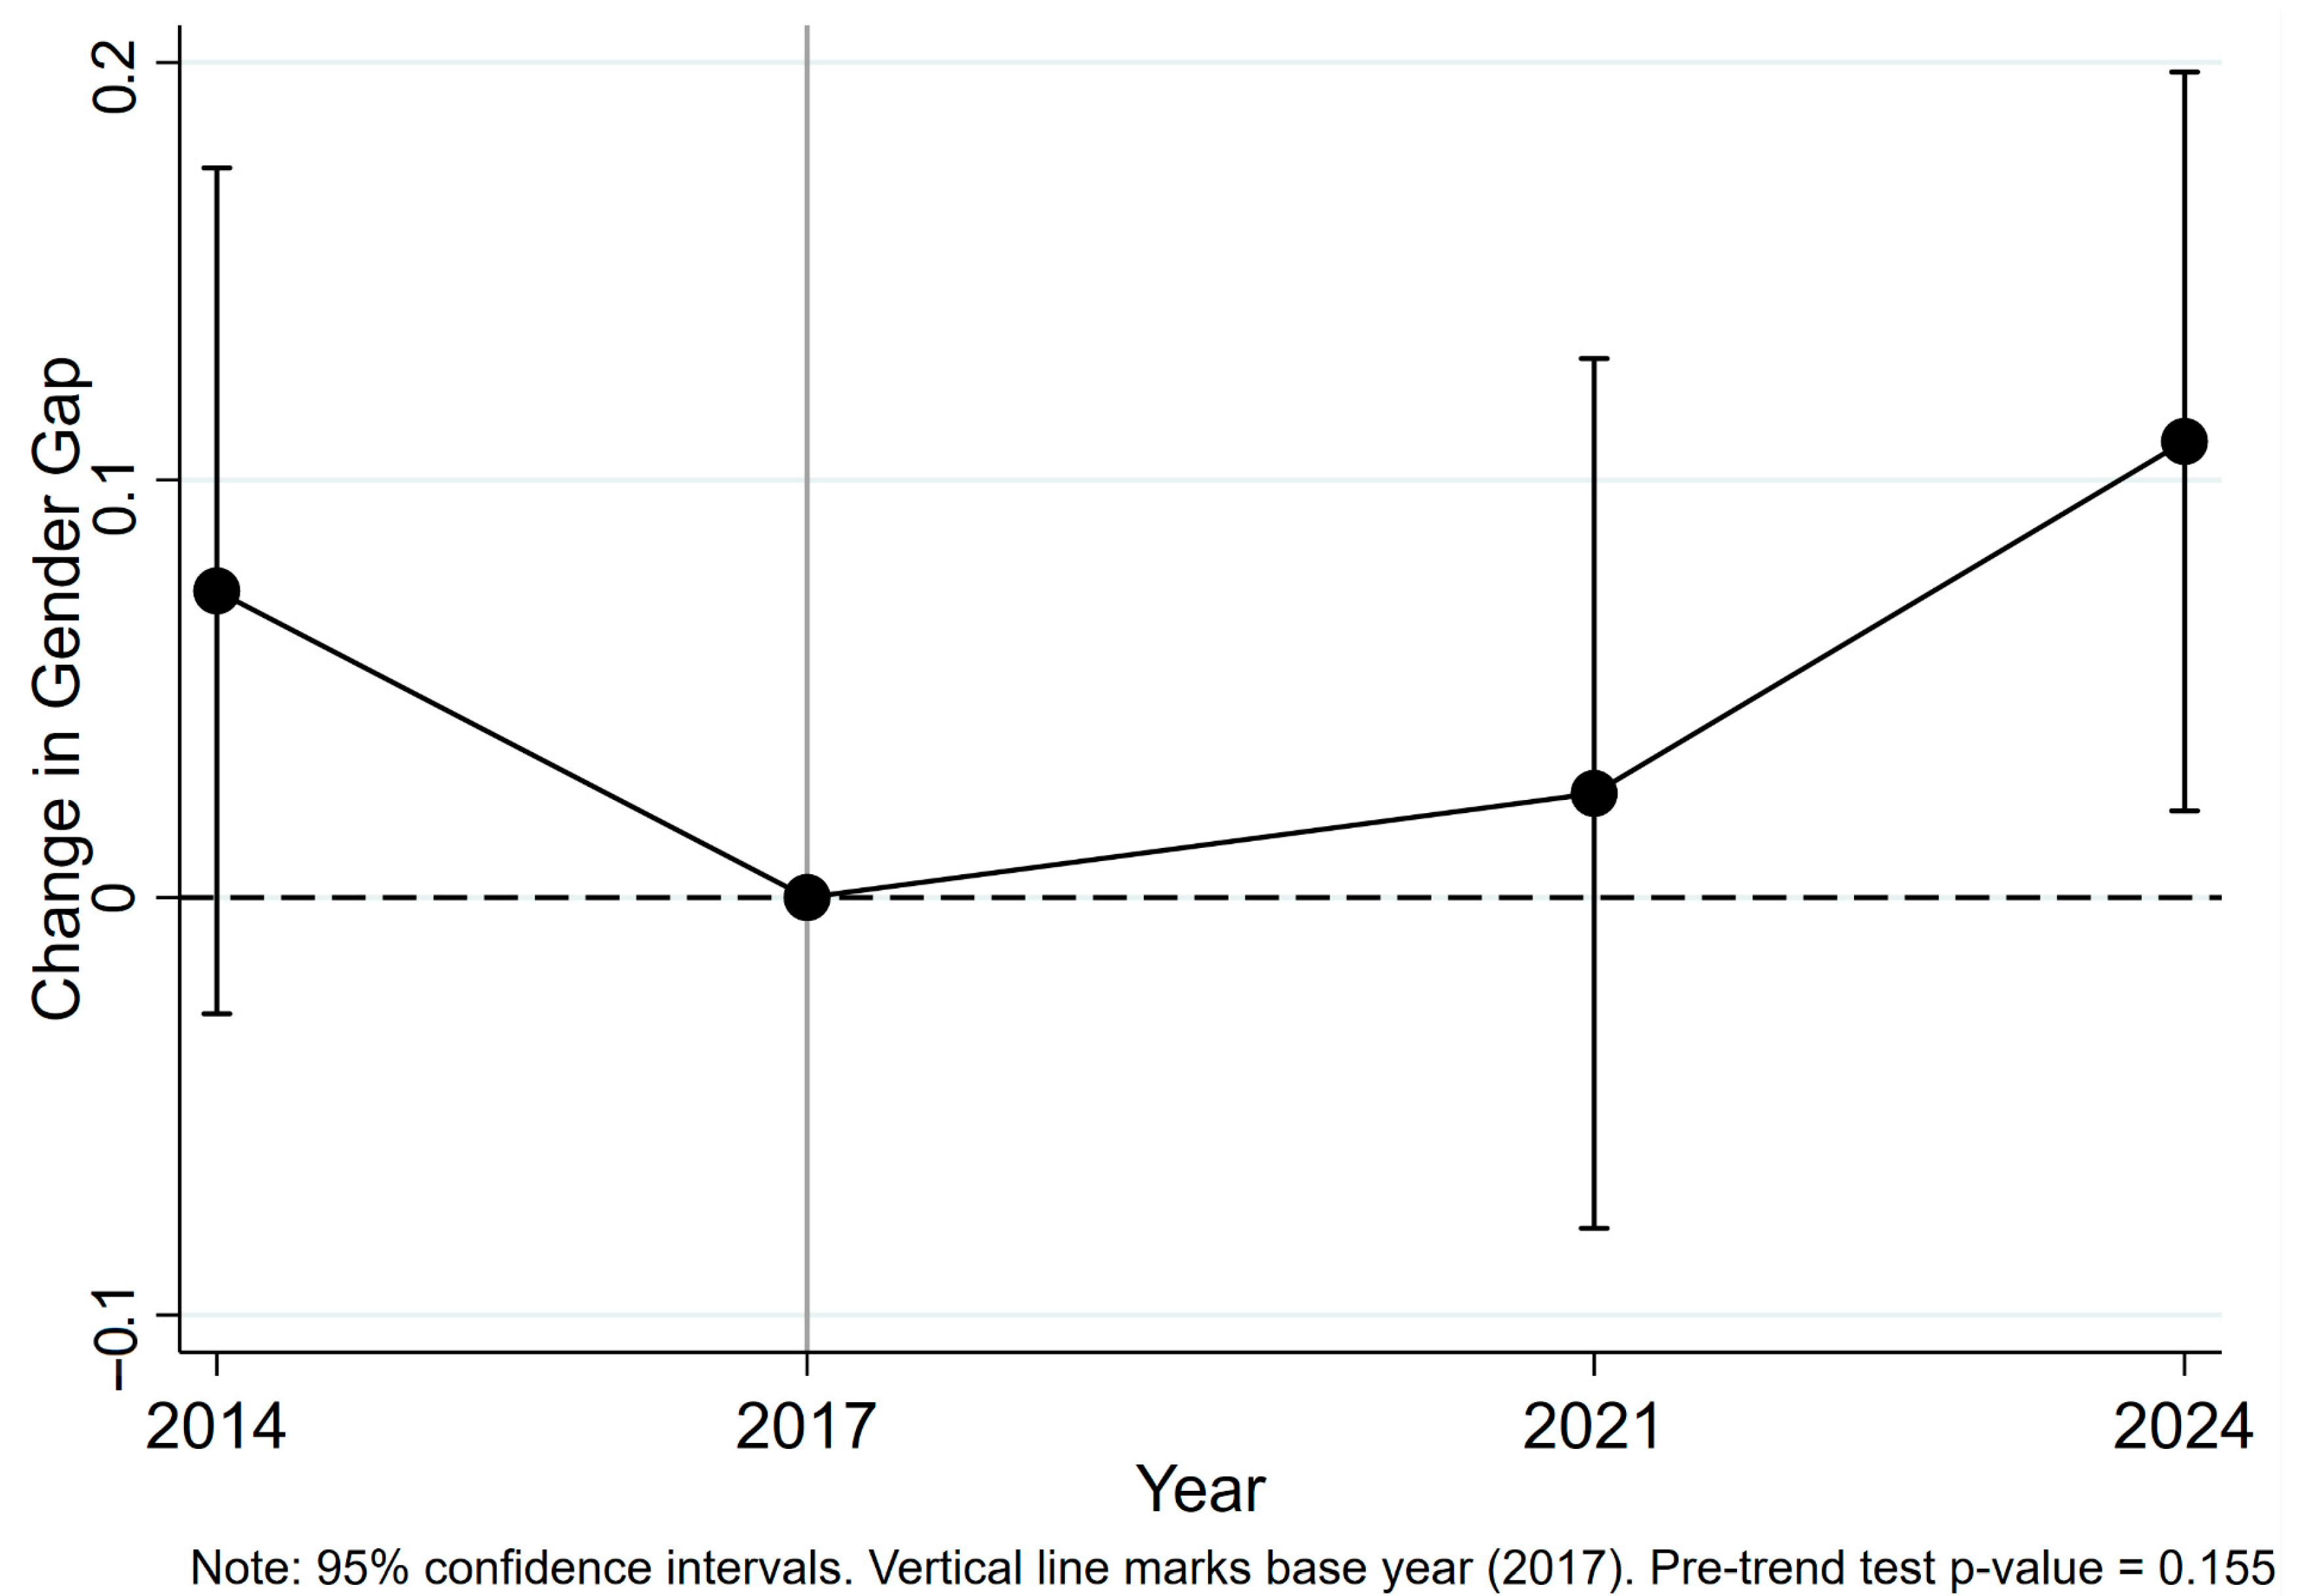
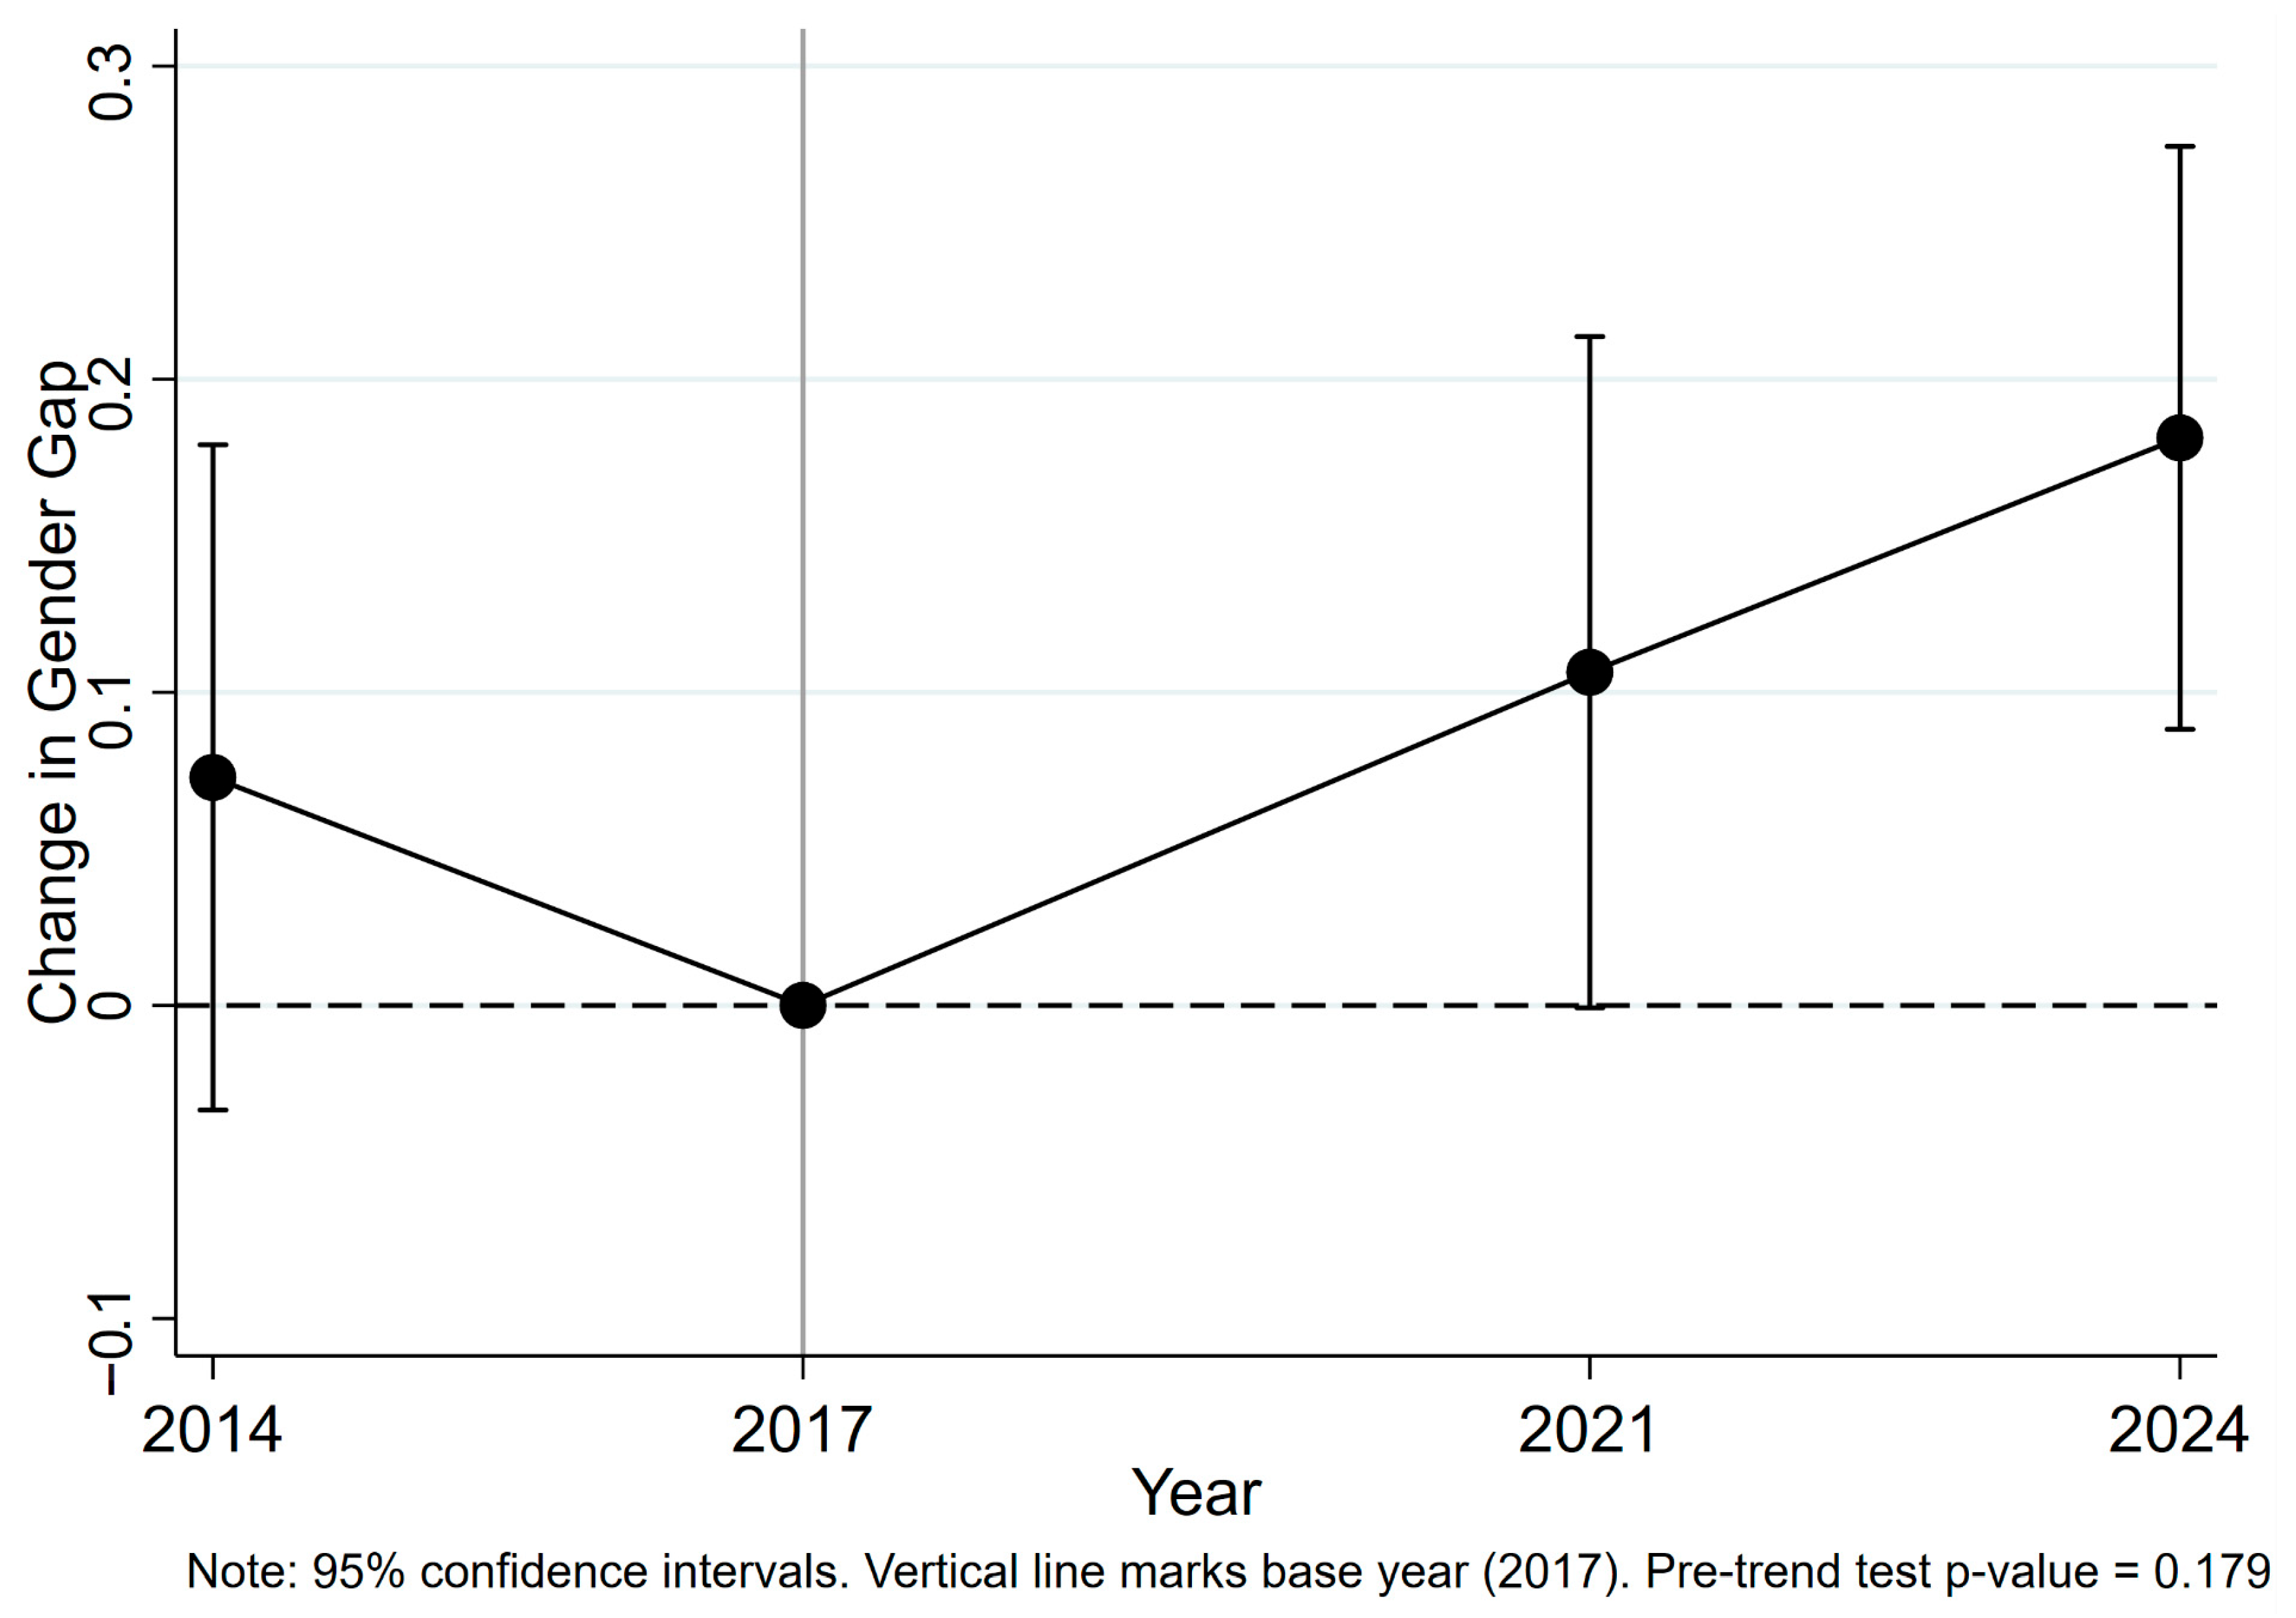
Figure 1 and
Figure 2 present the resulting interaction estimates for account ownership and digital payment usage, respectively. Full estimation results are reported in
Appendix F.
The pre-trend diagnostic relies on the only available pre-reform comparison (2014 versus 2017). The estimates provide no evidence of differential pre-trends in the gender gap prior to 2017, as the female × 2014 coefficient is statistically indistinguishable from zero for both account ownership (p-value = 0.155) and digital payments (p-value = 0.179).
Estimates for the post-2017 period indicate a pronounced narrowing of gender disparities in financial inclusion. For account ownership (
Figure 1), the interaction effect for 2021 is positive but not statistically significant, suggesting that the structural shift in access to banking services materialized gradually. By 2024, however, a significant divergence emerges, with the gender gap narrowing by 10.9 ppt relative to the 2017 baseline (see
Appendix F for detailed estimates).
In contrast, post-2017 changes in digital payment usage are more immediate and pronounced. As shown in
Figure 2, the gender gap begins narrowing in 2021 (
p-value = 0.052) and, by 2024, declines by 18.1 ppt relative to the 2017 baseline. This pattern is consistent with fintech diffusion and mobile payment infrastructure serving as rapid channels through which women’s financial inclusion expanded following the relaxation of mobility restrictions.
To assess robustness, the event-study-style model is re-estimated without covariates and with placebo treatment timing (results reported in
Appendix G). The findings indicate that the observed narrowing of the gender gap in account ownership and digital payment usage by 2024 is not explained by changes in age, income, or educational attainment. In addition, placebo tests restricted to the pre-period (2014–2017), in which 2017 is treated as a false reform date, yield insignificant effects for both outcomes, and the differential linear pre-trend test likewise provides no evidence of a gender-specific pre-trend. Taken together, these results are consistent with interpreting the post-2018 dynamics as a discrete reform-era shift rather than a continuation of pre-existing trends.
5. Conclusions and Implications
Saudi Arabia’s experience over the 2014–2024 period provides rare evidence of rapid gender convergence in financial inclusion within a high-income emerging market undergoing simultaneous legal reforms and payments modernization. Using four waves of Global Findex microdata, this article documents two principal findings. First, aggregate gender gaps in both account ownership and digital payment usage declined substantially by 2024. Second, this convergence is strongly conditioned on employment status: conditional parity is observed among adults in the workforce, while meaningful gaps persist among those outside the labor force.
Three empirical approaches clarify the economic interpretation of the findings. First, estimates from weighted logit models show that the conditional gender penalty among employed adults becomes economically small and statistically insignificant by 2024 for both account ownership and digital payments, whereas sizable gaps persist among non-employed adults, particularly for account ownership. Second, the Kitagawa decomposition indicates that as overall gaps narrow, the composition channel—gender differences in workforce participation—becomes an increasingly important driver of the remaining aggregate gap, consistent with employment acting as the “on-ramp” into formal accounts and regulated payment channels. Third, the event-study interaction design provides evidence consistent with a structural shift associated with the reform period. Pre-reform differences do not exhibit differential trends between 2014 and 2017, while post-2018 estimates show a pronounced narrowing of the gender gap, especially for digital payments. This pattern is consistent with an interpretation in which expanded legal rights coincided with the diffusion of digital payment infrastructure to reshape women’s financial access.
The findings have two principal policy implications. First, fintech expansion alone is unlikely to eliminate gender gaps if a large share of women remains outside formal employment. Saudi Arabia’s convergence is best understood as the combined outcome of labor-market integration and payment-system modernization, reinforced by institutional arrangements that link formal employment to formal accounts, such as the WPS. Second, remaining disparities are increasingly concentrated among women outside the labor force, where barriers are more likely to reflect household financial arrangements, limited product suitability, onboarding frictions, and documentation or affordability constraints.
In practical terms, further gains in inclusion are more likely to arise from targeted pathways for non-employed women than from increasing usage among already-employed women. These pathways include simplified onboarding and KYC procedures where feasible, women-centered product design, and interventions that connect non-employed women to income-generating activities compatible with their constraints.
Several limitations qualify the interpretation of these findings and motivate future research. The Global Findex data constitute repeated cross-sections with a limited number of Saudi waves, and the public-use microdata suppress survey design identifiers and citizenship, which is particularly relevant in a labor market with a large expatriate population. As a result, estimates should be interpreted as reflecting resident-population patterns, and compositional changes in the expatriate workforce may mechanically affect measured gaps, especially among employed respondents. Moreover, while the event-study-style framework provides a transparent pre-trend diagnostic and is consistent with a reform-era break, stronger causal attribution would require designs incorporating external comparison groups, such as GCC/MENA countries without comparable reforms, and richer household data on intra-household financial decision-making and individual-level constraints. Finally, although behavioral channels such as perceived usefulness, trust, and perceived risk are discussed, these constructs are not directly measured in the Global Findex data; thus, the behavioral interpretation of the labor–financial nexus remains theoretically grounded but empirically unverified at the individual level.
Future research could address these limitations in several ways. A multi-country DID framework could better isolate the policy component of the post-2018 shift. Household and administrative data, where available, could distinguish between financial “access” and effective “control” over accounts and assess how wage digitization and payroll compliance translate into sustained usage. Future work could also examine which digital instruments—cards, wallets, instant payments, POS acceptance, and government-to-person rails—are most effective at reducing gender gaps among non-employed women. Finally, research using instruments that directly capture psychological dimensions would be necessary to validate the behavioral interpretation of the labor–financial nexus. Collectively, these extensions would strengthen the external validity of the Saudi experience and reinforce its central insight: legal reforms that expand women’s economic agency are most likely to yield inclusive financial outcomes when complemented by institutions and payment infrastructures that translate participation into routine financial usage.