


Machine Learning for Predicting Bank Stability: The Role of Income Diversification in European Banking
 , ,
, ,  , ,
, ,
Abstract
1. Introduction
2. Literature Review
2.1. Previous Studies in Europe
2.2. Previous Studies in the Rest of the World
3. Lack of Literature
4. Research Methodology and Data
5. Results
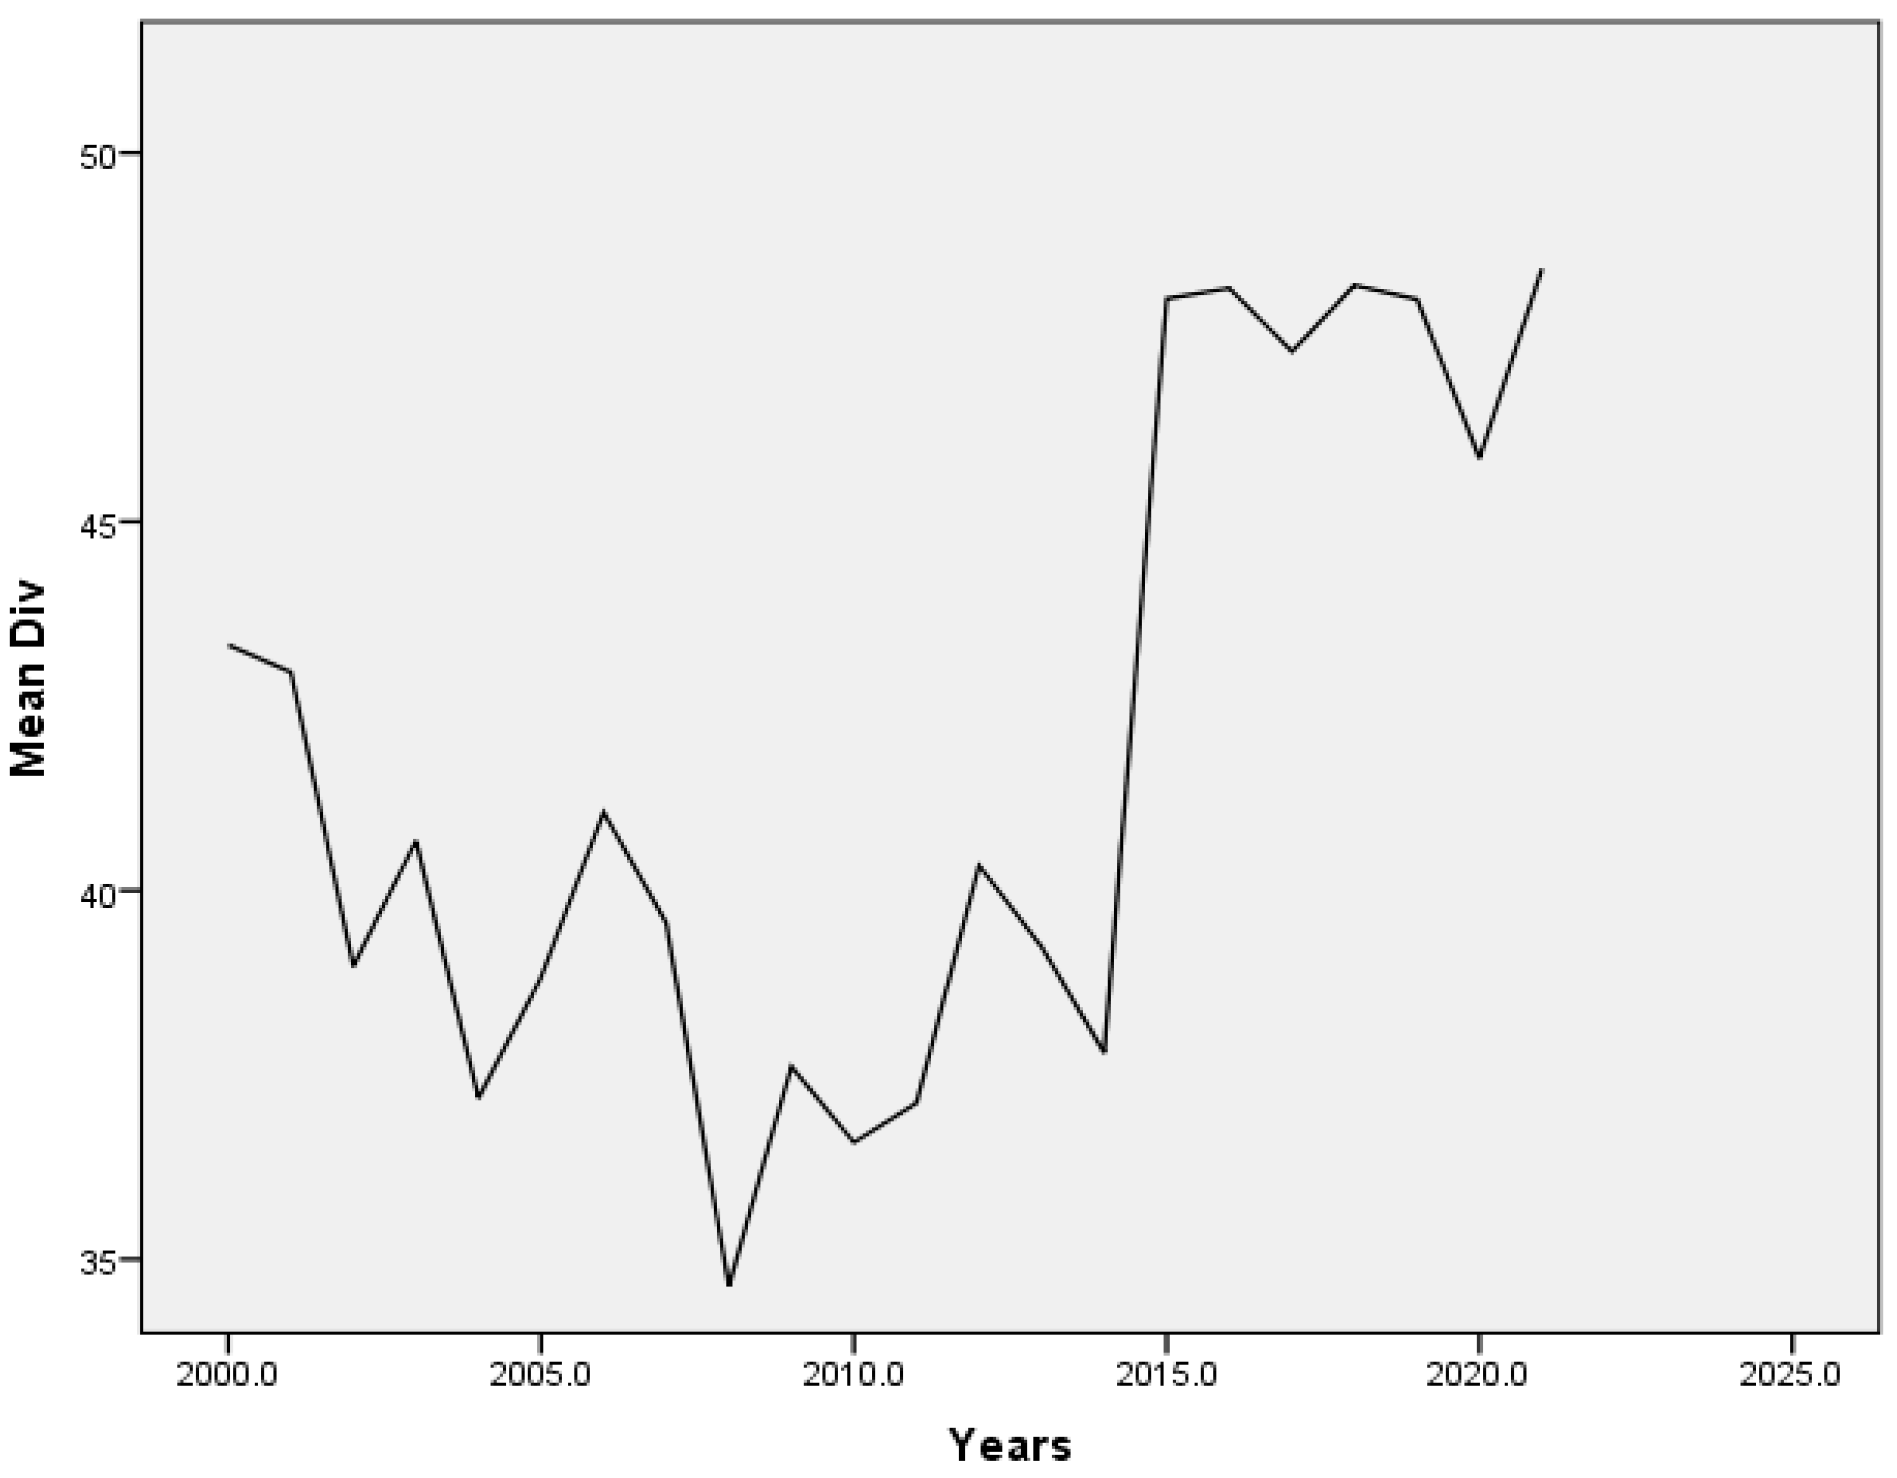
5.1. Comparison Between Income Diversification and Bank Z-Score in Europe During 2000–2021
5.2. Descriptive Analysis
5.3. Regression Results and Discussion
5.4. Machine-Learning Results and Discussion
5.5. Addressing Class Imbalance and Model Retraining
6. Conclusions
7. Limitations and Future Work
Author Contributions
Funding
Institutional Review Board Statement
Informed Consent Statement
Data Availability Statement
Acknowledgments
Conflicts of Interest
References
- Lahouel, B.B.; Taleb, L.; Kossai, M. Nonlinearities between Bank Stability and Income Diversification: A Dynamic Network Data Envelopment Analysis Approach. Expert Syst. Appl. 2022, 207, 117776. [Google Scholar] [CrossRef]
- Velasco, P. Is Bank Diversification a Linking Channel between Regulatory Capital and Bank Value? Br. Account. Rev. 2022, 54, 101070. [Google Scholar] [CrossRef]
- De Meo, E.; De Nicola, A.; Lusignani, G.; Orsini, F.; Zicchino, L. European Banks in the XXI Century: Are Their Business Models Sustainable? In Proceedings of the 5th EBA Policy Research Workshop “Competition in Banking: Implications for Financial Regulation and Supervision”, London, UK, 28–29 November 2016; pp. 28–29. [Google Scholar]
- Sharma, S.; Anand, A. Income Diversification and Bank Performance: Evidence from BRICS Nations. Int. J. Product. Perform. Manag. 2018, 67, 1625–1639. [Google Scholar] [CrossRef]
- Dzingirai, C.; Dzingirai, M. Threshold Effect of Non-Interest Income Disaggregates on Commercial Banks’ Financial Performance in Zimbabwe. Heliyon 2024, 10, e31379. [Google Scholar] [CrossRef]
- Nisar, S.; Peng, K.; Wang, S.; Ashraf, B.N. The Impact of Revenue Diversification on Bank Profitability and Stability: Empirical Evidence from South Asian Countries. Int. J. Financ. Stud. 2018, 6, 40. [Google Scholar] [CrossRef]
- Kim, H.; Batten, J.A.; Ryu, D. Financial Crisis, Bank Diversification, and Financial Stability: OECD Countries. Int. Rev. Econ. Financ. 2020, 65, 94–104. [Google Scholar] [CrossRef]
- Zouaoui, H.; Zoghlami, F. What Do We Know about the Impact of Income Diversification on Bank Performance? A Systematic Literature Review. J. Bank. Regul. 2023, 24, 286–309. [Google Scholar] [CrossRef]
- Karkowska, R. Diversification of Banking Activity and Its Importance in Building Financial Stability. In Global Versus Local Perspectives on Finance and Accounting, Proceedings of the 19th Annual Conference on Finance and Accounting (ACFA 2018), Prague, Czech Republic, 25 May 2018; Springer: Berlin/Heidelberg, Germany, 2019; pp. 79–88. [Google Scholar]
- Adem, M. Impact of Income Diversification on Bank Stability: A Cross-Country Analysis. Asian J. Account. Res. 2023, 8, 133–144. [Google Scholar] [CrossRef]
- Ben Lahouel, B.; Taleb, L.; Kočišová, K.; Ben Zaied, Y. The Threshold Effects of Income Diversification on Bank Stability: An Efficiency Perspective Based on a Dynamic Network Slacks-Based Measure Model. Ann. Oper. Res. 2023, 330, 267–304. [Google Scholar] [CrossRef]
- Maudos, J. Income Structure, Profitability and Risk in the European Banking Sector: The Impact of the Crisis. Res. Int. Bus. Financ. 2017, 39, 85–101. [Google Scholar] [CrossRef]
- Rossi, S.; Dreassi, A.; Borroni, M.; Paltrinieri, A. Does Revenue Diversification Still Matter in Banking? Evidence from A Cross-Country Analysis. J. Financ. Manag. Mark. Inst. 2020, 8, 2050003. [Google Scholar] [CrossRef]
- Simoens, M.; Vander Vennet, R. Does Diversification Protect European Banks’ Market Valuations in a Pandemic? Financ. Res. Lett. 2022, 44, 102093. [Google Scholar] [CrossRef]
- Ho, T.H.; Nguyen, D.T.; Luu, T.B.; Le, T.D.; Ngo, T.D. Bank Performance during the COVID-19 Pandemic: Does Income Diversification Help? J. Appl. Econ. 2023, 26, 2222964. [Google Scholar] [CrossRef]
- Farag, K.; Kassem, T.; Ramzy, Y. The Crucial Macroeconomic and Microeconomic Determinants of Retail and Corporate Credit Risks. J. Account. Financ. Audit. Stud. (JAFAS) 2023, 9, 148–161. [Google Scholar] [CrossRef]
- Wang, C.; Lin, Y. The Influence of Income Diversification on Operating Stability of the Chinese Commercial Banking Industry. Rom. J. Econ. Forecast. 2018, 21, 38. [Google Scholar]
- Brahmana, R.; Kontesa, M.; Gilbert, R.E. Income Diversification and Bank Performance: Evidence from Malaysian Banks. Econ. Bull. 2018, 38, 799–809. [Google Scholar]
- Vidyarthi, H. Dynamics of Income Diversification and Bank Performance in India. J. Financ. Econ. Policy 2020, 12, 383–407. [Google Scholar] [CrossRef]
- Abuzayed, B.; Al-Fayoumi, N.; Molyneux, P. Diversification and Bank Stability in the GCC. J. Int. Financ. Mark. Inst. Money 2018, 57, 17–43. [Google Scholar] [CrossRef]
- Le, T.D. Geographic Expansion, Income Diversification, and Bank Stability: Evidence from Vietnam. Cogent Bus. Manag. 2021, 8, 1885149. [Google Scholar] [CrossRef]
- Addai, B.; Tang, W.; Agyeman, A.S. Examining the Impact of Income Diversification on Bank Performance: Are Foreign Banks Heterogeneous? J. Appl. Econ. 2022, 25, 1–21. [Google Scholar] [CrossRef]
- Chandramohan, K.; Lunawat, C.D.; Lunawat, C.A. The Impact of Diversification on Bank Stability in India. Cogent Bus. Manag. 2022, 9, 2094590. [Google Scholar] [CrossRef]
- Alouane, N.; Kahloul, I.; Grira, J. The Trilogy of Ownership, Income Diversification, and Performance Nexus: Empirical Evidence from Tunisian Banks. Financ. Res. Lett. 2022, 45, 102180. [Google Scholar] [CrossRef]
- Abbas, F.; Ali, S. Dynamics of Diversification and Banks’ Risk-taking and Stability: Empirical Analysis of Commercial Banks. Manag. Decis. Econ. 2022, 43, 1000–1014. [Google Scholar] [CrossRef]
- Shabir, M.; Jiang, P.; Shahab, Y.; Wang, W.; Işık, O.; Mehroush, I. Diversification and Bank Stability: Role of Political Instability and Climate Risk. Int. Rev. Econ. Financ. 2024, 89, 63–92. [Google Scholar] [CrossRef]
- Shahriar, A.; Mehzabin, S.; Azad, M.A.K. Diversification and Bank Stability in the MENA Region. Soc. Sci. Humanit. Open 2023, 8, 100520. [Google Scholar] [CrossRef]


| Variables | Measurements |
|---|---|
| Dependent variables: Z-score Non-performing loan (NPL) ratio Capital adequacy ratio (CAR) | (ROA + equity to assets ratio)/STDEV of ROA NPLs/total gross loans Total equity/total assets |
| Independent variables: Income diversification (DIV) Concentration risk (CON) Operating efficiency (EFF) Stock market return (SMR) Stock price volatility (SPV) Profitability (PROF) Economic growth (GDP) Inflation (INF) Unemployment (UNEMP) | Non-interest income/total income Assets of the three largest banks/total assets of all banks Total expenses/total income End of period market capitalization−beginning of period market capitalization/end of period market capitalization Square root of (sum of (daily return minus average daily return) squared divided by number of days) ROA, ROE, and NIM Real GDP growth rate CPI in current year − CPI in previous year/CPI in previous year Number of unemployed people/total labor force |
| Variables | Mean | STDEV | Min | Max |
|---|---|---|---|---|
| Z-score | 13.78 | 9.25 | −0.33 | 57.44 |
| NPL | 5.72 | 6.97 | 0.10 | 47.75 |
| CAR | 16.19 | 4.51 | 7.00 | 35.65 |
| DIV | 41.77 | 12.96 | 7.39 | 82.49 |
| CON | 71.63 | 16.75 | 28.56 | 100.00 |
| EFF | 58.90 | 12.09 | 14.75 | 97.17 |
| SMR | 6.72 | 24.84 | −74.56 | 124.98 |
| SPV | 20.34 | 8.85 | 6.33 | 61.52 |
| ROA | 0.62 | 1.06 | −9.53 | 4.36 |
| ROE | 7.41 | 13.87 | −117.67 | 37.46 |
| NIM | 2.11 | 1.18 | 0.18 | 5.79 |
| GDP | 2.43 | 3.93 | −14.84 | 24.48 |
| INF | 2.24 | 2.09 | 4.45 | 15.40 |
| UNEMP | 4.70 | 2.66 | 0.996 | 20.86 |
| NPL | CAR | Z-Score | ||||
|---|---|---|---|---|---|---|
| Variables | Estimate | Pr(|t|) | Estimate | Pr(|t|) | Estimate | Pr(|t|) |
| Lags in dep. var. | 0.6617440 *** | 0.0000 | 0.9288025 *** | 0.0000 | 0.606589 *** | 0.0000 |
| DIV | −0.0600427 * | 0.054423 | 0.0190250 ** | 0.0139341 | 0.064441 ** | 0.02702 |
| CON | −0.0142226 | 0.503962 | 0.01492686 ** | 0.0143470 | −0.01656 | 0.82612 |
| EFF | −0.0602007 ** | 0.020025 | 0.00172733 | 0.8167567 | 0.0177752 | 0.64720 |
| SMR | 0.0075872 | 0.235614 | −0.012461 *** | 0.0057241 | −0.0086183 | 0.23690 |
| SPV | 0.0348037 | 0.231596 | −0.01111653 | 0.4354113 | 0.0255000 | 0.21924 |
| ROA | −0.3435750 | 0.358737 | 0.19490603 * | 0.0870637 | 1.4711140 * | 0.05789 |
| ROE | −0.0330053 ** | 0.02612 | −0.01256538 | 0.4233142 | −0.0082849 | 0.84289 |
| NIM | −0.4996805 | 0.271358 | 0.08224446 | 0.4253109 | −0.0804353 | 0.87443 |
| GDP | −0.1139556 ** | 0.02793 | −0.082485 *** | 0.0007126 | 0.0161731 | 0.72245 |
| INF | 0.0124079 | 0.91447 | −0.105292 *** | 0.0017900 | −0.2637828 * | 0.01648 |
| UNEMP | 07747466 *** | 0.00010 | 0.00092265 | 0.9703113 | 0.1452743 | 0.12279 |
| Sargan test | 26 (p-value = 1) | 26 (p-value = 1) | 26 (p-value = 1) | |||
| Autocorrelation test (1) | Normal = −2.059052 (p-value = 0.339489) | Normal = −2.291137 (p-value = 0.521955) | Normal = −1.408896 (p-value = 0.15887) | |||
| Autocorrelation test (2) | Normal = 0.5974548 (p-value = 0.5502) | Normal = 1.140559 (p-value = 0.25405) | Normal = 0.7279215 (p-value = 0.46666) | |||
| Wald test | Chisq(12) = 1668.669 (p-value = < 0.00000) | Chisq(12) = 1831.75 (p-value = < 0.00000) | Chisq(12) = 2318.332 (p-value = < 0.00000) | |||
| NPL | CAR | Z-Score | ||||
|---|---|---|---|---|---|---|
| Variables | Estimate | Pr(|t|) | Estimate | Pr(|t|) | Estimate | Pr(|t|) |
| DIV | 0.042937 ** | 0.033569 | 0.09224 *** | 0.0000 | 0.09224 *** | 0.0000 |
| CON | 0.045269 * | 0.054029. | 0.036232 * | 0.0634 | 0.03623 * | 0.0634 |
| EFF | 0.000566 | 0.979999 | 0.01904 | 0.3078 | 0.01904 | 0.3078 |
| SMR | −0.02635 ** | 0.006476 | −0.00969 | 0.2232 | −0.00969 | 0.2232 |
| SPV | −0.05842 * | 0.033568 | −0.117733 *** | 0.0000 | −0.11773 *** | 0.0000 |
| ROA | −1.02345 * | 0.010345 | 1.337261 *** | 0.0000 | 1.33726 *** | 0.0000 |
| ROE | 0.023166 | 0.488981 | −0.11047 *** | 0.0000 | −0.11047 *** | 0.0000 |
| NIM | −0.21657 | 0.576269 | −0.54226 * | 0.0920 | −0.54226 * | 0.0920 |
| GDP | 0.080210 | 0.228705 | −0.22664 *** | 0.0000 | −0.22664 *** | 0.0000 |
| INF | −0.21054 * | 0.044879 | −0.59337 *** | 0.0000 | −0.59337 *** | 0.0000 |
| UNEMP | 1.893341 *** | 0.000000 | −0.02799 | 0.78968 | −0.0279898 | 0.78968 |
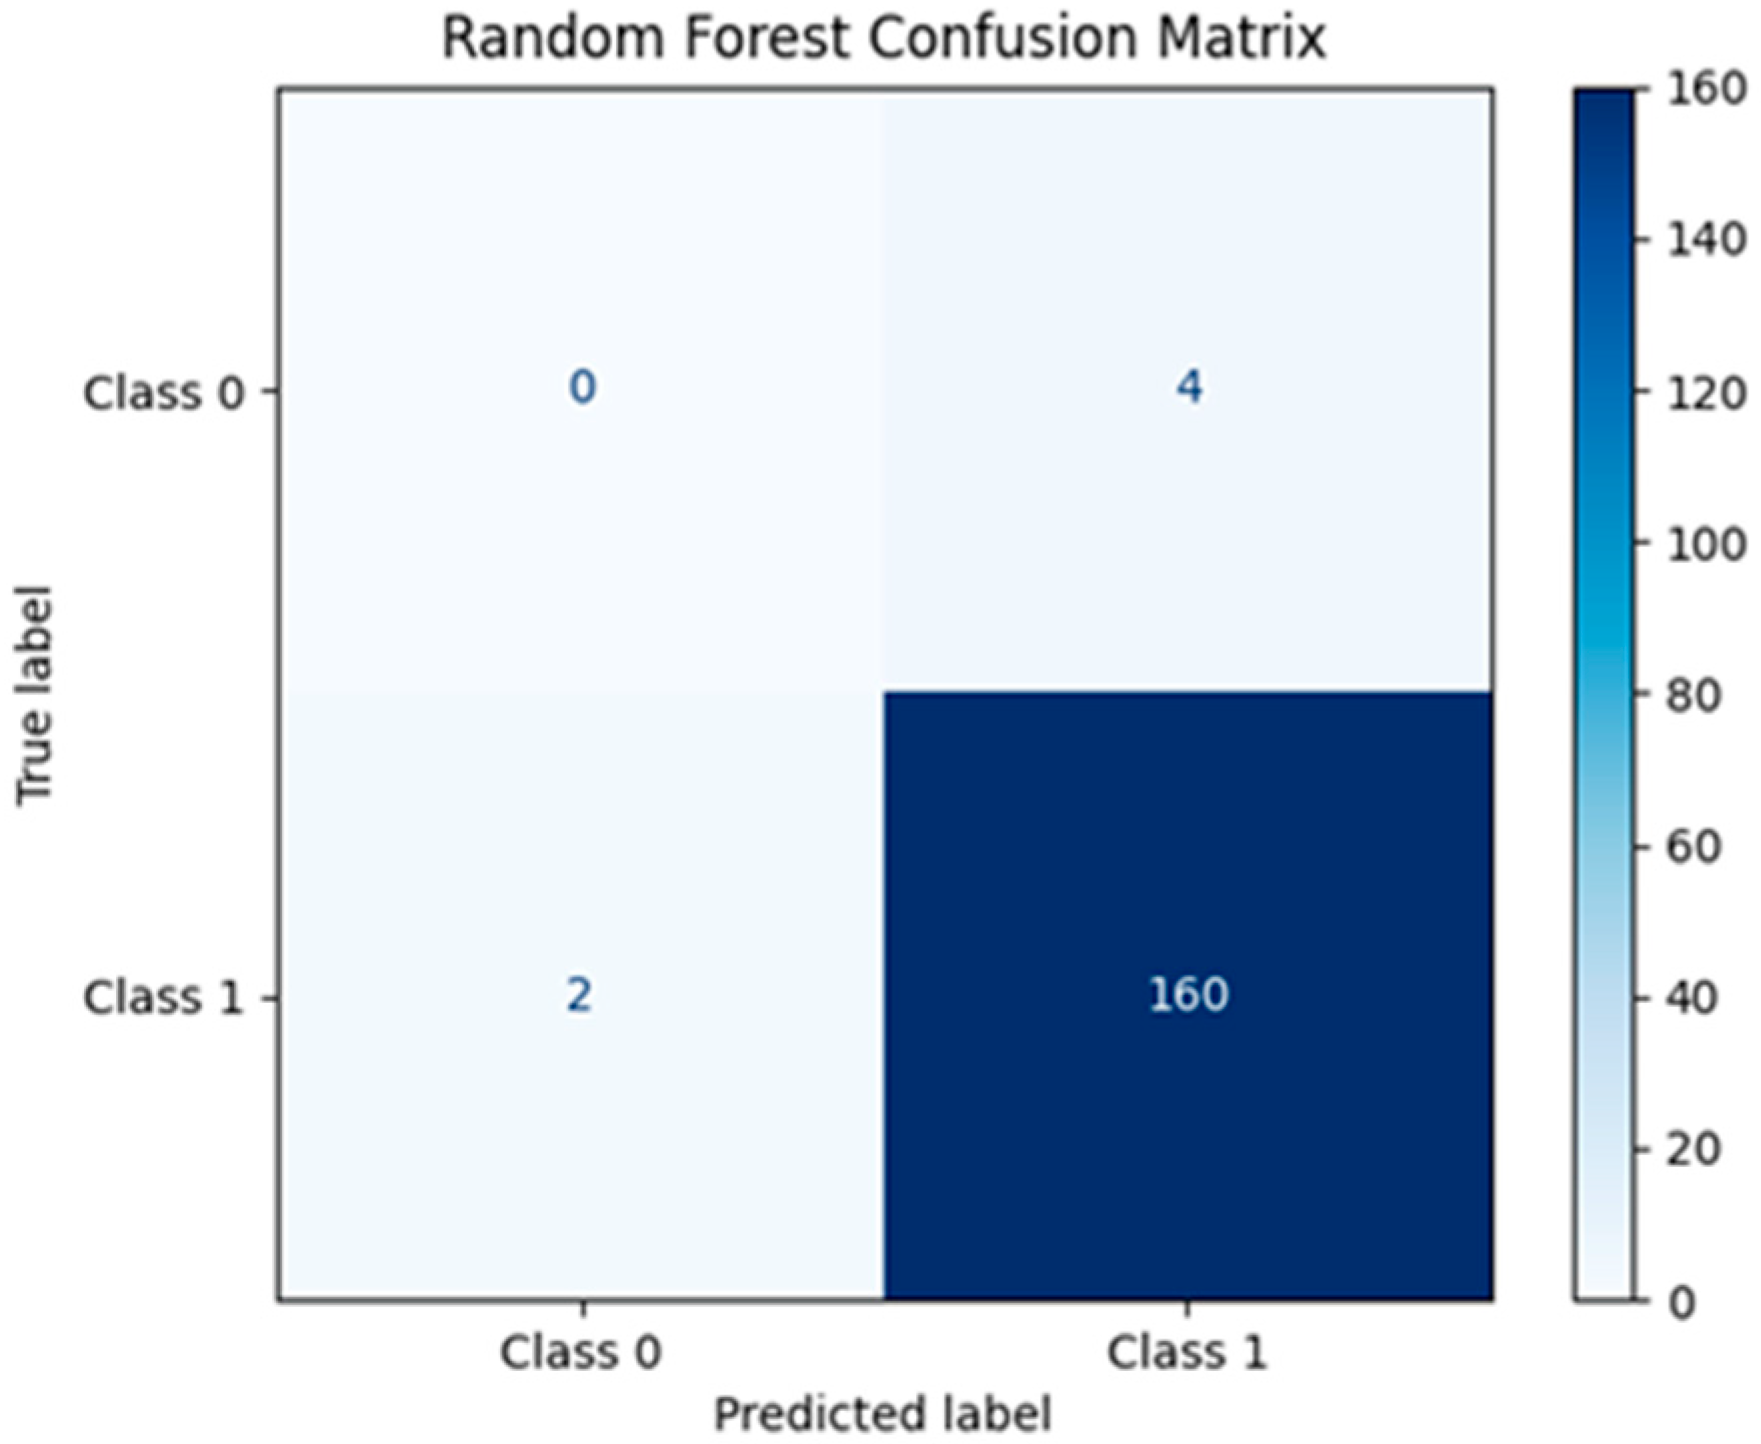
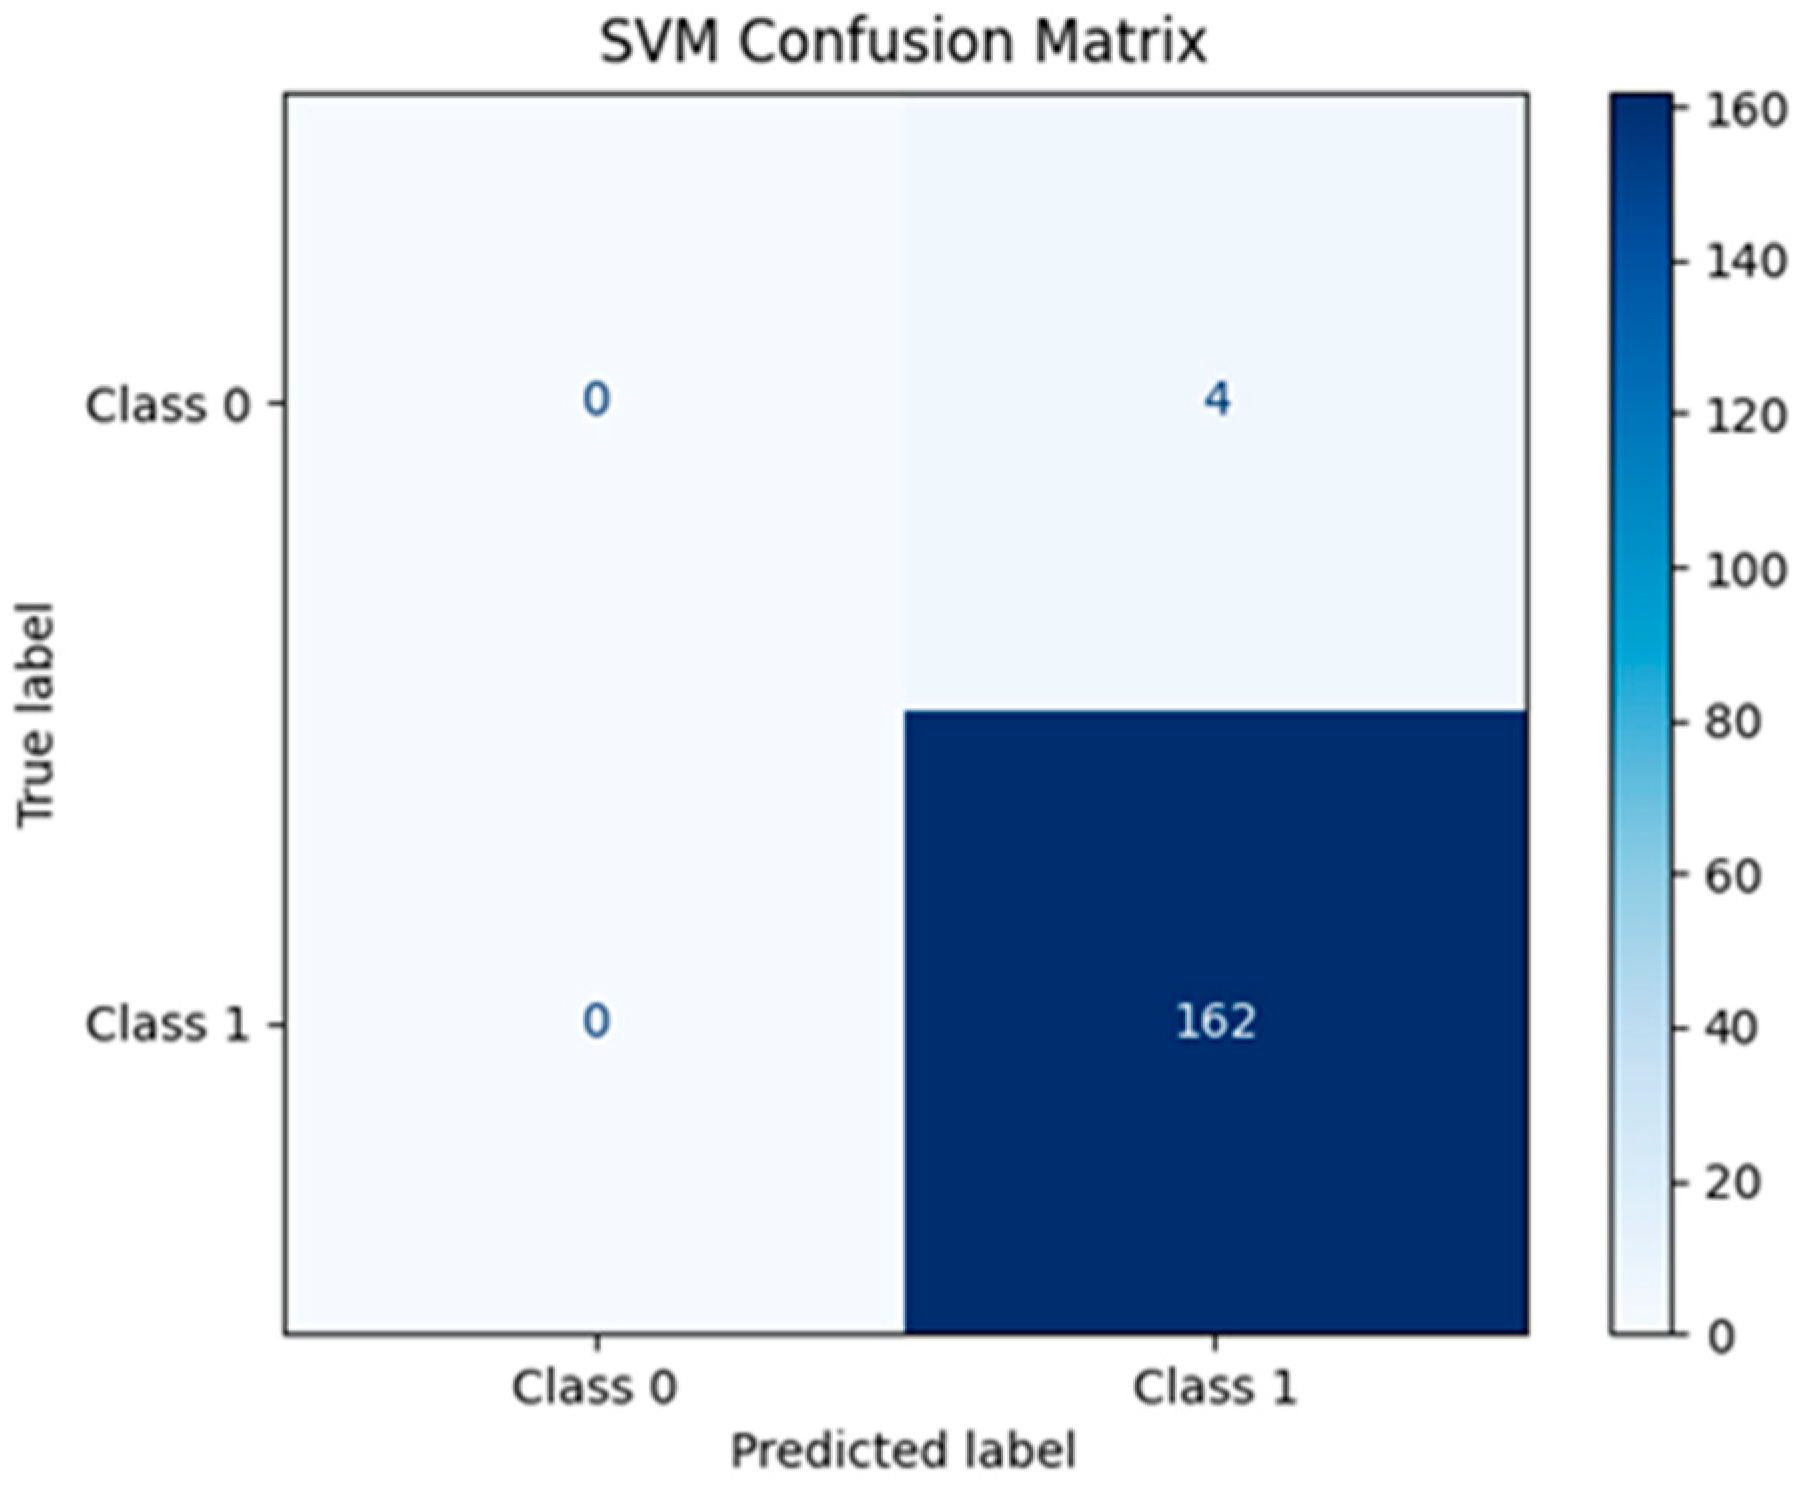
| Confusion Matrix | Random Forest Scores | SVM Scores |
|---|---|---|
| TP (True Positive) | 160 | 162 |
| TN (True Negative) | 0 | 0 |
| FP (False Positive) | 4 | 4 |
| FN (False Negative) | 2 | 0 |
| Accuracy | 96.39% | 97.59% |
| F1-score | 0.98 | 0.99 |
| Model | RMSE | MAE | R2 |
|---|---|---|---|
| Random Forest | 0.147 | 0.112 | 0.92 |
| SVM | 0.163 | 0.124 | 0.88 |
| Model | TN | FP | FN | TP | Recall (Class 1) | Precision (Class 1) | F1-Score (Class 1) |
|---|---|---|---|---|---|---|---|
| Random Forest | 88 | 1 | 0 | 97 | 1.00 | 0.9898 | 0.9949 |
| SVM | 86 | 3 | 0 | 97 | 1.00 | 0.9700 | 0.9848 |
| Model | TN | FP | FN | TP | Recall (Class 1) | Precision (Class 1) | F1-Score (Class 1) |
|---|---|---|---|---|---|---|---|
| Random Forest | – | – | – | – | 0.9779 | 0.9816 | 0.9796 |
| SVM | – | – | – | – | 1.0000 | 0.9801 | 0.9900 |
Disclaimer/Publisher’s Note: The statements, opinions and data contained in all publications are solely those of the individual author(s) and contributor(s) and not of MDPI and/or the editor(s). MDPI and/or the editor(s) disclaim responsibility for any injury to people or property resulting from any ideas, methods, instructions or products referred to in the content. |
© 2025 by the authors. Licensee MDPI, Basel, Switzerland. This article is an open access article distributed under the terms and conditions of the Creative Commons Attribution (CC BY) license (https://creativecommons.org/licenses/by/4.0/).
Share and Cite
Farag, K.; Ali, L.; Mutai, N.C.; Luqman, R.; Mahmoud, A.; Krasniqi, N. Machine Learning for Predicting Bank Stability: The Role of Income Diversification in European Banking. FinTech 2025, 4, 21. https://doi.org/10.3390/fintech4020021
Farag K, Ali L, Mutai NC, Luqman R, Mahmoud A, Krasniqi N. Machine Learning for Predicting Bank Stability: The Role of Income Diversification in European Banking. FinTech. 2025; 4(2):21. https://doi.org/10.3390/fintech4020021
Chicago/Turabian StyleFarag, Karim, Loubna Ali, Noah Cheruiyot Mutai, Rabia Luqman, Ahmed Mahmoud, and Nol Krasniqi. 2025. "Machine Learning for Predicting Bank Stability: The Role of Income Diversification in European Banking" FinTech 4, no. 2: 21. https://doi.org/10.3390/fintech4020021
APA StyleFarag, K., Ali, L., Mutai, N. C., Luqman, R., Mahmoud, A., & Krasniqi, N. (2025). Machine Learning for Predicting Bank Stability: The Role of Income Diversification in European Banking. FinTech, 4(2), 21. https://doi.org/10.3390/fintech4020021