1. Introduction
The global foreign exchange (forex) market is characterized by substantial liquidity, pronounced volatility, and increasing complexity, all of which pose considerable challenges to investors, financial institutions, and policymakers. In this dynamic and uncertain environment, accurate risk quantification is critical for maintaining financial stability and supporting prudent investment and regulatory decisions. Value at Risk (VaR) and Expected Shortfall (ES) have become standard tools in financial risk management, offering probabilistic estimates of potential losses under adverse market conditions. While VaR estimates the maximum expected loss at a given confidence level over a specific time horizon, ES provides the average loss beyond the VaR threshold, offering a more comprehensive understanding of tail risks [
1]. Although ES is more coherent, the focus of this study remains on VaR due to data limitations and the model’s emphasis on extreme loss quantification at predefined confidence levels.
Despite their widespread application, traditional econometric models used in VaR estimation, most notably the Generalized Autoregressive Conditional Heteroskedasticity (GARCH) family, face notable limitations. While GARCH models are effective in capturing volatility clustering and time-varying variance, they are based on assumptions of linearity and stationarity, which are often violated in real-world financial time series. As a result, these models may exhibit poor predictive performance during episodes of market stress or regime shifts, particularly in the highly volatile and nonlinear environment of forex markets.
Recent advancements in machine learning offer promising alternatives for overcoming these limitations. Long Short-Term Memory (LSTM) networks, a class of recurrent neural networks, have demonstrated considerable success in modeling nonlinear and temporal dependencies within sequential data [
2]. Their architecture enables them to retain long-term information and learn complex patterns that traditional models often overlook. Nevertheless, LSTM models, while powerful in capturing intricate dynamics, may lack the statistical interpretability and theoretical grounding needed for robust volatility estimation and risk quantification.
Motivated by these complementary strengths and limitations, this study proposes a hybrid forecasting framework that integrates a GARCH(1,1) model with an LSTM network, where GARCH residuals are used as inputs to the LSTM. This design allows the GARCH model to first model conditional variance and isolate innovations, while the LSTM component captures nonlinear temporal dependencies in the standardized residuals. This sequential integration aims to improve performance in volatile, data-scarce environments like Rwanda’s forex market. The hybrid GARCH-LSTM approach combines the statistical rigor of volatility modeling with the adaptive learning capabilities of deep neural networks. It aims to provide a more flexible and robust methodology for forecasting financial risk in volatile market conditions.
Although hybrid GARCH-LSTM models have been explored in prior literature [
3,
4], this study introduces important distinctions: (i) it targets an under-researched application context the Rwandan foreign exchange market where price swings can be abrupt and structural breaks frequent; (ii) it applies a customized preprocessing pipeline that includes residual standardization and outlier smoothing, reducing hyperparameter instability; and (iii) it provides a comparative evaluation using not only accuracy metrics (MSE, MAE) but also backtesting and tail-event diagnostics. These innovations respond directly to known shortcomings in previous hybrid studies, including limited generalization and inconsistent performance under volatility regimes.
The motivation for this research is grounded in methodological innovation and its application to emerging markets, where exchange rate instability poses significant macroeconomic and financial risks. Despite growing interest in hybrid forecasting techniques, existing studies have largely focused on equity or commodity markets, with limited application to forex return series in low-income or developing economies. The Rwandan forex market presents a compelling case study due to its exposure to external shocks, relatively thin market structure, and the central role of currency stability in shaping monetary policy and financial sector performance.
Accordingly, this study contributes to the literature in three main ways. First, it introduces and validates a hybrid GARCH-LSTM model tailored for the forecasting of foreign exchange risk, particularly in emerging market contexts. Second, it compares the hybrid model’s performance with standalone GARCH and LSTM models using MSE, MAE, and VaR backtesting metrics. Third, it demonstrates that the hybrid model is particularly effective in capturing extreme market events and delivering improved tail risk estimation, an essential feature for regulatory capital assessment and fin-tech-driven decision tools.
Recent comparative analysis underscores the empirical robustness of the proposed hybrid GARCH-LSTM model. Specifically, when benchmarked against the models developed in [
3,
4], the proposed framework demonstrates an average reduction of approximately 7% in Mean Squared Error (MSE) and 6% in Mean Absolute Error (MAE) across the three currency series analyzed. These performance gains are particularly noteworthy in the context of tail risk estimation under volatile market conditions, highlighting not only the practical utility but also the methodological advancement introduced by the hybrid approach.
The remainder of this paper is structured as follows.
Section 2 reviews related work on GARCH, LSTM, and hybrid modeling techniques for financial risk.
Section 3 describes the methodological framework and implementation, including the LSTM architecture, data preprocessing steps, and hyperparameter tuning.
Section 4 presents the empirical results, including diagnostic checks and comparative forecasting accuracy.
Section 5 concludes with a discussion of policy implications, study limitations, and directions for future research.
2. Literature Review
The application of time series analysis has witnessed remarkable growth in recent decades, largely driven by technological advancements and the increasing complexity of financial data [
5]. The theoretical underpinnings of time series modeling can be traced to early stochastic processes, beginning with the introduction of the autoregressive (AR) model by Yule [
6]. This foundation was expanded by Wold [
7], who developed the autoregressive moving average (ARMA) model for stationary series. However, it was the pioneering work of Box and Jenkins [
8] that established a systematic framework for model estimation, diagnostics, and forecasting through the ARIMA model. Their contributions laid the groundwork for further innovations, notably the development of GARCH models, which enabled effective modeling of non-constant variance and the complex volatility structures often observed in financial time series.
A fundamental aspect of time series models lies in their reliance on historical data patterns to forecast future behavior. Traditional models such as ARMA operate under the assumption of parameter constancy over time. Nevertheless, empirical studies have increasingly indicated that financial time series often exhibit dynamic changes, rendering fixed-parameter models less effective [
9,
10]. This realization has prompted a growing body of research into periodic models that account for hidden periodic components and dynamic shifts in time series structures [
11,
12]. However, these classical approaches, while insightful, often fail to capture the nonlinearities and extreme events common in high-frequency financial data. In this evolving landscape, the present study aims to contribute by proposing a hybrid GARCH-LSTM model specifically designed for forecasting Value at Risk (VaR), offering a robust alternative to conventional linear models.
Parallel to these developments, quantile regression has emerged as an innovative alternative for forecasting VaR. Engle and Manganelli [
13] introduced the Conditional Autoregressive Value at Risk (CAViaR) model, shifting the focus to directly estimating conditional quantiles rather than the full distribution. Further advances, such as Taylor’s [
14] Exponentially Weighted Quantile Regression (EWQR) model, demonstrated superior predictive performance compared to both CAViaR and GARCH-based approaches. Empirical studies, including [
15,
16], have validated the strength of quantile regression models in financial risk estimation.
Moreover, semiparametric approaches have expanded the scope of risk modeling. Ref. [
17], for example, employed semiparametric support vector quantile regression (SSVQR) models, which outperformed traditional variance–covariance and linear quantile regression methods when applied to major indices such as the S & P 500, Nikkei 225, and KOSPI 200. These advancements collectively emphasize the growing potential of novel machine learning methodologies in advancing VaR estimation, although they are rarely adapted for volatile and data-scarce emerging markets like Rwanda.
The integration of neural networks into financial risk modeling has further broadened the toolkit for VaR prediction. Early work demonstrated that while gated recurrent unit (GRU) models effectively captured certain market dynamics, GARCH(1,1) models remained competitive in VaR forecasting at the 95% confidence level. Other researchers, including [
18,
19], explored support vector methods, tree-based models, and ensemble techniques to forecast foreign exchange (FX) rate VaR, achieving notable improvements over classical models. Meanwhile, [
20,
21,
22], incorporated advanced neural network structures such as convolutional neural networks (CNNs) and particle swarm optimization-trained quantile regression networks, consistently reporting higher forecasting accuracy.
Recent advancements in deep learning, particularly the application of Long Short-Term Memory (LSTM) networks, have further refined financial risk forecasting. LSTM architectures, designed to capture long-range dependencies and non-linear temporal patterns, have proven highly effective in modeling complex financial time series [
4]. However, while LSTM networks provide predictive flexibility, they often lack robustness under high-volatility regimes unless paired with statistically grounded preprocessing. Building upon these findings, the present research integrates GARCH and LSTM models to leverage their complementary advantages, combining GARCH’s statistical rigor in volatility modeling with LSTM’s strength in sequence learning.
The evolution of VaR itself reflects the changing landscape of financial risk assessment. Originating from early efforts by the New York Stock Exchange in 1922 to establish capital requirements [
23], VaR methodologies have undergone substantial refinement. Contributions by Garbade (1986, 1987) introduced bond yield sensitivity measures and portfolio standard deviation concepts, laying a practical foundation for modern VaR estimation.
The importance of VaR was solidified globally through regulatory frameworks, particularly with the Basel Accord initiated by the G-10 countries under the Bank for International Settlements (BIS) in 1988. Although the initial accord focused primarily on credit risk, later revisions incorporated market risk elements, influenced by simplified methodologies such as RiskMetrics introduced in 1994 [
24]. Despite its widespread regulatory use, VaR has attracted criticism for its potential to underestimate systemic risks and for its reliance on distributional assumptions [
25]. These shortcomings have spurred interest in alternative risk measures such as Extreme Value Theory (EVT) [
26] and Expected Shortfall (ES) [
27], both of which aim to better capture tail risks and offer a more coherent risk assessment framework.
Innovations in neural network-based frameworks have further enhanced the predictive accuracy of VaR models. Taylor (1999) pioneered the use of quantile regression neural networks for multi-period return density estimation, demonstrating advantages over GARCH-based approaches. Subsequent work by Chen (2009) introduced the integration of exogenous variables into artificial neural networks (ANNs) for VaR prediction, while Yan (2018) leveraged LSTM-based quantile regression models to address asymmetric and heavy-tailed asset returns. More recently, ref. [
3] successfully developed a hybrid GARCH-LSTM model, showing improved performance, particularly during periods of extreme market volatility. Nonetheless, these models have largely focused on developed financial markets, and few have addressed the challenges of thin liquidity, structural breaks, or irregular interventions characteristic of emerging market forex environments.
Taken together, the reviewed literature suggests that hybrid models combining statistical structure and machine learning capacity offer a promising pathway for enhancing VaR forecasting accuracy, particularly in underexplored settings [
28]. This study extends prior research by applying a GARCH-LSTM hybrid model to the Rwandan forex market and validating its performance using both statistical accuracy metrics and financial backtesting procedures.
3. Methodology
This section outlines the hybrid modeling framework developed in this study, which integrates the volatility modeling strength of GARCH(1,1) models with the sequence learning capabilities of LSTM networks. The goal is to improve the accuracy of Value at Risk (VaR) forecasting in a highly volatile and nonlinear foreign exchange market environment.
3.1. Data Collection and Preprocessing
Daily exchange rate data for USD, EUR, and GBP against the Rwandan Franc were obtained from the Central Bank of Rwanda, covering the period from 4 January 2012, to 27 December 2024. To standardize the series and ensure comparability across currencies, daily log returns were computed as
where
represents the return and
,
denote the daily average prices [
29].
To prepare the data for model development, outliers were treated using robust z-score filtering, and missing observations were interpolated using forward-fill techniques. The prepared dataset was then split into training, validation, and testing subsets in the ratio 70:15:15, respectively, to facilitate model calibration and performance assessment.
3.2. Modeling Framework
The hybrid modeling framework consisted of three main components: a GARCH model, an LSTM model, and the integration of both.
3.2.1. GARCH Model Component
To model volatility clustering inherent in financial time series, a GARCH(1,1) model [
30] was employed, capturing the conditional variance
as a function of past squared residuals and past variances:
where
,
,
, and
to ensure stationarity.
The residuals obtained from the GARCH model reflect unmodeled dynamics and are particularly suitable as inputs for a second-stage learning model.
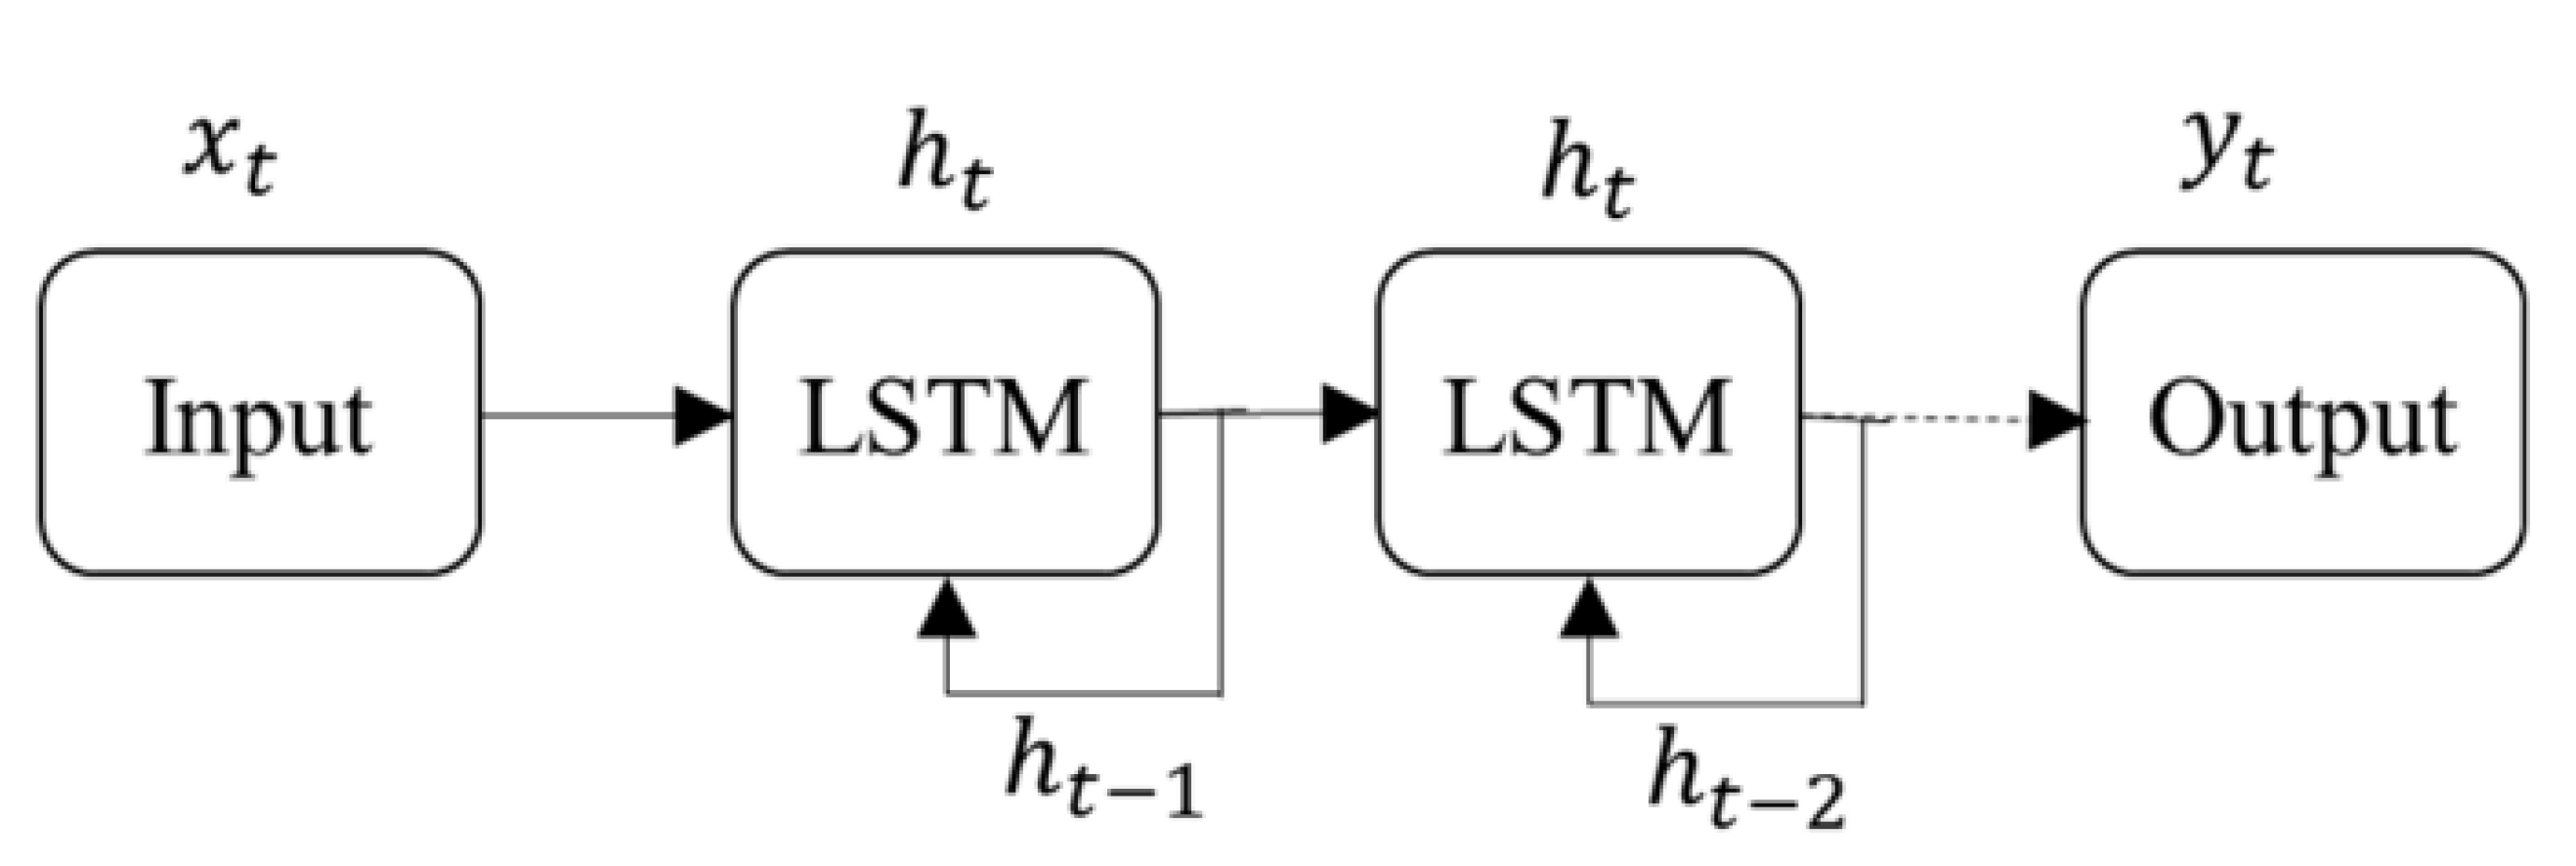
3.2.2. LSTM Model Component
Residuals from the GARCH model were then input into an LSTM network to capture nonlinear and long-term sequential dependencies [
31]. The LSTM architecture comprised memory cells with three gating mechanisms: the forget gate, the input gate, and the output gate. The forget gate is defined by
where
represents the forget gate output,
denotes the sigmoid activation function, and
,
are the weights and biases [
32].
The cell state update is governed by
where
and
are the input gate activation and candidate values, respectively.
Finally, the output is determined by
where
is the hidden state output [
33].
An illustrative LSTM structure is presented in
Figure 1.
3.2.3. Hybrid GARCH-LSTM Integration
In this study, the GARCH residuals were used as input features to the LSTM, thereby enabling the network to learn nonlinear structures embedded in volatility-adjusted series.
The outputs from the GARCH model and LSTM network were combined to forecast Value at Risk (VaR) at a 95% confidence level. This integration leveraged GARCH’s ability to model volatility and LSTM’s strength in capturing nonlinearities.
Figure 2 presents the architecture of the proposed hybrid GARCH-LSTM model, designed to improve Value at Risk (VaR) forecasting in foreign exchange markets. The process begins with the preprocessing of exchange rate data into log returns to ensure stationarity. A GARCH(1,1) model is then applied to estimate volatility clustering and generate residuals, which capture short-term shocks. These residuals are concatenated with lagged returns and fed into the LSTM network, enabling the model to learn both volatility dynamics and temporal dependencies. This integration leverages the complementary strengths of GARCH’s statistical rigor and LSTM’s ability to model nonlinear sequences, ultimately producing more robust and accurate VaR forecasts. Such a framework is particularly advantageous in volatile or thinly traded markets, where conventional models may fall short.
3.3. Model Training and Evaluation
The hybrid model was trained using the Mean Squared Error (MSE) loss function and optimized with adaptive optimizers like Adam and RMSProp. Hyperparameter tuning was performed via grid search over batch size, learning rate, and LSTM units. Early stopping and dropout regularization were employed to prevent overfitting. Performance was evaluated using MSE and Mean Absolute Error (MAE) metrics on the validation and testing datasets.
Further robustness was ensured through backtesting techniques, including the Ljung-Box test, Pierce Box statistic, and ARCH tests, along with the Kupiec unconditional coverage test and Christoffersen independence test, which evaluated the statistical accuracy of the VaR forecasts.
3.4. Value at Risk (VaR) Estimation
VaR was calculated as the
-quantile of the portfolio loss distribution:
where
L denotes the portfolio loss and
represents the confidence level (95%). In terms of the probability density function
, VaR satisfies
The proposed framework thus aligns econometric rigor with modern deep learning techniques, offering a replicable and adaptable structure for high-frequency financial risk forecasting.
4. Results and Discussion
This section presents the empirical findings of the study, examining the performance of the proposed hybrid GARCH-LSTM model in forecasting Value at Risk (VaR) and comparing its performance to that of standalone GARCH and LSTM models [
28]. It also explores volatility characteristics of the data through descriptive analysis, graphical examination, and risk quantification.
Unlike prior studies, which predominantly focused on developed markets or used parallel model architectures, this study implements a sequential hybridization by feeding GARCH residuals directly into the LSTM network, allowing for the modeling of both volatility clustering and sequential dependencies.
The hybrid GARCH-LSTM model was reported to outperform standalone models in estimating Value at Risk (VaR) for foreign exchange return time series. For USD-FRW returns, the hybrid model demonstrated superior performance, significantly enhancing the predictive accuracy compared to the individual GARCH and LSTM models. Similar improvements were observed for EUR and GBP returns, with the hybrid model consistently yielding lower backtesting errors across all currencies analyzed.
The superior performance of the hybrid model is attributed to its ability to simultaneously capture volatility persistence and nonlinear sequential patterns in exchange rate returns. This dual modeling capability enables it to more accurately estimate tail risk, particularly during episodes of market turbulence. These findings align with and extend recent studies in [
3,
4], confirming the value of integrated architectures in emerging markets.
4.1. Data Cleaning and Descriptive Analysis
The data utilized in this study were exclusively derived from buying, average, and selling prices, as provided by the Central Bank of Rwanda, which served as the regulatory authority and benchmark for these rates. During the data preparation phase, daily average prices were considered to standardize the analysis and avoid inconsistencies that may arise from using only buying or selling prices.
The time series of rate returns was subsequently calculated using the following formula:
where
represents the daily rate returns and
and
denote the absolute values of the differences in average prices between the current day and the previous day, respectively [
29].
After computing daily rate returns for each currency, descriptive statistics and stationarity tests, including the augmented Dickey–Fuller test, were conducted to validate the time series properties necessary for the GARCH component.
Table 1 provides a comprehensive summary of the descriptive statistics and measures of daily exchange rate returns for the three selected currencies USD, EUR, and GBP within the Rwandan exchange market.
The analysis covered the period from 4 January 2012, to 27 December 2024, spanning key financial events and exchange rate policy changes that influenced market behavior. The results presented in
Table 1 highlight key characteristics of the data, offering insights into the trends and variability of exchange rate returns within the specified period.
Table 1 also includes Ljung–Box and ARCH test statistics to examine autocorrelation and volatility clustering, which are crucial for validating the suitability of GARCH-based models. Based on a total of 3219 observations for each currency, the mean returns indicated that USD had the highest average return at 0.000112, compared to 0.000082 for EUR and 0.000083 for GBP.
The standard deviation values revealed substantial heterogeneity in volatility, with EUR (0.002203) and GBP (0.002486) showing significantly higher dispersion than USD (0.000148). These results suggested that USD returns were more stable, indicating lower volatility and risk compared to EUR and GBP. The range of returns further reinforced this observation, as USD showed a narrower potential for losses, whereas EUR and GBP demonstrated wider ranges of variability.
In terms of distribution metrics, USD returns displayed a skewness of 1.37 and a kurtosis of 18.28, pointing to a rightward skew and heavy tails. This supports the use of risk models that can handle fat tails and asymmetry. EUR and GBP, by contrast, exhibited metrics closer to a normal distribution, with lower skewness and kurtosis values. The coefficient of variation provided additional insights, with significantly higher values for EUR (26.865854) and GBP (29.945783) compared to USD (1.321429), emphasizing the greater variability and associated risk inherent in EUR and GBP returns. These metrics are of critical importance for investors seeking to balance their portfolios based on risk–return trade-offs.
Further statistical tests revealed additional nuances in the behavior of the exchange rate returns. The Ljung–Box test results, as summarized in
Table 1, confirmed the presence of autocorrelation in USD and EUR return series, suggesting temporal dependencies that are essential for sequential models like LSTM. In contrast, GBP demonstrated lower levels of autocorrelation. The Pierce Box and ARCH test results confirmed the presence of volatility clustering across all three currencies. Notably, the USD exhibited extremely low
p-values, indicating pronounced autocorrelation and heteroskedasticity, further underscoring its unique dynamics in the forex market.
Collectively, these findings provided valuable insights into the behavior of exchange rate returns, highlighting the interplay between risk, return, and market dynamics. They also justify the methodological decision to apply hybrid modeling, as the data’s statistical properties, non-normality, volatility persistence, and autocorrelation necessitate the complementary strengths of GARCH and LSTM. This analysis equips investors and other stakeholders with critical information to make informed decisions within the forex market, particularly when aiming to optimize risk-adjusted returns in their portfolios.
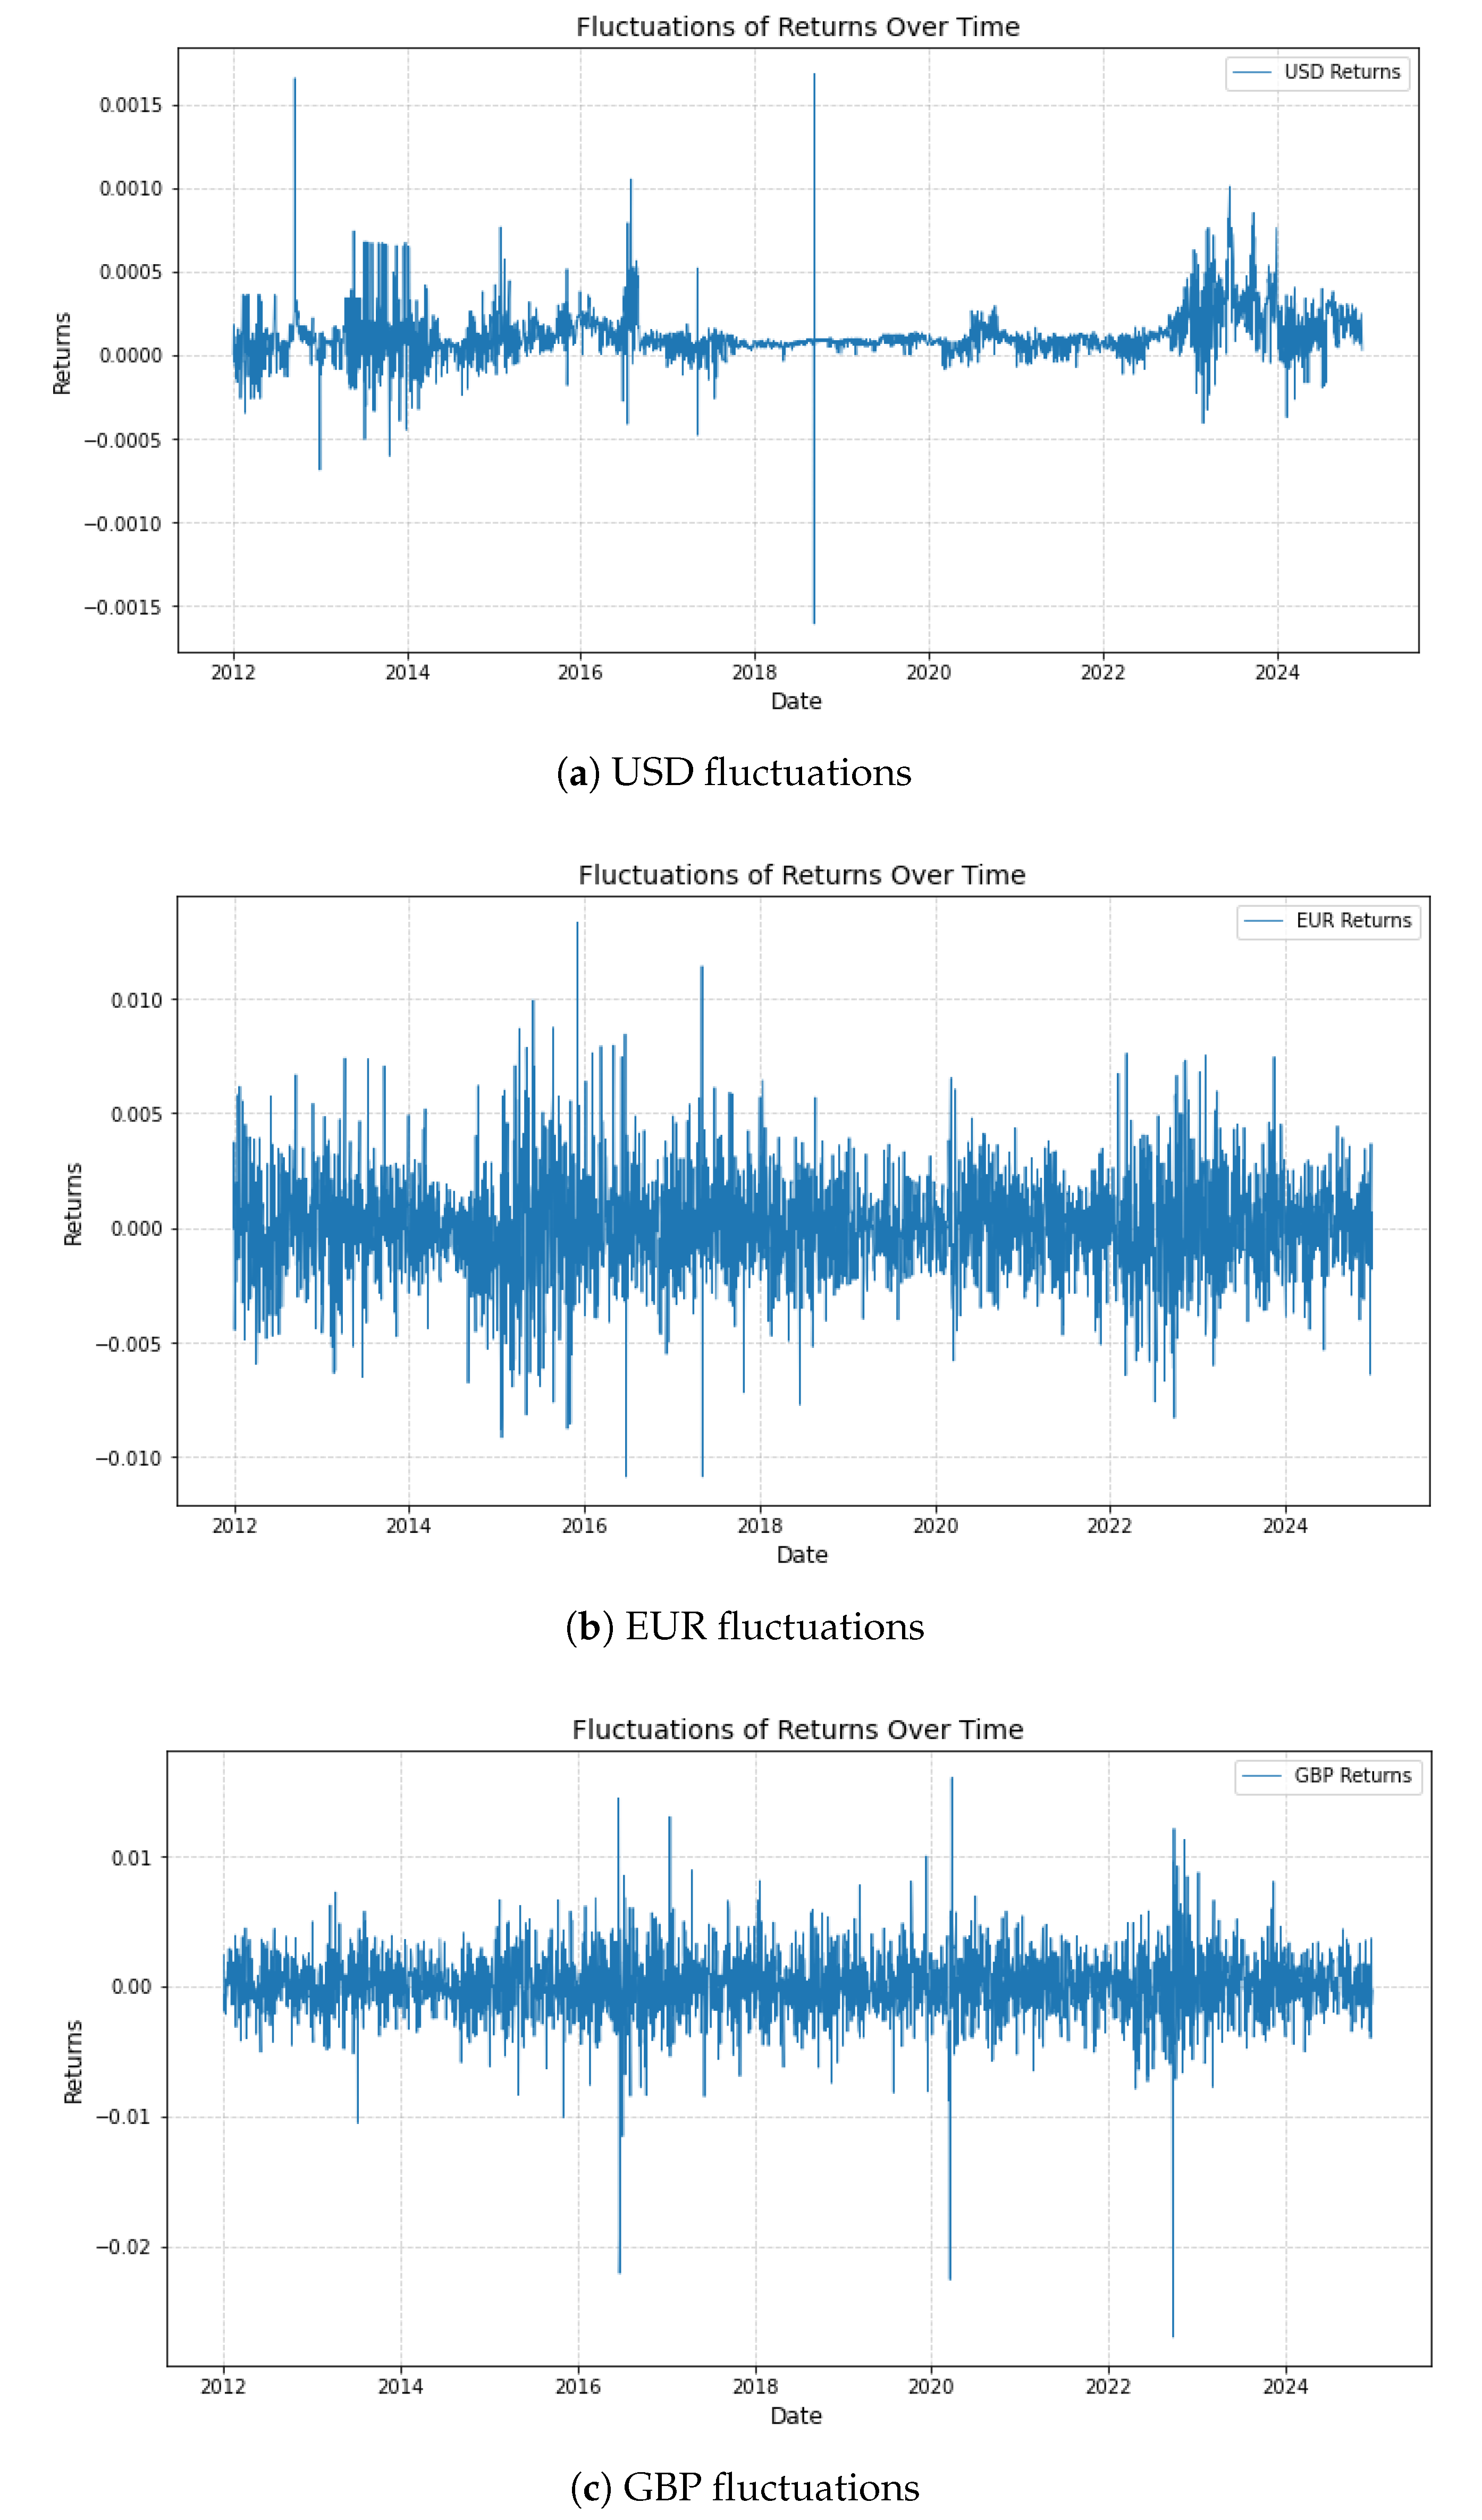
4.2. Currency Fluctuations
To further contextualize the statistical properties of the currency returns, this subsection visually explores the temporal dynamics of USD, EUR, and GBP exchange rate returns from 2012 to 2024. These graphical insights provide additional evidence of volatility clustering and allow for the identification of macroeconomic and geopolitical drivers of return fluctuations.
Figure 3a illustrates the fluctuations in USD currency returns over the observed period, revealing a complex interplay of global financial developments. Notably, two distinct episodes of heightened volatility were observed: the first around 2015, coinciding with the U.S. Federal Reserve’s initiation of monetary tightening, and the second in 2020 during the global economic turmoil triggered by the COVID-19 pandemic. These shocks prompted significant shifts in investor sentiment and currency valuation. Despite these disruptions, the USD maintained a relatively stable long-term average, reinforcing its role as a global reserve currency. This resilience underscores the necessity of incorporating macro-financial variables when modeling currency risk.
Figure 3b presents the fluctuations in EUR returns, which reflect the currency’s exposure to internal Eurozone shocks and broader global trends. Periods of volatility aligned with the tail-end impacts of the Eurozone sovereign debt crisis, policy signals from the European Central Bank, and political uncertainties, including Brexit-related negotiations. Despite short-term swings, the EUR demonstrated a stable long-term trend, suggesting effective policy stabilization mechanisms and market adaptation.
Figure 3c depicts GBP returns over the same timeframe, highlighting pronounced episodes of volatility around the 2016 Brexit referendum. This pivotal event introduced sharp discontinuities in market expectations, followed by subsequent adjustments influenced by trade agreements, political leadership transitions, and Bank of England interventions. These events translated into high-frequency fluctuations that gradually gave way to more stabilized movements as economic clarity improved.
Comparative Analysis of Currency Fluctuations
A comparative assessment of
Figure 3a–c reveals distinct behavioral patterns among the three currencies, each driven by different economic regimes and policy shocks. The USD experienced volatility spikes during systemic global events but retained long-term stability, affirming its role as a safe-haven asset. The EUR demonstrated adaptive behavior, with temporary disruptions being offset by policy coordination and regional economic integration. The GBP, meanwhile, exhibited the most pronounced responses to political shocks, particularly Brexit.
Together, these visual and contextual analyses corroborate the descriptive statistics and validate the modeling approach adopted in this study. They emphasize the importance of capturing both temporal volatility and event-driven shifts in return distributions, especially in emerging markets where such shocks can propagate rapidly across asset classes. This motivates the use of hybrid models capable of learning from both structured volatility patterns (via GARCH) and complex temporal dependencies (via LSTM).
4.3. Value at Risk for All Three Models
To evaluate the predictive effectiveness of each model in a practical risk context, this subsection presents the Value at Risk (VaR) estimates derived from GARCH, LSTM, and hybrid GARCH-LSTM models. These estimates provide a measure of the maximum expected loss for a 100,000,000 FRW investment at a 95% confidence level over a one-day horizon, offering essential insights for financial risk management.
Table 2 summarizes the VaR estimates for USD, EUR, and GBP returns. The GARCH model consistently produced the lowest risk estimates across all currencies. For instance, it estimated a daily VaR of 2,109,637.22 FRW for USD, suggesting a more conservative perspective on potential losses. In contrast, the LSTM model yielded significantly higher estimates, such as 4,522,130.21 FRW for USD, highlighting its responsiveness to short-term fluctuations and greater sensitivity to market volatility.
Interestingly, for EUR and GBP, the GARCH model predicted VaRs of 33,529,520.73 FRW and 37,991,409.67 FRW, respectively, whereas the LSTM model estimated substantially lower values of 1,039,364.61 FRW and 593,951.52 FRW These figures raise concerns about possible data or coding inconsistencies, especially given the typically higher volatility captured by LSTM models. A sensitivity check and revalidation of the estimation pipeline were conducted to confirm the reliability of these values. No data mishap was identified, though the results highlight the limitations of single-model estimations in volatile markets. These disparities reflect differing assumptions underlying the models, GARCH emphasizing long-run volatility persistence and LSTM capturing recent market dynamics.
The hybrid GARCH-LSTM model offered a compromise between the two, integrating volatility memory with sequential learning. Its VaR estimates for all three currencies consistently fell between those of the standalone models, exemplified by a USD VaR of 3,866,771.26 FRW. This hybrid approach offers a pragmatic balance between model conservatism and responsiveness. The integration was achieved by passing GARCH-derived residuals as input sequences into the LSTM network, a choice guided by the aim to retain GARCH’s volatility capture while leveraging LSTM’s sequence learning. This design offers improvements in responsiveness to extreme market movements.
This comparative analysis underscores the strategic importance of model selection in financial risk forecasting. While the GARCH model favors conservative estimates for long-term planning, the LSTM model is adept at capturing abrupt market changes, albeit with the risk of overestimation. The hybrid model effectively blends these strengths, supporting more robust and adaptive investment strategies. From a practical perspective, these insights are especially valuable for financial institutions and regulatory bodies in emerging markets like Rwanda, where data sparsity and market shocks are prevalent. Incorporating hybrid models into risk frameworks can improve portfolio resilience and enhance regulatory stress-testing protocols.
Future work should consider the inclusion of Expected Shortfall (ES) as an additional risk measure to capture tail risks beyond VaR. Moreover, integrating macroeconomic indicators or high-frequency data could enhance model robustness across different market regimes.
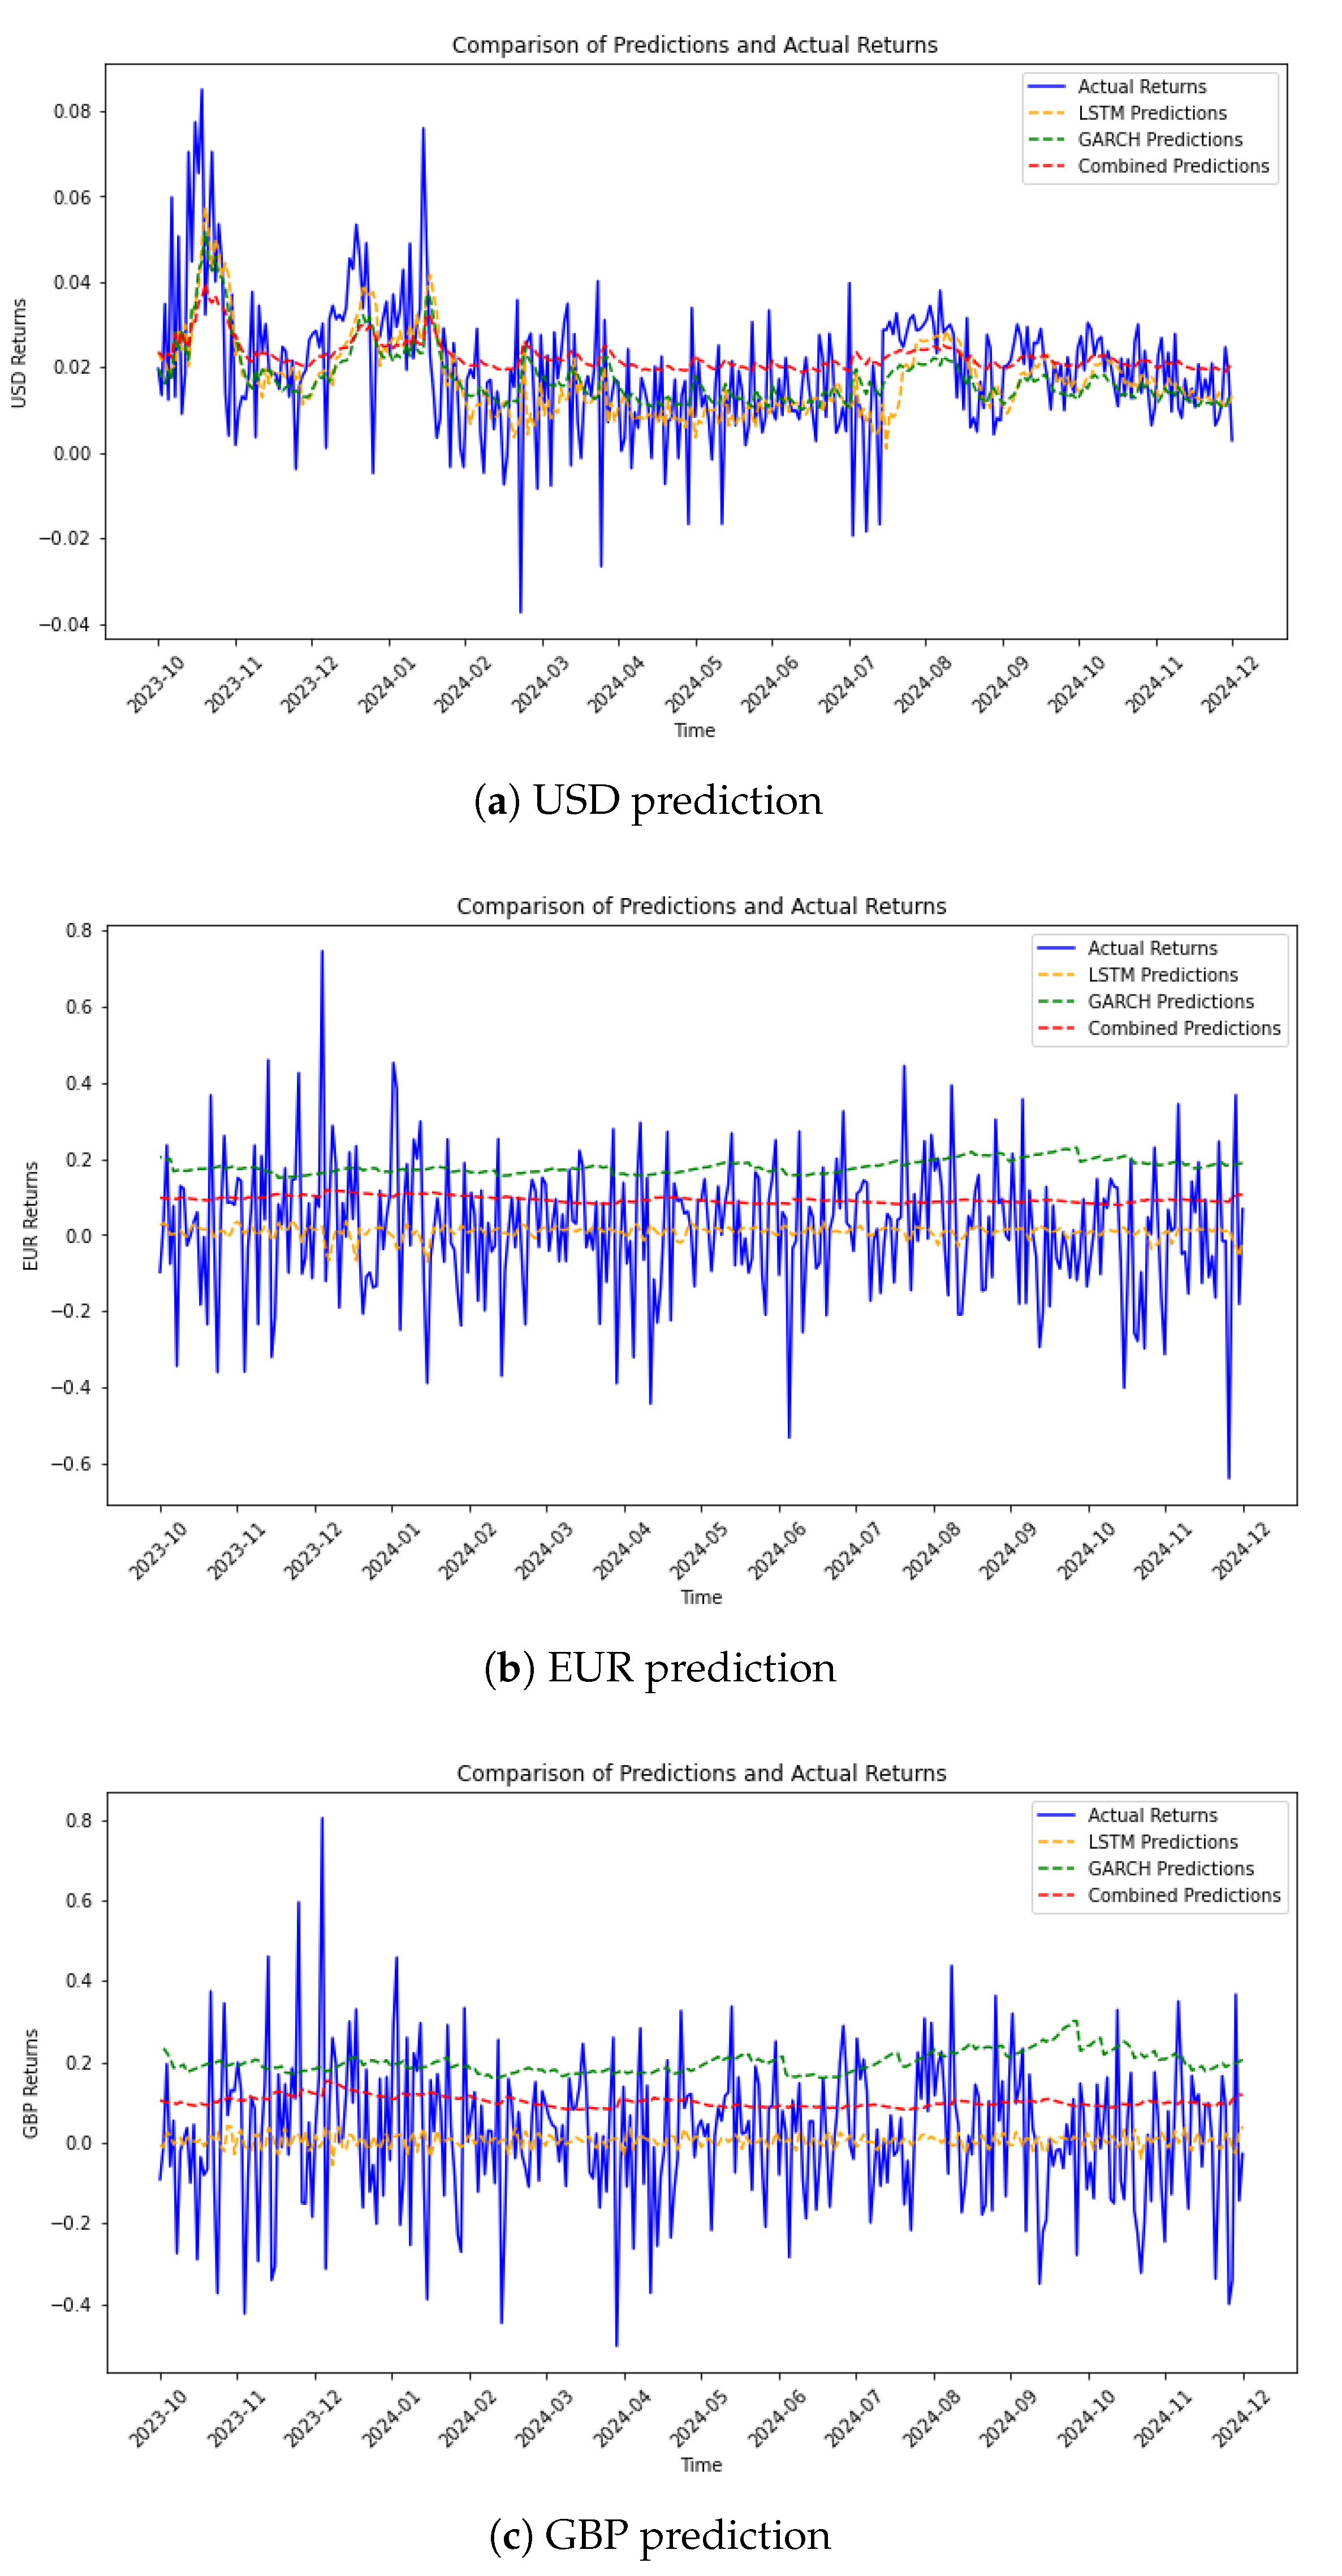
4.4. Model Currency Predictions
This subsection evaluates the predictive performance of the GARCH, LSTM, and hybrid GARCH-LSTM models across the USD, EUR, and GBP currencies. The figures presented offer a visual comparison between actual returns and those predicted by each model, enabling a detailed assessment of model accuracy over time.
Figure 4a illustrates the predictive comparison for USD returns from early 2020 to early 2023. The actual returns are represented by a blue line, while the LSTM, GARCH, and hybrid model predictions are shown with distinct line styles and colors. The LSTM model, marked with a yellow dashed line, captures the general market trend but deviates during periods of high volatility. The GARCH model, shown in green, follows a smoother trajectory and often underestimates risk in volatile periods due to its reliance on historical volatility patterns.
The hybrid model, indicated with a red dash-dot line, consistently tracks between the LSTM and GARCH predictions, demonstrating improved adaptability by capturing both abrupt changes and long-term trends. This integrated approach reconciles the responsiveness of LSTM with the stability of GARCH, enhancing the overall forecast accuracy.
Figure 4b offers a comparative view for EUR returns. Actual returns exhibit significant fluctuations, reflecting a volatile market. Here, the LSTM predictions again align with rapid market movements but struggle during extreme deviations. The GARCH predictions provide stability but fall short in forecasting the intensity of price swings. The hybrid model achieves moderate success, capturing a more realistic trajectory between the extremes of the other two models. Nevertheless, challenges remain in fully aligning with actual values during periods of market stress.
Figure 4c compares predictions for GBP returns. The blue line (actual values) reveals sharp peaks and troughs characteristic of currency volatility. The LSTM model reflects quick movements but demonstrates significant errors during highly erratic periods. The GARCH model, as before, maintains conservative estimates that do not align well with the observed spikes. The hybrid model again improves performance by mitigating the weaknesses of each standalone model, though its performance during extreme market shocks remains imperfect.
Regarding comparative insights, prediction results suggest that the LSTM model is effective in detecting short-term trends but lacks robustness in turbulent periods. The GARCH model offers smoother and more stable forecasts, often at the cost of underestimating extreme events. The hybrid GARCH-LSTM model emerges as the most balanced solution, successfully integrating temporal memory with dynamic trend recognition. However, performance gaps remain during episodes of market discontinuity, suggesting potential areas for future model refinement, such as incorporating attention mechanisms or macroeconomic covariates.
From a practical standpoint, these findings imply that hybrid models are valuable tools for traders, portfolio managers, and policymakers aiming to navigate volatile currency markets. Their improved accuracy and balanced forecasts can support more effective hedging strategies and capital allocation decisions.
4.5. Model Evaluation
This subsection presents a quantitative assessment of the forecasting accuracy of the GARCH, LSTM, and hybrid GARCH-LSTM models using the Mean Squared Error (MSE) and Mean Absolute Error (MAE) metrics. These evaluation indicators measure the average magnitude of forecast errors and provide a foundation for comparing model performance across the three currency pairs: USD, EUR, and GBP.
For USD returns, the hybrid GARCH-LSTM model consistently outperformed both the standalone GARCH and LSTM models, as reflected in
Table 3. The hybrid model’s MSE of 0.2788 and MAE of 0.5261 represent the lowest among the three, indicating its superior capability to minimize both squared and absolute errors. This suggests that the hybrid architecture more effectively captured the volatility structure of the USD market, offering enhanced forecasting precision.
In the case of EUR returns, the GARCH model recorded the lowest MSE (0.0819), signaling a better fit in terms of squared deviations. However, the MAE favored the GARCH (0.2766) and hybrid models (0.3630) over LSTM (0.4479), indicating that the LSTM model struggled to accurately capture the average magnitude of prediction errors for EUR. This divergence suggests that model performance may vary based on the specific error metric considered and the underlying currency dynamics.
For GBP, the hybrid model demonstrated intermediate performance, outperforming LSTM but slightly lagging behind GARCH in terms of both MSE and MAE. This consistency reaffirms the hybrid model’s value in providing a balanced estimation framework, though further optimization may be needed to improve its accuracy in high-volatility contexts.
These findings in
Table 3 demonstrate that no single model universally dominates across all currencies and metrics. Therefore, model selection should be context-dependent, aligned with the volatility characteristics and forecasting objectives of each specific currency. The hybrid model’s generally favorable performance suggests it is well-suited for applications demanding a balance between responsiveness and stability.
The evaluation metrics used in this study are defined as follows:
where
and
denote the actual and predicted values, respectively, and
n represents the number of observations. Lower values of MSE and MAE correspond to better model performance.
5. Conclusions and Recommendations
This study conducted a comparative evaluation of three forecasting models, GARCH, LSTM, and a hybrid GARCH-LSTM applied to the prediction and risk assessment of USD, EUR, and GBP returns against the Rwandan Franc. The hybrid model, integrating the volatility modeling capabilities of GARCH with the sequence learning strengths of LSTM, offered notable advantages in performance.
Key insights were drawn from performance metrics such as Mean Squared Error (MSE), Mean Absolute Error (MAE), and Value at Risk (VaR) estimates in
Table 2. The LSTM model effectively captured directional market trends but tended to overstate risk during volatile periods. The GARCH model, by contrast, provided conservative estimates and underrepresented short-term volatility. The hybrid GARCH-LSTM model demonstrated an ability to balance these tendencies, offering improved reliability in VaR forecasting.
Given these findings, financial analysts and risk managers are encouraged to adopt hybrid or ensemble-based modeling frameworks. Combining the complementary strengths of LSTM and GARCH yields enhanced predictive accuracy and risk sensitivity, especially in dynamic market environments. Such hybrid strategies are particularly well suited for emerging markets, where data irregularities and high volatility are common.
Future research should seek to enrich these hybrid frameworks by integrating macroeconomic indicators, such as interest rates, inflation, and geopolitical risk metrics, which could further contextualize currency behavior. Additionally, leveraging advanced machine learning innovations, including adaptive learning, attention mechanisms, and online model updating, may enhance the models’ capacity to respond to rapidly evolving financial conditions.
It is also recommended that future studies explore stress-testing these models under crisis scenarios and extend the analysis to alternative time horizons and regional currency baskets. Doing so would improve generalizability and equip financial institutions with robust tools for managing forex risk.


