Abstract
This paper studies the performance of ETFs that invest in companies involved in artificial intelligence (AI) technologies, such as firms focused on AI research, development, and applications. Using daily data from 15 American ETFs focused on AI-related companies over the period from 1 February 2019 to 29 December 2023, this paper investigates their investment style characteristics through a returns-based style analysis (RBSA). This study offers detailed insights into the degree of active versus passive management and highlights strategic patterns that may guide investment decisions in AI-themed financial products. We highlight that asset selection drives fund performances more than active management strategies, offering practical insights for investors and policymakers.
JEL Classification:
G20; G23
1. Introduction
Artificial intelligence (AI) has revolutionized industries worldwide, including finance. As AI continues to shape the future of technology and innovation, investors increasingly seek exposure to companies leading in this space. One way to achieve this is through exchange-traded funds (ETFs) that focus on firms developing or utilizing AI technologies. These AI-themed ETFs provide access to a dynamic and rapidly growing sector while offering the traditional benefits of portfolio diversification.
According to ETFdb.com, AI ETFs are typically defined by one or more of the following criteria: (1) they invest in companies directly involved in AI research and development; (2) they allocate a significant portion of their holdings—typically at least 25% of the fund’s holdings are in AI-related companies, according to thematic classification thresholds used by ETF providers such as Global X and iShares (BlackRock, 2023); or (3) they employ AI methodologies in their own investment decision-making. However, the vast majority of ETFs included in this study fall into the first two categories—those that invest in AI-related companies, rather than those that use AI to manage the fund itself.
Despite growing investor interest, research on the performance characteristics of AI-themed ETFs remains limited. For instance, Bonaparte [1] developed a valuation model for AI-related stocks and ETFs; Chen and Ren [2] studied the performance of ETFs that implement AI in their investment process; and Wu and Chen [3] found that ETFs branded as “AI” tend to exhibit positive abnormal returns. Yet, a significant gap persists in understanding how AI-focused ETFs—those investing in AI companies—are constructed, how their underlying strategies compare to traditional investment styles, and how they perform over time across different market conditions
This paper seeks to address these gaps by focusing on ETFs that provide exposure to the AI sector through their holdings. Specifically, we investigate whether these funds exhibit unique or consistent investment styles compared to traditional benchmarks and whether such styles contribute to performance.
Our primary research hypotheses are as follows:
Hypothesis 1.
AI-focused ETFs follow a heterogeneous investment approach.
Hypothesis 2.
AI-focused ETFs perform better than their investment style benchmarks.
The investment styles of these ETFs reflect decisions made by fund managers as they respond to trends within the evolving AI sector. Some may favor growth-oriented firms, while others might tilt toward value or momentum strategies. Analyzing whether these approaches differ meaningfully—or converge in similar styles—offers insights into both the thematic construction of these funds and their performance drivers.
This paper seeks to address the limited understanding of AI-themed ETFs by examining those that provide exposure to AI through their underlying holdings, rather than those that use AI as a management tool. We assume that AI-focused ETFs do not follow a single, uniform strategy and that their performance is influenced by both thematic exposure and underlying style allocations. Based on these assumptions, we test two hypotheses: (1) AI-focused ETFs adopt heterogeneous investment styles and (2) these ETFs outperform traditional style benchmarks.
To evaluate these hypotheses, we analyze fifteen U.S.-listed AI-themed ETFs over the period from 1 February 2019 to 29 December 2023. We decompose returns into exposures to traditional style factors—specifically, value vs. growth (based on book-to-market), profitability (quality), and investment aggressiveness—using benchmark portfolios from the Kenneth French Data Library.
This study contributes to the growing literature on thematic investing by providing a systematic analysis of the construction and performance of AI-themed ETFs. Our findings indicate that these funds tend to cluster around similar investment styles, exhibit elevated volatility, and generate returns primarily through factor exposures rather than differentiated active management. These insights help investors and researchers better understand the risks, rewards, and structure of AI-focused ETF strategies
2. Literature Review
The global expansion of exchange-traded funds (ETFs) represents one of the most significant developments in modern financial markets. As pooled investment vehicles that track indices, sectors, or themes, ETFs combine the diversification benefits of mutual funds with the liquidity and real-time pricing of individual stocks. Their structural efficiency and investor accessibility have underpinned their rapid growth, with global assets under management exceeding USD 10 trillion as of late 2023 (Statista, 2024) [4]. This exponential increase highlights the investor interest not only in cost-effective beta exposure but also in more targeted thematic investment strategies.
ETFs can be broadly classified by asset class—such as domestic equity, international equity, and fixed income—and further delineated by investment strategy. These strategies include broad-based indices, sector-specific exposure, and thematic mandates. Thematic ETFs, in particular, seek to capture macro-level trends or disruptive innovations, such as artificial intelligence (AI), by investing in companies associated with those themes irrespective of traditional sector boundaries.
While the structure and utility of ETFs are well documented, thematic ETFs—especially those focused on AI—remain relatively underexamined in the scholarly literature. Importantly, there exists a critical distinction between ETFs that invest in AI-related companies and those that utilize AI in portfolio management. Much of the existing literature, such as Chen and Ren [2], concentrates on the latter, exploring the integration of AI algorithms into investment processes. This body of work sheds light on how AI is transforming fund operations, including asset allocation and optimization. However, these studies do not address the characteristics or performance of ETFs that offer AI exposure as an investment theme. The present research is thus situated within this underexplored category, focusing on the investment behavior of ETFs marketed around the theme of AI innovation.
Artificial intelligence has had a profound impact on various aspects of financial markets. AI-based tools have been applied to asset pricing, portfolio optimization, and algorithmic trading. For instance, AI can improve the precision of return and covariance estimations and solve complex portfolio construction problems involving constraints, as demonstrated through evolutionary algorithms, neural networks, and machine learning models [5,6]. Moreover, algorithmic trading systems driven by AI are increasingly capable of executing real-time strategies based on technical and fundamental signals [7]. These technological advancements invite further inquiry into the extent to which AI-oriented financial products, including thematic ETFs, embody innovative investment approaches or merely replicate conventional styles.
The evaluation of fund performances and investment styles has long been a focus of financial research. Foundational work by Sharpe [8] introduced the Capital Asset Pricing Model (CAPM), which decomposed fund returns into systematic and idiosyncratic components. This was extended by Fama and French [9,10] who introduced value and size factors to better explain cross-sectional variations in asset returns. While these models remain foundational, their relevance to thematically constructed portfolios warrants critical examination. The applicability of traditional style analysis frameworks to thematic ETFs, which often feature concentrated and non-diversified holdings, is not straightforward and requires empirical validation.
In parallel, research on momentum strategies—such as the work of Jegadeesh and Titman [11]—has challenged the efficient market hypothesis, revealing that past winners tend to continue outperforming in the short term. This has implications for thematic ETFs, particularly those in fast-evolving sectors like AI, where momentum effects may drive investor flows and performance patterns. Further complicating the analysis is the phenomenon of style drift, where a fund’s actual exposures deviate from its stated investment objectives. Studies by Barberis and Shleifer [12] and Brown and Harlow [13] illustrate that investors often classify assets by shared characteristics, but these classifications may shift over time due to market dynamics or manager discretion.
Several empirical studies have attempted to bridge the gap between stated and actual investment styles. Cremers and Petajisto [14], for example, introduced the concept of “Active Share” to measure the degree of deviation between a fund’s holdings and its benchmark. They found that funds with a higher Active Share—indicative of more active management—tend to outperform. However, whether this finding holds true for thematic ETFs, particularly those focusing on AI, remains largely unexplored. The degree to which these funds deliver an active exposure versus the passive replication of high-growth technology stocks is not well established.
The recent literature has extended the style analysis across asset classes and geographies. Papadamou and Siriopoulos [15] examined U.S. mutual funds with European equity mandates, finding that a blended growth–value approach outperformed other strategies. Similarly, Patel et al. [16] documented a significant style drift among Indian fixed-income funds, suggesting that deviations from declared mandates are not confined to equity markets. Chowdhury et al. [17] observed changes in the market capitalization exposure among Islamic equity funds, contingent on geographic allocation. These studies underscore the importance of scrutinizing the alignment between the fund strategy and actual behavior, a concern especially pertinent to thematic ETFs.
Despite these contributions, research directly addressing AI-themed ETFs remains sparse. Existing studies tend to focus either on the performance of AI-driven firms [1] or on ETFs employing AI as a management tool [2]. A limited number of recent works have begun to examine this niche. Trabelsi Karoui et al. [18] conducted a performance attribution analysis of top AI-related stocks, comparing them to IT and robotics indices. While they found evidence of outperformance, they also highlighted heterogeneous factor exposures among thematic instruments. Duppati et al. [19] explored the liquidity risk in AI ETFs, identifying its influence on return profiles. However, these studies stop short of a comprehensive analysis of the style consistency and active management claims within AI ETFs.
This paucity of critical, comparative work reveals a meaningful gap. While AI ETFs are often marketed as vehicles for thematic and potentially active exposure, there is little empirical evidence assessing the degree to which these claims are substantiated. In particular, it remains unclear whether such funds exhibit consistent investment styles, deviate significantly from standard benchmarks, or demonstrate performance patterns indicative of active management.
Accordingly, the present study seeks to address this gap by applying established frameworks from Fama and French [9], Cremers and Petajisto [14], and related works on performance attribution and style analysis. Focusing on U.S.-listed AI ETFs, this research evaluates whether these funds maintain stable style characteristics and the extent to which these styles correspond to differentiated performance outcomes. In doing so, this study contributes to both the literature on ETF behavior and the broader discourse on the intersection of finance and emerging technologies.
3. Data and Methodology
3.1. Data
This study utilizes daily return data for 15 U.S.-listed exchange-traded funds (ETFs) with an exposure to the artificial intelligence (AI) sector. The sample period spans from 2 January 2019 to 29 December 2023. The data were obtained from Yahoo Finance, a widely used source for historical price series. The data were cross-validated against Morningstar and fund provider websites for consistency. Although limitations exist in intraday or holdings-level data, the daily NAV-based returns used in this study are reliable for the RBSA. The selection was based on three criteria: (1) the ETF name and prospectus must explicitly reference AI, robotics, or exponential technologies; (2) thematic classification by Morningstar or ETFDB must confirm an AI exposure ≥ 25% of the AUM; and (3) the fund must have ≥3 years of available daily return data as of December 2023. This approach ensures thematic relevance and statistical robustness. The period from January 2020 to January 2024 was chosen to cover the phase of the increased investment in artificial intelligence. Before 2020, there are no data available for all ETFs. The aim of the sample selection is to provide a representative depiction of the AI-themed ETF category with relevant investment significance. The selected ETFs invest in firms involved in both the development and implementation of AI technologies. This diverse sample allows us to capture a variety of investment styles, niches, and performance patterns within the AI investment theme, across a wide range of market environments.
The sample period includes major market events, most notably the COVID-19 pandemic and the subsequent recovery period. These events introduced heightened volatility, sectoral rotations, and changes in investor behavior—all of which may have influenced the performance of AI-themed ETFs. While we do not formally divide the sample into sub-periods, our use of daily return data and style factor attribution allows us to capture both short-term market shocks and longer-term style trends. These considerations are reflected in our interpretation of the results, particularly with respect to volatility and performance attribution.
We use benchmark portfolios constructed from the Kenneth French Data Library to capture exposures to traditional style factors. Specifically, we rely on three sets of six portfolios each, formed on the following: (1) size and book-to-market (value–growth); (2) size and profitability (quality); and (3) size and investment aggressiveness. Fund returns are regressed on these benchmark returns to estimate style loadings and isolate unexplained performance components.
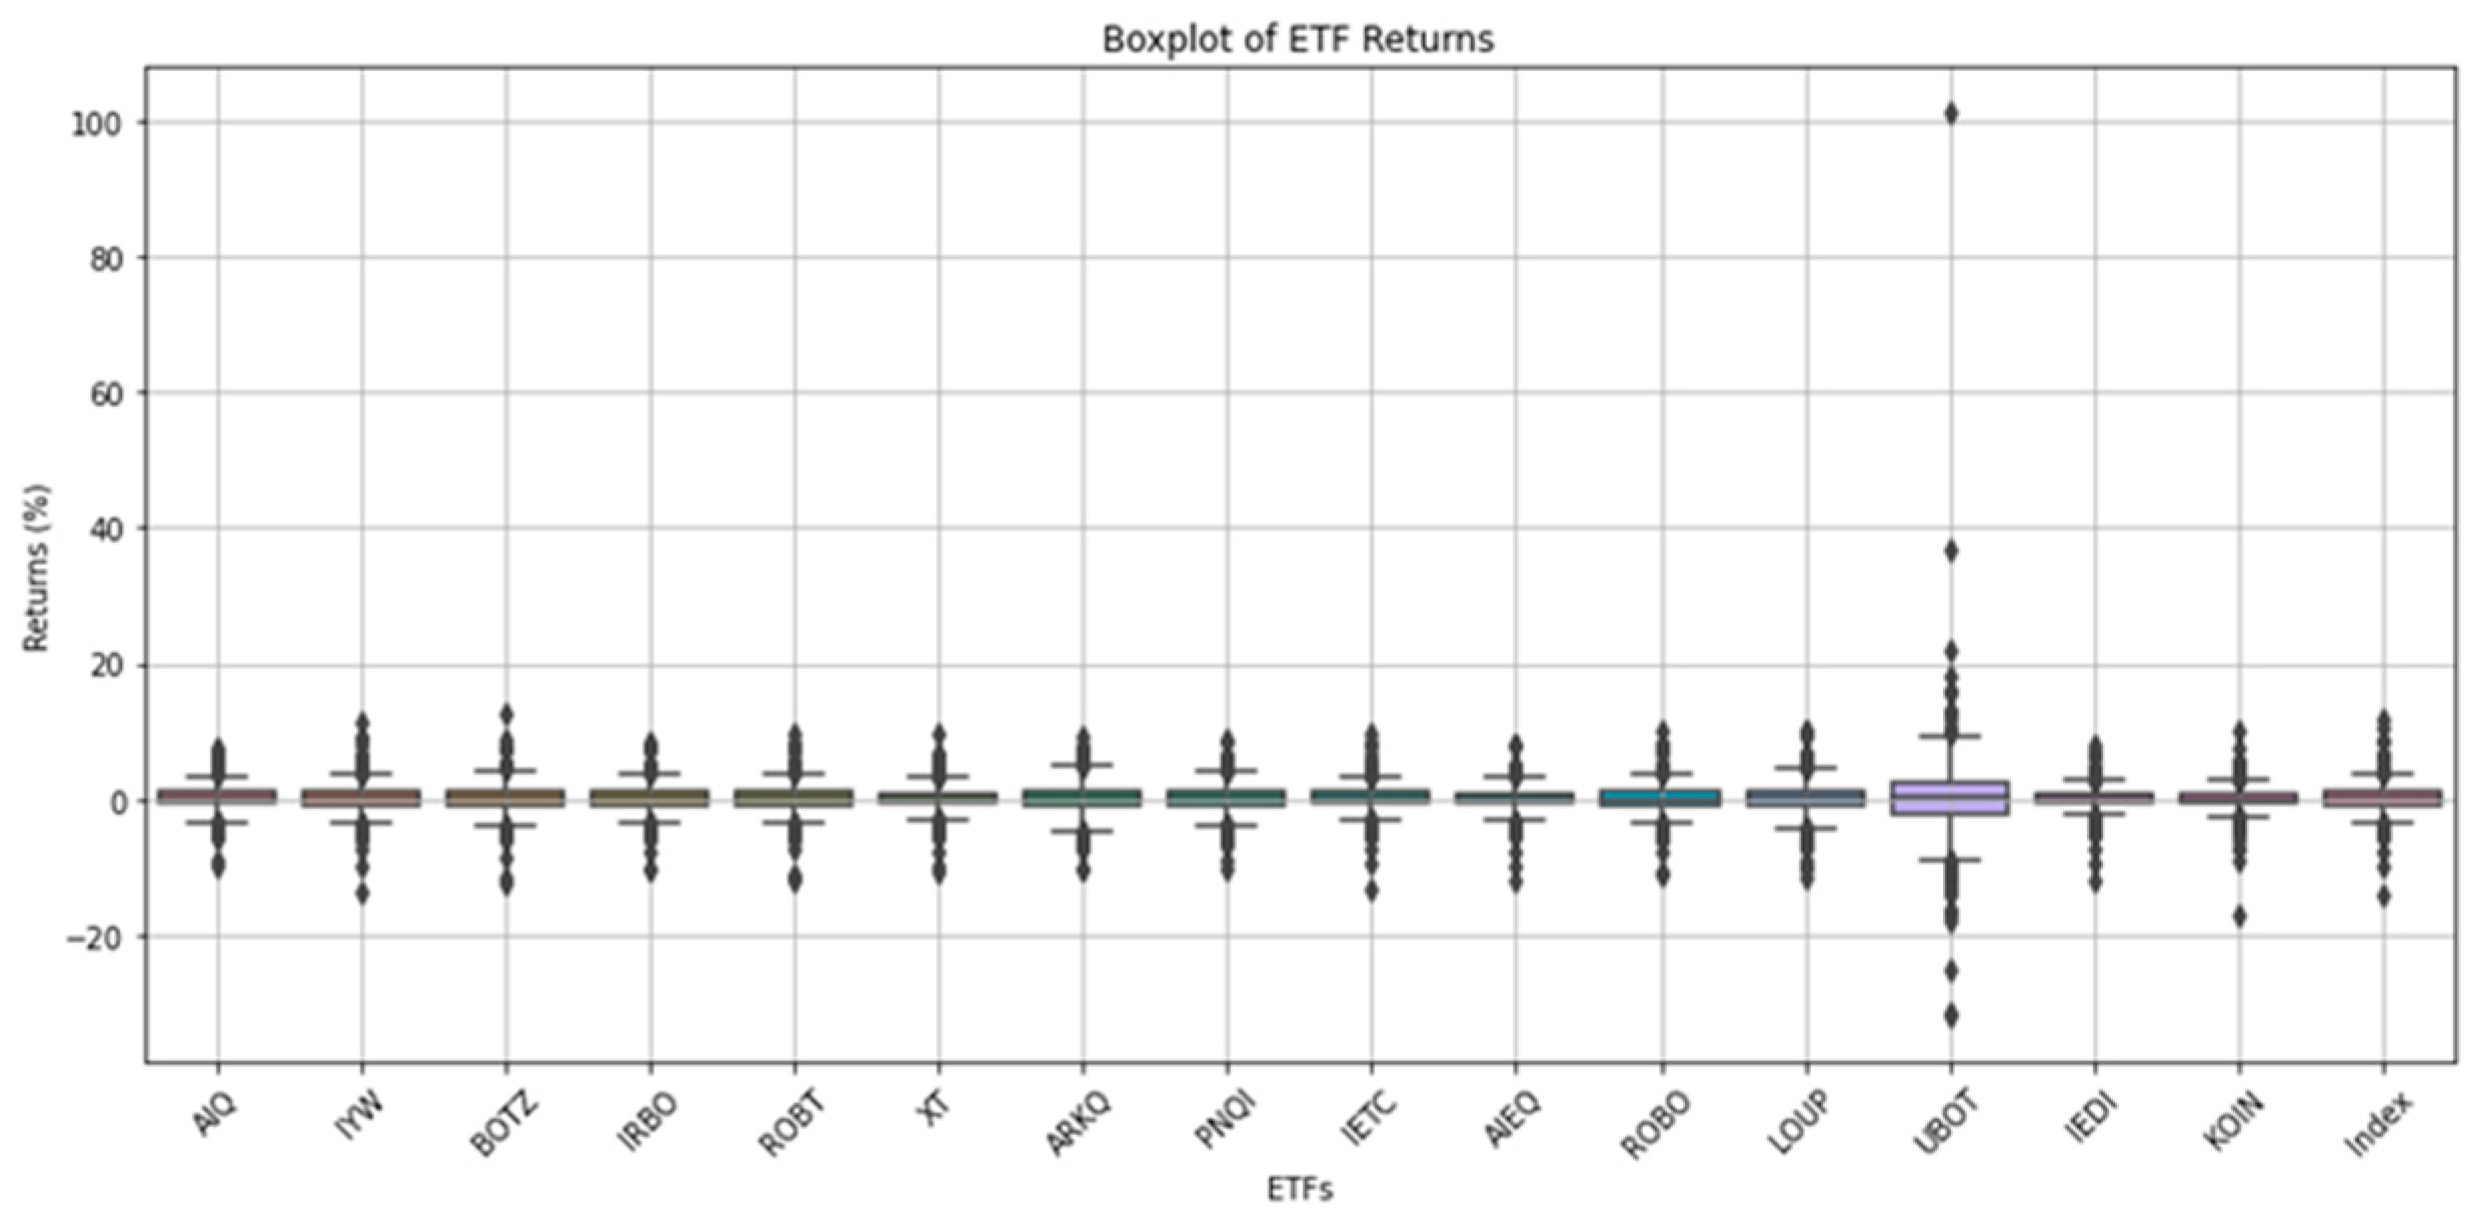
To provide an initial overview of the performance dispersion, Figure 1 presents a box plot of daily returns for the 15 AI-themed ETFs in the sample. The plot summarizes the return distribution via interquartile ranges (IQRs), medians, and outliers, offering a compact visualization of the volatility and return asymmetry across the sample.
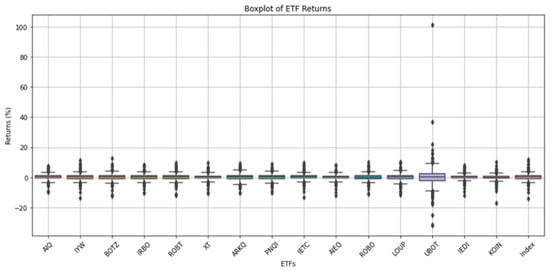
Figure 1.
I Box plot of ETF returns.
At first glance, the return distributions for most ETFs appear relatively similar in scale and symmetry, suggesting comparable levels of day-to-day volatility across the majority of funds. This apparent uniformity may reflect a shared exposure to large-cap U.S. technology stocks—a common thread among AI-themed ETFs—resulting in return behavior that closely tracks broader tech sector trends.
However, UBOT emerges as a clear outlier. It displays both a wider interquartile range and a higher incidence of extreme outliers, pointing to an elevated return volatility. This is consistent with its leveraged structure and narrower thematic focus on robotics automation, which amplifies both upside and downside movements. Such characteristics render it fundamentally different from the rest of the sample, raising questions about the degree to which it should be analyzed alongside more conventionally structured funds.
The lack of a substantial variation among most other ETFs in Figure 1 also highlights a key limitation in relying solely on return-based visualizations: thematic ETFs may diverge more meaningfully in terms of their factor exposures, holdings composition, and style persistence than in raw return distributions. As such, Figure 1 reinforces the need for a deeper factor-based style analysis and performance attribution—particularly to assess whether thematic branding masks passive behavior or style drifts.
Table 1 provides an overview of the 15 AI-focused ETFs in the sample. It includes key characteristics such as the ticker, inception date, regional focus, expense ratio, thematic niche, index tracked, investment strategy, assets under management (AUM), and listing exchange. The ETFs primarily invest in developed markets, with a focus on growth and technology equities. Investment strategies span from passive (“Vanilla”) approaches to more complex “Active” and “Multi-factor” strategies.

Table 1.
Sample description of AI-ETFs.
Expense ratios range from 0.18% (IETC) to 1.35% (UBOT), reflecting variations in cost structures and management styles. The AUM vary considerably—from over USD 15 billion for IYW to under USD 20 million for smaller, niche ETFs, like KOIN and IEDI. The presence of well-known fund sponsors, such as iShares, Global X, and ARK, and listings on major exchanges (NYSE and NASDAQ) underscore the accessibility and institutional backing of these funds.
Table 2 summarizes the performance statistics of the ETFs and includes the Dow Jones U.S. Technology Index as a benchmark. UBOT shows the highest average annual return (73.86%) and volatility (80.23%), reflecting a high-risk/high-reward profile. IYW and the benchmark index report more moderate yet robust returns (37.80% and 38.08%, respectively) with a lower volatility (around 27%).
Table 2.
Statistics of the ETF returns.
Cumulative returns indicate the Dow Jones Index led with 212%, followed closely by IYW (206%) and UBOT (190%). On the downside, KOIN generated the lowest cumulative return (41%). Maximum drawdowns vary widely, with UBOT (−101%) and KOIN (−108%) showing a significant downside risk, while IYW and the Index posted more moderate drawdowns (−79%).
Kurtosis measures also reveal heavy tails in return distributions, particularly for UBOT (119.48), indicating the presence of extreme returns. Most other ETFs exhibited kurtosis closer to normal levels, with AIQ (3.09) and ARKQ (2.02) aligning more closely with Gaussian assumptions. Some ETFs display high kurtosis, indicating the presence of fat tails and extreme returns. This has implications for portfolio risks, as higher kurtosis increases the probability of large losses. Investors should account for these characteristics when assessing the suitability of thematic ETFs for strategic allocations.
These performance characteristics suggest that while some AI ETFs, like UBOT, offer a substantial upside potential, they are also subject to high levels of volatility and downside risk. In contrast, ETFs like IYW provide a more balanced exposure to the AI theme with a relatively stable performance.
3.2. Methodology
To evaluate the performance of each ETF over time, we employ a 12-month rolling mean and rolling standard deviation of daily returns. These measures help smooth short-term fluctuations and reveal long-term trends in return and risk dynamics.
The 12-month rolling mean for day t is calculated as follows:
where n is the window size (12 months), and Ri represents the return on day i. This calculation was performed iteratively, advancing one day at a time to produce a series of rolling mean values.
This study also employs a 12-month rolling standard deviation to assess the volatility of selected ETFs. The rolling standard deviation serves to measure the dispersion of price fluctuations over time, providing insights into the stability and risk associated with the ETFs. The methodology is outlined as follows:
where is the window size (12 months), represents the return on day , and is the mean return over the same period. This calculation was performed iteratively, advancing one day at a time to produce a series of rolling standard deviation values. The rolling mean and standard deviation values were analyzed to assess their implications for ETF volatility and risk management. This analysis contributes to the broader discussion on investment strategies and market behavior, allowing for a more nuanced understanding of the ETFs’ risk profiles.
To further assess the composition of ETF returns, we conduct a returns-based style analysis following Sharpe [20]. The RBSA model, based on Sharpe (1992) [20], decomposes ETF returns into weighted exposures to style indices. However, it assumes linearity and may not fully capture nonlinear or time-varying exposures. The model decomposes ETF returns into exposures to systematic factors (styles) and idiosyncratic components (selection skill), subject to full investment and non-negativity constraints:
where R is a vector of T observations of ETF returns, F is a matrix of T observations for K style factor returns, is a vector of K style factor betas, and 1 is a vector of units and . The term can be characterized as the return attributable to the style and the residual component of the return due to selection. The model imposes full investment (1′β = 1) and non-negativity (β ≥ 0) constraints to ensure economic interpretability.
We use three sets of style factors, sourced from the Kenneth French Data Library:
- Six portfolios formed on size and book-to-market
- Six portfolios formed on size and operating profitability
- Six portfolios formed on size and investment
The model allows us to interpret the ETF performance in terms of passive style exposures (captured by ) versus active management or selection skills (captured by the residual ).
Despite its practical appeal, the RBSA framework rests on key assumptions that must be explicitly acknowledged:
- Linearity:
The model assumes a linear and static relationship between ETF returns and style factors. This may not adequately capture nonlinear exposures resulting from options, leverage, or complex strategies employed by some actively managed ETFs. Such nonlinear dynamics can lead to the misattribution of returns, particularly during periods of heightened volatility.
- 2.
- Time Invariance of Exposures:
Although we estimate rolling regressions to approximate time-varying betas, the RBSA model does not intrinsically account for structural breaks, shifts in investment strategies, or adaptive rebalancing by fund managers. Hence, any time variation captured is smoothed over the selected window length, potentially masking abrupt changes in factor sensitivity.
- 3.
- Residual Distribution:
The residual component U is assumed to be normally distributed with a constant variance. In practice, return distributions may exhibit fat tails, skewness, or conditional heteroskedasticity—especially during periods of market stress. These violations can impair the statistical inference and misestimate the magnitude of selection effects.
- 4.
- Omitted Factor Risk:
The choice of style factors is inevitably limited. While our factor sets are standard and comprehensive for equity style attributions, they may omit emerging or thematic exposures (e.g., AI-specific innovation indices and ESG scores) that drive returns in specialized ETFs.
Despite these limitations, the RBSA remains a widely accepted and tractable method for style decomposition. When interpreted with caution and contextualized within rolling return and volatility diagnostics, it offers meaningful insight into the extent to which the ETF performance is driven by passive exposure versus active selection.
4. Style Analysis Results and Discussion
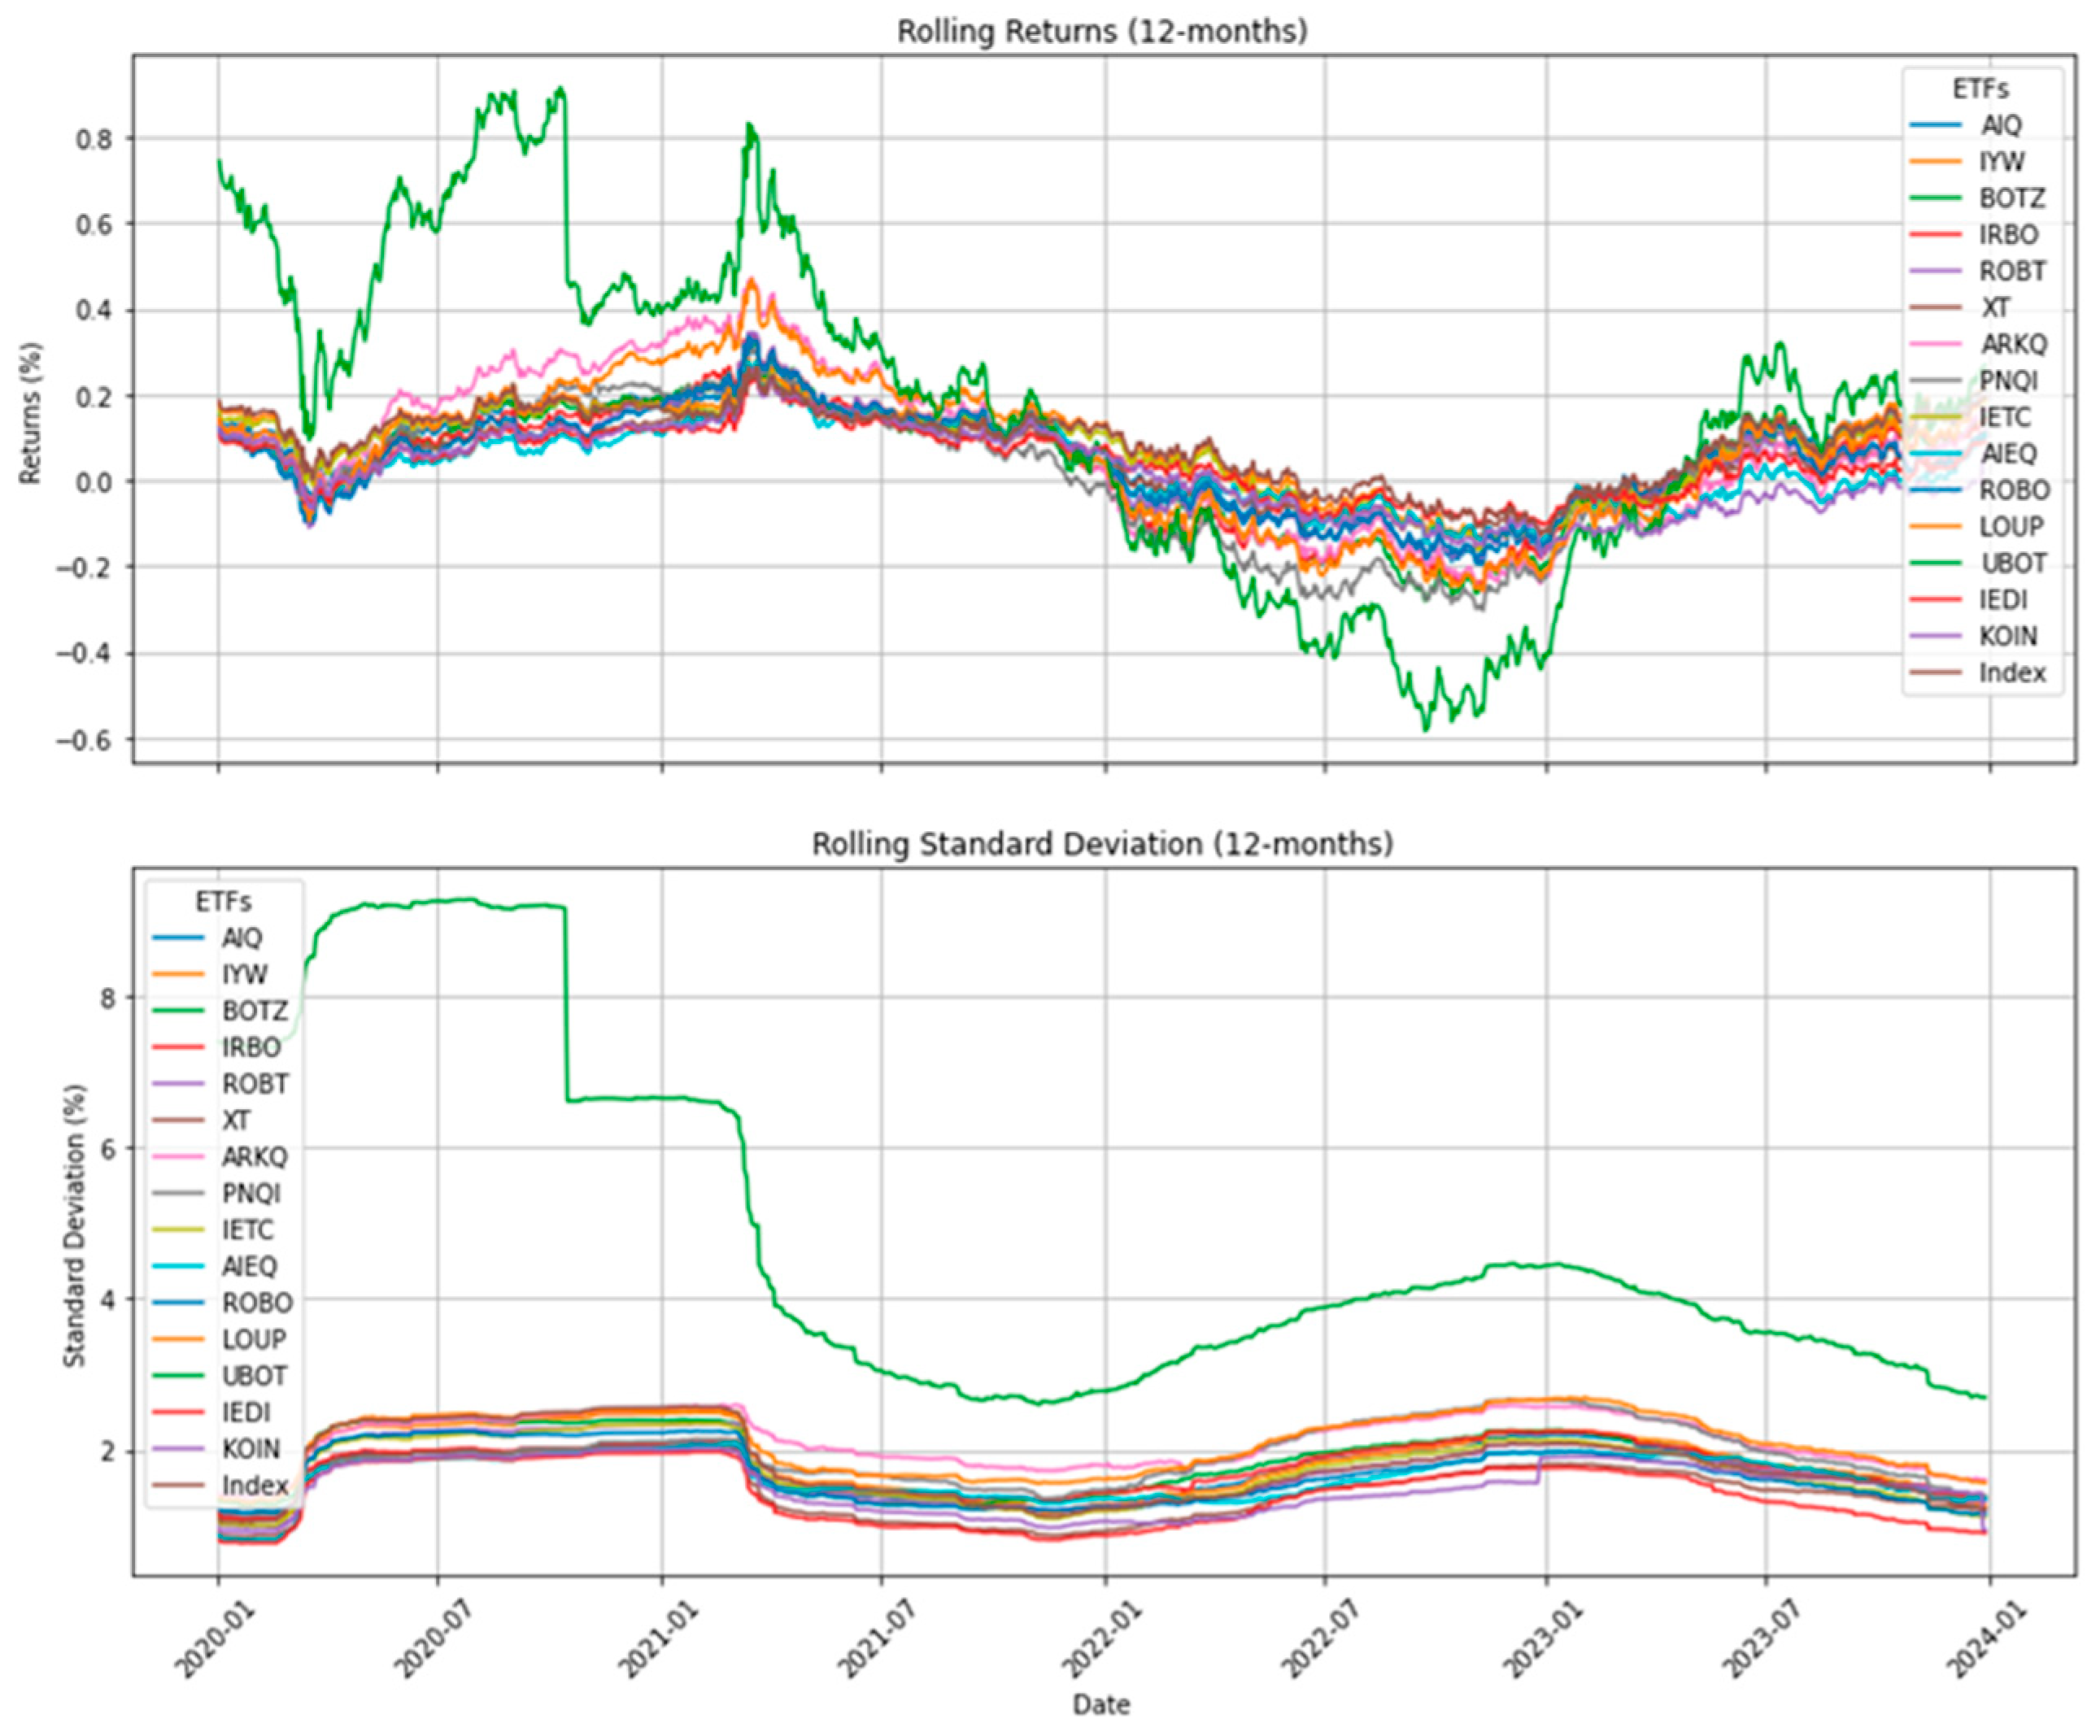
Figure 2 provides a two-panel visualization of the 12-month rolling mean and standard deviation of daily returns for the AI-themed ETFs over the period from early 2020 to the end of 2023. These panels complement the static distributional perspective in Figure 1 by illustrating the evolution of return dynamics and time-varying volatility, thereby offering a richer temporal understanding of risk–return behavior.
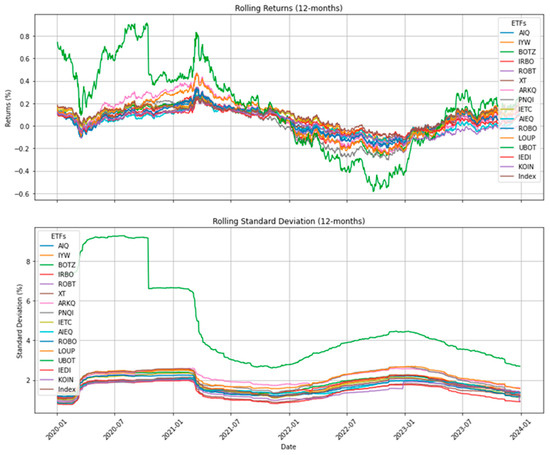
Figure 2.
Rolling mean and standard deviation of ETF returns.
The top panel reveals that the majority of ETFs exhibit relatively stable average returns, oscillating within a narrow range around zero. This homogeneity suggests a pronounced co-movement and minimal cross-sectional dispersion in cumulative returns, a finding consistent with their overlapping exposures to large-cap U.S. technology firms. While there are some periods of performance divergence, particularly around mid-2021 and early 2023, these episodes appear market-wide rather than fund-specific.
An important exception is UBOT, whose returns deviate substantially from the rest. It exhibits sharp run-ups in early 2020 and mid-2021, followed by steep drawdowns. This heightened amplitude is not mirrored in its peers, indicating idiosyncratic dynamics likely tied to its leveraged exposure to robotics and automation equities. Notably, its return volatility is persistent rather than episodic, suggesting structural leverage rather than a cyclical beta.
The lower panel underscores this point: UBOT’s rolling standard deviation consistently exceeds that of all other ETFs, with values exceeding 8% at peak—roughly 3–4 times higher than the typical fund in the sample. This volatility is particularly pronounced during the COVID-19 onset and subsequent recovery period, affirming the ETF’s amplified sensitivity to market shocks. In contrast, the remaining ETFs form a relatively tight band of rolling volatility, reinforcing the earlier observation of similar risk characteristics despite thematic branding distinctions.
Taken together, the two panels offer evidence of limited intra-category heterogeneity in terms of both return and volatility dynamics, with UBOT emerging as the only consistently distinct case. This raises concerns about the extent to which AI-themed ETFs deliver differentiated exposures. From an investor’s perspective, the lack of volatility or performance dispersion across most funds may dilute the value proposition of “AI exposure”, effectively reducing many of these ETFs to passive wrappers for a standard tech beta.
In contrast, UBOT—though riskier—might appeal to speculative investors seeking amplified returns, but its extreme profile also poses a substantial drawdown risk. This dichotomy highlights the necessity for a more nuanced classification framework within AI ETFs, distinguishing between passive thematic trackers and structurally leveraged vehicles to better inform investor decision-making and regulatory oversight.
Table 3, Table 4, Table 5, Table 6, Table 7 and Table 8 present the investment style analyses of AI ETFs using different portfolio formation metrics—size and book-to-market (Table 3 and Table 6), size and operating profitability (Table 4 and Table 7), and size and investment (Table 5 and Table 8). Pct Active quantifies the deviation of the ETF from the best-fit passive benchmark. A value of 199% for IEDI indicates a significant divergence, suggesting that the fund does not closely track its reference index and may be actively managed. The Selection Sharpe Ratio (SSR), although positive for most ETFs, remains low, implying a limited contribution of security selection to the overall performance. A key finding across these tables is the notable similarity in investment styles among the ETFs, suggesting a generally homogeneous approach to AI-related investing.
Table 3.
Performance decomposition of ETFs based on size and book-to-market portfolios.
Table 4.
Performance decomposition of ETFs based on size and operating profitability.
Table 5.
Performance decomposition of ETFs based on size and investment.
Table 6.
Performance decomposition of ETFs based on size and book-to-market portfolios.
Table 7.
Performance decomposition of ETFs based on size and operating profitability.
Table 8.
Performance decomposition of ETFs based on size and investment.
In Table 3, based on size and book-to-market portfolios, we observe varying levels of active management, as measured by the percentage of fund variance explained by active management (Pct Active). This metric ranges from 101.48% (UBOT) to 199.48% (IEDI), indicating that some ETFs rely more heavily on active strategies. The Selection Sharpe Ratio (SSR)—which evaluates the risk-adjusted returns attributable to active management—is generally low, with UBOT again leading at 0.29.
T-statistics and percentiles provide an additional perspective on the significance and skill involved in active management. UBOT records a T-statistic of 1.27 and ranks in the 89.78th percentile, suggesting a high probability that its performance is due to manager skill. In contrast, ARKQ, with a T-statistic of −0.06 and a percentile of 47.55, indicates a performance that is statistically indistinguishable from randomness.
Annualized return and risk metrics further differentiate the funds. UBOT’s fund’s mean return of 8.885% substantially exceeds its style benchmark return of 1.118%, suggesting a strong performance due to an active strategy. However, this comes with a high standard deviation (SD) of 26.648%, reflecting an elevated risk. Other funds, like AIQ, report much lower return volatility (SD: 4.149%). The selection SD quantifies the volatility arising from active decisions, adding another layer to the risk analysis.
In Table 4, based on size and operating profitability, similar patterns emerge. Pct Active ranges from 100.61% (UBOT) to 194.03% (IEDI), with IEDI again demonstrating a heavy reliance on active management. SSR values remain modest, peaking at 0.30 for UBOT and dipping to −0.01 for ARKQ, indicating limited success in generating risk-adjusted returns from active decisions. Most T-statistics fall between the 50th and 70th percentiles, denoting an average manager skill. UBOT stands out again with a T-statistic of 1.31 and a percentile of 90.46.
Performance metrics reinforce these insights: UBOT achieves the highest mean return (8.885%) versus a style benchmark of 0.914%, while ARKQ’s mean return (0.933%) closely mirrors its style return (0.966%), reflecting a more passive strategy. The fund-level and selection-level SDs further confirm UBOT’s higher risk profile and the active risks taken to achieve its returns.
Table 5, focusing on size and investment portfolios, continues the pattern. Pct Active ranges from 101.51% (UBOT) to 187.27% (IEDI), affirming a strong presence of active management. SSRs remain modest, peaking at 0.30 for UBOT. However, T-statistics across the board remain low, with UBOT again recording the highest at 1.33—which is still statistically weak but indicative of a relatively better performance. UBOT’s fund’s mean return (8.88%) is the highest, while ARKQ again ranks lowest at 0.93%.
The standard deviations of fund returns exceed those of their respective style benchmarks in all cases, illustrating the additional volatility associated with active strategies. The consistently modest SSR values and low T-statistics imply that while active management plays a role, its impact on returns is not statistically robust across most funds.
The generally low Selection Sharpe Ratios (SSRs) and T-statistics across all funds indicate that active management contributes only marginally to the risk-adjusted performance. Even UBOT, which outperforms peers on several metrics, displays a T-statistic below conventional thresholds of statistical significance. This finding reinforces the broader academic evidence that consistently achieving an alpha through active ETF strategies is difficult. However, the high percentile rankings for UBOT in selection skills (89th–90th percentile) hint at some degree of manager insight or strategic positioning that could warrant further qualitative investigation.
A closer look at portfolio allocations offers further insight into investment strategies. In Table 6, allocations vary widely across book-to-market categories. The BIG LoBM category shows the greatest flexibility (range: 0.49 to 0.76), whereas BIG HiBM is more constrained (0.03 to 0.15).
In Table 7, allocation ranges are more narrow. For instance, BIG LoOP spans from just 0.05 to 0.11, indicating a limited investment in low-profitability stocks. Conversely, BIG HiOP shows concentrated allocations (0.89 to 0.94), revealing a preference for a high operating profitability.
Table 8 displays broader allocation ranges for investment-based portfolios. BIG LoINV ranges from 0.37 to 0.66, suggesting significant flexibility, while BIG HiINV allocations are more limited (0.05 to 0.166). These findings highlight how different portfolio construction frameworks influence the strategy and exposure.
Despite differences in returns and volatilities, the majority of AI ETFs exhibit similar investment styles, particularly in the profitability-based and book-to-market-based portfolios. This style homogeneity may suggest that many AI-themed funds are drawing from overlapping segments of the market—namely, large-cap, high-growth, and high-profitability technology firms. As a result, investors may find limited diversification benefits when investing across multiple AI ETFs, unless they intentionally select funds with distinct exposures, such as UBOT or ARKQ.
In summary, portfolio formations based on size and book-to-market or investment aspects exhibit broader allocation ranges, offering greater room for performance differentiation. In contrast, the tighter allocations in profitability-based portfolios may restrict opportunities for active managers to add value. Overall, while active management is prevalent among AI ETFs, its effectiveness remains modest and statistically unconvincing, with UBOT standing out as the most active and volatile—yet also the most potentially rewarding—fund for investors seeking exposure to AI themes.
5. Conclusions
This study provides a comprehensive assessment of exchange-traded funds (ETFs) that invest in companies associated with artificial intelligence (AI). By analyzing 15 AI-themed ETFs across various performance and style dimensions, we investigate how these funds behave in terms of risk, returns, investment strategies, and their alignment with traditional portfolio factors.
Despite the variation in the branding and niche focus, our findings indicate that AI ETFs exhibit highly similar investment styles, suggesting a relatively homogeneous approach to capturing AI-related market opportunities. The style analysis reveals that the majority of the performance variation is attributable to factor exposures and asset selection, rather than to distinct or innovative active strategies. Notably, the influence of active management on excess returns is found to be modest and statistically insignificant. This suggests that passive investment approaches—particularly those closely aligned with AI sector benchmarks—may be equally or more effective in capturing returns within this thematic space.
This research shows that AI-themed ETFs offer investors a way to tap into the fast-growing artificial intelligence sector, but not all funds are created equal. While some ETFs deliver strong returns, they often come with high volatility and fees, making them riskier for long-term investors. For example, funds like IYW (with lower fees and a steady performance) may be better suited for cautious investors, while high-risk options like UBOT (with extreme ups and downs) could appeal only to those comfortable with significant swings. Most AI ETFs follow similar investment styles, meaning their performance depends more on the overall tech sector than on clever stock-picking by fund managers.
From a policy and investor standpoint, the results carry important implications. The high volatility observed in certain funds, such as UBOT, compared to style benchmarks, emphasizes the need for improved transparency and risk communication. Regulators may consider developing guidelines tailored to thematic ETFs with exposures to emerging technologies, ensuring that investors are adequately informed of potential risks. Similarly, asset managers should re-evaluate their reliance on active management, especially where it fails to yield a meaningful alpha, and focus instead on improving asset selection and portfolio construction methods.
For investors—particularly those with a lower risk tolerance—these findings reinforce the importance of scrutinizing the fund composition over branding or the management strategy. While AI ETFs provide a gateway to high-growth sectors, they also carry significant risks that must be aligned with individual investment goals.
This study is not without limitations. The analysis is based on the historical performance over a specific time window and does not capture potential structural shifts in AI ETF strategies as the technology continues to evolve. Additionally, this research is limited to a returns-based style analysis and does not delve into individual holdings, which could offer deeper insights into stock-level exposures and sector dynamics. Investing in AI-themed ETFs carries several risks, including sector concentration, as these funds are heavily exposed to the volatile technology sector. Valuation concerns also arise, with many holdings trading at inflated prices driven by hype rather than fundamentals. Furthermore, thematic dilution may occur when ETFs include companies with a limited actual involvement in AI. Regulatory uncertainty and limited track records further complicate risk assessments for long-term investors.
Future research could extend this work by incorporating a holdings-based analysis, evaluating the persistence of style exposures over different market cycles, or comparing AI-themed ETFs with other emerging thematic funds, such as those focused on blockchain, robotics, or clean energy. Exploring investor behaviors and sentiments toward thematic ETFs may also yield valuable insights into the growing role of innovation in asset management. Additionally, future research could explore a holdings-based style analysis or machine learning approaches to dynamically classify ETFs’ strategies, providing more granular insights into thematic fund behavior.
In conclusion, AI ETFs offer investors access to one of the most transformative technological trends of the 21st century. However, the findings suggest that a careful consideration of the fund structure, style alignment, and volatility is essential. As the thematic ETF landscape evolves, a deeper understanding of these instruments will be critical for investors, regulators, and asset managers alike.
Author Contributions
Conceptualization, A.K.; methodology, A.K.; software, N.P.; validation, A.K and N.P.; formal analysis, A.K and N.P.; data curation, A.K.; writing—original draft preparation, N.P.; writing—review and editing, A.K.; visualization, N.P.; supervision, A.K. All authors have read and agreed to the published version of the manuscript.
Funding
This research received no external funding.
Institutional Review Board Statement
Not applicable.
Informed Consent Statement
Not applicable.
Data Availability Statement
The dataset is available on request from the authors.
Conflicts of Interest
The authors declare no conflicts of interest.
References
- Bonaparte, Y. Artificial Intelligence in Finance: Valuations and Opportunities. Financ. Res. Lett. 2024, 60, 104851. [Google Scholar] [CrossRef]
- Chen, R.; Ren, J. Do AI-powered mutual funds perform better? Financ. Res. Lett. 2022, 47, 102616. [Google Scholar] [CrossRef]
- Wu, C.-C.; Chen, W.-P. What’s an AI name worth? The impact of AI ETFs on their underlying stocks. Financ. Res. Lett. 2022, 46, 102474. [Google Scholar] [CrossRef]
- Liebi, L.J. The effect of ETFs on financial markets: A literature review. Financ. Mark. Portf. Manag. 2020, 34, 165–178. [Google Scholar] [CrossRef]
- Branke, J.; Scheckenbach, B.; Stein, M.; Deb, K.; Schmeck, H. Portfolio optimization with an envelope-based multi-objective evolutionary algorithm. Eur. J. Oper. Res. 2009, 199, 684–693. [Google Scholar] [CrossRef]
- Kirilenko, A.A.; Lo, A.W. Moore’s law versus murphy’s law: Algorithmic trading and its discontents. J. Econ. Perspect. 2013, 27, 51–72. [Google Scholar] [CrossRef]
- Bartram, S.M.; Branke, J.; Motahari, M. Artificial Intelligence in Asset Management; CFA Institute Research Foundation: Charlottesville, VA, USA, 2020. [Google Scholar]
- Sharpe, W.F. Capital Asset Prices: A Theory of Market Equilibrium Under Conditions of Risk. J. Financ. 1964, 19, 425–442. [Google Scholar]
- Fama, E.F.; French, K.R. Multifactor explanations of asset pricing anomalies. J. Financ. 1996, 51, 55–84. [Google Scholar] [CrossRef]
- Fama, E.F.; French, K.R. Size, value, and momentum in international stock returns. J. Financ. Econ. 2012, 105, 457–472. [Google Scholar] [CrossRef]
- Jegadeesh, N.; Titman, S. Returns to Buying Winners and Selling Losers: Implications for Stock Market Efficiency. J. Financ. 1993, 48, 65–91. [Google Scholar] [CrossRef]
- Barberis, N.; Shleifer, A. Style investing. J. Financ. Econ. 2003, 68, 161–199. [Google Scholar] [CrossRef]
- Brown, K.C.; Harlow, W.V. Staying the Course: The Impact of Investment Style Consistency on Mutual Fund Performance; Elsevier: New York, NY, USA, 2002; SSRN 306999. [Google Scholar]
- Cremers, K.M.; Petajisto, A. How active is your fund manager? A new measure that predicts performance. Rev. Financ. Stud. 2009, 22, 3329–3365. [Google Scholar] [CrossRef]
- Papadamou, S.; Siriopoulos, C. American equity mutual funds in European markets: Hot hands phenomenon and style analysis. Int. J. Financ. Econ. 2004, 9, 85–97. [Google Scholar] [CrossRef]
- Patel, M.; Gupta, S.D.; Madhavan, V. Investment style consistency and performance of Indian fixed income mutual funds. IIMB Manag. Rev. 2023, 35, 229–239. [Google Scholar] [CrossRef]
- Chowdhury, M.I.H.; Balli, F.; de Bruin, A. Investment styles of islamic equity funds. Int. Rev. Econ. Financ. 2024, 89, 172–187. [Google Scholar] [CrossRef]
- Karoui, A.T.; Sayari, S.; Dammak, W.; Jeribi, A. Unveiling outperformance: A portfolio analysis of top AI-related stocks against it indices and robotics ETFs. Risks 2024, 12, 52. [Google Scholar] [CrossRef]
- Duppati, G.; Sonono, E.; Musvoto, W.; Scrimgeour, F.; Tiwari, A.K. Is Liquidity Risk Priced in Artificial Intelligence ETFs? Australas. Account. Bus. Financ. J. 2023, 17, 62–80. [Google Scholar] [CrossRef]
- Sharpe, W.F. Asset allocation: Management style and performance measurement. J. Portf. Manag. 1992, 18, 7–19. [Google Scholar] [CrossRef]
Disclaimer/Publisher’s Note: The statements, opinions and data contained in all publications are solely those of the individual author(s) and contributor(s) and not of MDPI and/or the editor(s). MDPI and/or the editor(s) disclaim responsibility for any injury to people or property resulting from any ideas, methods, instructions or products referred to in the content. |
© 2025 by the authors. Licensee MDPI, Basel, Switzerland. This article is an open access article distributed under the terms and conditions of the Creative Commons Attribution (CC BY) license (https://creativecommons.org/licenses/by/4.0/).