Article

On the Implementation of a Micromachining Compatible MOEMS Tri-Axial Accelerometer

by
Ahmed Hamouda Elsayed
,
Samir Abozyd
,
Abdelrahman Toraya
,
Mohamed Abdelsalam Mansour
* and
Noha Gaber
Center for Nanotechnology, Zewail City of Science and Technology, Giza 12578, Egypt
*
Author to whom correspondence should be addressed.
Chips 2025, 4(2), 28; https://doi.org/10.3390/chips4020028
Submission received: 1 March 2025 / Revised: 25 May 2025 / Accepted: 10 June 2025 / Published: 13 June 2025

Abstract

On-chip optical accelerometers can be a promising alternative to capacitive, piezo-resistive, and piezo-electric accelerometers in some applications due to their immunity to electromagnetic interference and high sensitivity, which allow for robust operation in electromagnetically noisy environments. This paper focuses on the characterization of an easy-to-fabricate tri-axial fiber-free optical MEMS accelerometer, which employs a simple assembly consisting of a light emitting diode (LED), a quadrant photodetector (QPD), and a suspended proof mass, measuring acceleration through light power modulation. This configuration enables simple readout circuitry without the need for complex digital signal processing (DSP). Performance modeling was conducted to simulate the LED’s irradiance profile and its interaction with the proof mass and QPD. Additionally, experimental tests were performed to measure the device’s mechanical sensitivity and validate the mechanical model. Lateral mechanical sensitivity is obtained with acceptable discrepancy from that obtained from FEA simulations. This work consolidates the performance of the design adapted and demonstrates the accelerometer’s feasibility for practical applications.

1. Introduction

Accelerometers are among the most widely used sensors, with applications ranging from consumer electronics [1] to aerospace [2], industry [3], navigation [4], structural health monitoring [5] and many others. Traditionally, accelerometers have relied on piezo-electric, piezo-resistive, or electrostatic capacitive transduction mechanisms [6]. These accelerometers, however, suffer from multiple drawbacks. Piezo-electric accelerometers provide self-generating signals and high-frequency responses but are limited by temperature drift, inaccuracies, and low-frequency cutoffs due to charge leakage, particularly at higher temperatures [7]. Piezo-resistive accelerometers, while offering simple fabrication and low cost, also struggle with temperature-induced errors, baseline drift, and non-linearity at higher accelerations, requiring complex compensation and calibration methods [8]. Electrostatic capacitive accelerometers, widely used in consumer electronics, face challenges with sensitivity, noise, and electromagnetic interference (EMI), necessitating high-resolution converters, shielding, and filtering, while also being susceptible to stiction-related failures in high-shock environments [9,10].
Consequently, optical MEMS accelerometers have emerged, driven particularly by their immunity to EMI and potential for superior sensitivity and resolution. These accelerometers typically depend on interferometric optical fiber sensors, which can be based on Fabry–Pérot [11], diffraction grating-based interferometers [12] or fiber Bragg gratings (FBGs) [13,14]. Micro-opto-electro-mechanical systems (MOEMSs) of varying bandwidth from the low range of a few Hz up to 100 KHz have been reported in the literature, making MOEMSs a valid option for a broad range of applications [15]. In addition, mass-spring accelerometer systems, including those employing optical readout like our own, are inherently versatile and can be engineered for a wide range of bandwidths and sensitivities by adjusting parameters such as the proof mass, spring constant, and damping. This tunability is a key advantage of the mass-spring architecture and is reflected in the diversity of reported devices in the literature. A summary of some of these optical transduction mechanisms and devices is provided here. It is important to note, however, that performance metrics should be compared across devices operating within similar bandwidth classes, as these figures are correlated with bandwidth. For instance, Fabry–Pérot (FP) accelerometers operate by measuring shifts in the optical resonance within a cavity formed by two parallel reflective surfaces. Acceleration causes one of the cavity’s plates to move, thereby changing the cavity length and shifting the transmitted light intensity peaks. Li et al. [16] employed an FP microcavity with wavelength modulation to achieve a mechanical sensitivity of 10.92 nm / g and an optical sensitivity of 1.9038 . This sensitivity, however, is limited by the 48.10 µg resolution over a ±251 g range. Qi et al. [11] presented an orthogonal optical path range broadening scheme to extend the working range of fiber Fabry–Pérot accelerometers while maintaining immunity to EMI, achieving a noise floor of 4.8 ng / Hz at 15 Hz and increasing the dynamic range from 98.8 dB to 143 dB . Furthermore, a design featuring a G-shaped mass-spring structure demonstrated a resolution of 300 ng and a sensitivity of 183.793 V / g at a bandwidth of 29.3 Hz using intensity demodulation, with robust packaging achieved via 3D printing [17]. Despite these advances, balancing high resolution (sub- μ g ) with a wide dynamic range remains a key challenge, although innovations in electrostatic MEMS actuators and CMOS-compatible fabrication are improving their prospects [18]. FBG-based accelerometers leverage the periodic modulation of the refractive index in an optical fiber. When the proof mass deforms the fiber, the grating period and the effective refractive index change, resulting in a shift in the Bragg wavelength. Several studies have reported FBG accelerometers with sensitivities on the order of 100 pm / g [14,19,20], making them suitable for long-distance measurements and distributed monitoring in civil structures. Li et al. [19], using a flexible hinge, achieved a sensitivity of 804 pm/g with an operating frequency range from 10 to 50 Hz, while the authors in [14] presented a dual mass block FBG-based sensor with 73.86 pm/g sensitivity and operating range from 20 to 340 Hz. In [20], the authors implemented a tri-axial accelerometer using composite flexible hinges, achieving sensitivities of 51.9, 39.5, and 20.3 pm/g along the x, y, and z axes, respectively, across a 0–250 Hz measurement bandwidth. Photonic-crystal-based opto-mechanical accelerometers are another type based on this same wavelength modulation scheme, which has recently been explored for high-precision inertial sensing [21,22]. In theory, they could offer high sensitivity and high resolution at bandwidths up to 30 kHz, making them suitable for a broad range of vibration and noise sensing applications. However, they require sophisticated processing and advanced technology to achieve the desired bandwidth modulation, limiting their practical performance [23]. Similarly, optical frequency combs offer another highly accurate means to measure displacement through phase-sensitive readouts. Reschovsky et al. [24] demonstrated an opto-mechanical accelerometer with an intrinsic accuracy better than 2.1 % over a frequency range of 0.1–15 kHz by integrating an optical frequency comb readout with a robust mechanical model. In addition, in situ 3D microprinting techniques have recently been employed to fabricate ferrule-top Fabry–Pérot microinterferometers directly on the end face of optical fibers [25]. With this method, the authors achieved a sensitivity of 1.8 nm/g with a 2 kHz bandwidth and 62.45 μ g / Hz noise floor, highlighting the potential for further miniaturization and integration with other photonic components. A more recent research direction involves utilizing optical tunneling (evanescent coupling) as the sensing mechanism [26,27]. In these devices, a pair of closely spaced waveguides or fibers allows light to tunnel from one to the other via the evanescent field. Because the tunneling efficiency is highly sensitive to the gap between the waveguides, small displacements induced by acceleration result in significant changes in transmitted optical power.
This innovative progress, however, comes with several challenges that hinder widespread adoption and practical implementation. A significant limitation is the reliance on bulky components such as fiber-optic systems, external spectrometers, or mirrors, which complicates miniaturization and integration into compact systems. For example, devices based on spectral interference techniques, such as Fabry–Pérot interferometers or fiber Bragg gratings (FBGs), require precise alignment of optical fibers and external optics to achieve high sensitivity and resolution, making them unsuitable for applications where size constraints are critical. This alignment of optical fibers is by itself another critical issue; even minor misalignments during assembly or operation can lead to signal degradation or loss of functionality. This reliance on optical fibers also makes the devices sensitive to environmental factors, such as vibrations or mechanical stresses, further complicating their use in industrial or aerospace environments [13]. Additionally, many optical accelerometers depend on advanced signal processing techniques or spectroscopic methods to interpret their output signals [28]. These spectral interference devices require high-resolution spectrometers to detect wavelength shifts caused by acceleration-induced displacements. These spectrometers are typically expensive, bulky, and power-intensive, which limits their applicability in portable or low-power systems. Similarly, devices based on evanescent wave interactions or refractive index changes often require sophisticated DSP units to extract meaningful data from the output signals. This adds significant complexity and cost to the overall system design. Another obstacle is the need for improved thermal and vibrational stability. Optical accelerometers, particularly those based on interferometric readouts, are sensitive to temperature fluctuations and environmental noise, which can compromise resolution [29]. Recent work has focused on elevating some or all of these limitations without sacrificing sensitivity; however, these advances do not eliminate the need for precise alignment of components. Integration with on-chip signal processing electronics, calibration systems, and noise suppression also remains a crucial area of ongoing research [30,31,32].
Previously, Abozyd et al. [33,34] presented a novel design for a fiber-free optical MEMS accelerometer capable of 3D measurements and suitable for on-chip integration, addressing several limitations of traditional optical accelerometers, such as the need for complex DSP, fiber alignment issues or design complexity and integration challenges. In this paper, we study the proposed design, analyzing its mechanical and optical performance while taking into account effects from fabrication errors and potential noise sources. The mechanical system die was fabricated and its performance was investigated experimentally.

2. Materials and Methods

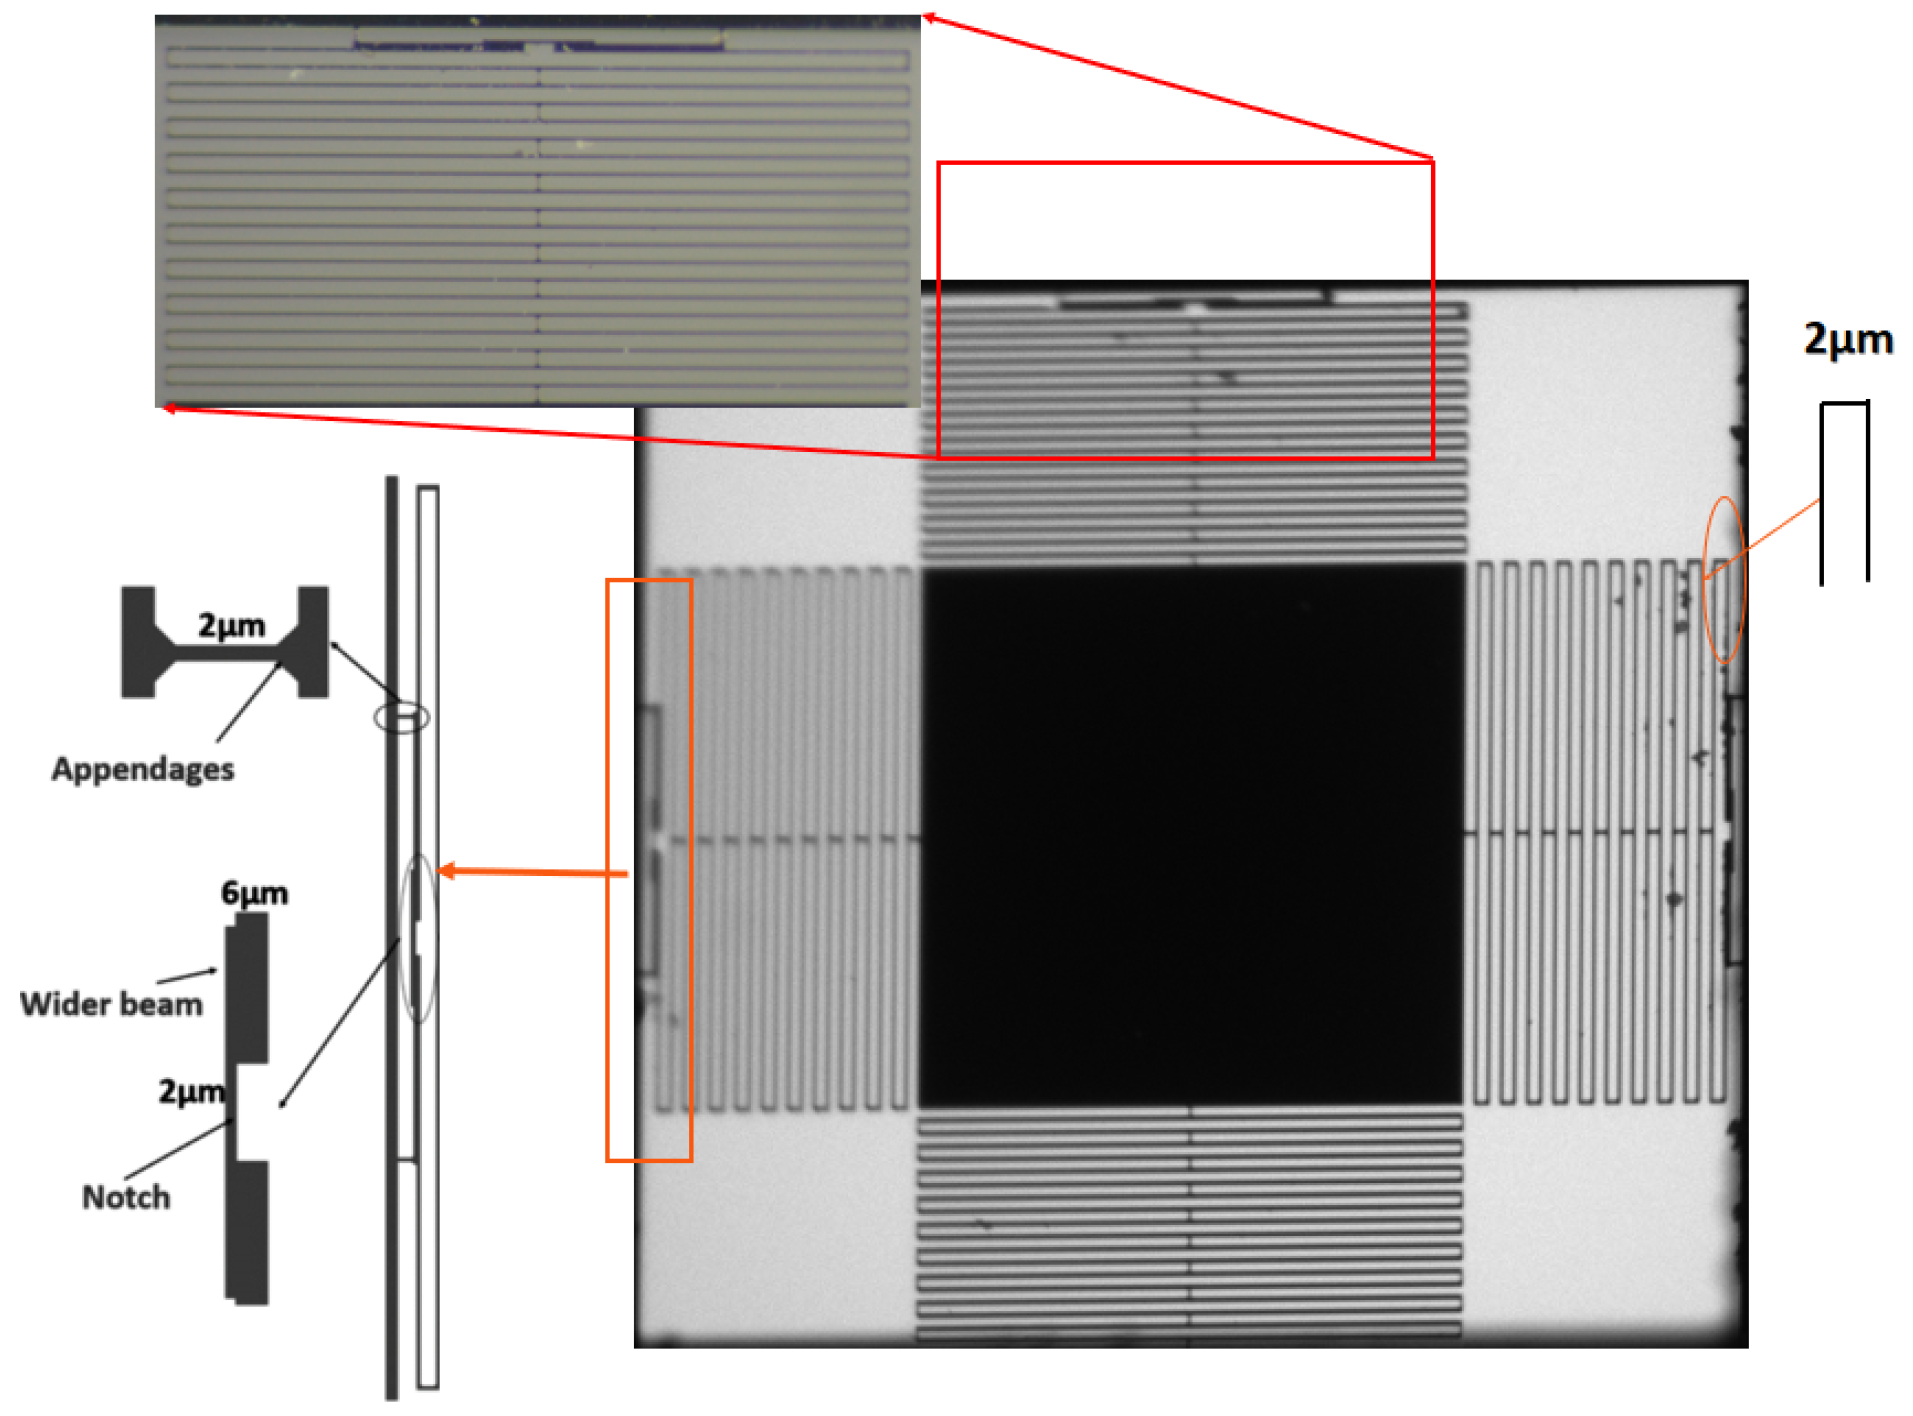
2.1. Device Structure and Operation

A schematic of the proposed accelerometer is shown in Figure 1. It employs a 1 mm × 1 mm proof mass suspended by four folded springs. It is free to move tri-axially between a high-power LED source (SFH 4770S) [35] and a QPD (QP5.8-6-TO5) [36]. The employed SFH 4770S LED has a side length of 1 mm, an irradiance power of 1.2 W, a peak wavelength of 860 nm, and a 60° half-angle. The receiving QPD has an active area of 8.3 mm2, divided into four quadrants. Its peak responsivity is at 900 nm, close to the LED’s emission peak, and it has an average responsivity of 0.5 A/W. In order not to saturate the QPD, we will operate the LED at 500 mW total radiant flux.
When the device is subject to acceleration, the suspended proof mass changes its position, which in turn changes the power that reaches each of the four quadrants. For instance, if the proof mass moves away from the LED (i.e., towards the negative Z direction), the power reaching all four quadrants of the QPD increases since a smaller portion of the radiated light is blocked. Alternatively, lateral motion (along either directions of the x and y axes) will make two quadrants of the QPD read more power than the other two. This change in detected power could then be detected and translated into acceleration readings.
The accelerometer’s mechanical part was fabricated using the SOIMUMPS process by MEMSCAP® [37], using a silicon-on-insulator (SOI) wafer with a 400 µm handle layer, a 2 µm oxide layer, and a 25 µm device layer. The design required only two masks (a structure mask and a back-etching mask), rendering it simpler and more cost-effective than the full four-mask process. Deep reactive ion etching (DRIE) was used to pattern the silicon layer, followed by HF etching to release the structure.
The folded spring design, shown in Figure 2, features a 2 µm thick beam, designed to achieve high mechanical sensitivity. Each of the four springs incorporates a notch shape at the last folded pair, which enhances sensitivity while maintaining stability against rotational and off-axis movements. Despite its advantages, this design is particularly vulnerable to stress-induced fractures during critical fabrication steps, such as heating and release etching, potentially resulting in a low device yield.
A high-performance accelerometer must have a good balance between sensitivity, resolution, and operating bandwidth. Therefore, to analyze the performance of our sensor, we need to first model the mechanical sensitivity of the mass-spring system, defined as the proof mass displacement per 1 G acceleration, and the optical sensitivity of the LED-blocking mass-QPD setup, defined as the change in power detected by the QPD per unit displacement of the proof mass compared to some initial blocking distance and position. This in turn requires an accurate model of the emission profile of the LED and the responsivity of the QPD.

2.2. Mechanical Performance

To evaluate the mechanical sensitivity of the proposed mass-spring system, finite element analysis is performed in COMSOL’s solid mechanics interface (COMSOL version 6.2). Our mass-spring layout and optical readout exhibit perfect rotational symmetry on the four sides of the structure, making the x and y axes functionally identical in both mechanical stiffness and optical response. Mechanically, the four folded springs are arranged in a square pattern around the proof mass, so the spring constant, and hence the displacement, is the same whether motion along the x or y directions is applied. Optically, the 1 mm × 1 mm LED and the QPD are above and below the mass along the same vertical line so that any lateral shift along the x or y axes blocks the same fraction of light but on different pairs of the QPD. To avoid redundancy, only one lateral direction, the x axis, will be considered for the rest of the discussion. The stationary solver is used to compute displacements by sweeping the accelerations along the x and z axes from 0 to 20 G. A nominal device layer thickness of 25 µm is considered, and additional simulations at 24 µm and 26 µm are conducted to capture the impact of typical SOIMUMPs fabrication tolerances (namely a 2 µm variation in the device layer dimensions) [37]. The cross-axis coupling of the design is evaluated by obtaining vertical displacements under lateral acceleration (i.e., how much displacement occurs along the z axis when acceleration along the x axis is applied) and vice versa to quantify the rejection of off-axis coupling through off-axis cancellation ratios. In addition, the resonance frequencies of the mass-spring system are estimated using Comsol’s eigenfrequency solver, and the mode shapes are analyzed. We also examined the effect of thermal noise on mechanical performance through the noise equivalent RMS acceleration. In thermal equilibrium, the equipartition theorem states that each quadratic degree of freedom has an average energy of 1 2 k B T , where k B is Boltzmann’s constant and T is the absolute temperature. Solving for the mean-square displacement, we obtain
x 2 = k B T k .
The RMS displacement is therefore
x rms = x 2 = k B T k .
Because the spring constant k is related to the mass m and the resonant angular frequency ω 0 by
k = m ω 0 2 ,
this expression can be recast as
x rms = k B T m ω 0 2 .
In our case, the acceleration is given by a = ω 0 2 x ; hence, the noise equivalent RMS acceleration becomes
a rms = ω 0 2 x rms = ω 0 2 k B T m ω 0 2 = k B T ω 0 2 m .

2.3. Optical Modeling

As mentioned earlier, modeling the optical sensitivity of the design requires a good model of the irradiance profile of the chosen LED to estimate how much power is blocked by the proof mass and subsequently how much power reaches each of the quadrants of the photodetector. In addition, the relative spectral emission of the LED should be considered as the responsivity of the QPD also varies with wavelength [36]. In order to model the irradiance profile of the chosen LED, we use the analytical model developed by Moreno [38] for the near-field irradiance of a square LED. Equation (7) [38] gives the irradiance E in W / m 2 as a function of the distance between the source and the surface being illuminated and the coordinates of every point on that surface. Our system is meant for on-chip operations at distances typically smaller than the Fraunhofer distance associated with the source
d near < 2 D 2 λ ,
where D represents the largest dimension of the emitting device and λ is the source’s wavelength. The SFH 4770S LED is a square of side length 1 mm and a peak wavelength of 860 nm. Substituting these values into the above expression, we obtain d n e a r < 2.3 m, which is well within our region of operation.
E ( x , y , h ) = Φ s 2 π A s { ( 0.5 s y y ) 0.5 s y y 2 + h 2 arctan 0.5 s x x 0.5 s y y 2 + h 2 ( 0.5 s y y ) 0.5 s y y 2 + h 2 arctan ( 0.5 s x + x ) 0.5 s y y 2 + h 2 + ( 0.5 s x + x ) 0.5 s x + x 2 + h 2 arctan 0.5 s y y 0.5 s x + x 2 + h 2 ( 0.5 s x + x ) 0.5 s x + x 2 + h 2 arctan ( 0.5 s y + y ) 0.5 s x + x 2 + h 2 ( 0.5 s y + y ) 0.5 s y + y 2 + h 2 arctan ( 0.5 s x + x ) 0.5 s y + y 2 + h 2 + ( 0.5 s y + y ) 0.5 s y + y 2 + h 2 arctan 0.5 s x x 0.5 s y + y 2 + h 2 }
where Φ s is the flux in Watts, s x and s y are the dimensions of the LED, and h is the distance between the LED and the illuminated surface (or the proof mass in our case). The initial blocking distance ( h 0 ) was set at 20 μ m .
By integrating the above expression for the irradiance over the whole proof mass area and then subtracting the result from the total power emitted from the LED, we obtain the power detected by the photodetectors. The integration is performed separately over the four quadrants of the photodetector to capture the spatial distribution of the optical power as the proof mass displaces. To examine how the detected optical power changes when the proof mass undergoes lateral displacement, a numerical integration approach was implemented. In this model, the LED is treated as a uniform square source of side length S, emitting a total power p. The mass, initially at a nominal blocking distance h 0 , shifts laterally or vertically by an amount w. For each value of w, an integrand describing the LED’s emission profile is evaluated over each quadrant of the detector to determine how much of the quadrant’s share of the total flux is blocked by the mass. Within each quadrant, the integrand accounts for the geometry of the LED source, the position of the mass, and the distance from the LED to the detector, thereby estimating the fraction of light blocked. Since each quadrant ideally receives p / 4 in the absence of any obstruction, the actual detected power in quadrant i becomes p 4 q i , where q i is the integral of the blocked flux in that quadrant.

2.4. QPD Responsivity

To determine the optical sensitivity of the system, the responsivity of the quadrant photodetector (QPD) must be accounted for, as it varies with wavelength. The responsivity function R ( λ ) , which represents the conversion efficiency of incident optical power into electrical current, was obtained from the manufacturer’s datasheet. Similarly, the relative spectral emission I rel ( λ ) of the LED was obtained and analyzed. The LED emission spectrum was then normalized to ensure a correct weighting of the responsivity across the relevant wavelengths. The effective responsivity R eff of the QPD was then computed as the integral of the product of the responsivity function and the normalized spectral emission:
R eff = λ min λ max R ( λ ) · I rel ( λ ) I 0 d λ , where I 0 = λ min λ max I rel ( λ ) d λ .
λ min and λ max define the wavelength range, and I 0 is the normalized relative spectral emission. This integral provides a weighted average of the QPD’s responsivity, incorporating the spectral characteristics of the LED source.
With the effective responsivity determined, the detected photocurrent from each quadrant of the QPD can be estimated based on the integrated power distribution, allowing us to establish the relationship between proof mass displacement and the corresponding current generated by the QPD.

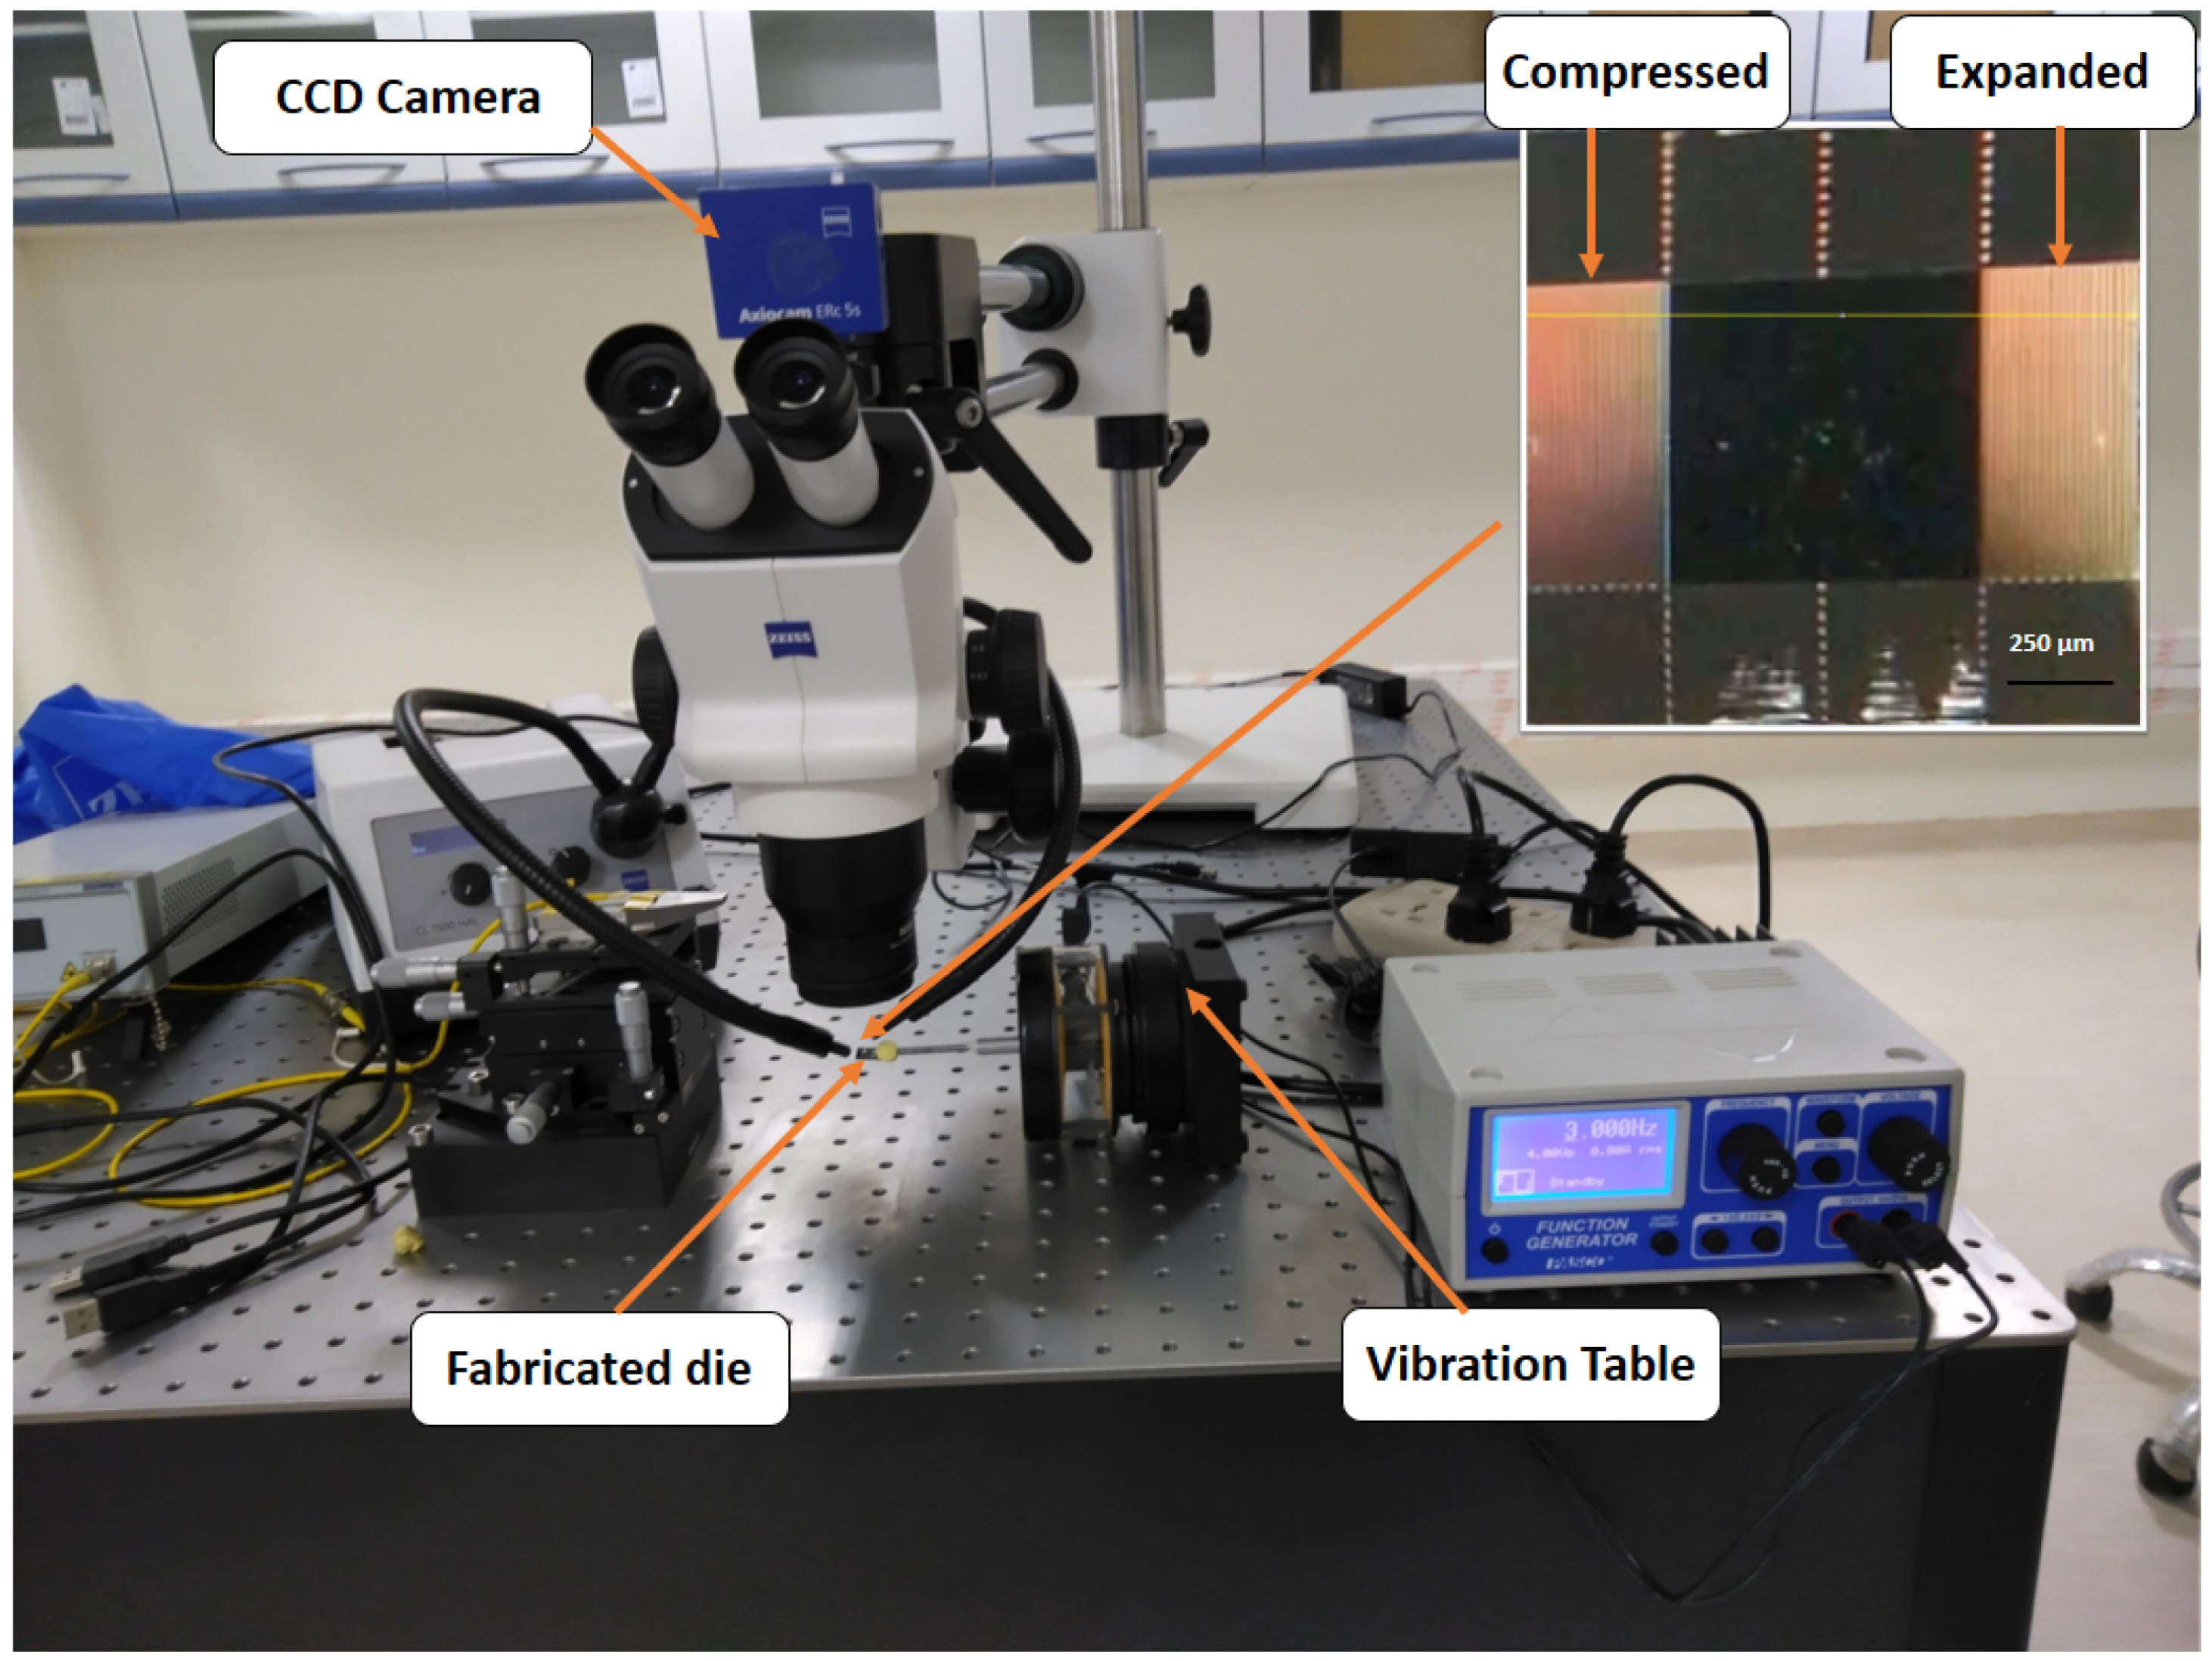
2.5. Experimental Setup

To characterize the mechanical sensitivity of the accelerometer independently from its optical readout system, the fabricated mass-spring structure was tested using an image-based method, as illustrated in Figure 3. This approach, which employs a camera to track proof mass displacement, allows for a validation of the mechanical response without relying on the quadrant photodetector (QPD) or the full opto-electronic assembly. The image-based measurements serve as an independent reference to assess displacement accuracy and to verify consistency with simulation results.
The MEMS die, which houses the mass-spring system, was mounted on a mechanical vibrator (SF-9324, PASCO Scientific, Roseville, CA, USA) whose acceleration is pre-calibrated with an MPU6050 accelerometer kit. The vibrator is driven by a controlled power supply and operated at frequencies of 1 Hz, 2 Hz, and 3 Hz with a 6 V amplitude and 1 Hz with a 7 V amplitude, thereby generating well-defined acceleration inputs. The resulting motion of the MEMS die is observed under an optical microscope, and recorded by a camera. These high-resolution images are subsequently processed using ImageJ software (version 1.54g). The displacement of the proof mass is then determined by measuring the changes in the distance between the opposing sides of the springs. This measured displacement is then correlated with the applied acceleration to derive the mechanical sensitivity of the device. This setup only permits reliable measurements of in-plane (lateral) motion. This is because by tracking changes in the gap between springs suspending the proof mass, we obtain the lateral displacement versus applied acceleration. However, under vertical acceleration, all images, apart from the rest position, go out of focus even for small z-axis shifts. Our analysis, therefore, cannot resolve out-of-plane motion. In addition, our calibration method, which was based on a MPU-6050 unit, set a limitation on our lateral acceleration samples.

3. Results

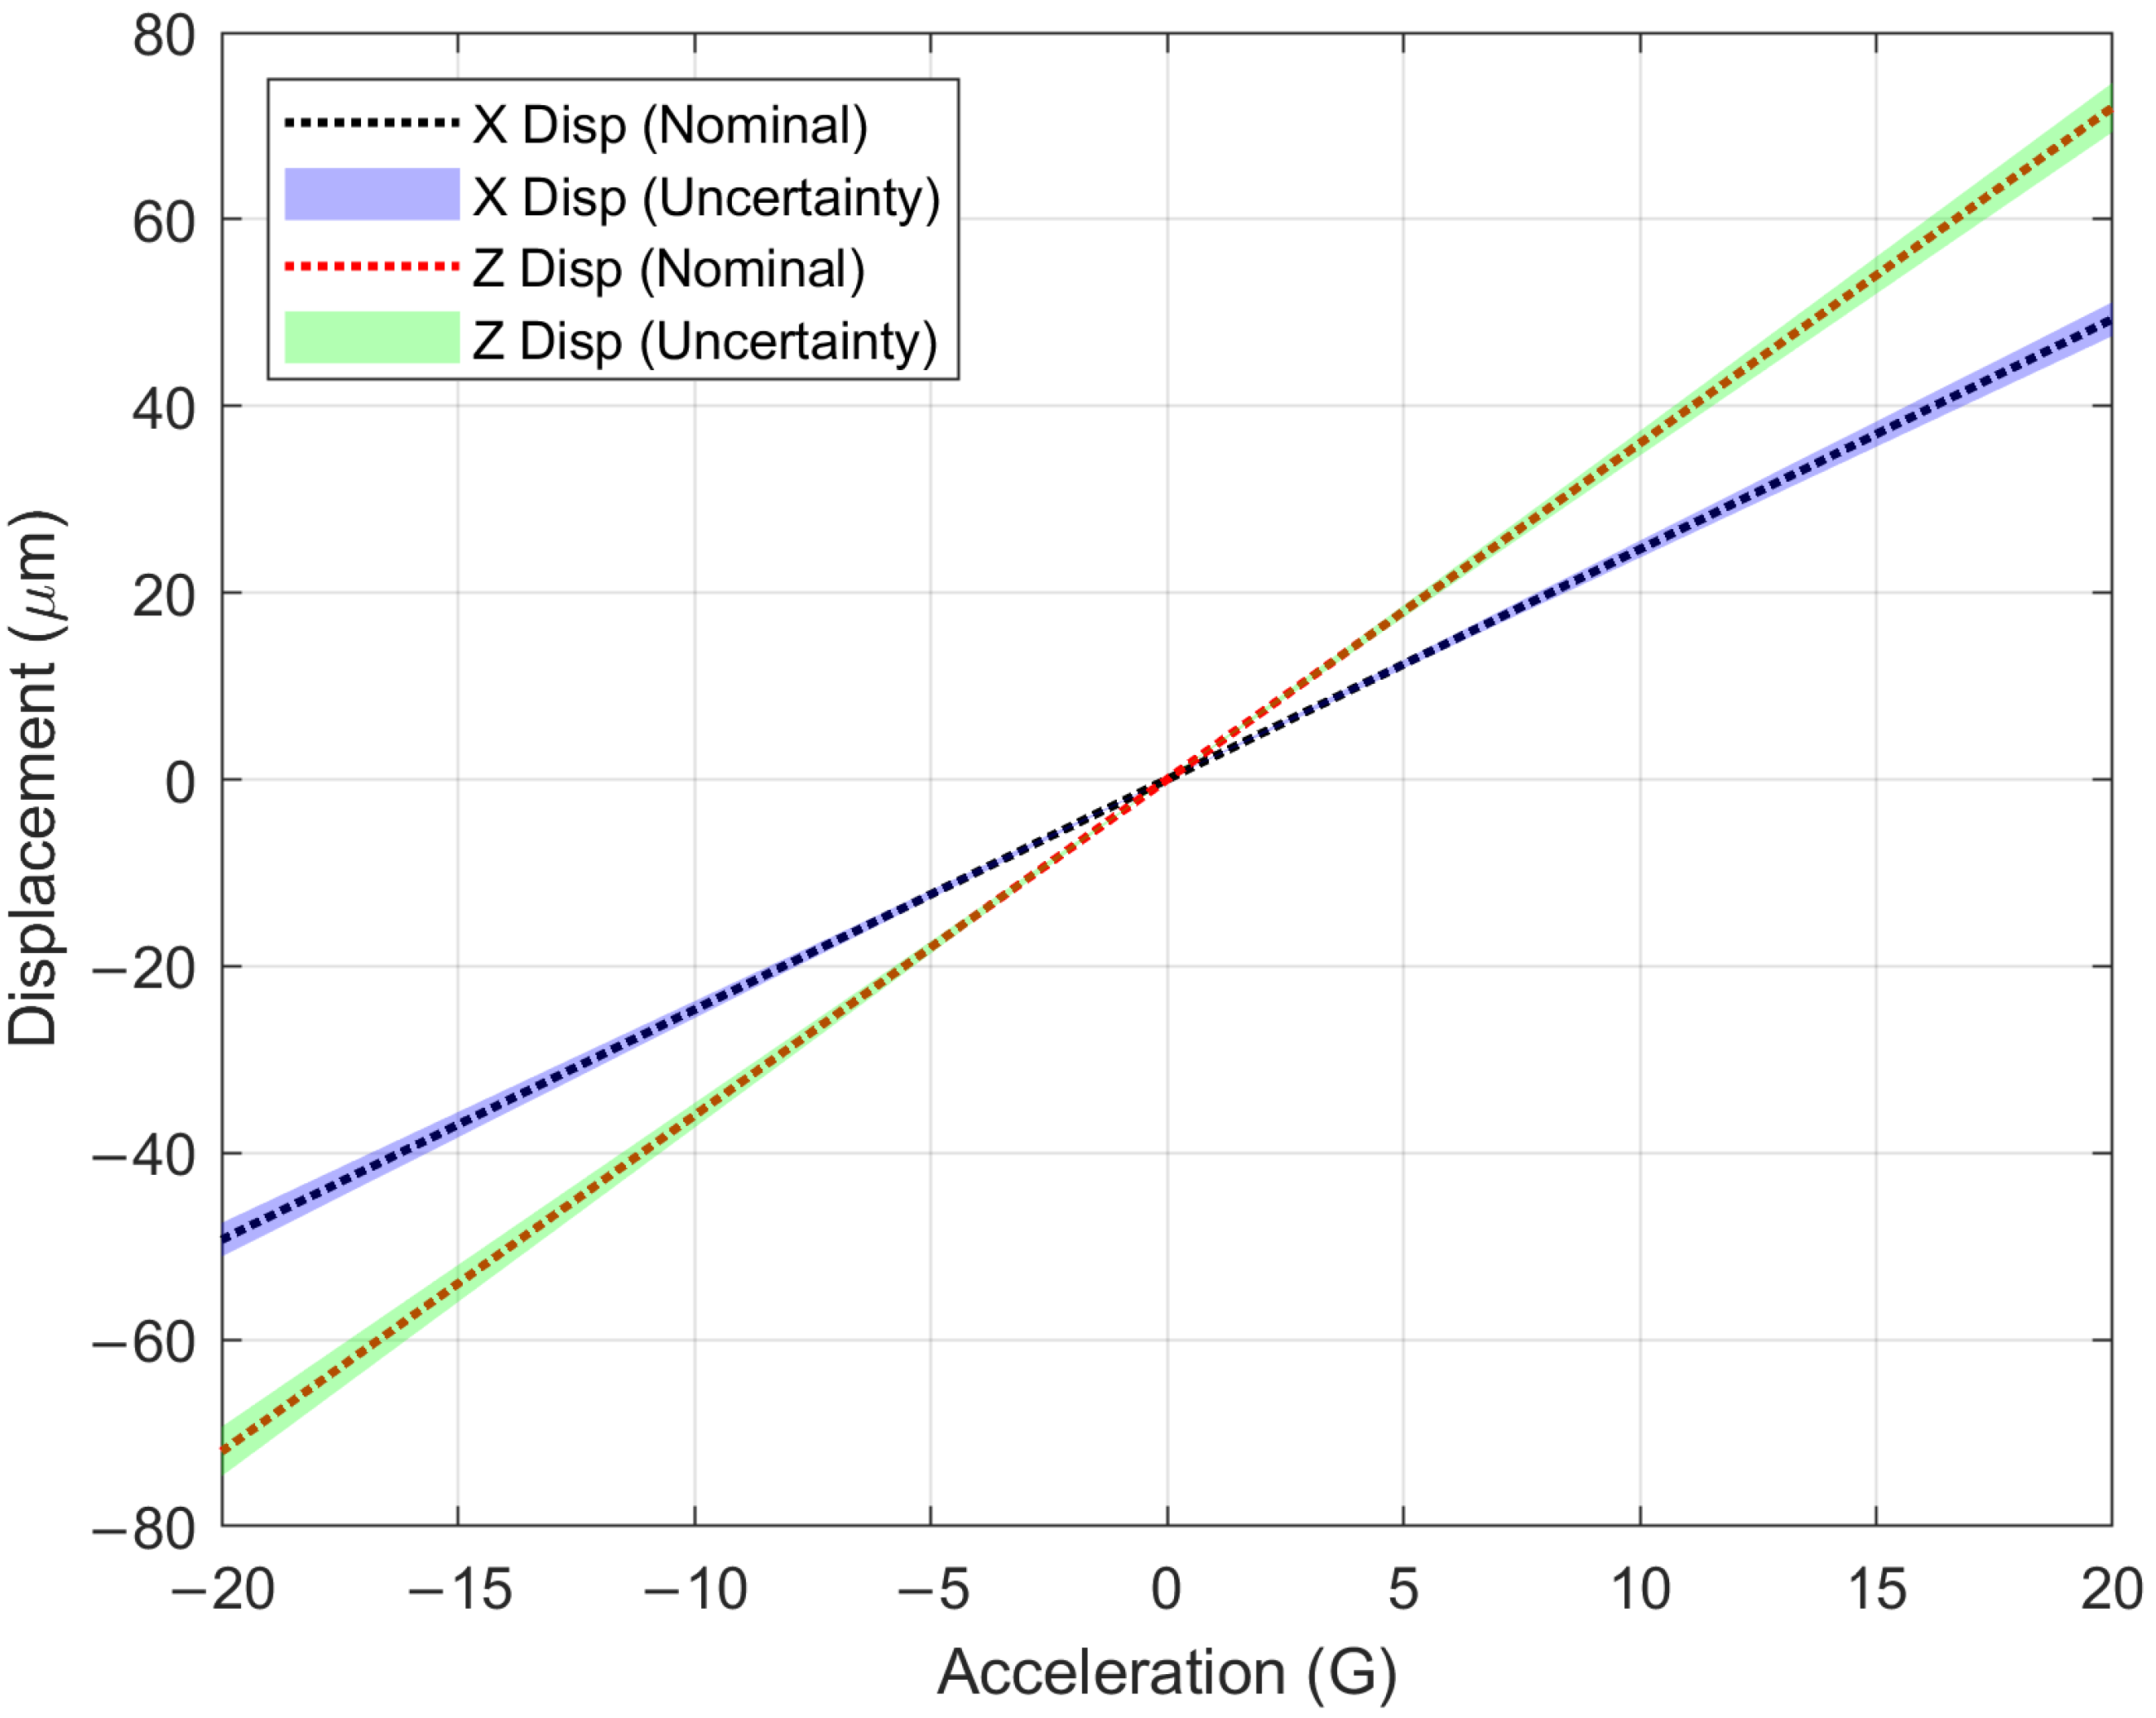
3.1. Mechanical Performance

Figure 4 illustrates the displacement of the proof mass in both the x and z directions, corresponding to lateral and vertical movements, respectively, under accelerations ranging from −20 G to 20 G. As described in the methodology, these finite element simulations were performed in COMSOL’s solid mechanics interface, using a nominal device layer thickness of 25 µm and additional simulations at 24 µm and 26 µm to capture the impact of fabrication tolerances. The shaded regions in the plot represent the uncertainty bands associated with these thickness variations. Extra variations of 2 µm, corresponding to fabrication process tolerances, as explained earlier, in the proof mass length and width were also considered. Since the side surface area of the device (1000 µm by 25 µm) is much smaller than the upper and lower areas, the uncertainties are dominated by variations in thickness. Overall, we obtain a ±7% uncertainty around the nominal value with less than 0.001% attributed to the side surfaces variations.
From the linear slope of each displacement curve, the mechanical sensitivity can be extracted as the displacement per unit acceleration (µm/g). Specifically, the nominal lateral mechanical sensitivity was found to be 2.46 µm/g, while vertical sensitivity was 3.6 µm/g. The uncertainty bands indicate the maximum deviation from these nominal values due to dimension variations and mechanical thermal noise.

3.2. Off-Axis Cancellation Ratios

In addition to evaluating sensitivity along the primary axes, we also assessed how well the sensor rejects unwanted off-axis signals. To do this, we defined four off-axis cancellation ratios, S z x , S z y , S x y , and S x z . Each ratio compares the sensor’s response when an acceleration is applied along one axis (denoted by i) but measured on a different axis (denoted by j), with the response measured along the same axis i. For example, S z x is defined as the ratio of the displacement measured along the x axis when acceleration is applied in the z direction to the displacement measured along the z axis under the same acceleration. The cancellation ratios, S z x , S z y , S x y and S x z , were found to be 5.7 × 10 5 , 1.8 × 10 5 , 3.1 × 10 4 and 5.3 × 10 5 , respectively, implying a high degree of cross-axis isolation. Figure 5 shows the mode shapes of the mass-spring system. As shown, resonance modes associated with vertical and lateral displacements occur at smaller frequencies than rotational and off-axis movements.
Overall, these results demonstrate that the proposed mass-spring system achieves the desired mechanical sensitivity in both the in-plane and out-of-plane directions. It maintains low cross-axis coupling and shows acceptable variations when typical fabrication tolerances are considered.

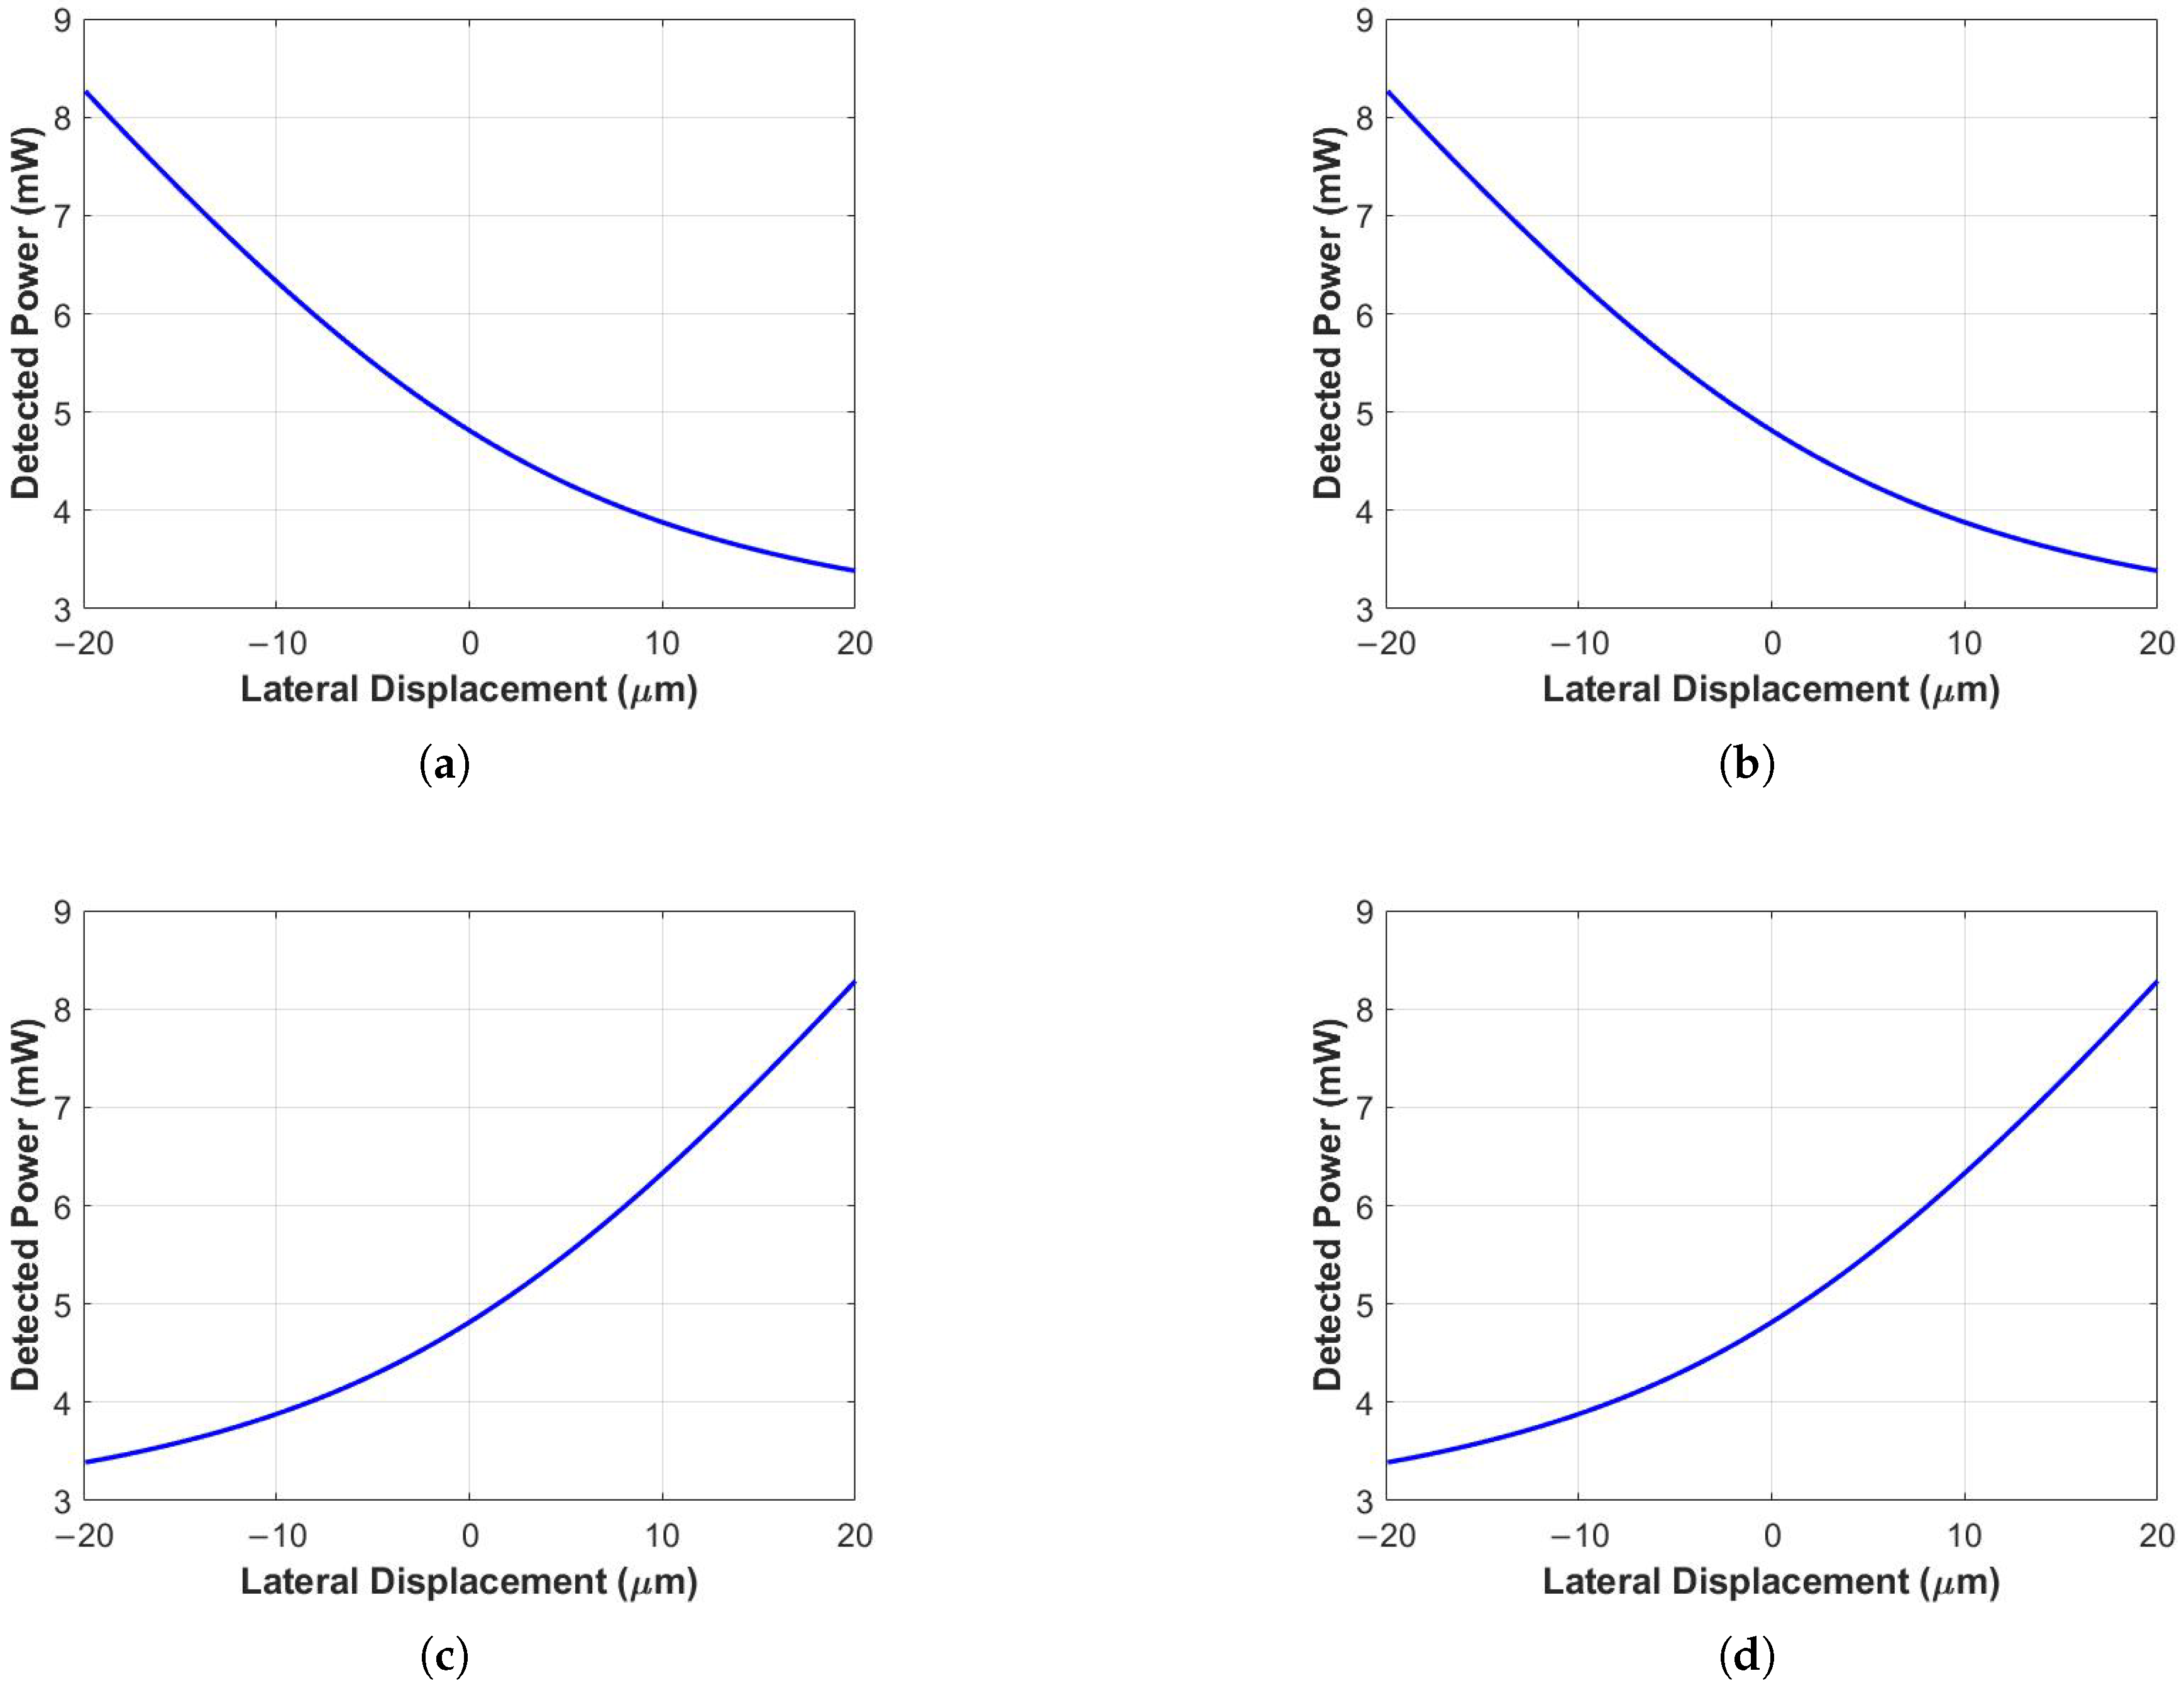
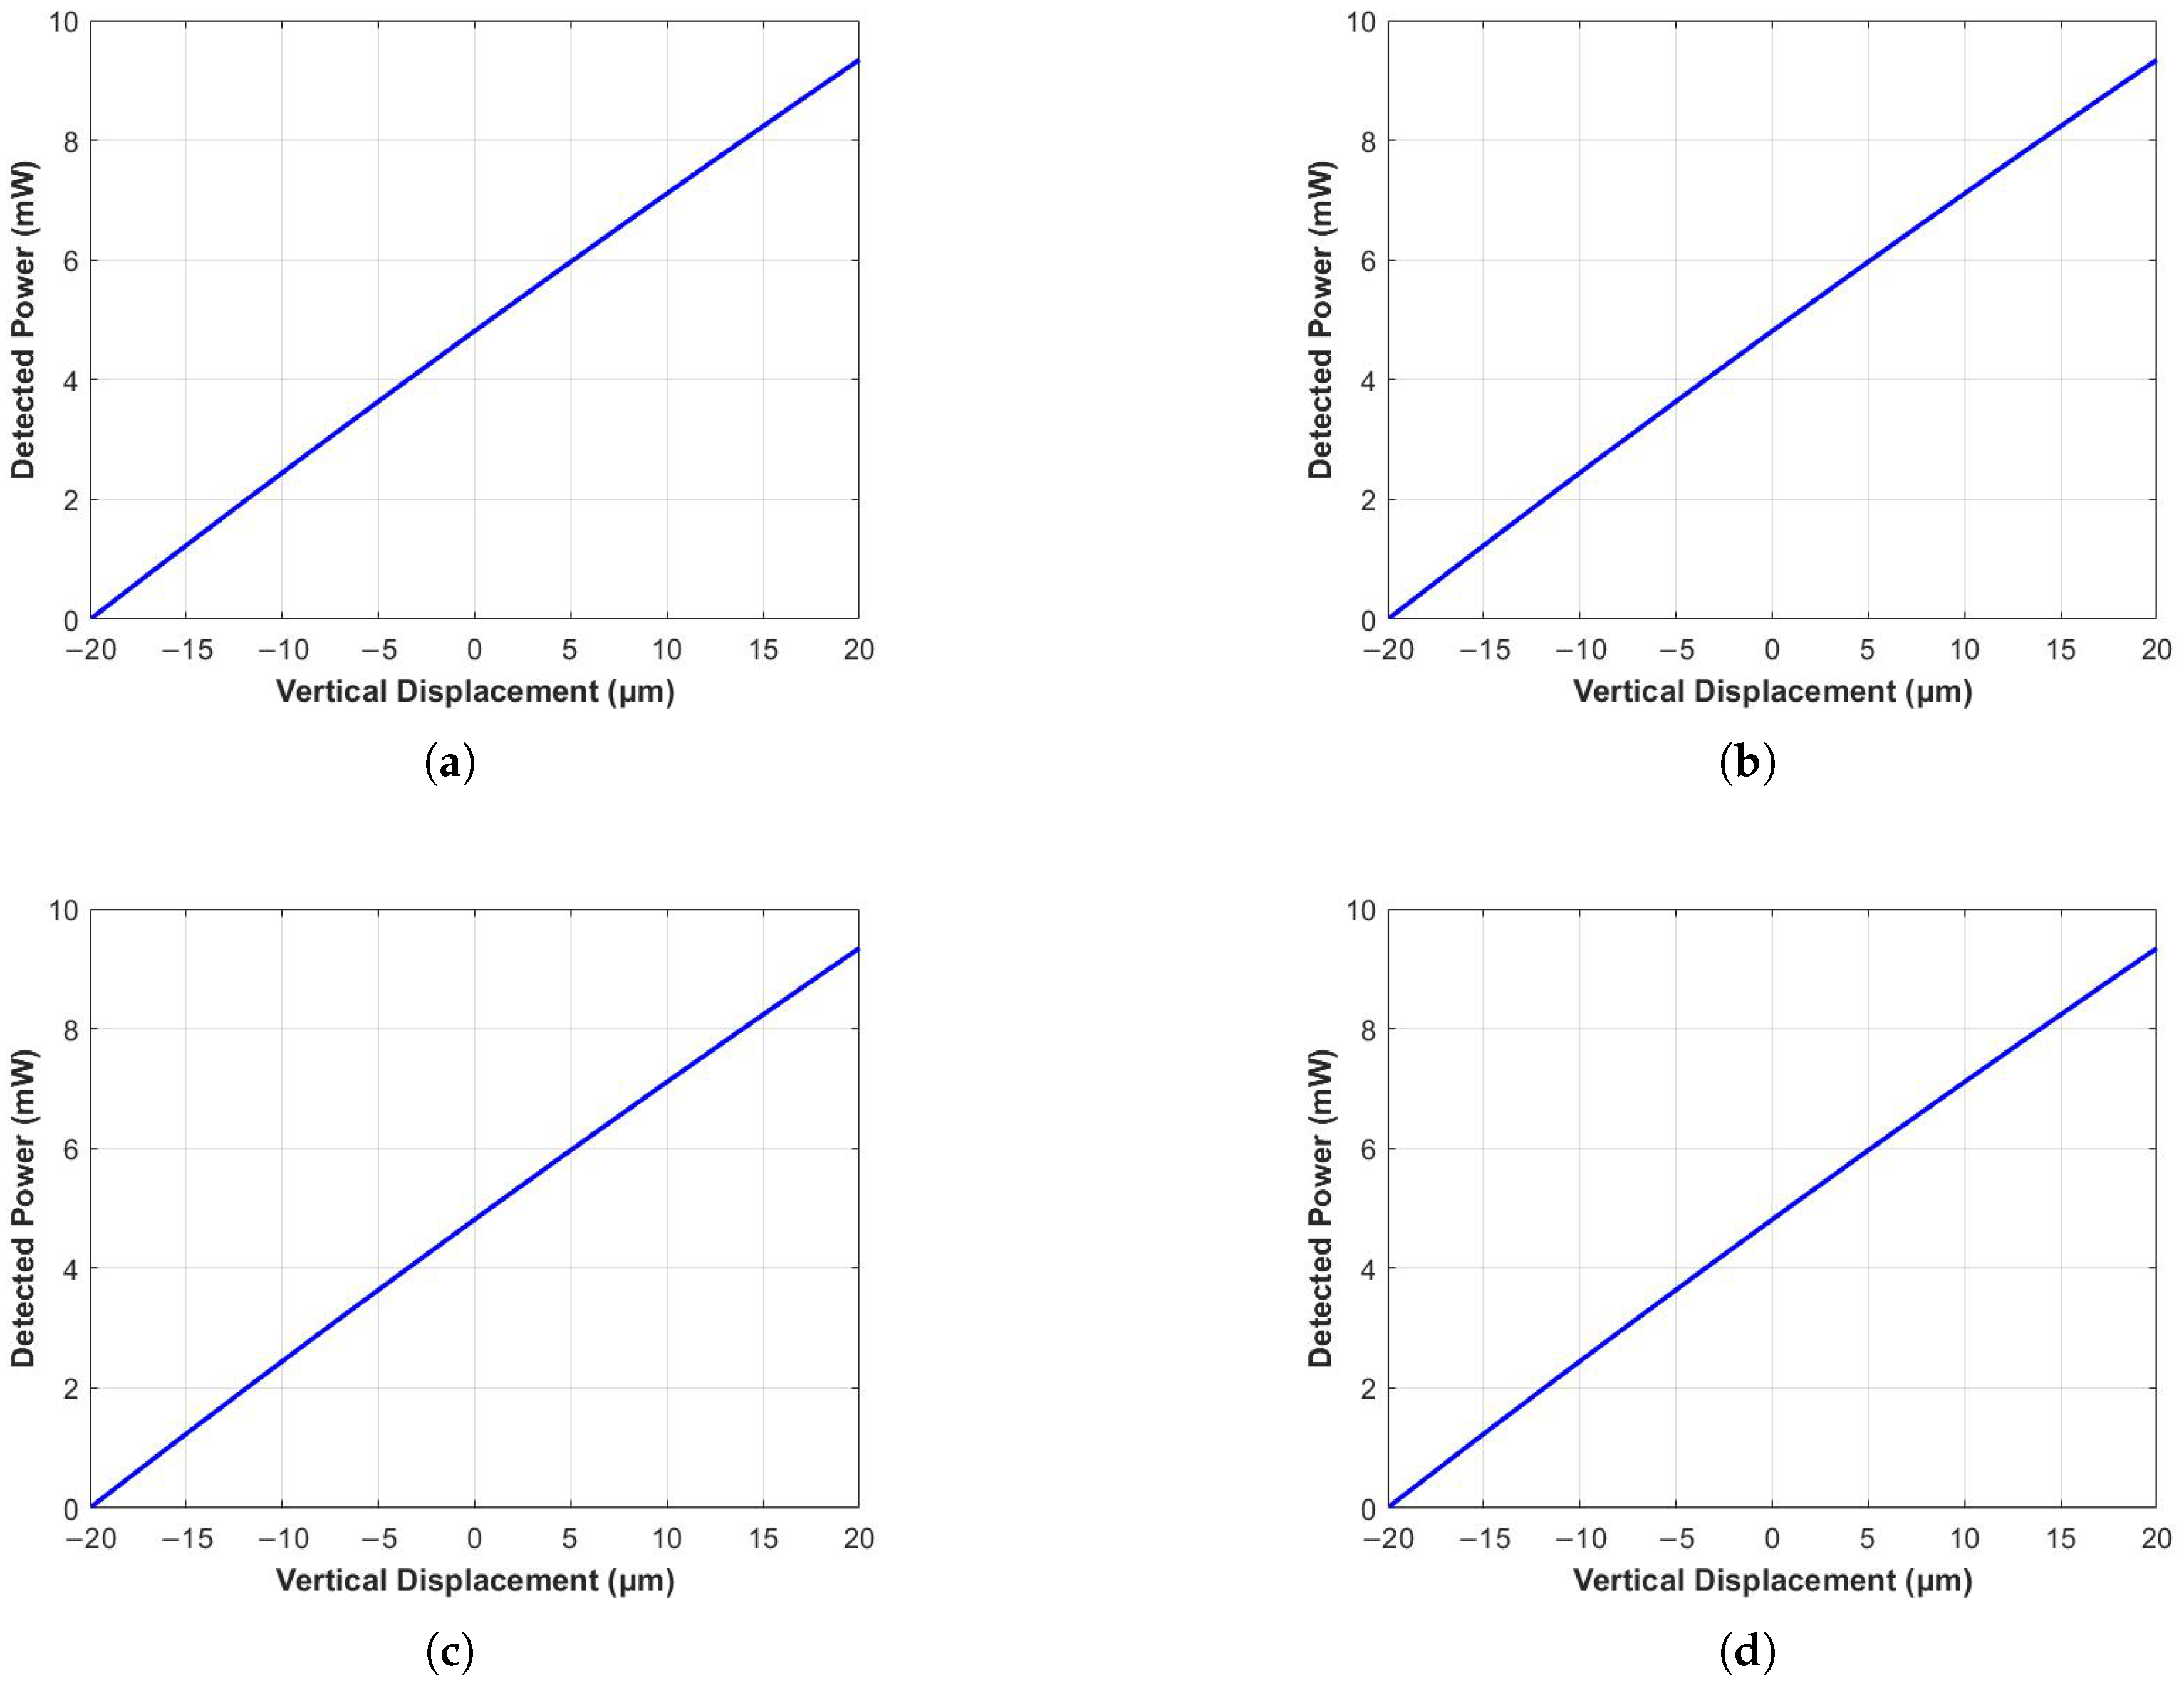
3.3. Optical Sensitivity

To estimate the lateral optical sensitivity of the design, we first plotted the change in power detected by each of the four quadrants as the proof mass is displaced laterally. As shown in Figure 6, the power decreases in quadrants 1 and 2 accompanied by an increase in power detected by quadrants 3 and 4, indicating the lateral motion of the proof mass.
While the lateral optical behavior is non-linear and is given by the model developed by Moreno [38], a linear fit was applied to the detected power data in Quadrant 1 to define the lateral sensitivity. The best fit straight line is of the following form:
P ( w ) = 0.12227 w + 5.17835 ( mW ) ,
where w is the lateral displacement in micrometers. Ignoring the sign, this implies lateral optical sensitivity S O L = 0.122 mW/µm for each quadrant.
We also examined the vertical optical sensitivity of the design using the same approach. Notice that, as shown in Figure 7, the detected power in this case either decreases or increases uniformly over the four quadrants. The best-fit equation for power variation is
P ( w ) = 0.233 w + 4.769 ( mW ) ,
implying a vertical optical sensitivity S O V of 0.233 mW/µm per quadrant.

3.4. Total Sensitivity

As explained above, total sensitivity is obtained by multiplying the mechanical sensitivity of the proof mass (in µm/g) by the optical sensitivity (in mW/µm) and then by the photodetector’s responsivity. To account for the wavelength dependence of the employed QPD, an effective responsivity is obtained by taking a weighted average of the QPD’s spectral responsivity where the weights are given by the fraction of the LED’s radiation emitted in this specific wavelength region. Carrying out this weighted average, we obtain a value for the effective responsivity R e f f = 0.62 , close to its maximum value of 0.64. This is not surprising because the maximum responsivity of the QPD is closely aligned with the peak wavelength of the LED. Consequently, the total lateral sensitivity of each quadrant can be calculated as
S L = S M l × S O l × R e f f = 0.186 mA / g
Similarly, the total vertical sensitivity of each quadrant can be obtained as
S V = S M V × S O V × R e f f = 0.52 mA / g

3.5. Thermal Noise

To estimate the effect of thermal noise on the mechanical performance, we translate the thermal energy into a noise equivalent RMS acceleration following the procedure in the Methods Section above. For our system, m = 60 µg, ω 0 , V = 531 π rad/s and ω 0 , L = 630 π rad/s. Substitute these numbers at room temperature T = 300k, and take the RMS noise equivalent acceleration to be 44 µG for the vertical mode and 52 µG for the lateral mode. Since our accelerometer is meant to operate tri-axially, we take the more pessimistic value of 52 µG as the thermal noise floor. Although this noise floor sets the limit on the smallest acceleration difference that could ultimately be resolved by the mass-spring system under consideration, the practical resolution will be limited by the interface circuitry when the full device is assembled.

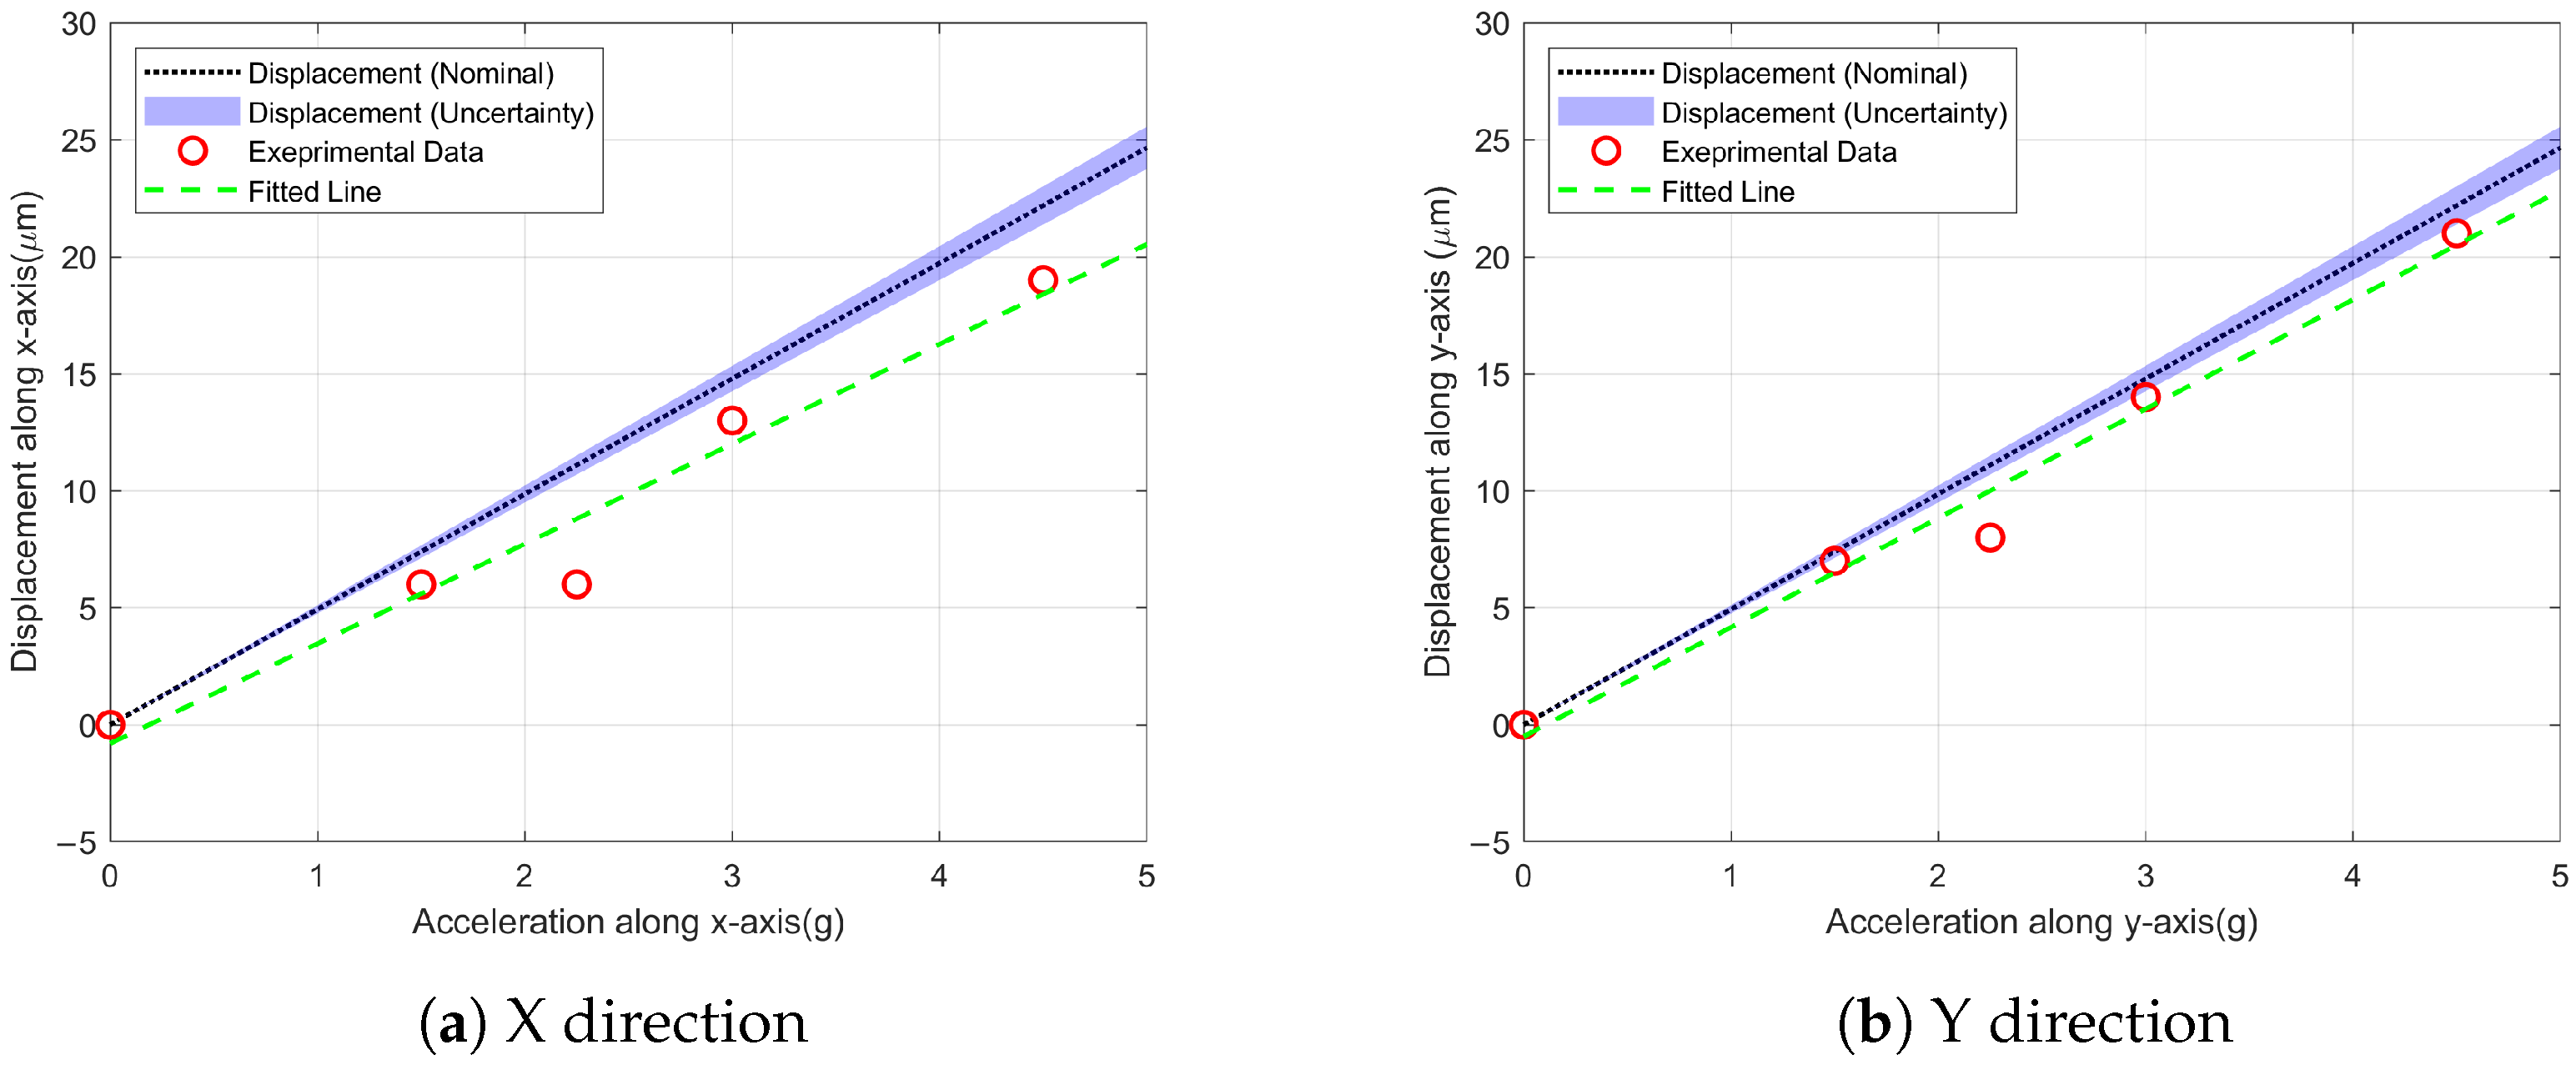
3.6. Experimental Results

The lateral sensitivity of the fabricated mechanical system was tested using the experimental setup explained earlier. Acceleration values from the used mechanical vibrator were pre-calibrated so that displacement could be obtained for specific applied accelerations. Figure 8 shows the results of the measurements of lateral displacement vs. applied acceleration along the x and y directions. The sensitivity, obtained from the slope of the line that best fits the data, was found to be 2.13 µm/g for the x direction and 2.33 µm/g for the y direction. The slight discrepancy between both directions, despite the symmetry of the design, could be a result of measurement errors or fabrication imperfections.

4. Discussion and Conclusions

An optical accelerometer capable of tri-axial acceleration sensing through the modulation of light intensity reaching a quadrant photodetector is studied. The MEMS die corresponding to the mechanical mass-spring system was fabricated and tested. Finite element simulations of the mechanical system indicated a nominal lateral mechanical sensitivity of 2.46 µm/g and a vertical sensitivity of 3.6 µm/g. Experimentally, a mechanical sensitivity of approximately 2.13 µm/g was obtained for the x direction, with a 13.4% deviation from the nominal finite element result. Similarly, the mechanical sensitivity along the y axis was experimentally found to be approximately 2.33 µm/g, even closer to the theoretical expectation. When uncertainties associated with fabrication tolerances are included the deviation from the model drops to 10.5% for the x direction and 2% for the y direction. The difference between the x and y directions could reflect errors associated with the measurement procedure or fabrication errors. On the other hand, the difference between lateral and vertical sensitivities is a result of the chosen spring layout and proof-mass suspension geometry. The thickness of the springs, which determines the stiffness experienced by the proof mass under vertical motion, is limited by the thickness of the device layer in the fabrication process. Similarly, the minimum width of the springs cannot fall below the process critical dimensions. While equal sensitivity along all axes can be important for certain applications, such as inertial navigation, in many others this is not a strict requirement. The off-axis cancellation ratios, on the order of 10 5 , reveal good cross-axis isolation, ensuring that the device predominantly responds to acceleration along its intended axis. Rotational and off-axis movements were studied through analyzing the mode shapes of the mass-spring system’s natural frequencies and were shown to occur at much higher resonance frequencies, showing robustness against these motions.
Our work demonstrates the feasibility of a fiber-free optical MEMS accelerometer for three-dimensional inertial sensing based on the proposed mechanism. It addresses several challenges not only inherent in traditional piezo-electric, piezo-resistive, and capacitive accelerometers, such as low-frequency cutoffs and electromagnetic interference, but also those associated with optical accelerometers that depend on fiber-optic configurations and require complex digital signal processing (DSP) to interpret interferometric signals. In conventional optical sensors, precise fiber alignment is critical for maintaining signal fidelity, and even minor misalignments can result in significant sensitivity degradation. Moreover, these systems often rely on bulky and expensive spectrometers or interferometric setups for accurate signal readout, further complicating integration and increasing cost. By eliminating the need for fiber coupling and adopting a simplified intensity-modulation-based optical approach, our design overcomes these issues, reducing system complexity while preserving high sensitivity and immunity to EMI. This integrated approach not only enhances robustness and reliability but also paves the way for compact, cost-effective accelerometers suitable for a wide range of applications.

Author Contributions

Conceptualization, S.A. and N.G.; design, S.A. and A.T.; COMSOL simulation, S.A. and A.H.E.; MATLAB analysis, S.A., A.T. and A.H.E.; experimental analysis, S.A., A.H.E. and N.G.; investigation, A.H.E., S.A., A.T. and N.G.; writing—original draft preparation, A.H.E.; writing—review and editing, A.H.E., M.A.M. and N.G.; supervision, N.G.; project administration, N.G.; funding acquisition, M.A.M. and N.G. All authors have read and agreed to the published version of the manuscript.

Funding

The internal fund of Zewail City of Science and Technology (ZC), Egypt, grant number ZC 009-2019.

Institutional Review Board Statement

Not applicable.

Informed Consent Statement

Not applicable.

Data Availability Statement

Data can be made available upon request.

Conflicts of Interest

The authors declare no conflicts of interest.

References

  1. Finkbeiner, S. MEMS for automotive and consumer electronics. In Proceedings of the 2013 Proceedings of the ESSCIRC (ESSCIRC), Bucharest, Romania, 16–20 September 2013; pp. 9–14. [Google Scholar]
  2. Leclerc, J. MEMs for aerospace navigation. IEEE Aerosp. Electron. Syst. Mag. 2007, 22, 31–36. [Google Scholar] [CrossRef]
  3. Ompusunggu, A.P.; Eryılmaz, K.; Janssen, K. Condition monitoring of critical industrial assets using high performing low-cost MEMS accelerometers. Procedia CIRP 2021, 104, 1389–1394. [Google Scholar] [CrossRef]
  4. Lee, H.J.; Park, D.J. Analysis of thermal characteristics of MEMS sensors for measuring the rolling period of maritime autonomous surface ships. J. Mar. Sci. Eng. 2022, 10, 859. [Google Scholar] [CrossRef]
  5. Di Nuzzo, F.; Brunelli, D.; Polonelli, T.; Benini, L. Structural health monitoring system with narrowband IoT and MEMS sensors. IEEE Sens. J. 2021, 21, 16371–16380. [Google Scholar] [CrossRef]
  6. Algamili, A.S.; Khir, M.H.M.; Dennis, J.O.; Ahmed, A.Y.; Alabsi, S.S.; Ba Hashwan, S.S.; Junaid, M.M. A review of actuation and sensing mechanisms in MEMS-based sensor devices. Nanoscale Res. Lett. 2021, 16, 1–21. [Google Scholar] [CrossRef]
  7. Bu, K.; Li, C.; Xue, H.; Li, B.; Zhao, Y. A 14 μHz/ Hz resolution and 32 μHz bias instability MEMS quartz resonant accelerometer with a low-noise oscillating readout circuit. Microsyst. Nanoeng. 2024, 10, 200. [Google Scholar] [CrossRef]
  8. Fiorillo, A.; Critello, C.; Pullano, S. Theory, technology and applications of piezoresistive sensors: A review. Sens. Actuators A Phys. 2018, 281, 156–175. [Google Scholar] [CrossRef]
  9. D’Alessandro, A.; Scudero, S.; Vitale, G. A Review of the Capacitive MEMS for Seismology. Sensors 2019, 19, 3093. [Google Scholar] [CrossRef]
  10. Medina, N.; De Vicente, J. Force Sensor Characterization Under Sinusoidal Excitations. Sensors 2014, 14, 18454–18473. [Google Scholar] [CrossRef]
  11. Qi, Y.; Zhao, M.; Xie, Z.; Zhang, X.; Ou, Y.; Wang, H.; Jiang, Z.; Wei, X. Fiber Fabry-Perot accelerometer with extended dynamic range and low noise floor. Opt. Express 2024, 32, 37946–37958. [Google Scholar] [CrossRef]
  12. Krishnamoorthy, U.; Olsson Iii, R.; Bogart, G.R.; Baker, M.; Carr, D.; Swiler, T.; Clews, P. In-plane MEMS-based nano-g accelerometer with sub-wavelength optical resonant sensor. Sens. Actuators A Phys. 2008, 145, 283–290. [Google Scholar] [CrossRef]
  13. Zhao, M.; Qi, Y.; Wang, H.; Xie, Z.; Li, B.; Wang, H.; Wei, X. Optical interferometric MEMS accelerometers. Laser Photon. Rev. 2024, 18, 2300713. [Google Scholar] [CrossRef]
  14. Nguyen, T.T.V.; Le, H.D.; Hsu, H.C.; Nguyen, C.N.; Chiang, C.C. A symmetrical dual-mass block fiber Bragg grating vibration sensor based on a V-shaped flexible hinge. Sens. Actuators A Phys. 2023, 364, 114815. [Google Scholar] [CrossRef]
  15. Xin, C.; Xu, Y.; Zhang, Z.; Li, M. Micro-Opto-Electro-Mechanical Systems for High-Precision Displacement Sensing: A Review. Micromachines 2024, 15, 1011. [Google Scholar] [CrossRef]
  16. Li, G.; Cai, C.; Zhang, Y.; Deng, X.; Lin, L.; Xiao, W. High Sensitivity Optical MEMS Accelerometer Based on a Metal Fabry-Pérot Micro-Cavities Wavelength Modulation System. IEEE Sens. J. 2024, 24, 4304–4314. [Google Scholar] [CrossRef]
  17. Zhao, M.; Jiang, K.; Bai, H.; Wang, H.; Wei, X. A MEMS based Fabry–Pérot accelerometer with high resolution. Microsyst. Technol. 2020, 26, 1961–1969. [Google Scholar] [CrossRef]
  18. Park, Y.J.; Her, M.J.; Jeong, Y.; Choi, D.J.; Kim, D.U.; Lim, M.G.; Hong, M.S.; Kwon, H.S.; Yu, K.; Han, S. Fully tunable Fabry-Pérot cavity based on MEMS Sagnac loop reflector with ultra-low static power consumption. Microsyst. Nanoeng. 2024, 10, 119. [Google Scholar] [CrossRef]
  19. Li, Y.; Chen, F.; Guo, T.; Wang, R.; Qiao, X. Sensitivity enhancement of fiber Bragg grating accelerometer based on short grating. IEEE Trans. Instrum. Meas. 2021, 71, 7001705. [Google Scholar] [CrossRef]
  20. Wang, H.; Liang, L.; Zhou, X.; Tu, B. New fiber Bragg grating three-dimensional accelerometer based on composite flexure hinges. Sensors 2021, 21, 4715. [Google Scholar] [CrossRef]
  21. Li, Z.; Li, X.; Chen, D.; Zhang, S.; Xian, C.; Kuang, P.; Wang, Y.; Chen, K.; Qiu, G.; Deng, G.; et al. A chip-scale silicon cavity optomechanical accelerometer with extended frequency range. IEEE Sens. J. 2024, 24, 31849–31859. [Google Scholar] [CrossRef]
  22. Tan, H.; Pan, D.; Wang, C.; Yao, Y. Silicon-Based Zipper Photonic Crystal Cavity Optomechanical System for Accelerometers. Micromachines 2023, 14, 1870. [Google Scholar] [CrossRef] [PubMed]
  23. Malayappan, B.; Lakshmi, U.P.; Rao, B.P.; Ramaswamy, K.; Pattnaik, P.K. Sensing techniques and interrogation methods in optical MEMS accelerometers: A review. IEEE Sens. J. 2022, 22, 6232–6246. [Google Scholar] [CrossRef]
  24. Reschovsky, B.J.; Long, D.A.; Zhou, F.; Bao, Y.; Allen, R.A.; LeBrun, T.W.; Gorman, J.J. Intrinsically accurate sensing with an optomechanical accelerometer. Opt. Express 2022, 30, 19510–19523. [Google Scholar] [CrossRef] [PubMed]
  25. Wang, P.; Li, T.; Lin, H.; Zhao, P.; Liu, S.; Tam, H.Y.; Zhang, A.P. Miniature Optical Fiber Accelerometer Based on an In-situ 3D Microprinted Ferrule-top Fabry–Pérot Microinterferometer. Light Adv. Manuf. 2025, 6, 152–160. [Google Scholar] [CrossRef]
  26. Xin, C.; Zhang, Z.; Wang, X.; Fan, C.; Li, M. Ultracompact single-layer optical MEMS accelerometer based on evanescent coupling through silicon nanowaveguides. Sci. Rep. 2022, 12, 21697. [Google Scholar] [CrossRef]
  27. Barbin, E.; Nesterenko, T.; Koleda, A.; Shesterikov, E.; Kulinich, I.; Kokolov, A.; Perin, A. The Design, Modeling and Experimental Investigation of a Micro-G Microoptoelectromechanical Accelerometer with an Optical Tunneling Measuring Transducer. Sensors 2024, 24, 765. [Google Scholar] [CrossRef]
  28. Long, D.; Stroud, J.; Reschovsky, B.; Bao, Y.; Zhou, F.; Bresler, S.; LeBrun, T.; Plusquellic, D.; Gorman, J. High accuracy, high dynamic range optomechanical accelerometry enabled by dual comb spectroscopy. APL Photon. 2023, 8, 091302. [Google Scholar] [CrossRef]
  29. Li, C.; Yang, B.; Zheng, X.; Sun, Z.; Zhou, L.; Huang, X.; Guo, X. An Optical Interferometry Based MEMS Accelerometer Applicable to Seismic-Grade Measurement. IEEE Trans. Instrum. Meas. 2022, 71, 7503810. [Google Scholar] [CrossRef]
  30. Zhou, Y.; Cao, H.; Guo, T. A hybrid algorithm for noise suppression of MEMS accelerometer based on the improved VMD and TFPF. Micromachines 2022, 13, 891. [Google Scholar] [CrossRef]
  31. Jin, L.; Xie, K.; Du, Y.; Li, M. Linearization signal conditioning circuit for tri-axial micro-grating MOEMS accelerometer. Opt. Express 2024, 32, 10241–10251. [Google Scholar] [CrossRef]
  32. Wang, C.; Cui, Y.; Liu, Y.; Li, K.; Shen, C. High-G MEMS accelerometer calibration denoising method based on EMD and time-frequency peak filtering. Micromachines 2023, 14, 970. [Google Scholar] [CrossRef] [PubMed]
  33. Abozyd, S.; Toraya, A.; Gaber, N. Design and Modeling of Fiber-Free Optical MEMS Accelerometer Enabling 3D Measurements. Micromachines 2022, 13, 343. [Google Scholar] [CrossRef] [PubMed]
  34. AboZyd, S.; Toraya, A.; Gaber, N. Tri-axial optical MEMS accelerometer enables monolithic fabrication. In Proceedings of the MOEMS and Miniaturized Systems XXI, San Francisco, CA, USA, 22–27 January 2022; Zappe, H., Piyawattanametha, W., Park, Y.H., Eds.; International Society for Optics and Photonics, SPIE: Bellingham, WA, USA, 2022; Volume 12013, p. 120130K. [Google Scholar] [CrossRef]
  35. ORSAM Opto Semiconductors SFH 4770S, IR SYNIOS P2720 (850 Nm)—120∘. Available online: https://docs.rs-online.com/5c87/0900766b814deb8f.pdf (accessed on 20 February 2025).
  36. QP5.8-6 TO, Quadrant Photodetector Data Sheet, First Sensor. Available online: https://www.mouser.com/datasheet/2/313/QP5.8-6_TO_501254-586546.pdf (accessed on 20 February 2025).
  37. Cowen, A.; Hames, G.; Monk, D.; Wilcenski, S.; Hardy, B. SOIMUMPs Design Handbook; MEMSCAP: Durham, NC, USA, 2011; Volume 6. [Google Scholar]
  38. Moreno, I. LED irradiance pattern at short distances. Appl. Opt. 2020, 59, 190–195. [Google Scholar] [CrossRef] [PubMed]
Figure 1. Structure of the proposed design consisting of a suspended proof mass capable of moving tri-axially between an LED and a quadrant photodetector.
Chips 04 00028 g001
Figure 2. Structure of the fabricated mass-spring system.
Chips 04 00028 g002
Figure 3. Mechanical sensitivity experimental setup and the mounted die.
Chips 04 00028 g003
Figure 4. The relationship between the displacement and the applied acceleration in both vertical and lateral directions from the finite element model.
Chips 04 00028 g004
Figure 5. The resonance frequencies of the mechanical system: (a) mode 1 corresponds to vertical movement with a resonance frequency of 265 Hz; (b) mode 2 corresponds to lateral movement with a resonance frequency of 315 Hz; (c) mode 3 corresponds to rotational movement with a resonance frequency of 679 Hz; (d) mode 4 corresponds to off-axis movement with a resonance frequency of 681 Hz.
Chips 04 00028 g005
Figure 6. Variation in detected power with lateral acceleration for each of the four quadrants of the photodetector: (a) Quadrant 1 (upper-left quadrant). (b) Quadrant 2 (upper-right quadrant). (c) Quadrant 3 (lower-left quadrant). (d) Quadrant 4 (lower-right quadrant).
Chips 04 00028 g006
Figure 7. Variation in detected power with vertical acceleration for each of the four quadrants of the photodetector: (a) Quadrant 1 (upper-left quadrant). (b) Quadrant 2 (upper-right quadrant). (c) Quadrant 3 (lower-left quadrant). (d) Quadrant 4 (lower-right quadrant).
Chips 04 00028 g007
Figure 8. Comparison of the experimental and simulated displacement along the (a) x direction and (b) y direction.
Chips 04 00028 g008
Disclaimer/Publisher’s Note: The statements, opinions and data contained in all publications are solely those of the individual author(s) and contributor(s) and not of MDPI and/or the editor(s). MDPI and/or the editor(s) disclaim responsibility for any injury to people or property resulting from any ideas, methods, instructions or products referred to in the content.

