1. Introduction
Illinois is one of the largest agricultural producing states in the country, producing mainly corn and soybeans, but also a variety of other crops. This is because of its geographic location: a relatively flat landscape and fertile soils make it perfect for agricultural production. With Illinois being a longitudinal state, meaning its northern to southern borders are longer than its western to eastern borders, it has a diverse growing season. Temperatures can vary from northern to southern sections by as much as 10 °F and the onset of the growing season can be a week or more different.
Along with six other states (Indiana, Iowa, Michigan, Minnesota, Ohio, and Wisconsin), Illinois creates what is considered the Corn Belt; however, this area offers a diversity in agricultural production that is beyond corn and soybeans [
1]. The demand for agriculture has been rising for decades. Corn production has been on the rise since the 1970s due to the rising demand for animal feed, biofuels, and human food production [
2]. For example, the acreage of corn and soybeans roughly doubled in Iowa and Illinois between 1940 and 2011 [
3]. In recent years, agricultural land has not increased with this demand. Farmers are simply planting more plants per acre than ever before. From 1971 to 2014, the average yearly increase in corn yield was 1.4 bushels per year, which grew to 4.3 bushels per year by 2014–2020 [
2]. In 1970, Illinois farms produced 75 bushels of corn per acre, which increased to 217 bushels per acre in 2024 [
2]. In 1970, soybeans were yielding around 30 bushels per acre, which more than doubled to 64 bushels per acre by 2024 (
Figure 1).
Corn production in Illinois is second in the nation with 202.0 bushels per acre in 2021. Illinois is also second in the nation for harvested acres at 10,850 harvested acres in 2021 [
4]. According to the Illinois Department of Agriculture (IDA), Illinois had 72,000 farms in 2019. These farms account for 75 percent of the land cover in Illinois; Illinois is also the nation’s leader in ethanol production. Each year, 274 million bushels of corn in Illinois are used to produce about 678 million gallons of ethanol, more than any other state [
5].
From 1700 to 2000, between 42% and 68% of the global land surface was altered through human activities such as cropland and pasture expansion and wood harvest [
6]. From satellite imagery, it is estimated that 12 percent of the planet’s surface has been transformed into cropland, an area roughly the size of South America [
7], which has impacts on soil moisture and can also affect weather and climate through the influence of heat transfer, moisture, and momentum of air over land. Another study supports this showing that general circulation modes (GCMs) suggest different land cover or soil moistures impact temperature, stability, moisture, and vertical motion characteristics of the planetary boundary layer (PBL) [
8].
Changes in agricultural practices have been found to impact atmospheric humidity [
9]. When examining the growing season from May through September, there was an overall increase in dew point temperatures compared to early (1956–1985) and late (1986–2016) years [
9]. Furthermore, the largest and most significant increases occurred within the Midwest Corn Belt, particularly in the Upper Midwest stations located immediately north of the corn belt [
9]. Additional studies support this finding. Dew points between 1976 and 2004 show increases of 0.5–2.0% per decade [
10]. High-dew-point days have also increased during the period from 1960 to 2000, likely due to the increase in plant density from earlier decades, which enhances the transpiration of water from the soil to the atmosphere [
10]. Growing season lengths are also increasing. Between 1899 and 1992, the increase was on average 14 days, and the growing season in Illinois from 1906 to 1997 increased nearly a week [
10].
Changes in land cover around the globe have been shown to affect precipitation. For example, afternoon precipitation between 1850 and the present increased significantly over the Great Plains due to land cover change [
6]. Chen et al. (2017) concluded that increased latent heat flux due to agriculture can “pump” more moisture into the atmosphere to trigger precipitation [
6]. Water vapor changes in India from a pre-agricultural and contemporary land cover showed an increase in the mean annual vapor fluxes of 17%, with a 7% increase in the wet season and a 55% increase in the dry season [
11]. The water vapor added to the atmosphere and possible increased dew point could result in more precipitation and thunderstorms. Pielke and Avisar (1990) found that severe thunderstorms were more likely over irrigated areas than over prairie land, since the added water vapor provides much greater buoyant energy for cumulus cloud convection [
12]. They also found that biometeorological heat load can be higher because of the higher relative humidity [
12].
Given the results of previous work that have found an increase in humidity in agricultural areas, this study set out to determine if a similar change is experienced in Illinois. To determine if the water vapor coming from corn is changing the atmosphere, the dew point should be evaluated. Dew point is the temperature the air needs to be cooled to at a constant pressure to achieve 100 percent humidity. When the air is cooled below the dew point, the airborne water vapor will condense or undergo deposition. The higher the dew point, the more oppressive and humid the atmosphere will feel. A dew point above 60 °F makes for a very humid uncomfortable atmosphere and any dew point over 70 °F is considered dangerous. These changes in dew point could lead to instability in the atmosphere during the hottest part of the year in the Midwestern United States and produce thunderstorms.
The purpose of this study was to examine the change in dew point and temperature using data from 58 automated surface observing systems (ASOSs) and automated weather observing stations (AWOSs) during the growing season (May through September) in Illinois over a period of 18 years (2005–2022) across different land cover, as determined by 30 m crop layer data. The work focused on the middle portion of the growing season from 21 June through 10 August, when corn growth is at its peak and evapotranspiration is at its highest. The study set out to answer two questions.
First, is there a change in dew points and temperature, and if so, is this change greater in cultivated agricultural areas versus other areas?
Second, is there a larger change between the three periods of the growing season or northern Illinois versus southern Illinois?
2. Materials and Methods
The methodology for this paper uses portions of two previous papers by Chapman and Carleton (2021) [
8] and Hill et al. (2019) [
9]. Similar to Chapman and Carleton (2021) [
8], the five-month growing season of May–September is split into three periods. Period #1 is the early growing season and covers 1 May–20 June. Period #2 is the focus of this study, the mid-season when evapotranspiration is at its peak, and is 21 June–10 August. Period #3 is the late growing season and is 11–30 September. Like Hill et al. (2019) [
9], we use ASOSs/AWOSs throughout Illinois as a source for dew point data for the 18-year period 2005–2022.
The data used were collected from the Iowa Environmental Mesonet archive of ASOS/AWOS data for 58 Illinois stations [
13]. These stations are the primary source of hourly surface observation data in the United States [
14]. Hourly dew points and temperature readings were collected from 1 May to 30 September between 2005 and 2022, for a total of 18 years/growing seasons. From the hourly data, average high and low temperature, average dew point temperature high and low, minimum temperature and dew point, and maximum temperature and dew point were determined.
To determine land cover for the state of Illinois, the 30 m crop data layer was used from the United States Department of Agriculture [
15]. This crop data layer was imported into ESRI ArcMap 10.8.2. Using shapefiles for Illinois, Indiana, Iowa, Kentucky, Missouri, and Wisconsin [
16,
17,
18,
19,
20,
21], each state was then clipped to the crop data layer. This created a map of the study area (Illinois) and surrounding states. The data for surrounding states were needed when constructing the buffer, as described below.
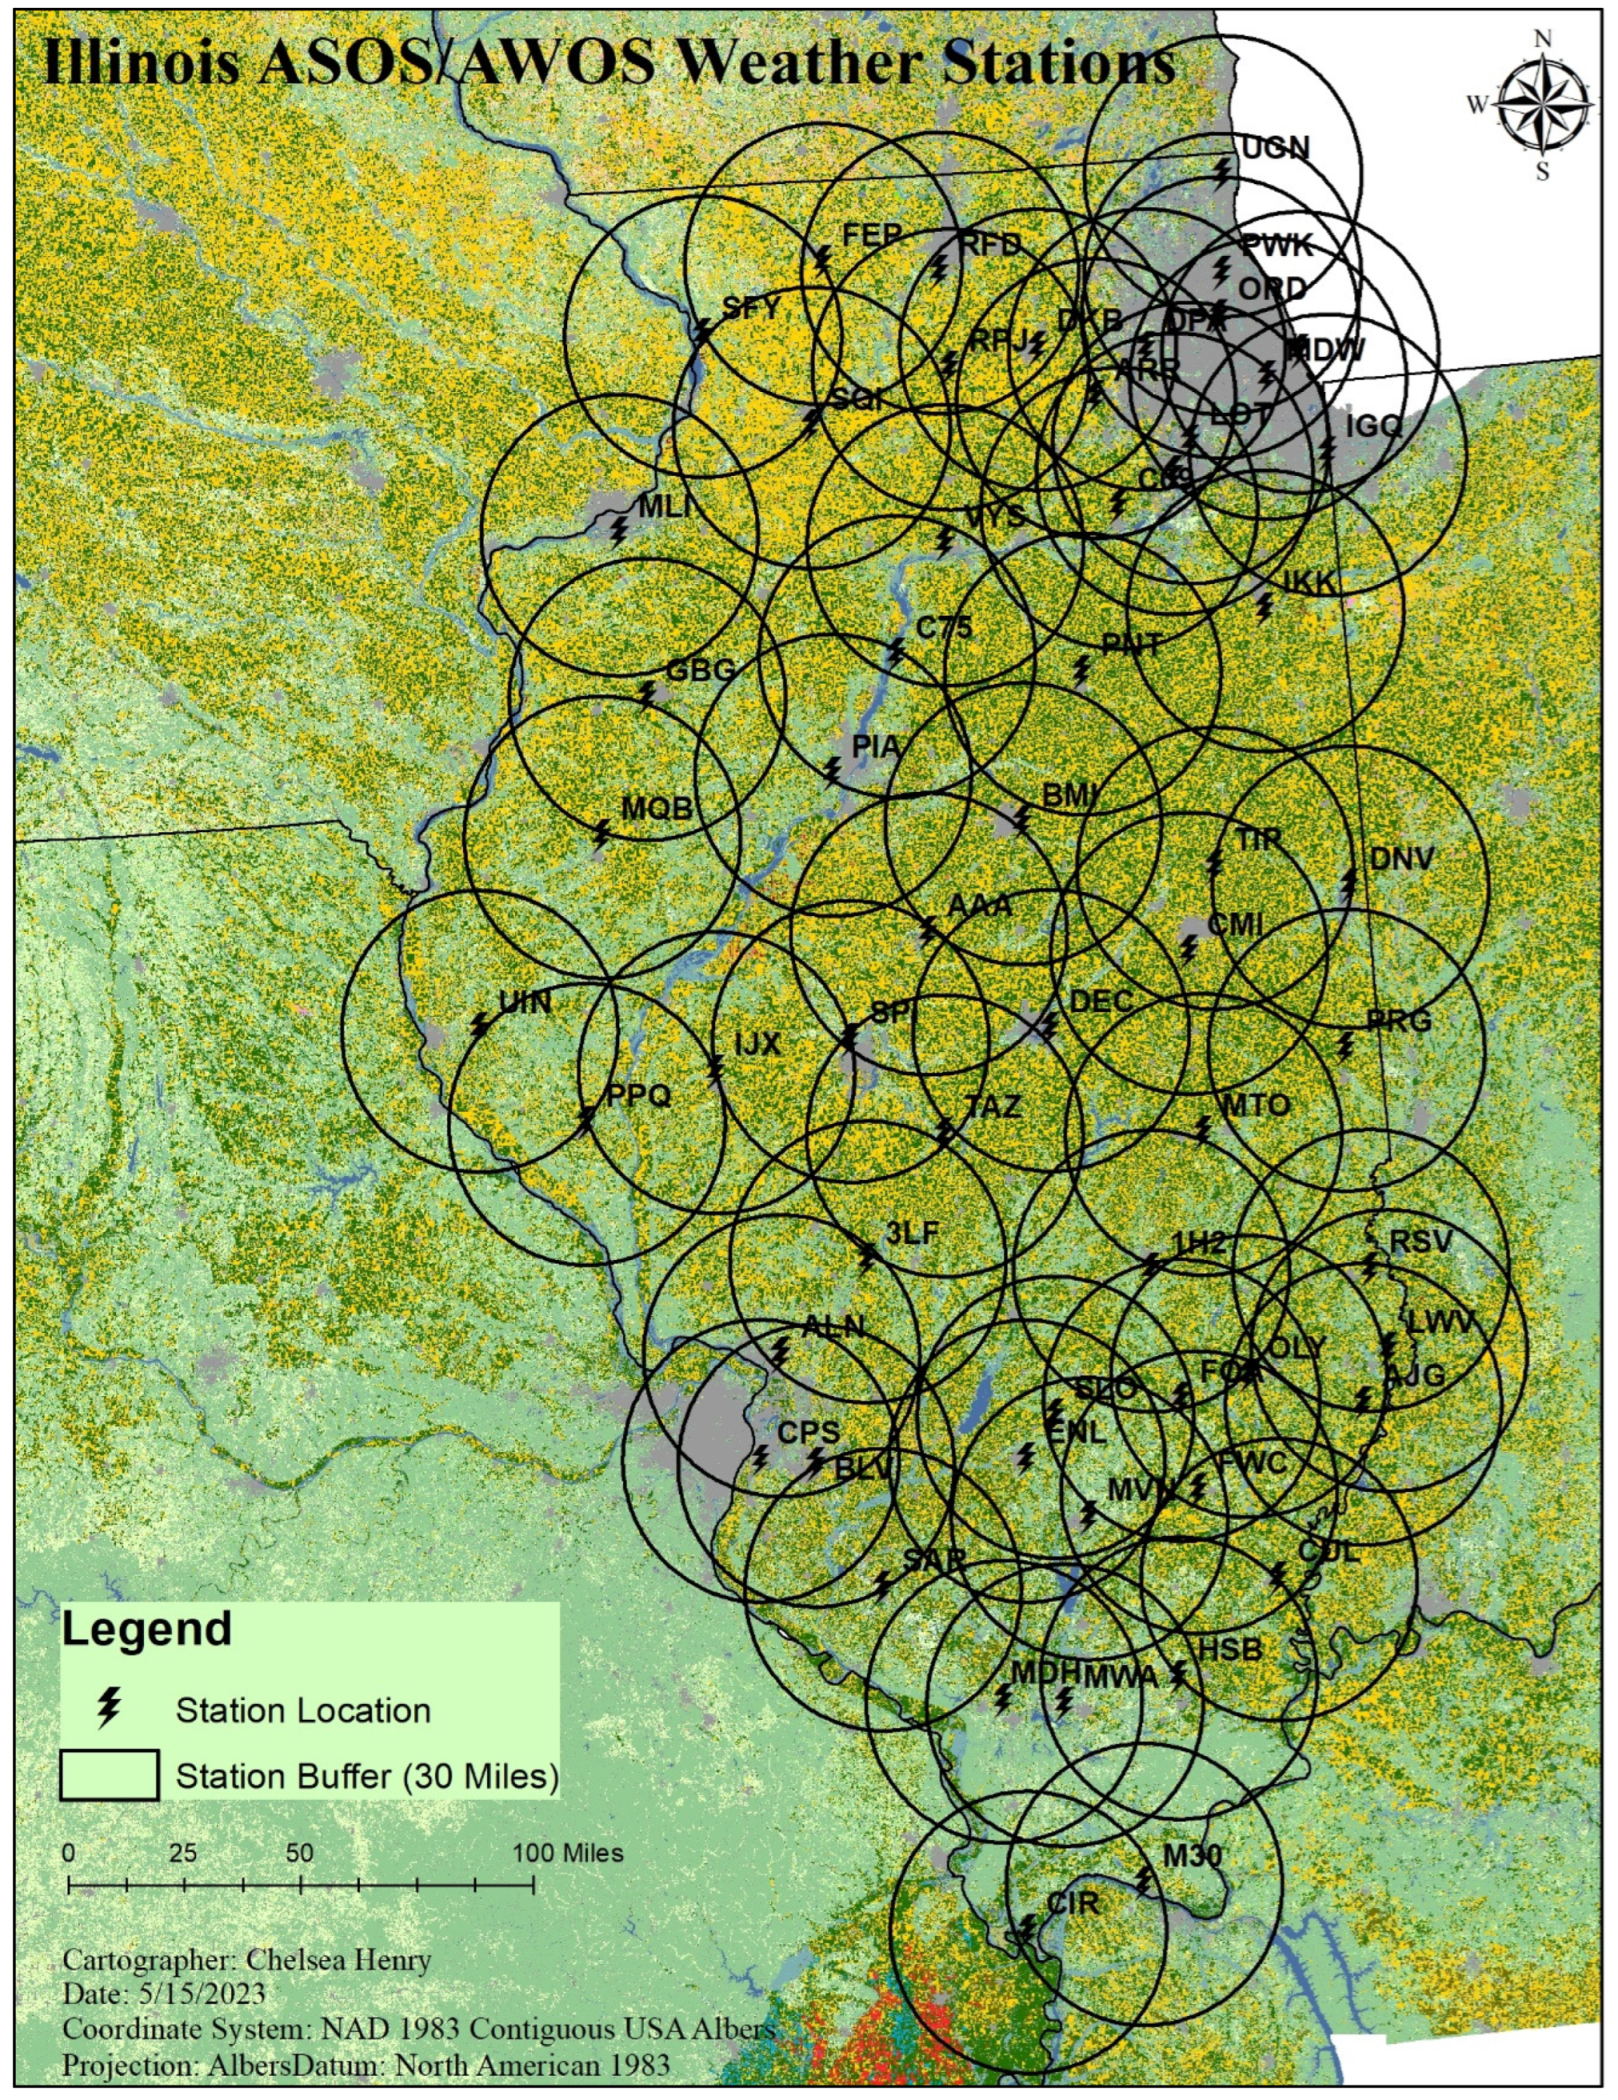
The location of each ASOS/AWOS was plotted on a map using the latitude and longitude of the station [
22]; a 30-mile buffer was then constructed around each station location (
Figure 2). The 30-mile buffers were used because according to the ASOS User’s Guide, lightning can be detected up to 30 miles from the station [
14]. This criterion was selected because future work will explore the connection between land cover, dew point, and lightning. These buffers were used to determine the land cover classification for each station.
Once the station points and buffers were in place, the land cover within the buffer had to be isolated. This was done through the spatial analyst tools in ArcMap using the extraction by mask. Each pixel in the buffer/extract is classified as a certain feature in the crop data layer. Over two hundred classifications were combined into seven categories, as shown in
Table 1.
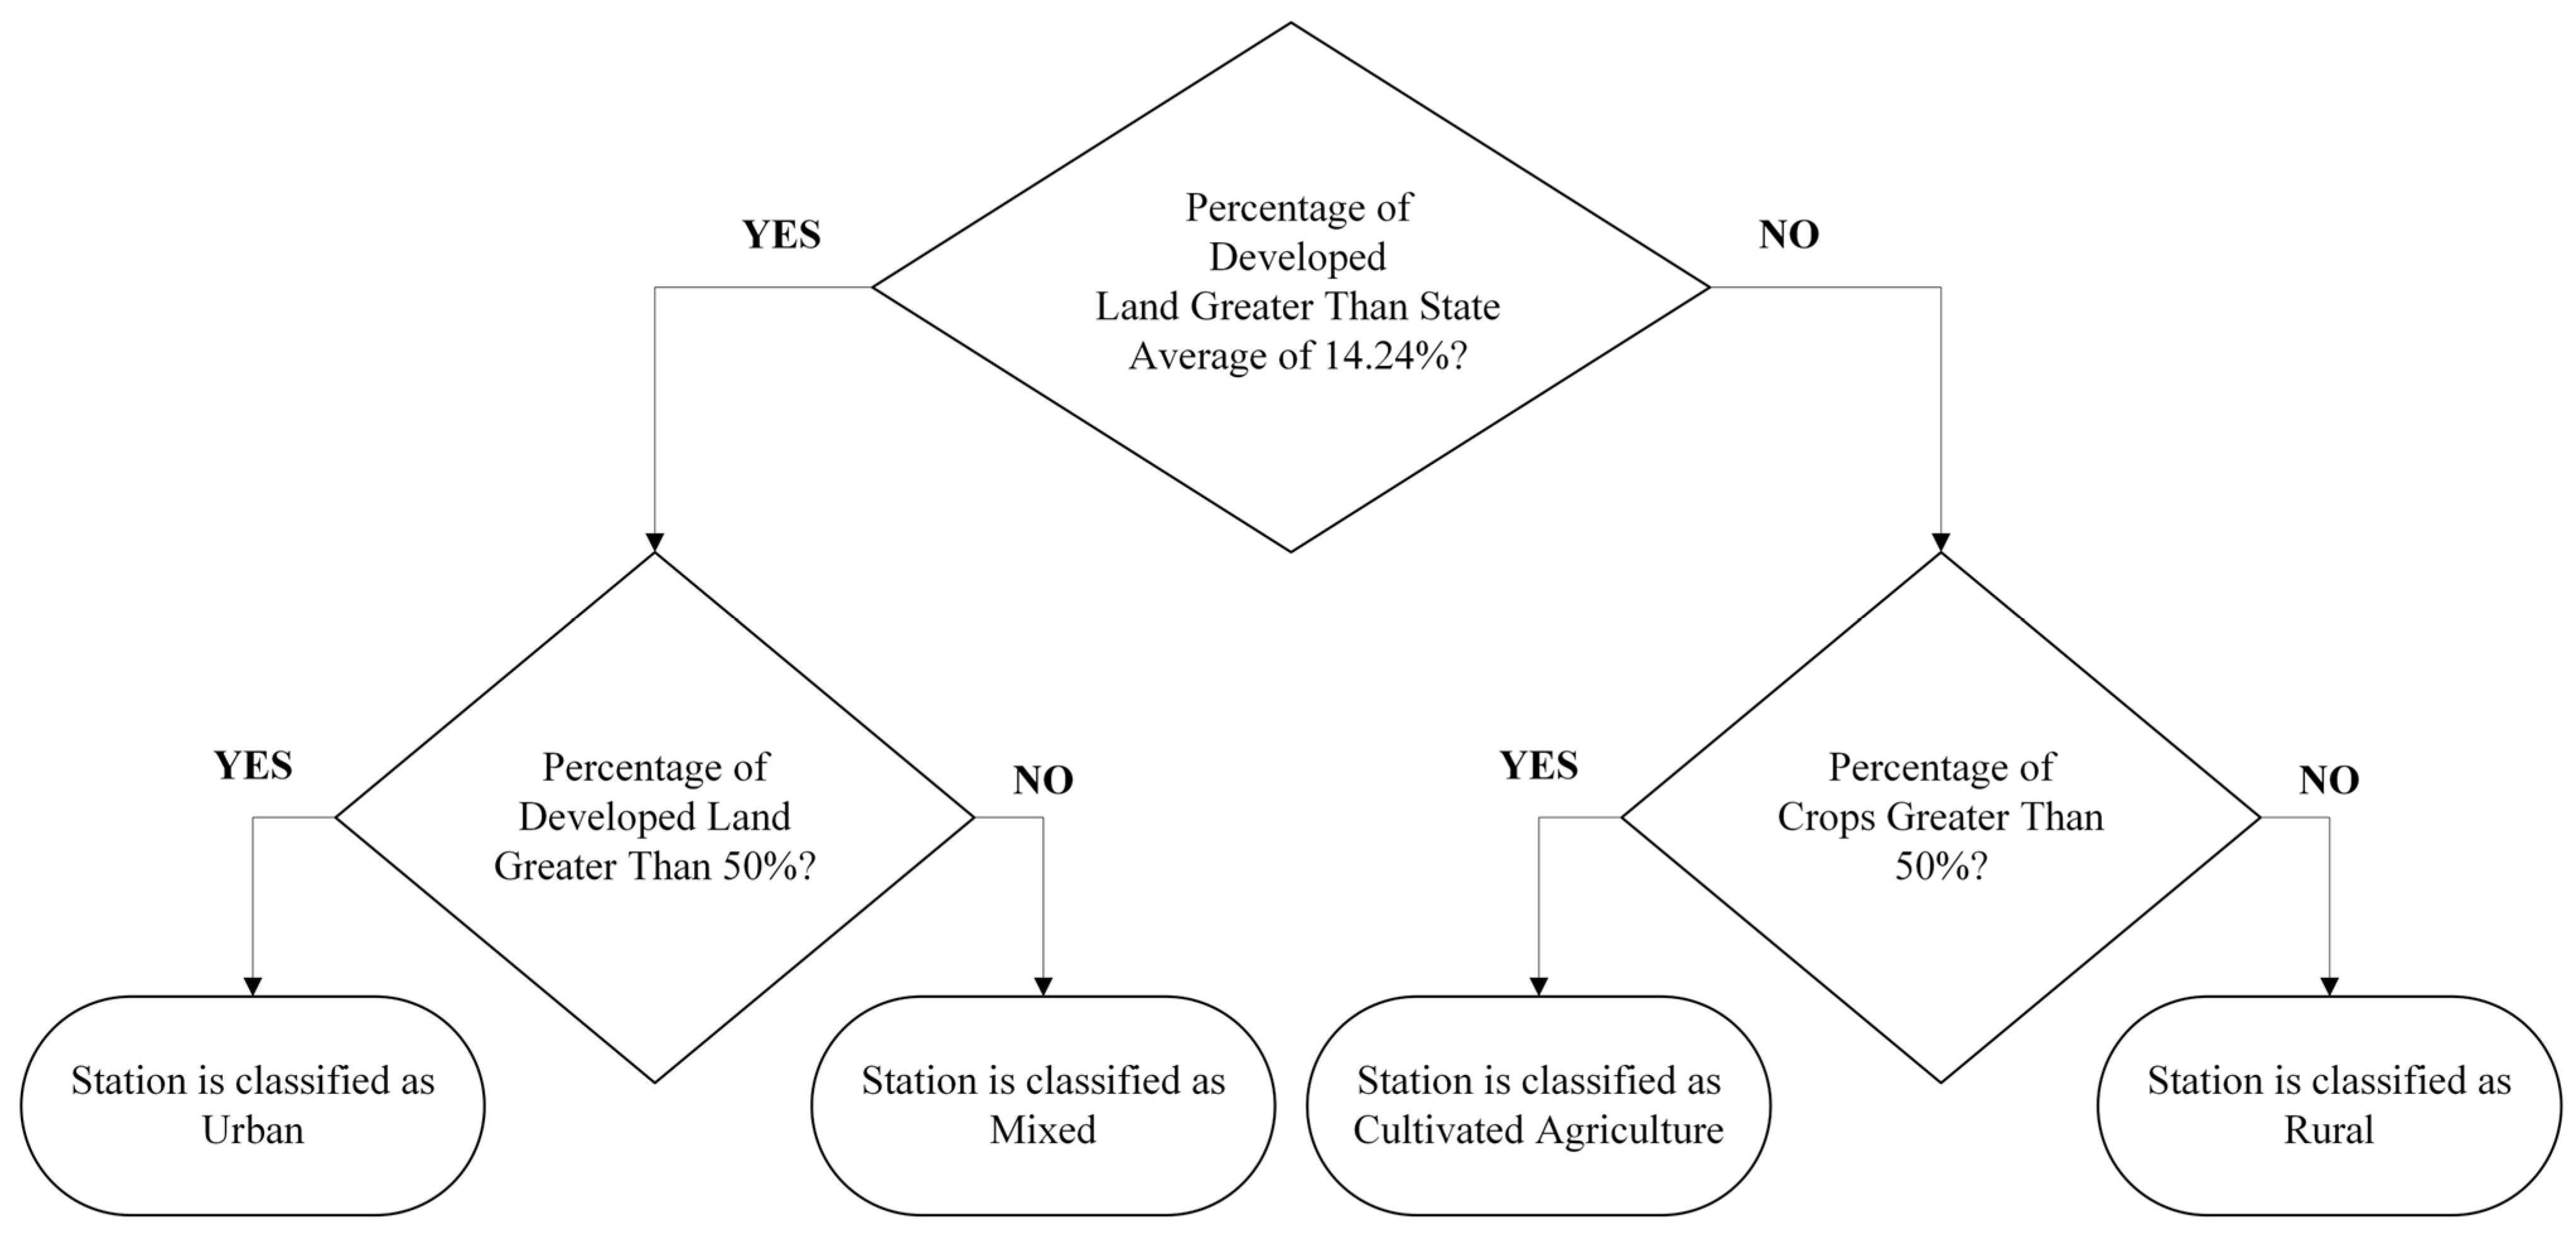
These seven categories were used to create a flow chart to place each station into one of four final land cover categories of urban, mixed, cultivated agriculture, and rural. Using the flowchart in
Figure 3, all 58 weather stations were categorized based on the pixel percentage of land cover within each individual station’s 30-mile buffer area. Classifications were chosen by combining categories from
Table 1. If the percentage of developed land in the buffer is greater than the state average of 14.24%, the station is classified as urban if developed land is greater than 50% of the land within the buffer; otherwise, it is classified as mixed.
If the percentage of developed land in the buffer was less than the state average of 14.24%, then the percentage of crops was examined. If crops were less than 50% the station was classified as rural. If crops were greater than 50% the station was classified as cultivated agriculture. The smallest category is rural, with 5 stations, urban has 6 stations, mixed has 8 stations, and the largest category is cultivated agriculture, with 39 weather stations.
Illinois is a longitudinal state, meaning it is longer north to south than it is east to west. This raised concerns with seasonal change varying between northern Illinois and southern Illinois. To determine the dividing line between north and south, the geographic center of Illinois was determined. The town of Chestnut, IL marks the geographic center, which is close to 40° north latitude, and so 40° north latitude was used to divide the state into the northern and southern halves.
Table 2 shows the list of stations used divided into their assigned land cover categories. Data were also classified by weather station groups (rural, urban, mixed, cultivated agriculture), between north and south, and by part of the growing season to allow for statistical testing of the differences between groups.
3. Results
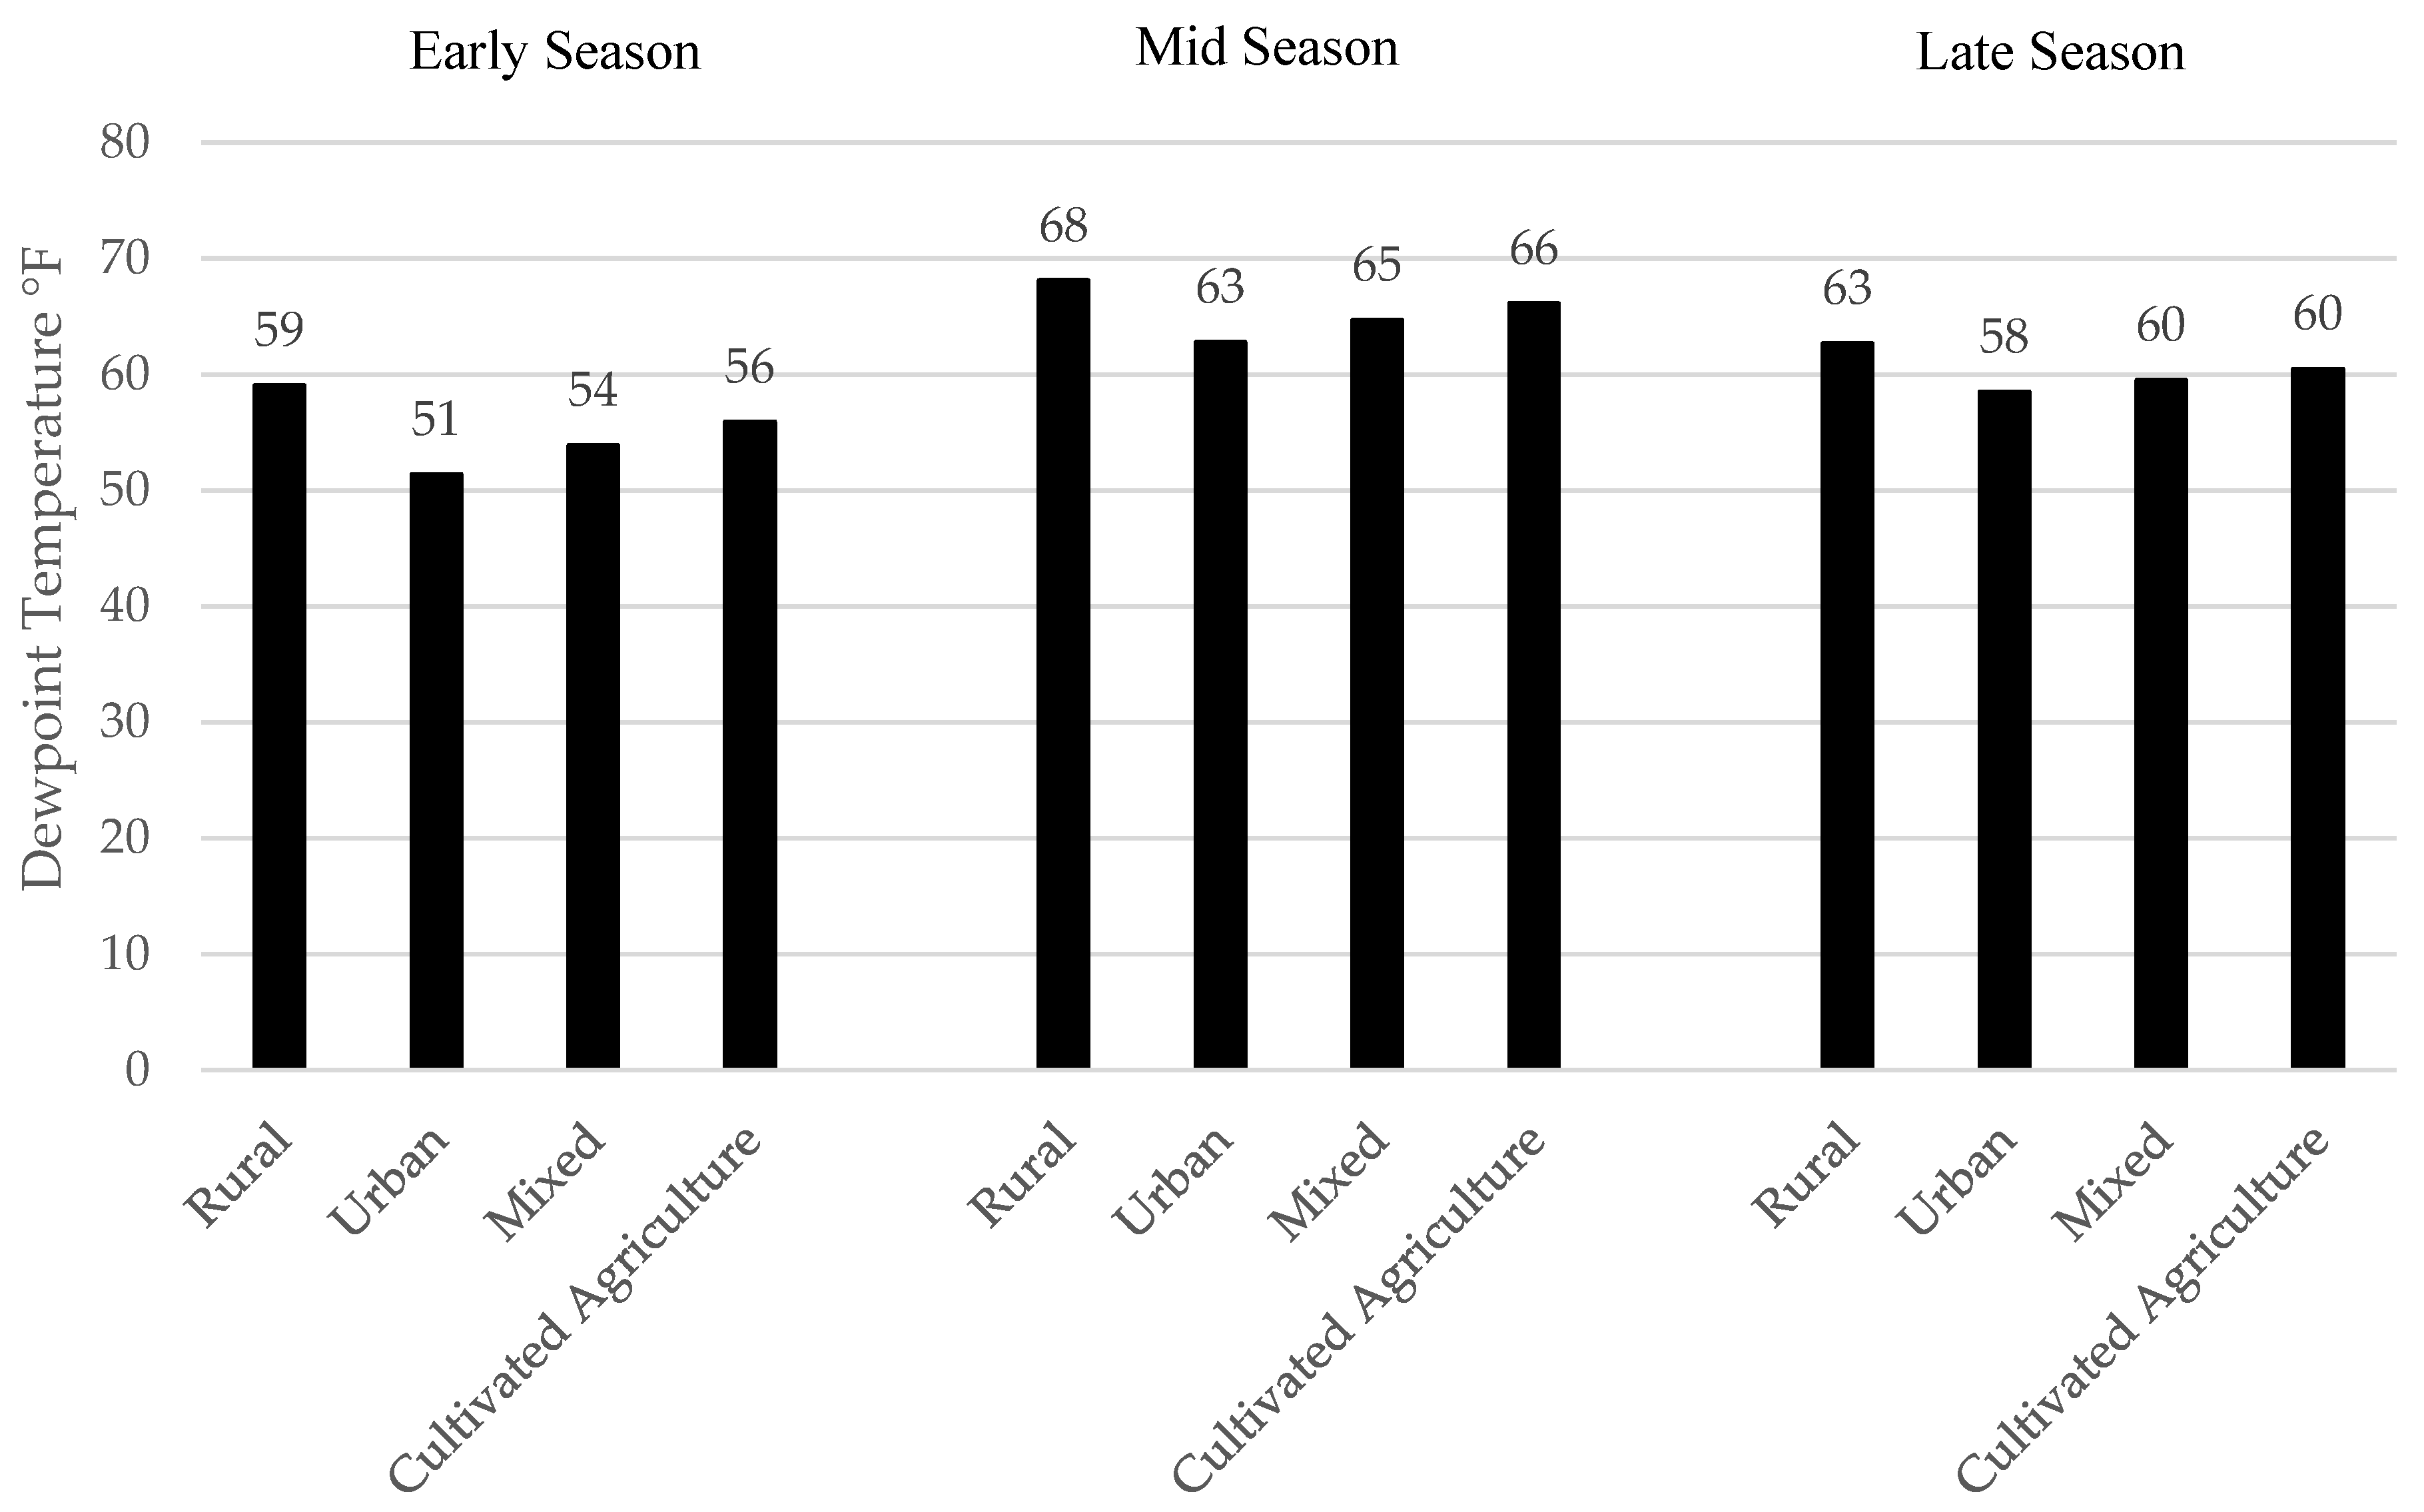
To understand any changes in dew point, the average dew point over 18 years across the four land cover groups was examined.
Figure 4 shows the average dew point across the 18-year period. In the early season, dew points are low and rural, cultivated agriculture (CA), and mixed are all within a few degrees of one another with only five degrees separating the three categories. During the peak of the growing season in period two, dew points are at their highest. Again, only a few degrees separate rural, mixed, and CA. The third set is the end of the growing season, and as expected, dew points have dropped as summer comes to an end. The temperature gaps again are consistent, but mixed and CA are equal and three degrees lower than rural.
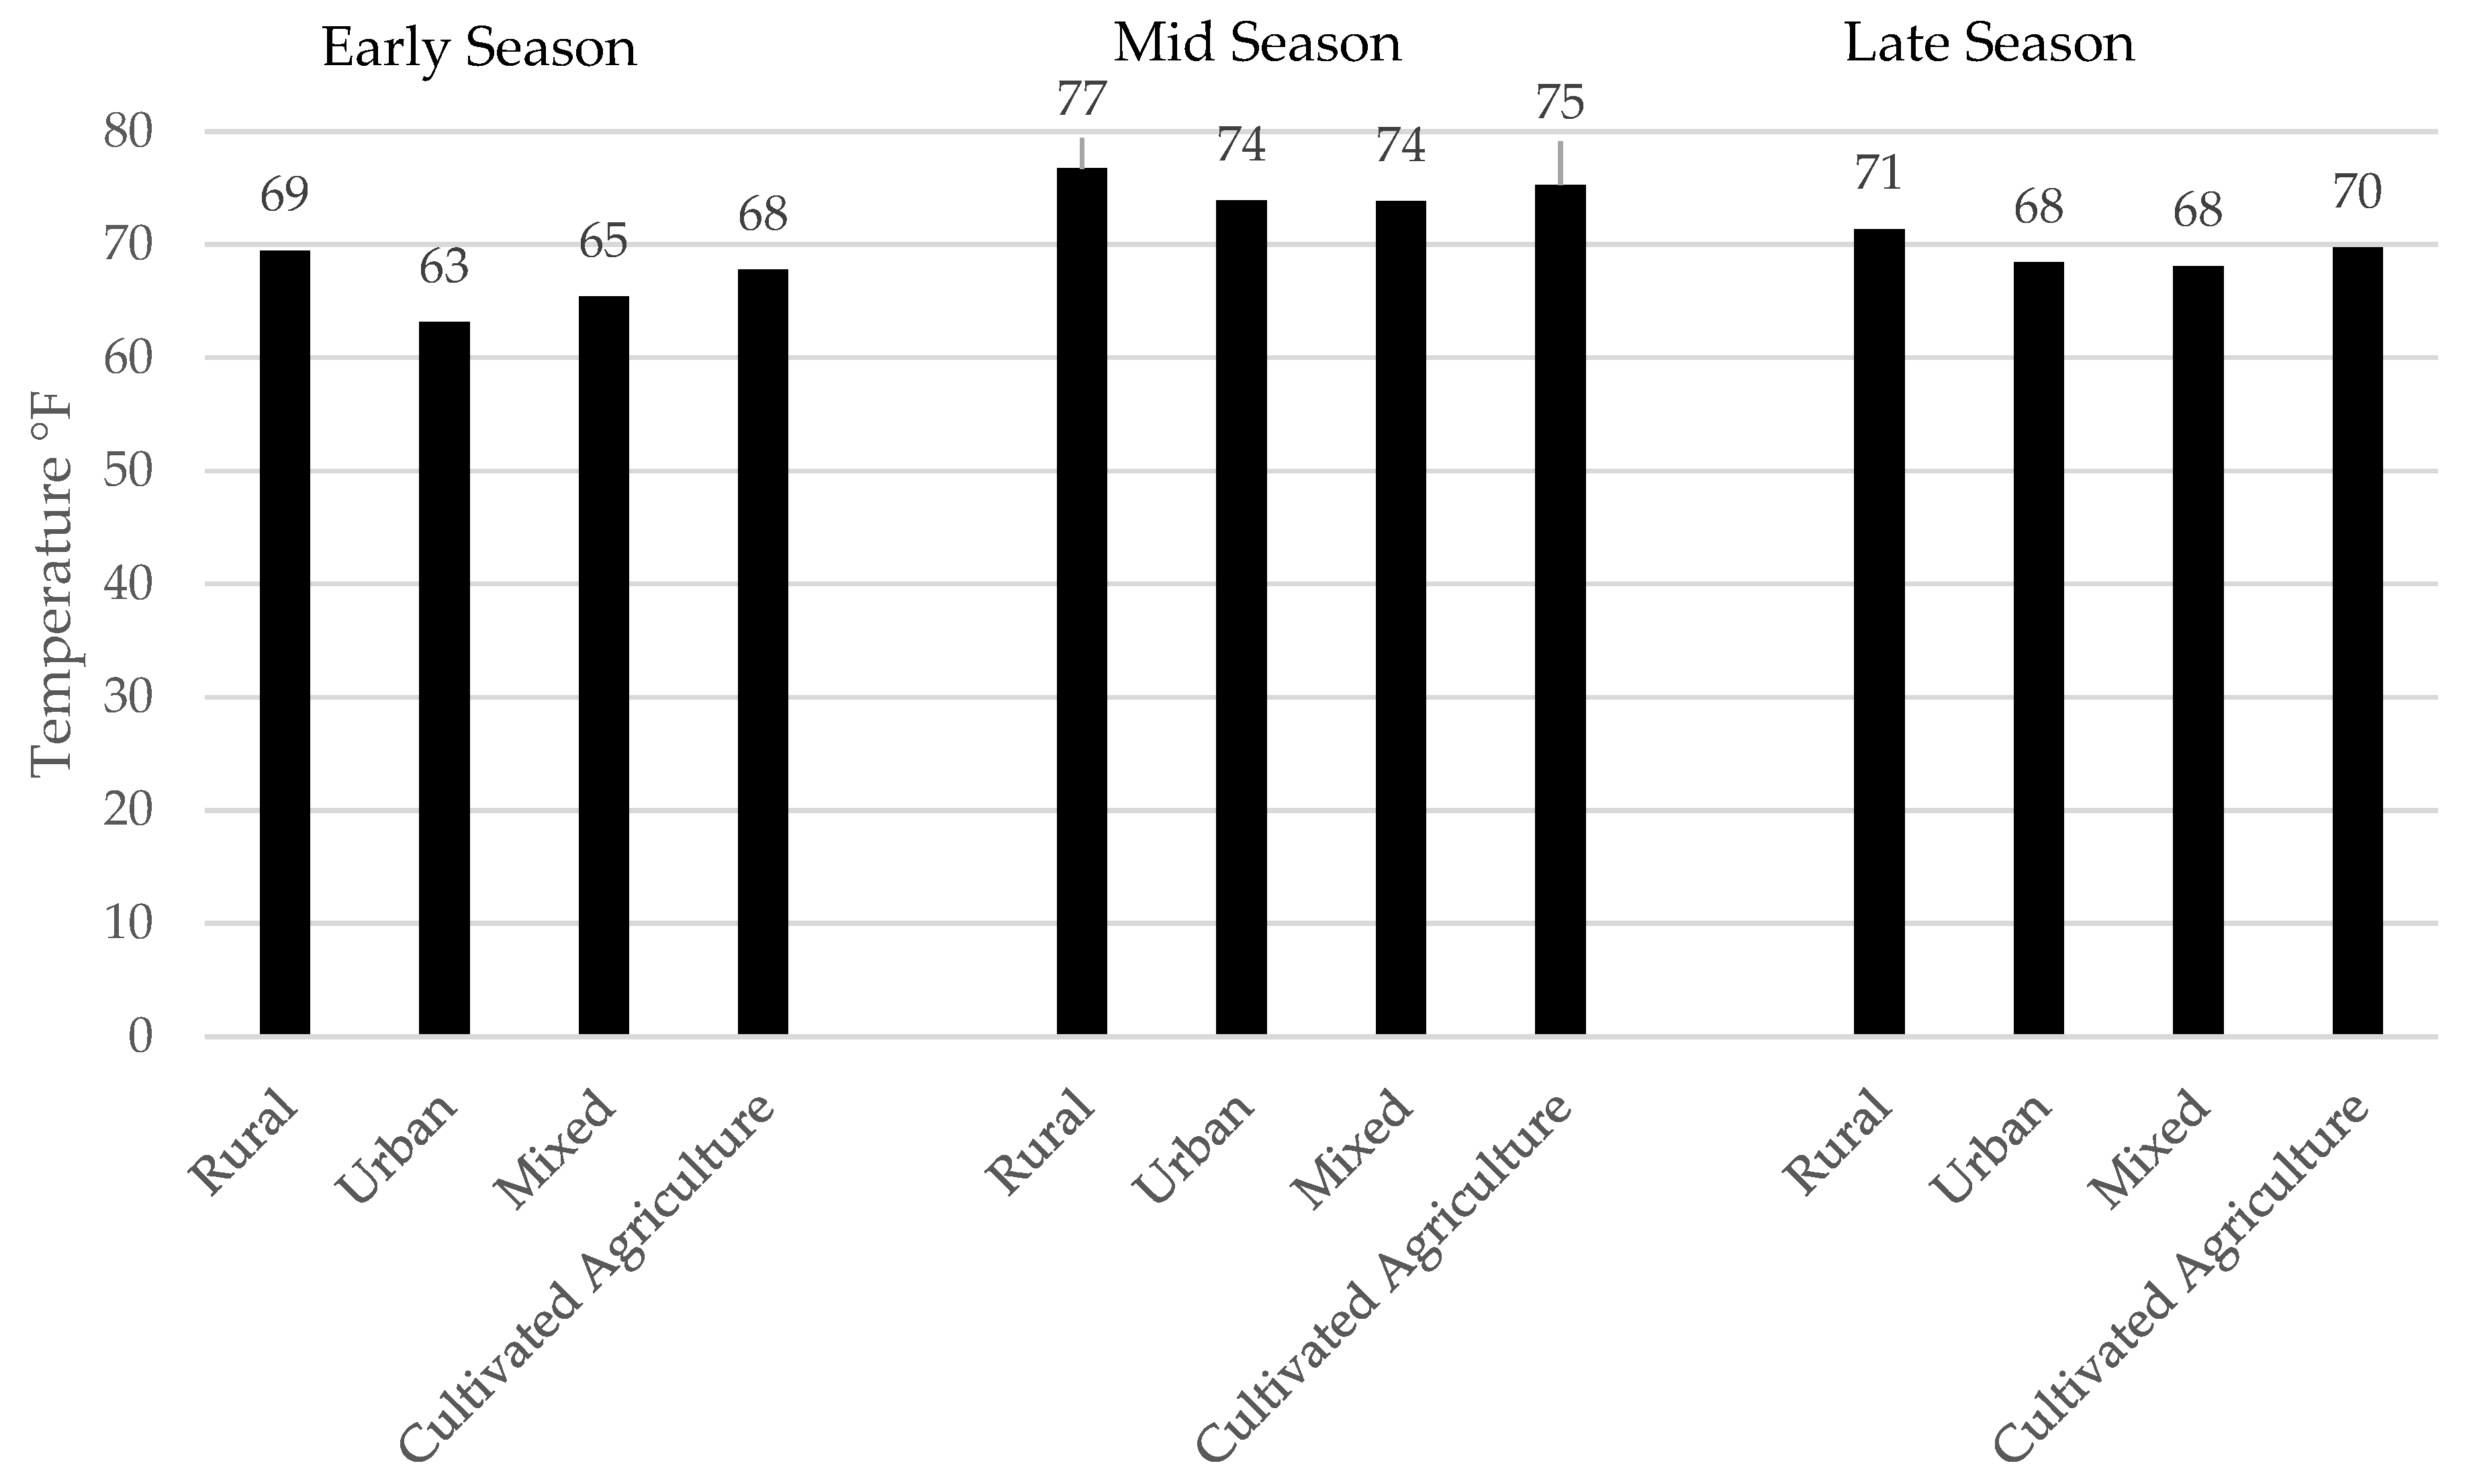
Using the same timeframe and method, the average temperature was examined (
Figure 5). In the early season, the temperature results are similar to the dew point results. Rural, mixed, and CA are all within a few degrees of one another. There is a greater change in period two at the peak of the growing season with average temperatures and dew points, urban and mixed are at 74 °F, and only a few degrees separate rural and CA. The final set shows the late season period three, and there is a similar trend here as in dew points. Urban and mixed are equal, with both at 68 °F, and rural is only 1 °F above CA.
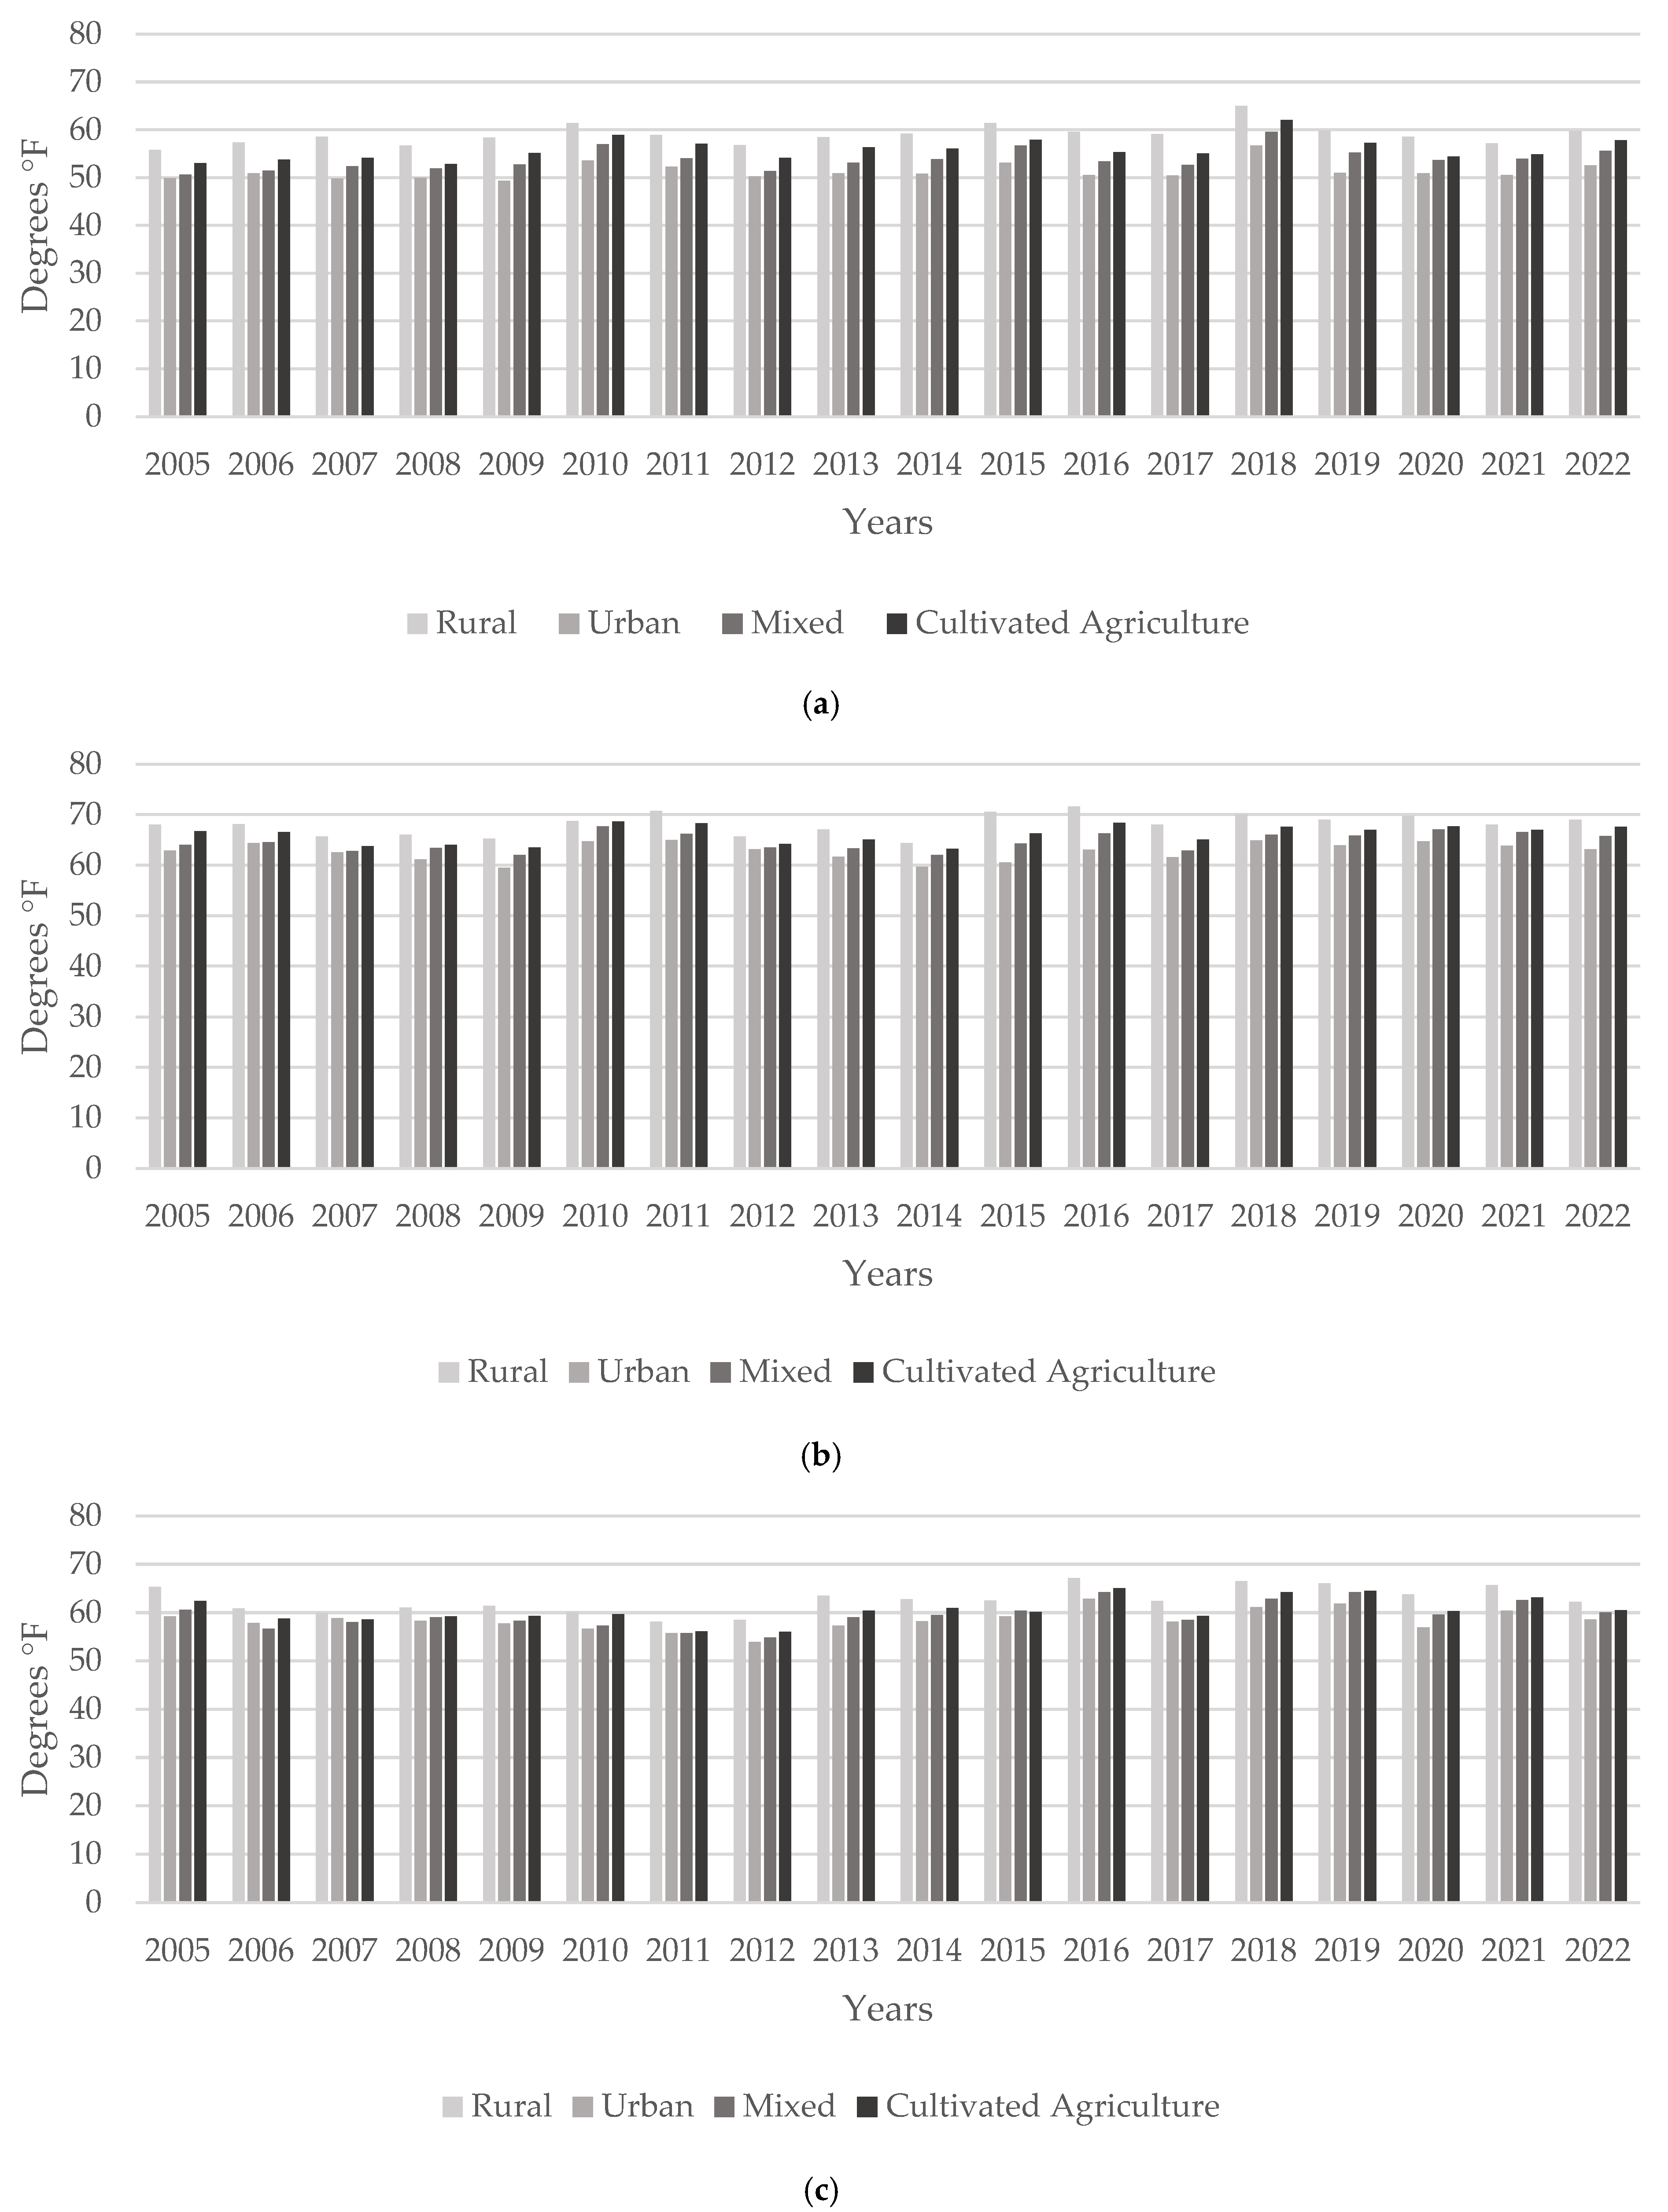
Seeing patterns emerge in the data, the next step was to look at changes over the 18-year study period from 2005–2022. Three bar charts were created to show the average dew point for each year and for each period of the growing season.
Figure 6a shows the first period, the early season. The dew point temperature on average has been rising from 2005 to 2022. The early season pattern matches the 18 years average, with rural having the highest dew points, followed by CA, mixed, and urban areas.
Figure 6b shows the peak/mid-growing season, period two. In period two, the dew point temperature does not show as great an increase over the years as it did in the early season (period one), but there is a slight increase from 2005 to 2022. The pattern that is still present is that rural stations have the highest average dew point, followed by CA, mixed, and urban. In
Figure 6c, the late season (period three) is shown. This is the end of the growing season, where dew points are decreasing, but still shows the same overall patterns present in periods one and two. The late season also shows a slight increase in dew point over the 18-year period. Across the land covers, the same pattern is seen, with rural having the highest values, followed by CA, mixed and urban areas. Similar charts were made for air temperature, shown in
Figure 7a–c. The increase in temperature over 18-years is not as pronounced visually, but is around one to two degrees Fahrenheit. The same pattern can be seen with temperature as was observed with dew point. Rural had the largest increase, followed by CA, mixed, and then urban. This is evident in all three periods of the growing season with the largest spike in temperatures in period two of the growing season when evapotranspiration is at its highest.
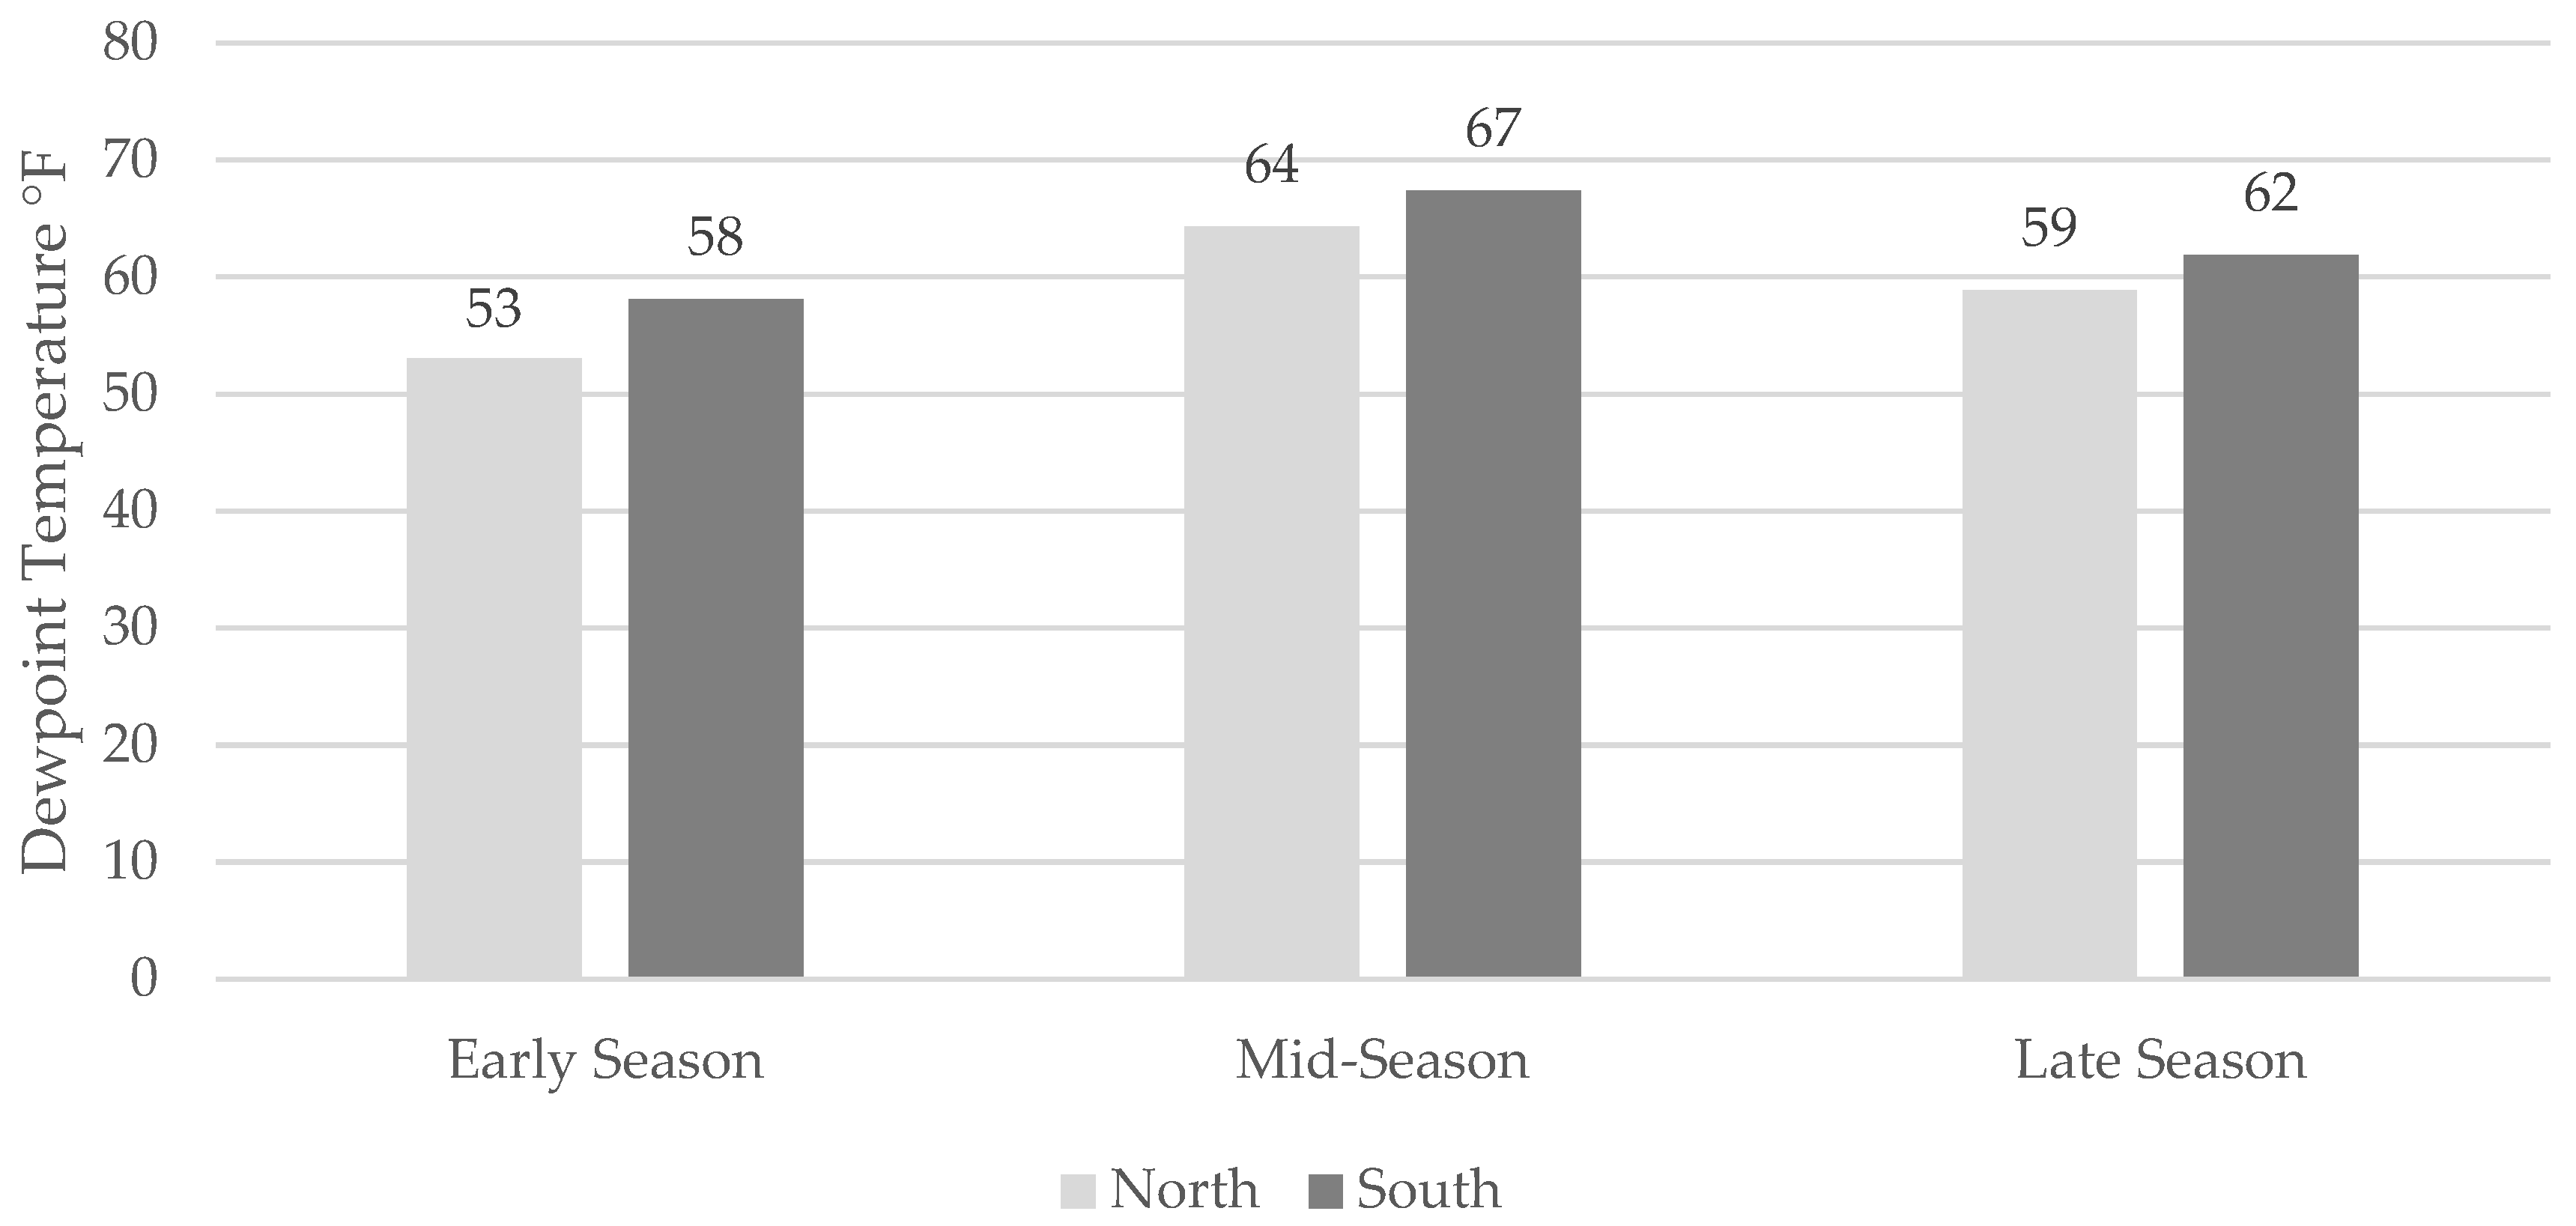
The next step was to examine differences in the 18-year average dew point temperature readings between northern and southern stations (
Figure 8). As expected, southern dew point temperature readings are higher than the northern stations and period two (mid-season) is when dew point readings are at their highest.
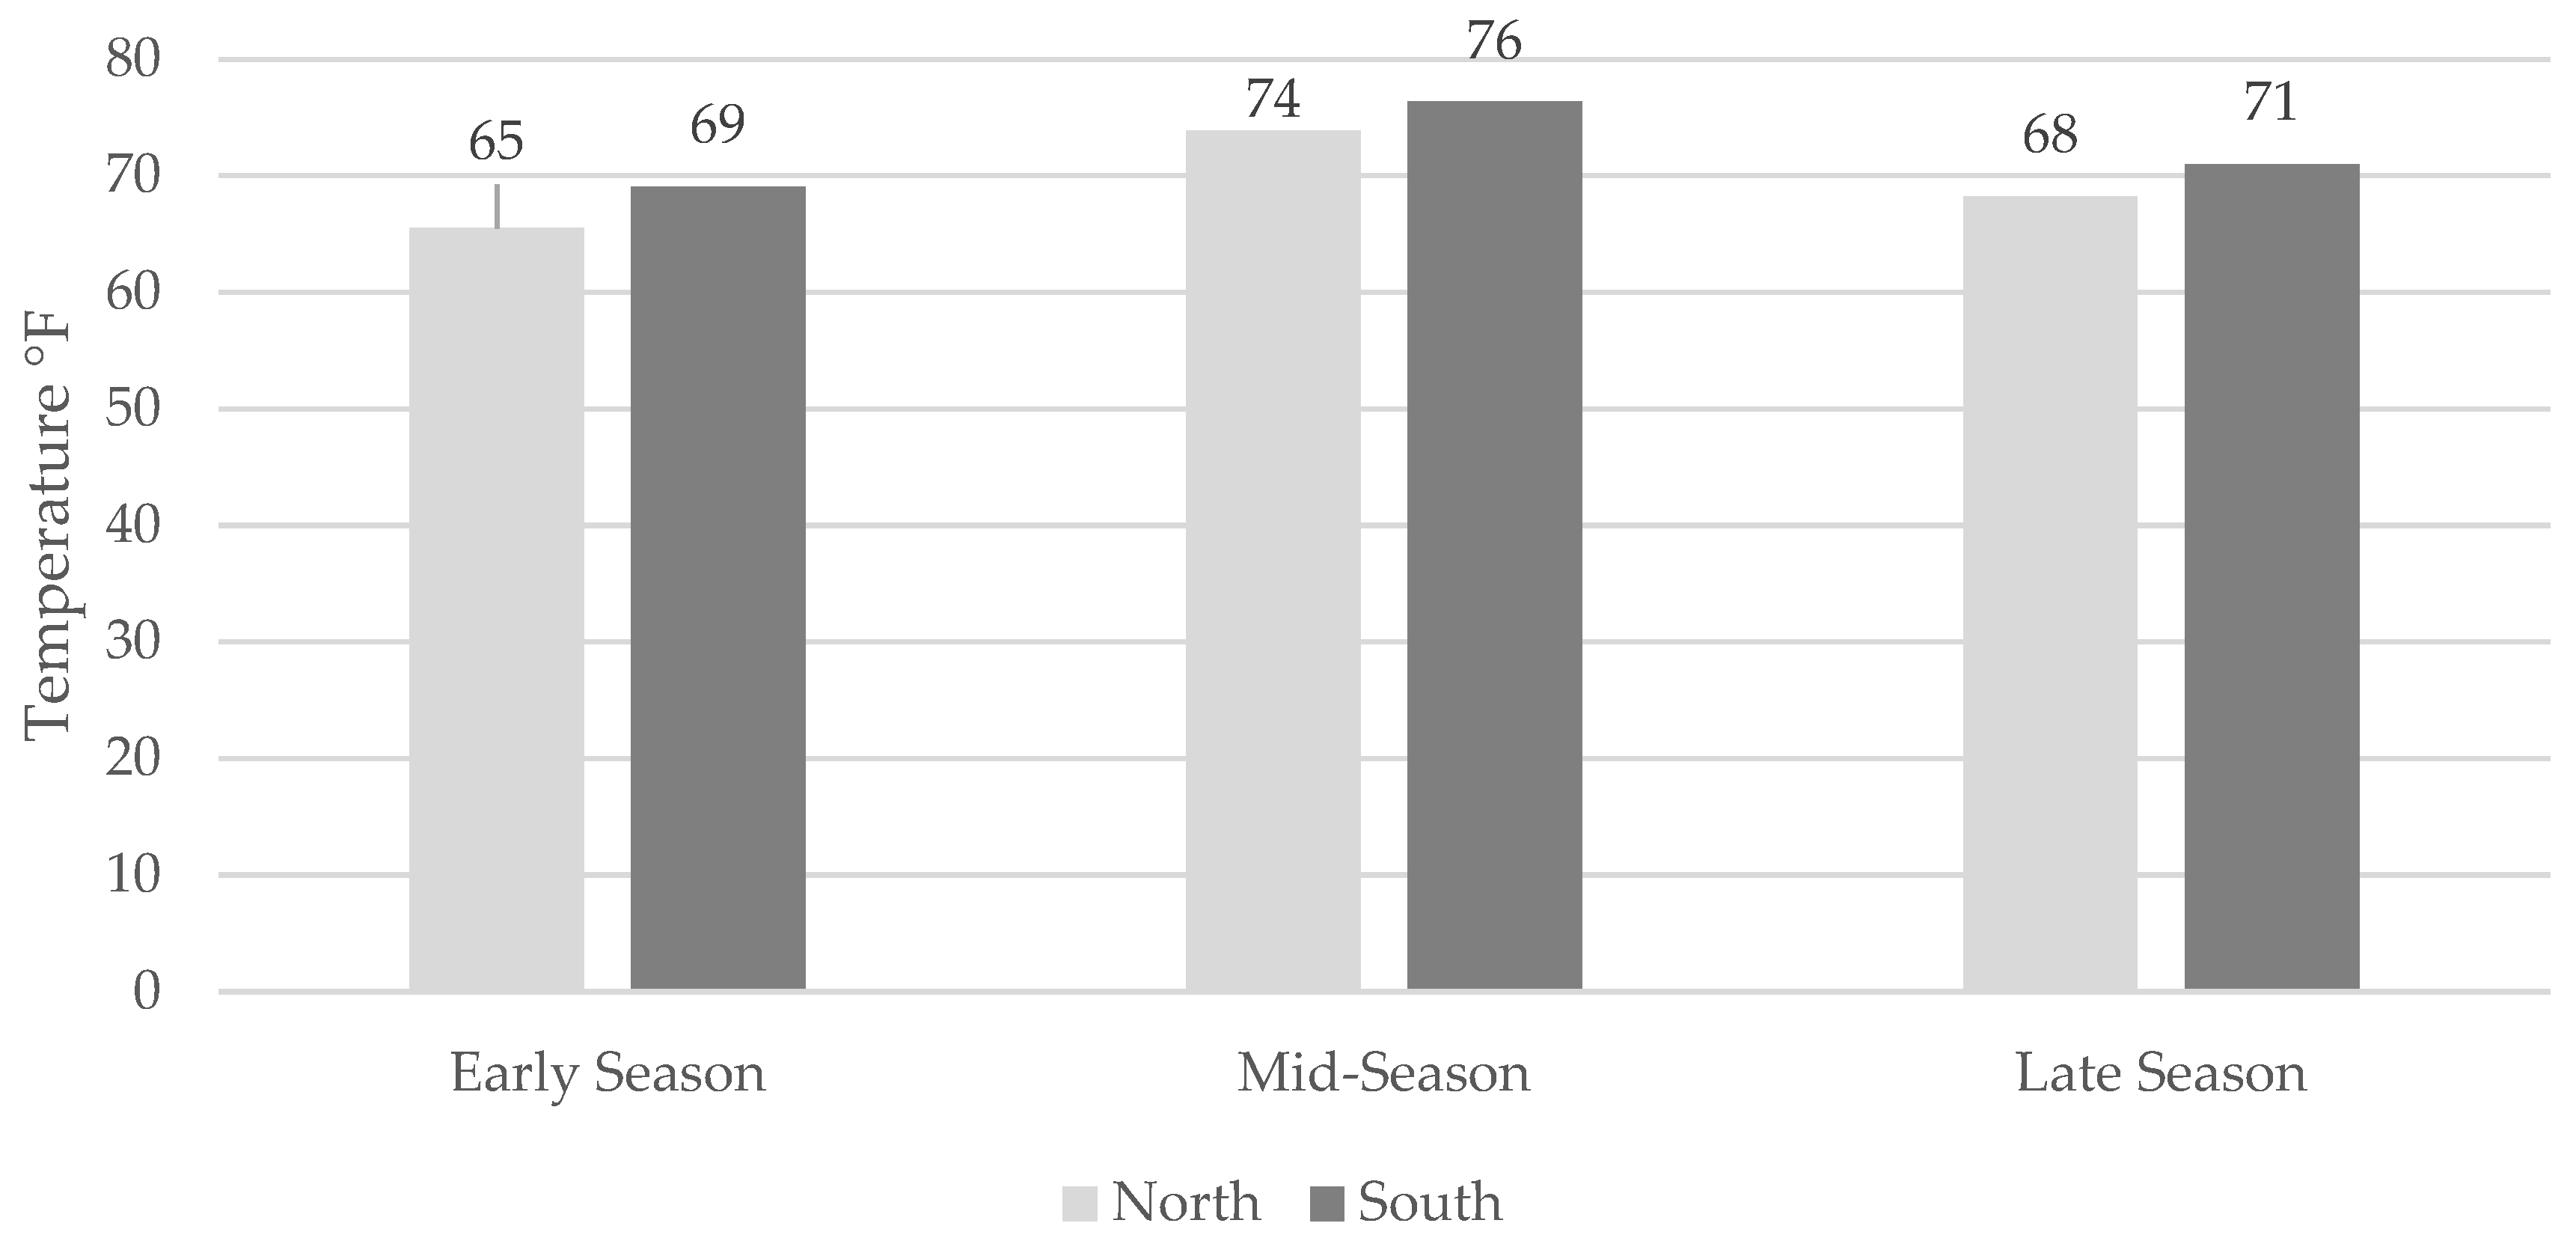
Figure 9 shows the 18-year temperature average, and the results are the same. Southern temperatures are higher, and the highest readings are at the peak of growing season in mid-season.
Descriptive analyses show patterns in both dew point and temperature readings, with rural stations having the highest readings followed by CA, mixed, and urban stations. The difference is only a few degrees Fahrenheit between rural stations and the rest of the stations. To test for statistical significance of these differences and since the data are not normally distributed, the nonparametric independent samples Kruskal–Wallis test was run using IBM SPSS (
https://www.ibm.com/spss, accessed on 7 March 2022). The Kruskal–Wallis test confirmed that the few degrees difference seen in the qualitative data are statistically significant across all combinations except for three. In dew point, there is one grouping that is not significant, and in temperature, two groups were not significant.
Table 3 shows the three groups that were not significantly different from each other.
Linear regressions were run for both dew point and temperature over the 18–year period to understand the trends over time (
Table 4 and
Table 5) by land cover, part of growing season, and location (north vs. south). The category labeled “all” is for all the data combined across all categories. Then, separate linear regressions were run for each land cover category, each time period of the growing season, northern stations, and southern stations, and CA versus all other land cover.
Overall, the dew point increased 0.18 °F per year, and across an 18-year period, that is an increase of 3.24 °F. A significant increase in dew point was found in every category analyzed. The largest increase is in the mixed and rural categories. Mixed shows an increase of 0.21 °F per year while rural is rising at 0.20 °F per year. Cultivated agriculture was third at 0.18 °F per year. Seasonal dew point testing shows dew point rising throughout the growing season. The largest increase is in the late phase of the growing season and the smallest increase is during the mid/peak part of the season. Cultivated agriculture and all non-CA land covers have dew points rising at a similar rate. The highest rise is outside of CA, with a 0.185 °F per year increase, which is statistically larger than the increase of 0.180 °F per year seen in CA. The same can be said for northern stations versus southern stations. Northern stations are showing dew point increases at a rate of 0.17 °F per year, while southern stations are showing an increase of 0.18 °F per year.
There is also a statistically significant increase in temperature over the 18-year study period. Temperature is rising 0.14 °F per year: this amounts to a total temperature increase of 2.52 °F over 18 years. Temperature over different land covers shows some interesting results. Both rural and cultivated agriculture show a drop in temperature, while urban and mixed are increasing. The mixed land cover has the largest increase of 0.089 °F per year: this equals a 1.6 °F increase over 18-years. Seasonally, temperature changes are similar to dew point changes, with an increase in temperatures in the early and late part of the growing season and a decrease during peak season (21 June through 10 August). When comparing CA to all non-CA land covers, the CA stations see cooling while the non-CA land covers are warming by 0.052 °F each year. The final category to look at for temperature is northern stations versus southern stations. The north is showing a rise in temperature of 0.031 °F per year, while the south is showing a drop in temperature of 0.007 °F per year.
4. Discussion
The results of this study show that dew points and temperature are increasing in Illinois. In terms of dew point, the rate of increase is similar when comparing CA and all other land covers. The rate of increase outside of CA is higher than within CA, but only by 0.005 °F per year. So, while the values are very similar, the dew point increase in CA is not greater than that of other land covers. Wolf and Market (2007) found that corn and soybeans can increase dew points locally up to several degrees, but that is dependent on a well-watered crop, non-advective conditions, the height of the boundary layer, and ultimately, the amount of evapotranspiration [
23]. Therefore, even if these crops are the dominant land cover in the CA regions, their ability to increase dew points locally is dependent on the prevailing atmospheric conditions. This relationship is further complicated through the use of a 30-mile buffer to assess land cover. It is possible that using a smaller buffer would change some of the station classifications and alter the relationships found in this work. Given the similar increases in dew point across all of the land cover, we believe that this is driven by changes in large-scale atmospheric conditions.
In contrast, temperatures are increasing outside of the cultivated agriculture areas and decreasing in the CA regions. This finding supports the results of previous studies that show a correlation between intensification of agriculture and decreased average daytime temperature [
9]. The majority of received solar insolation is partitioned into latent heat in a heavily vegetated region such as the Midwest Corn Belt, leading to elevated nocturnal minimum temperatures, reducing the daily maximum temperature, and suppression of the daily temperature range [
9]. This demonstrates that changes in land cover can influence climate, even if that was not readily apparent when examining dew point.
The final question of this study asked if there is a larger change in dew point and temperature between the three periods of the growing season in northern Illinois versus southern Illinois. Dew points in the south are rising at a rate at 0.188 °F per year, which is statistically significantly higher than the rate of increase of 0.171 °F per year in the north. The southern stations experienced a decrease in temperature of 0.007 °F per year, while temperature increased in the north at a rate of 0.031 °F per year. Overall, dew points are increasing in both the southern and northern parts of the state, but with the greatest increases in the south, while temperature increases are only found in the north. This may be due to differences in land cover between north and south. All of the urban stations are located in the northern half of the state and results show that while the dew points have increased over time in the urban land over classification, the increase is the smallest of all of the land covers. At the same time, mixed land cover stations showed the largest increase in temperature followed by urban land cover stations. With the majority of mixed stations in the north along with all of the urban stations, this may explain the temperature increases found in the north. The southern half of the state is dominated by CA stations and contains all of the rural stations, and both categories saw temperature decreases.
Seasonally, dew points are rising in all three periods of the growing season. The late season has the greatest increase, the early season has the second-largest increase, and the mid/peak season has the smallest increase. When looking at temperature, the early and late season are rising at an almost equal rate, while there is a decrease in temperature during the mid/peak period of the growing season. One possibility for this decrease in temperature during the mid/peak growing season could be explained by previous research. Raddatz (2007) explains that the water use patterns of vegetation can result in an incremental increase in daily maximum temperatures and a reduction in humidity during the early and late growing seasons, and cooler but more humid conditions in the mid/peak growing season [
7]. Raddatz (2007) also found that for irrigated sites, monthly maximum and mean temperatures decreased during the growing season (May–September) and dew points increased [
7]. This would explain our findings that temperatures are rising roughly the same rate in early season (0.051 °F) and late season (0.061 °F), but the temperature is dropping 0.072 °F in the mid/peak season. This may also explain part of the reason why temperatures decreased 0.002 °F per year in CA, while other land covers are seeing temperatures rise 0.052 °F per year.
Given that almost all the combinations of groups (early, middle, or end of the growing season; land cover; and north vs. south) had dew points and temperatures that were significantly different from each other, it is also important to examine the combinations of groupings that were not significantly different. For dew point, there was one pairing that was not significantly different from each other. The early season, rural, south combination and late season, mixed, south combination were not significantly different. Both are in the south, but the land covers are different, and they are at different times in the growing season. More research is needed to explain these findings.
When testing temperature, there were two groups found that were not significantly different from each other. The first group is the early season, mixed, south combination and the early season, rural, south combination. The second group is the late season, mixed, south combination and the late season, rural, south combination. These groups are both in the south and share a season (early or late) but have different land covers. While there are no urban stations in the south, it is interesting to note that the mixed and rural land covers are different than the CA. This may again be explained by previous work that showed an increase in daily maximum temperatures and a reduction in humidity during the early and late growing seasons in CA [
7], while the mixed and rural land cover do not show this increase in daily maximum temperature, resulting in differences between the two that are not significant. No further testing was conducted to examine these combinations, but future research should examine these relationships.
5. Conclusions
This study examined changes in dew points and temperature in Illinois and the relationship between those changes and land cover, part of the growing season, and between the northern and southern parts of the state. The results of our statistical analysis show that the dew point is increasing across all land cover classifications. The rate of increase in the dew point was greater in mixed and rural land covers than CA. The results for temperatures were varied, with temperature increasing across the mixed and urban classifications and decreasing in CA and rural classifications. Dew point increased in all periods of the growing season, with the largest increase in the late season, while temperatures increased in the early and late season and decreased during the peak of growing season. Both northern and southern Illinois saw increases in dew point, but the rates of increase were higher in the south. Temperatures decreased in the south during the study period and rose in the north.
The patterns of temperature and dew point change raise additional questions. While many studies have found an increase in humidity across agricultural regions, this study found that the increase was similar to that of other land covers in Illinois. The ability of crops in the CA regions to increase dew points locally is dependent on the prevailing atmospheric conditions. It is possible that the water vapor that is added to the atmosphere through evapotranspiration is simply advected elsewhere (perhaps into adjacent regions that are defined as other land covers in this study) rather than being more concentrated near the weather stations in the CA regions. However, this work does support previous research that shows a relationship between intensification of agriculture and decreased average daytime temperature.
There are several limitations that may impact the results of this study. Land cover in this study was determined using a 30-mile buffer around the station. However, within that buffer, the land cover is not is not uniform. A station classified as CA may contain small areas of urban, mixed, or rural land covers as well. In addition, temperature and dew point readings were only taken at the weather station and not spread throughout the 30-mile buffer. It is possible that using a buffer of a different size would change the classification of some stations and yield different results. While dew point increases in Illinois do not appear to be driven by changing agricultural practices, future research should consider examining this relationship in other regions to explore the connection between temperature, dew point, and land cover.


