1. Introduction
In meteorology, knowledge of atmospheric parameter values at various altitudes of the air column, at the same instant of time and at several locations on Earth, has a very significant impact for the drafting of short-term forecasts and the identification of the main circulations of air masses.
In fact, some parameters are of fundamental importance for the application of the physical–mathematical models used for this purpose [
1,
2,
3,
4]. The improvement of the meteorological modeling accuracy that is used therefore depends on the amount of data collected, both in a spatial and temporal manner. The organization that regulates all meteorological aspects is the WMO (World Meteorological Organization) founded in 1873 and part of the UN since 1950, with headquarters in Geneva. In one of its publications, n°8, the WMO also deals with establishing rules within which meteorological stations must be installed in order to be able to compare the data recorded by them.
Over the years, the means of transporting atmospheric sensors along the vertical to a place positioned on the surface of the Earth have increased and evolved [
5,
6,
7,
8,
9,
10,
11,
12]. However, only the radiosondes have established themselves in this field as they have shown high reliability and high versatility precisely because they can easily reach tropospheric heights thanks to the gas contained inside the balloon (generally helium). To date, however, the sounding balloon is launched only twice a day and from some locations on Earth, albeit in a homogeneous manner.
To overcome these last limitations, and, therefore, have a greater spatial and temporal frequency in data collection, there have also recently been increasingly smaller UAV vehicles capable of transporting the most important atmospheric sensors capable of sending data via radio or store them internally (data logger) for relatively fast processing [
13,
14,
15,
16,
17,
18,
19].
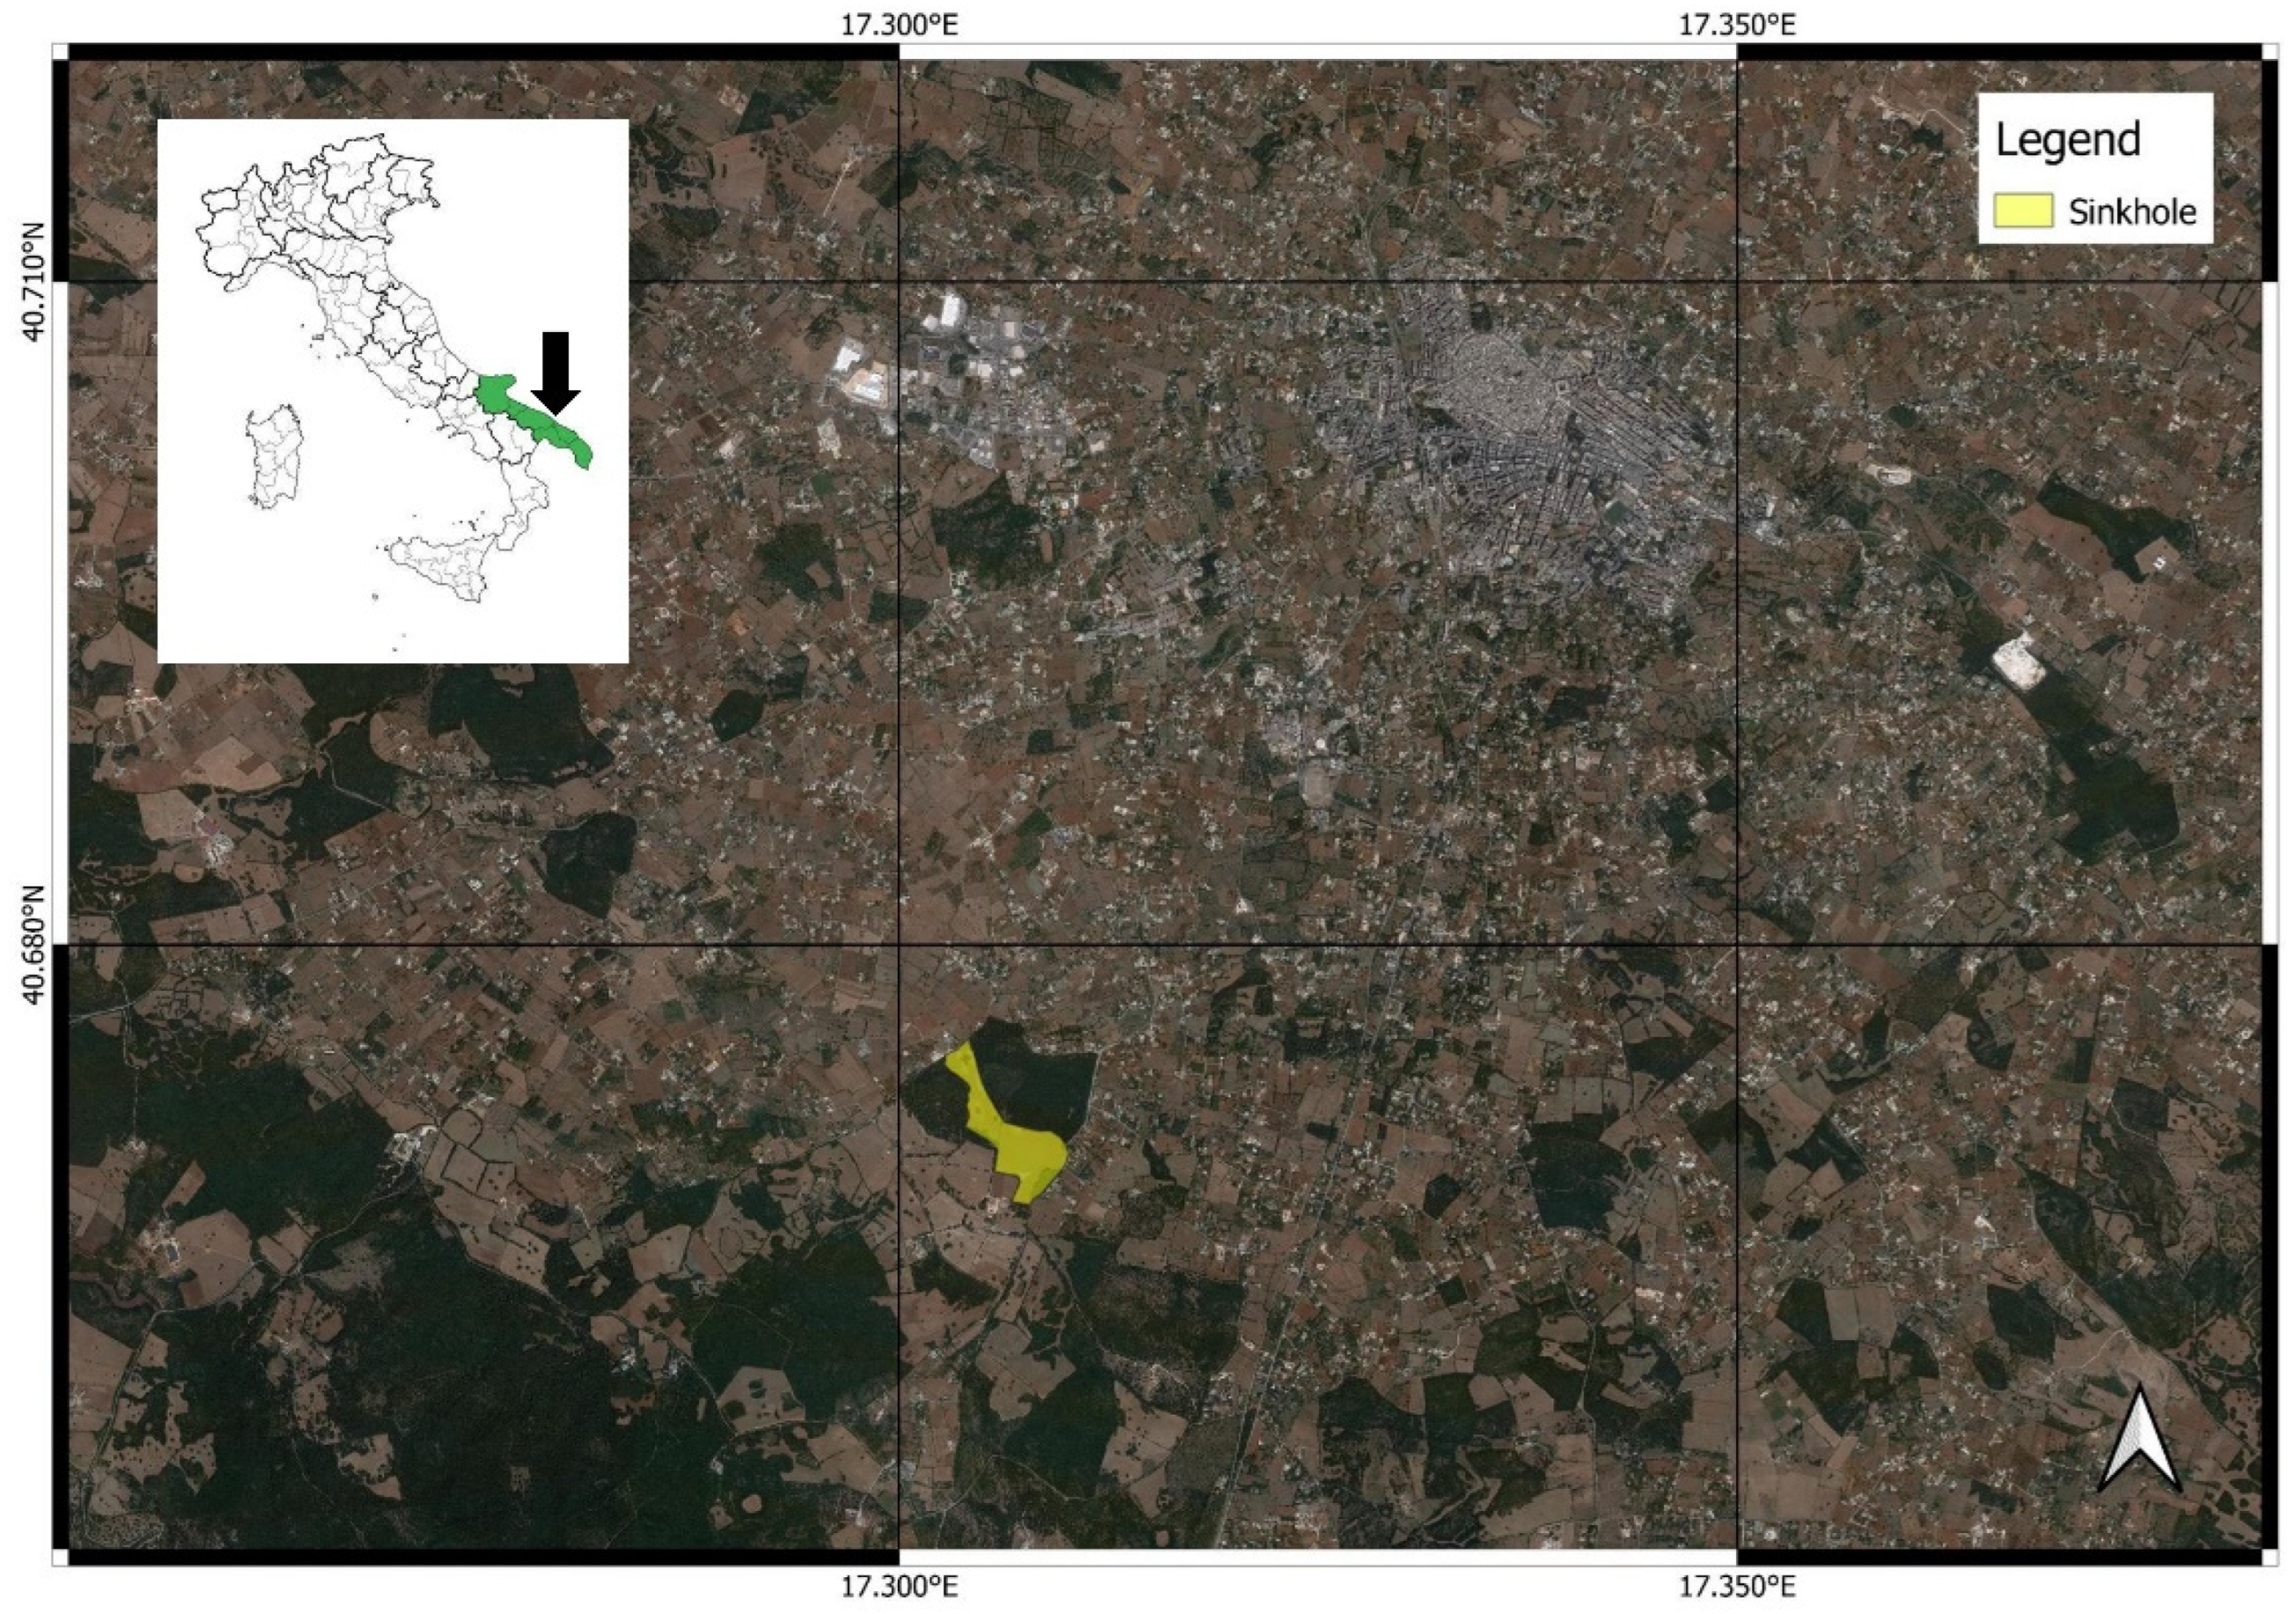
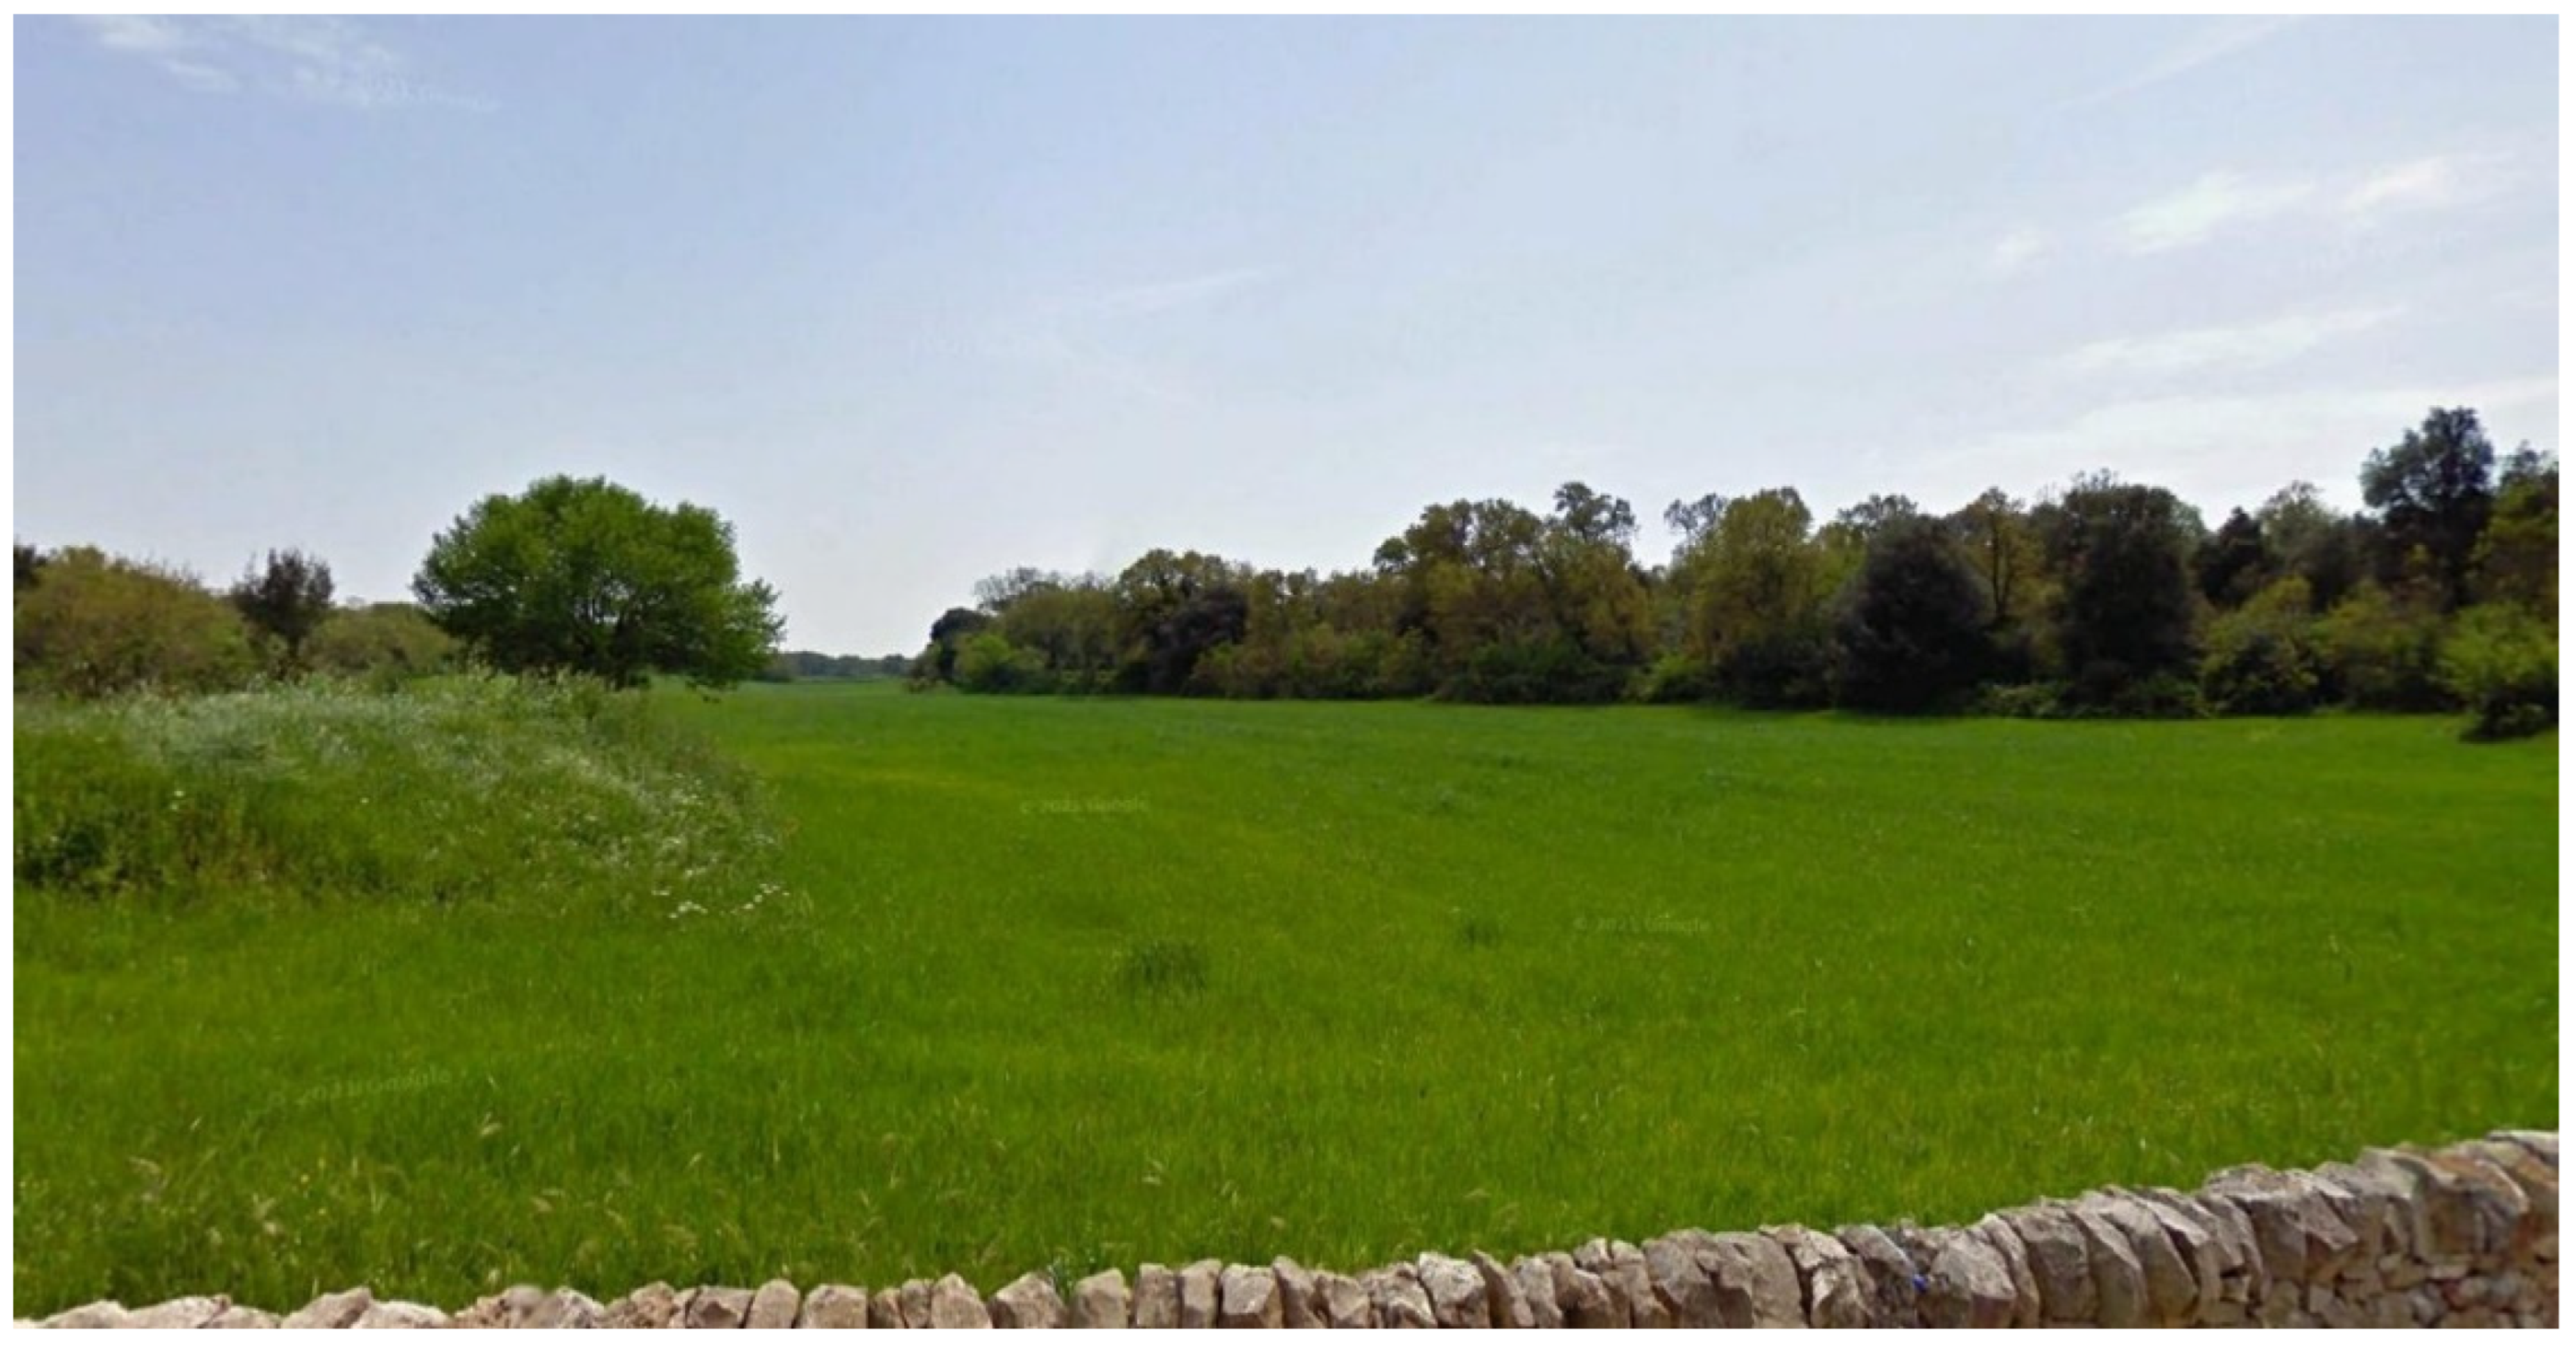
The objective of this study was to test the use of a UAV with a temperature data logger for the identification of three vertical temperature profiles of the first 80 m of altitude of a sinkhole located at Martina Franca (Apulia region, Martina Franca, Italy) (
Figure 1). The tests were conducted in a meteorological situation that is peculiar for its geological and geomorphological conformation, in conditions of thermal inversion in the lower strata [
20,
21,
22,
23,
24,
25].
The data acquired by the sensors installed on the UAV were then compared with temperature data from the installation of three weather stations positioned on the surface of the Earth: one inside the sinkhole, one along the slope of the sinkhole, and finally one at the top of the hill. In particular, the altitude range of 80 m existing between the weather station located at the top of the hill and the one located inside the sinkhole made it possible to obtain reference meteorological data useful for validating the vertical temperature profile of 80 m obtained with the flight of the UAV and performed along the vertical at the lowest point of the sinkhole.
Finally, further validation of the experimental vertical temperature profiles obtained by UAVs was obtained thanks to the comparison of the latter with that obtained from a radio sounding connected to a balloon launched from a location located about 60 km away from the sinkhole.
1.1. Geological and Geomorphological Setting
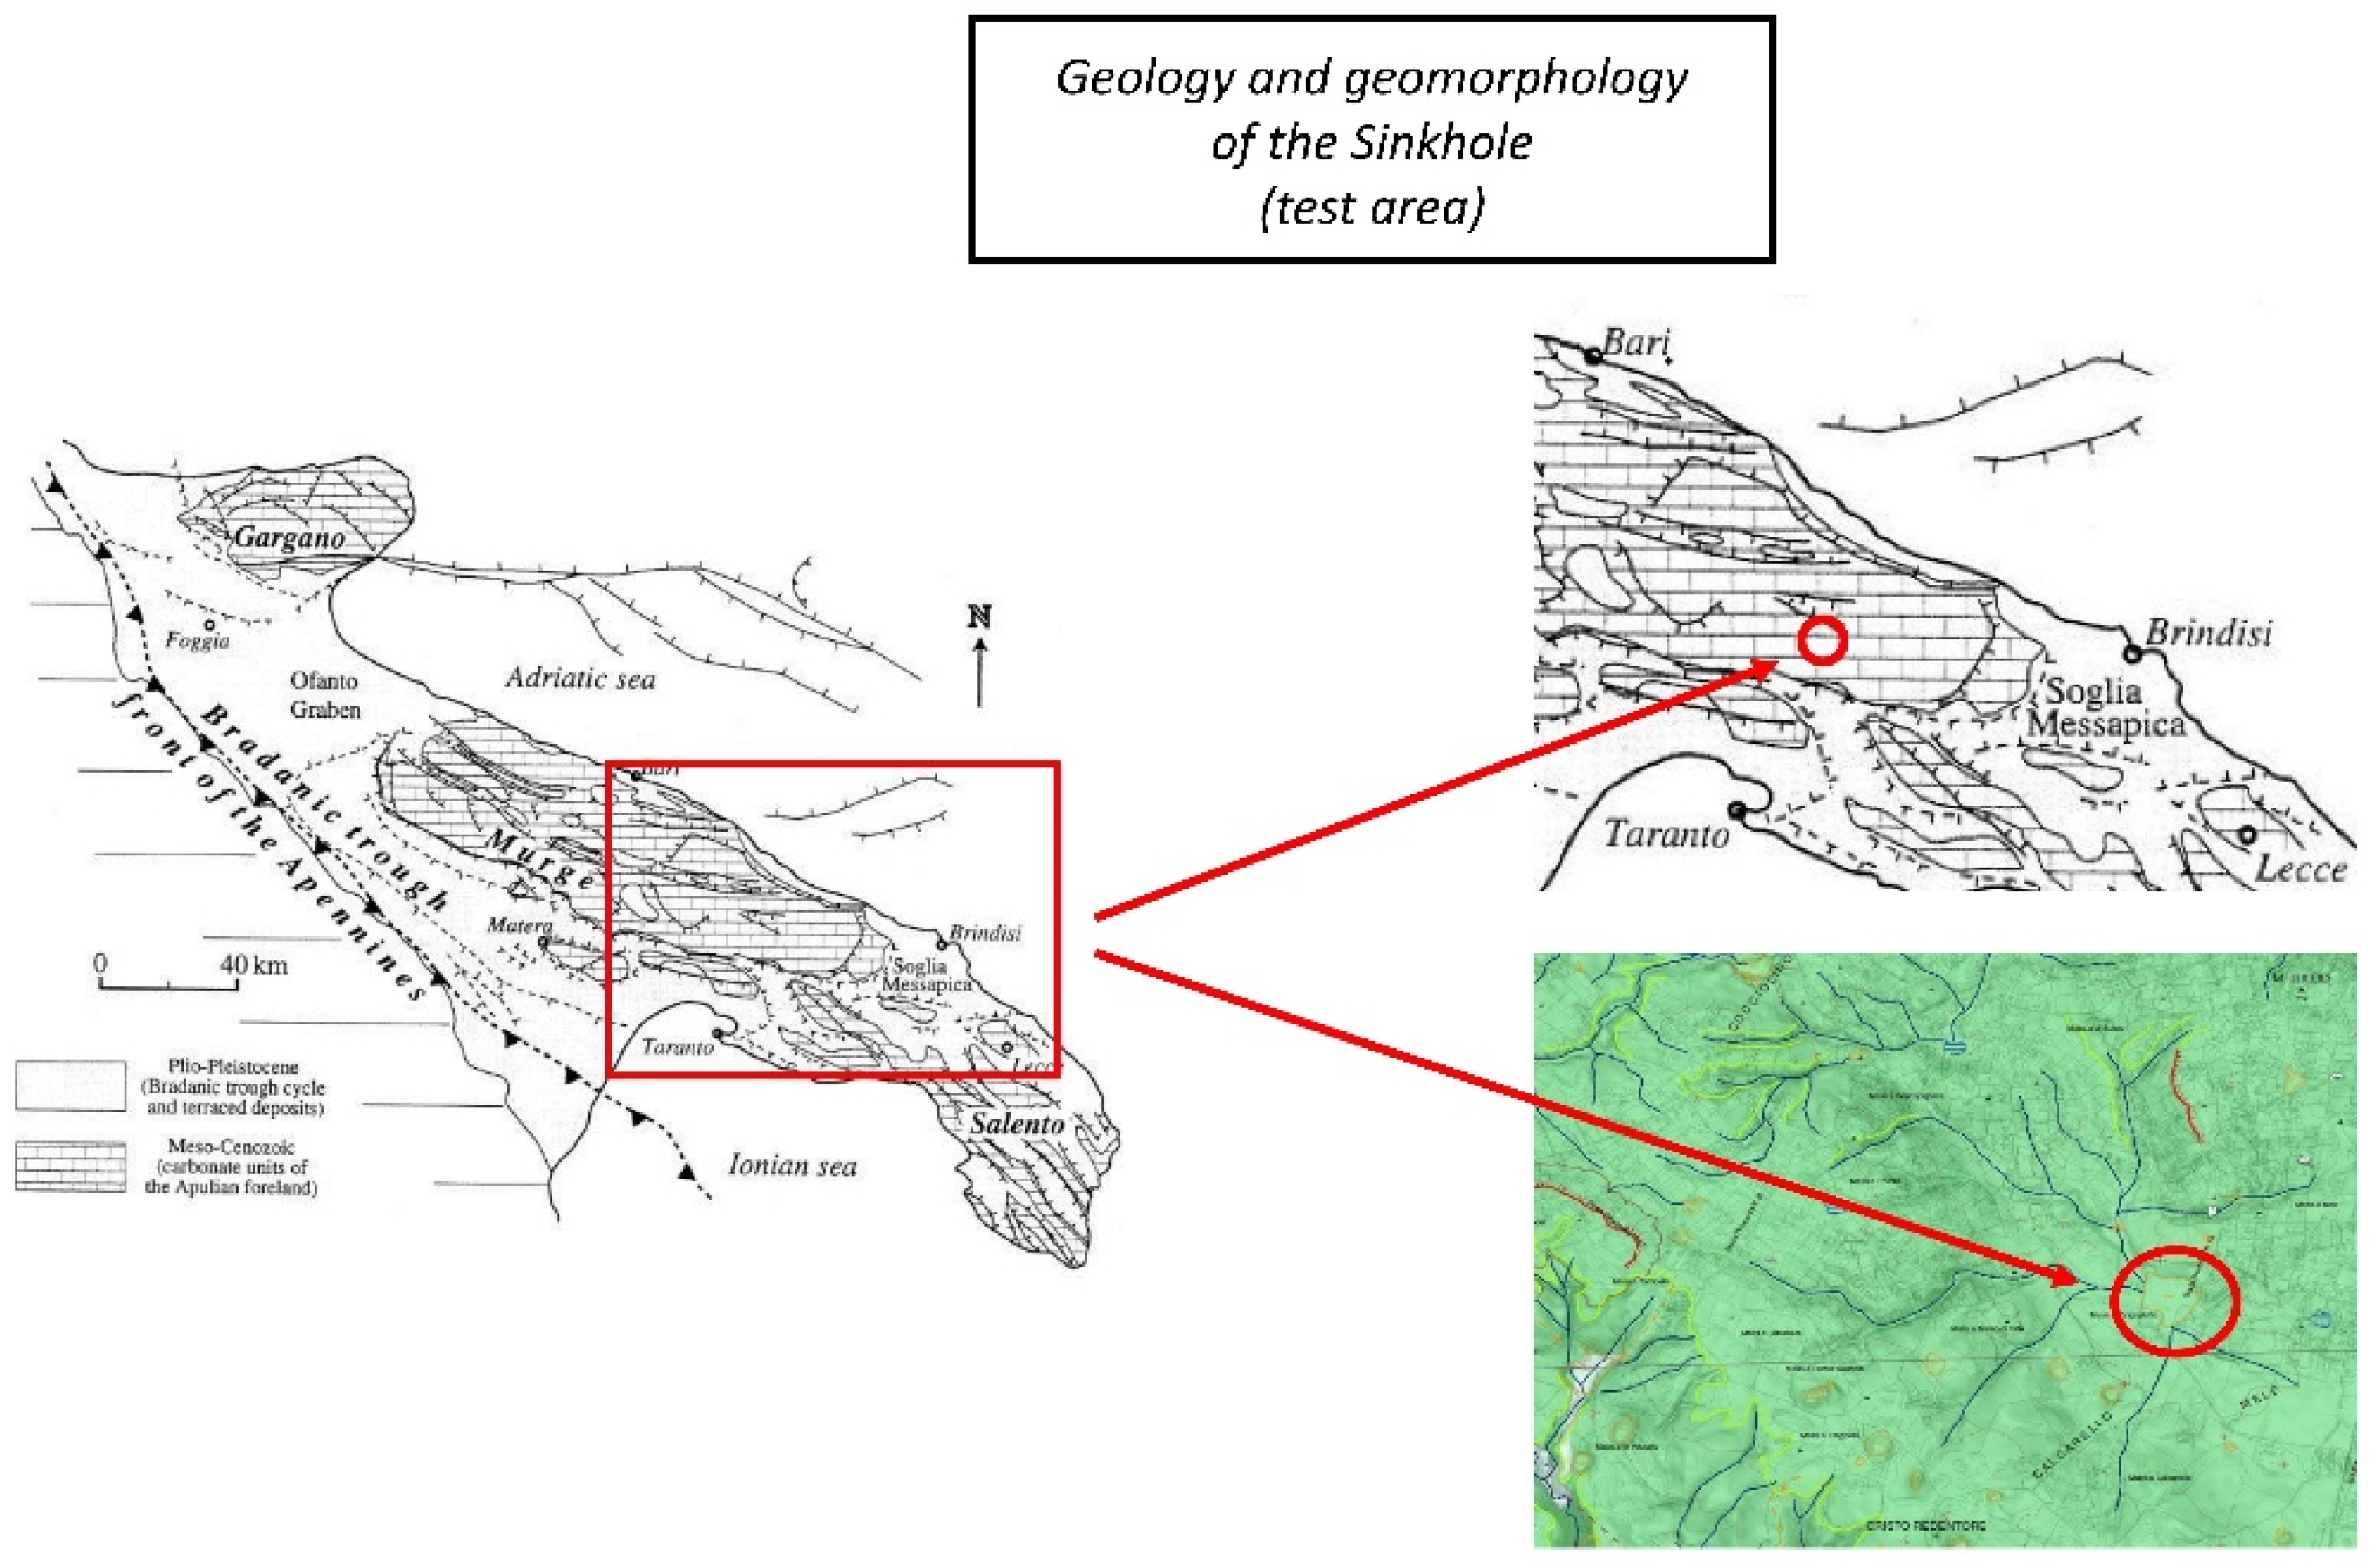
From a geological point of view, the test area is located on the Altopiano delle Murge (
Figure 2). It represents the forepart of the orogenic belt of the southern Apennines of the Pleistocene period [
26], which is composed of a varitano base on which there is a pre-orogenic Mesozoic sedimentary cover of 6–7 km thick, mainly consisting of limestone and dolomites from the Triassic to the Cretaceous period.
These carbonate rocks have accumulated on a vast Bahamian-type platform called Apulia [
27]. The carbonate succession of the Cretaceous in the Murge consists of a stratigraphic succession of about 3 km thick of shallow marine carbonates [
28,
29]. Two main lithostratigraphic units, separated by a Cenomanian–Turonian discord, have been recognized in the Cretaceous succession of the internal platform of the Murge: the “Limestone of Bari”, about 2000 m thick and the “Limare di Altamura” of about 1000 m thick. From a geomorphological point of view, the Murgia Plateau as a whole has a hilly aspect with reliefs that reach altitudes of 500–600 m above sea level. The limestone areas, subject to high chemical–physical alteration, are carved by numerous watercourses delimited by sub-vertical walls. Precisely for these reasons, the effects of these processes (cavities, sinkholes, etc.) are very frequently observed on the landscape. In particular, the study area is part of a sinkhole within which there is also a sinkhole.
1.2. Climatological Setting
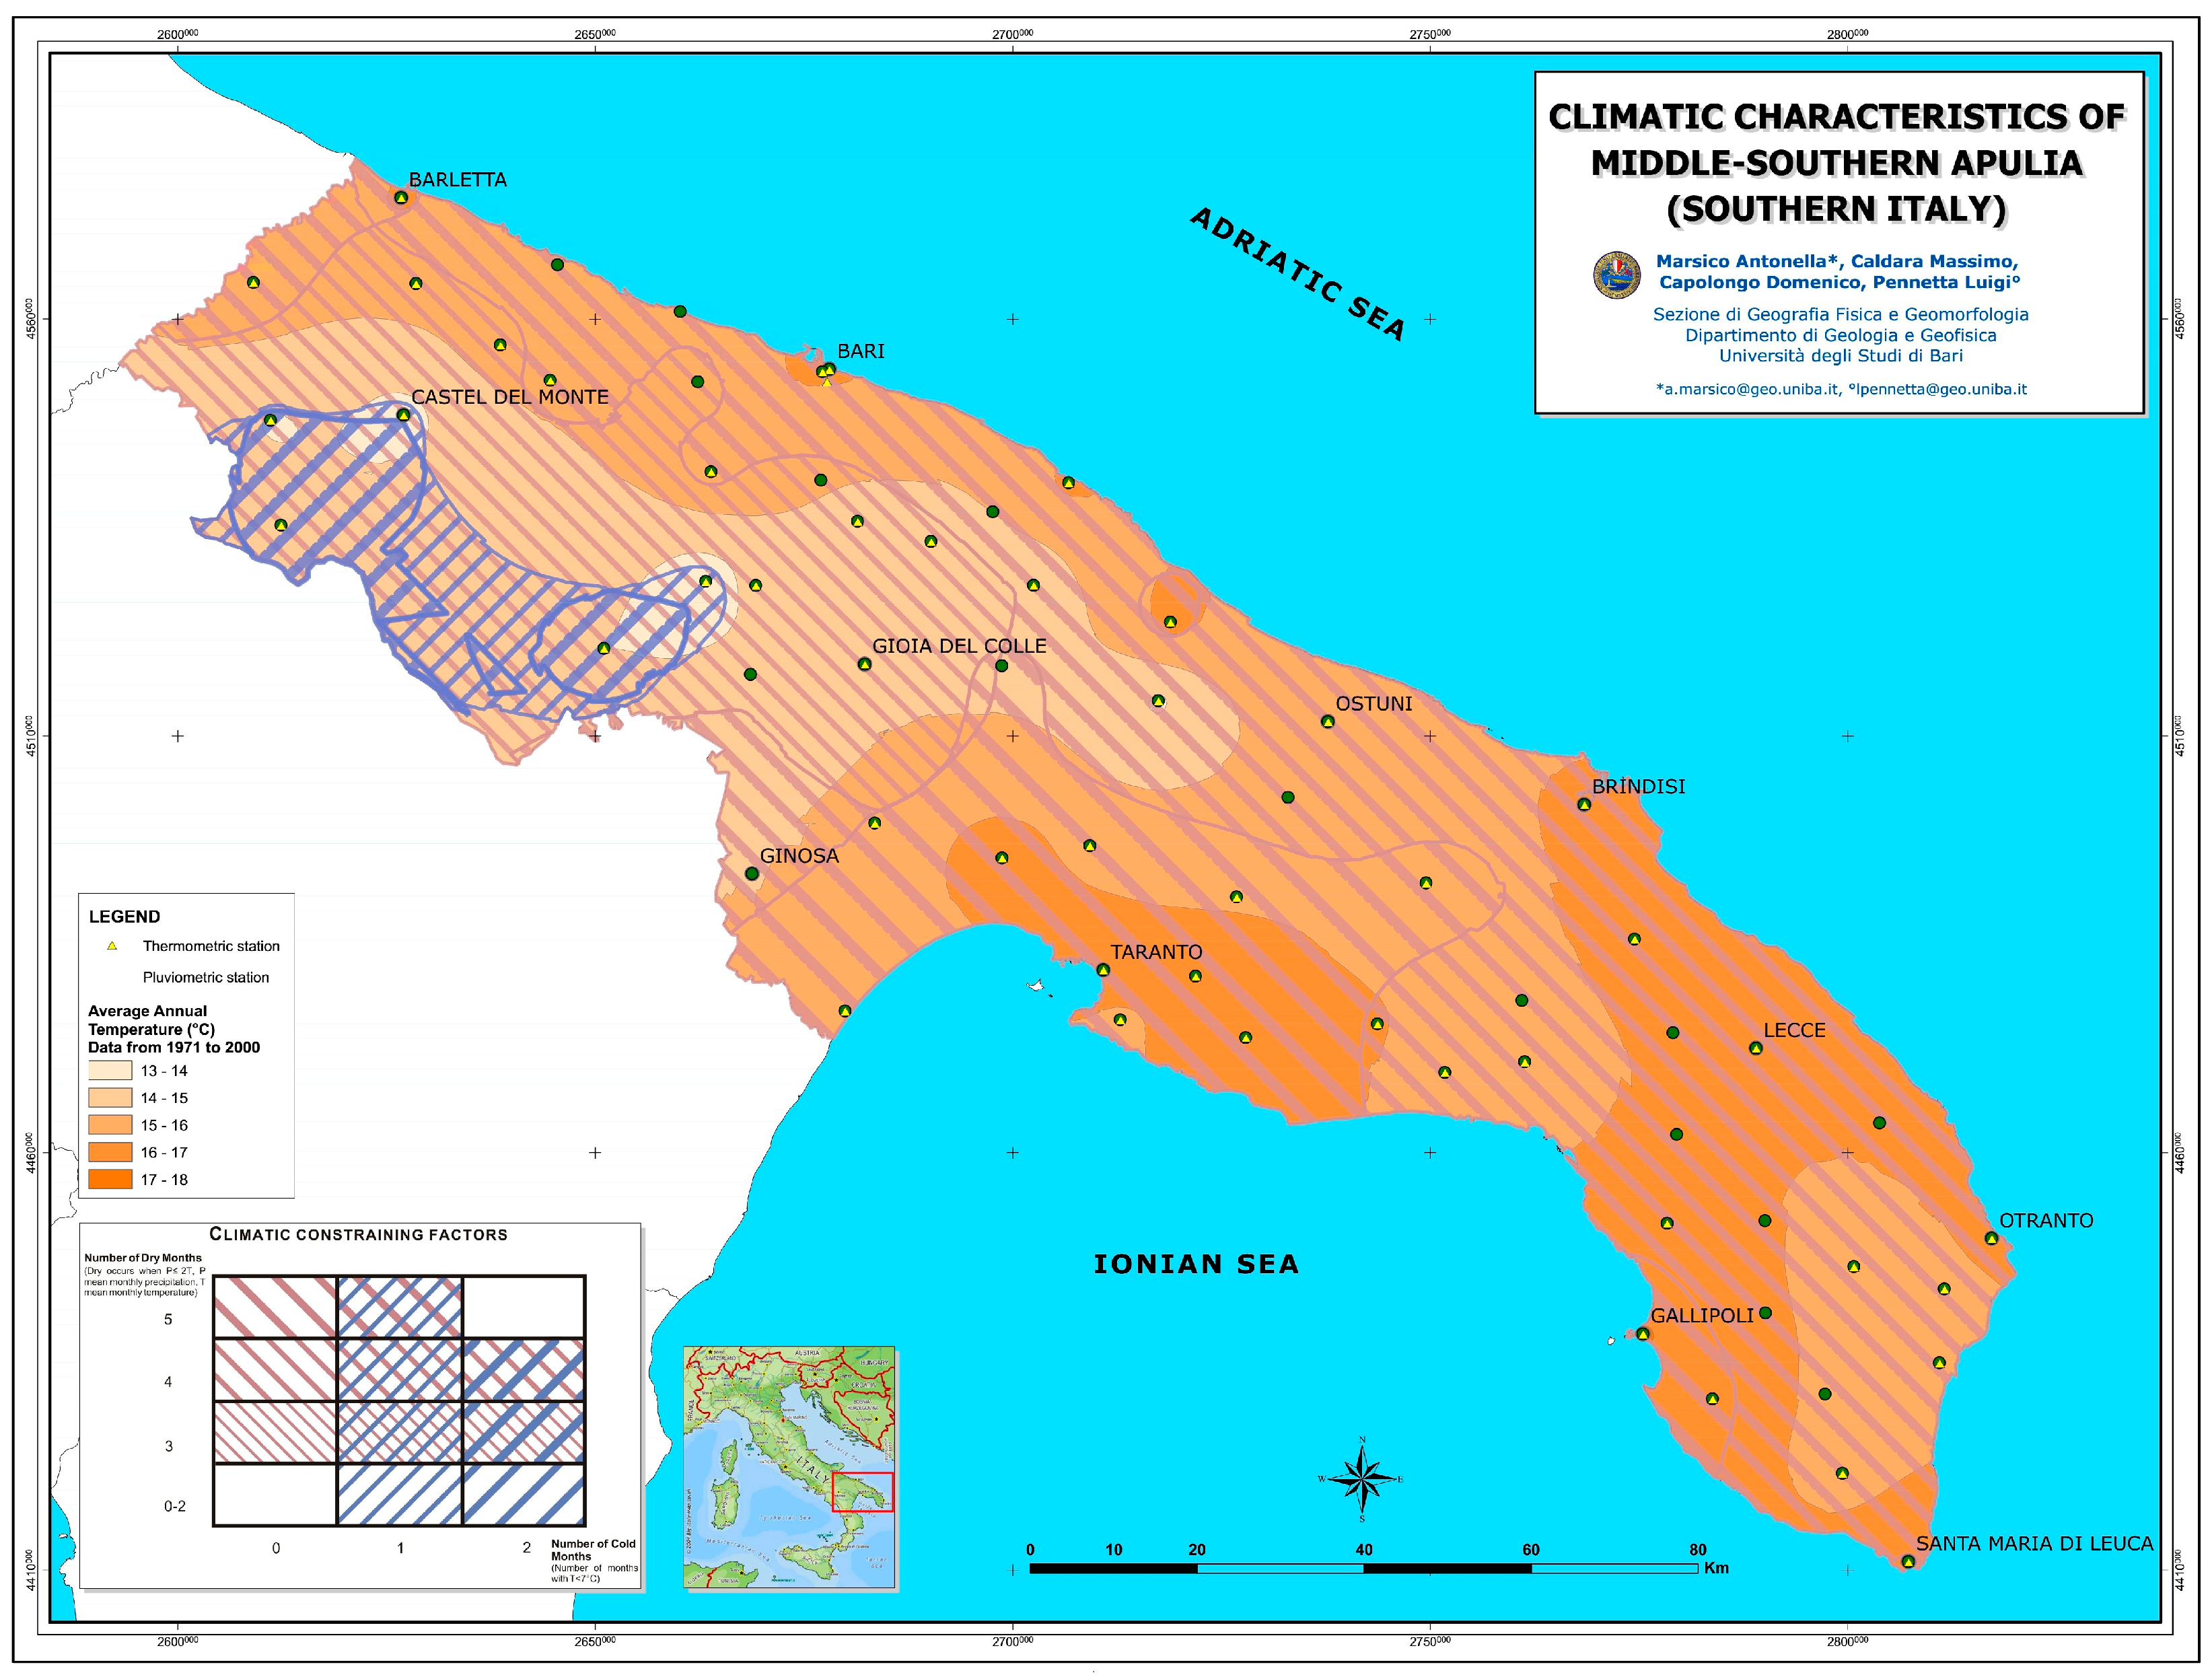
Considering the data processed in the time period 1971–2000 [
30], the average annual temperature of the Murge Plateau fluctuates between 14 and 15 °C (
Figure 3).
However, in particular geomorphological contexts particular microclimates can occur, characterized by temperatures that can vary significantly within a few meters. This is precisely the case in the study area of this work. In fact, in high pressure meteorological configurations, very different temperature values are recorded inside the sinkholes than in the surrounding areas.
2. Materials and Methods
In order to identify the vertical atmospheric profile in the first 80 m of altitude starting from the surface of the test area of this work, the following are tested: a UAV, an atmospheric data logger and a sun screen. Specifically, a DJI PHANTOM 3 PRO (
Figure 4a) was used, which is a quadcopter normally having a gimbal that supports a 12 MP camera. For this study, the camera and gimbal were disassembled to take advantage of the space and allocate the data logger inserted inside the sun screen. Considering the flight characteristics, this UAV allows a maximum climb speed of 5 m/s and a maximum descent speed of 3 m/s. In addition, thanks to the presence of a GPS/GLONASS satellite positioning system, it allows a vertical positioning accuracy of 0.5 m and a horizontal positioning accuracy of 1.5 m. The 4S LiPo battery that is inserted inside the drone ensures a flight range of about 20 min. The UAV is controlled on the ground by a remote control in the possession of the pilot who controls the drone in real time and monitors the actual execution of the flight mission. The atmospheric data logger used for this test was the UNI-T (model UT330A) (
Figure 4b) which, thanks to its small size and low weight, can be installed without difficulty on any platform and in any environment. The data logger has a high protection level against the presence of dust and water thanks to its IP67 certification. This data logger allows the measurement and acquisition of data regarding the air temperature. In addition, the acquired data are stored in the sensor memory, which has a capacity of 60,000 measurements. The number of these measurements strictly depends on the sampling frequency set at the beginning of the acquisition. The temperature sensor has a measurement range of between −40 °C and 80 °C with an accuracy of ± 0.5 °C in the range 0–40 °C, an accuracy of ±1 °C in the range −30–0 °C and 40–70 °C and an accuracy of ± 2 °C in the temperature range between −40 °C and −30 °C and between 70 °C and 80 °C. The resolution of this sensor is 0.1 °C. The data logger is powered by a 3.6 V battery and, thanks to a USB interface, allows the download of the acquired data on a PC. In particular, the data are recorded on the internal memory of the data logger and are subsequently downloaded to a PC in .txt format. As previously mentioned, the data logger was inserted inside a meteorological screen (
Figure 4c) capable of protecting the sensors from solar radiation, thus avoiding the measurement and acquisition of wrong values in the presence of the sun. The acquisition system, consisting of the data logger and the meteorological screen, was correctly mounted on board the UAV in a position that allows for adequate air flow and high solar shading.
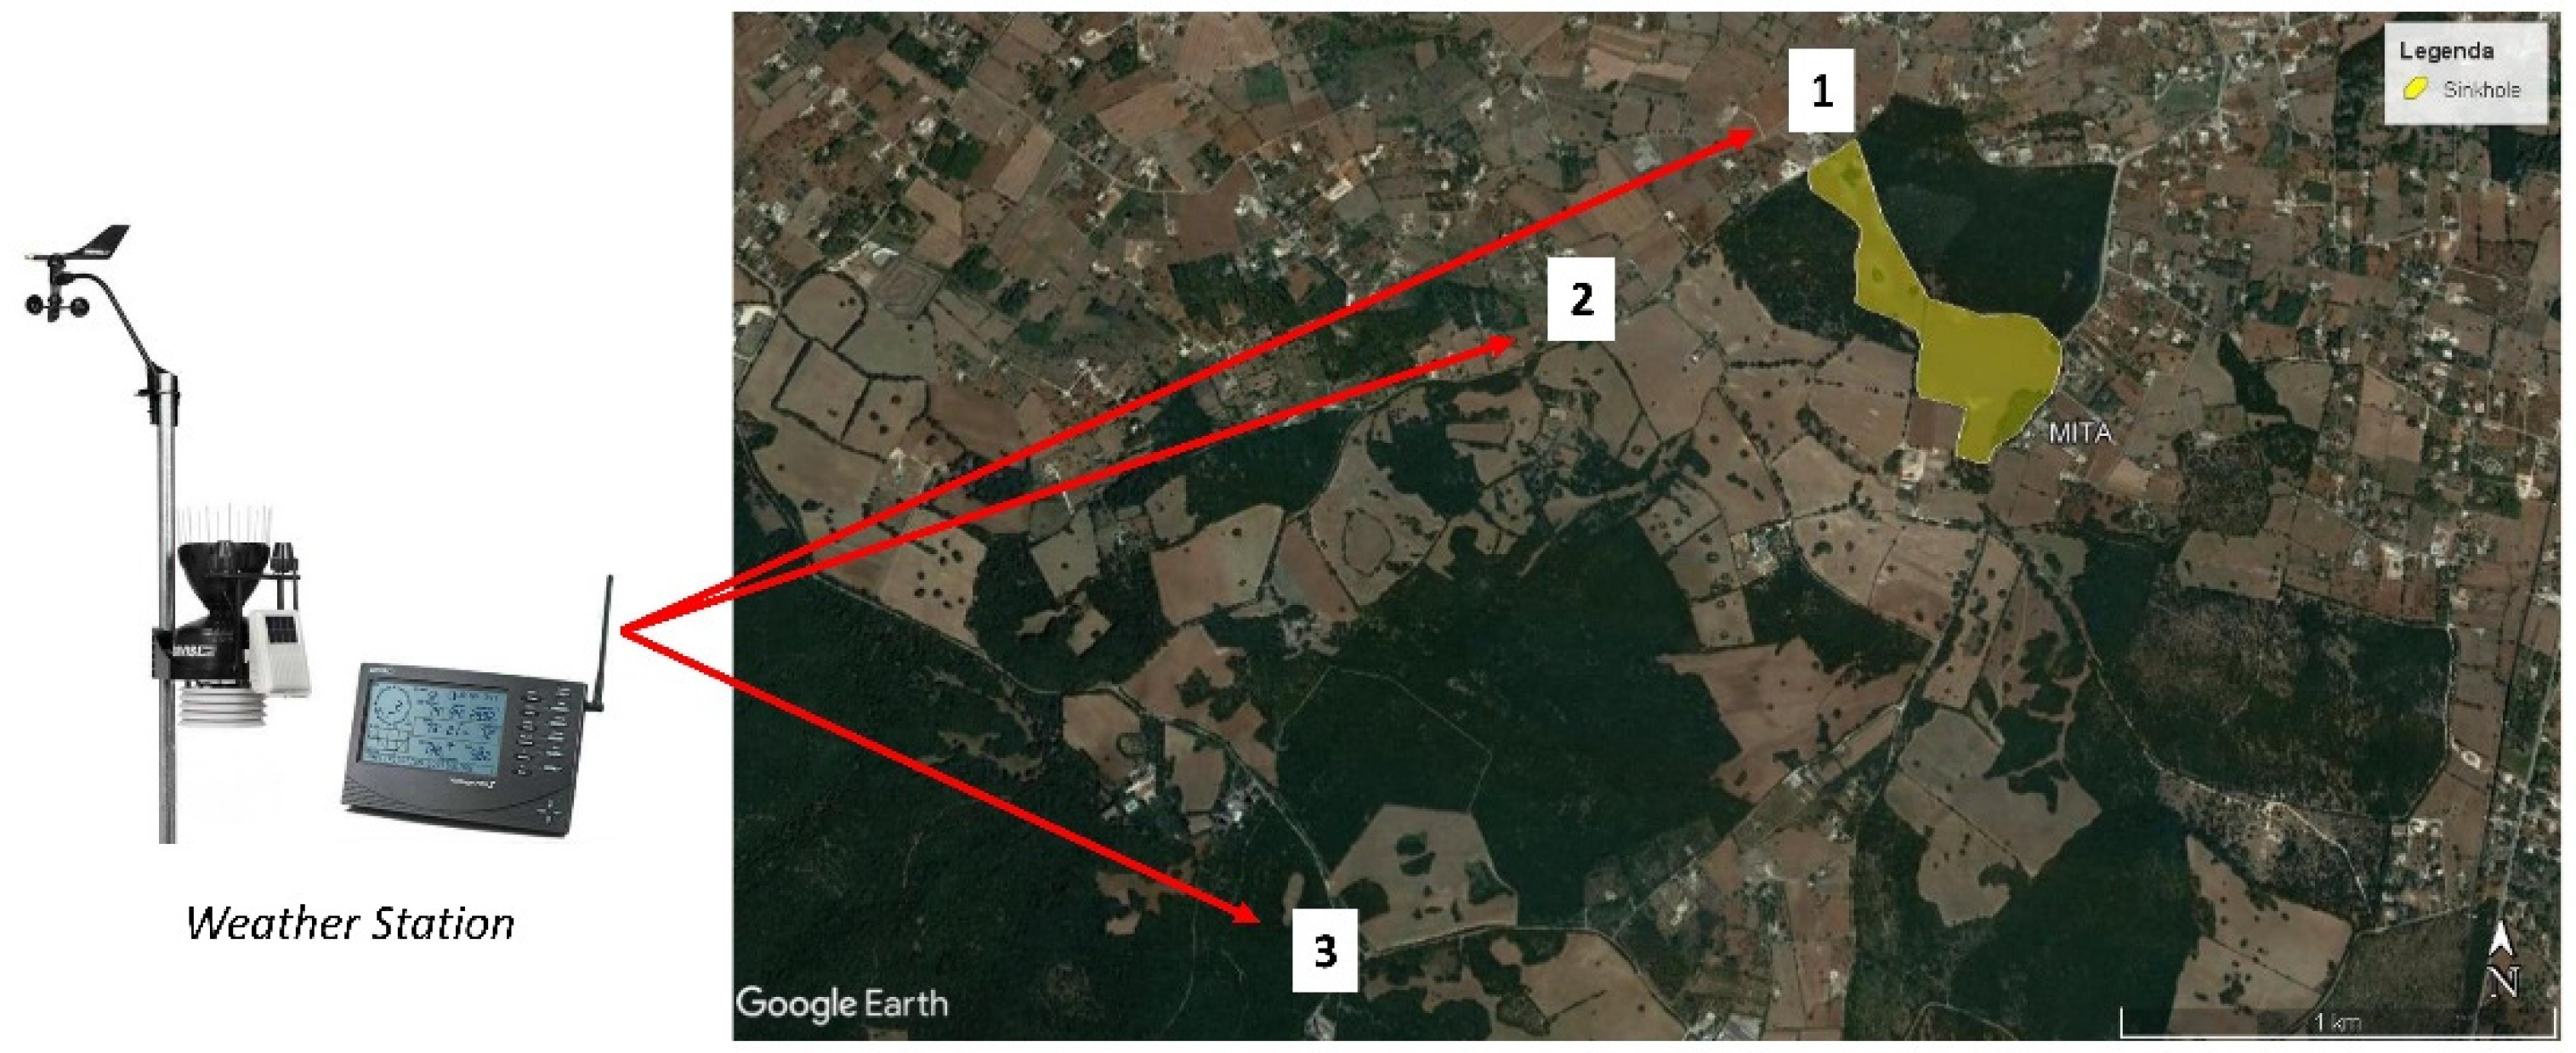
For ground validation of the temperature data acquired along the air column of the first 80 m, three DAVIS VANTAGE PRO 2 weather stations (
Figure 5) were installed within a radius of 2 km.
In particular, one was positioned near the take-off point and therefore in the deepest point of the sinkhole (410 m m.s.l.), one along the slope of the sinkhole (450 m m.s.l.) and corresponding to half the flight altitude of the UAV, and one at the top of the hill (490 m m.s.l.) corresponding to the maximum flight altitude of the UAV (
Figure 6).
The weather station used allows the measurement of multiple atmospheric parameters. However, only the temperature value was acquired for the purpose of this work. The temperature sensor works in a range between −40 °C and 65 °C with an accuracy of ±0.5 °C and a resolution of 0.1 °C. Also, in this case, all sensors are inserted inside a weather screen capable of filtering solar radiation. The positioning and installation of the meteorological stations took place in accordance with the guidelines of the WMO (World Meteorological Organization, Geneva, Switzerland).
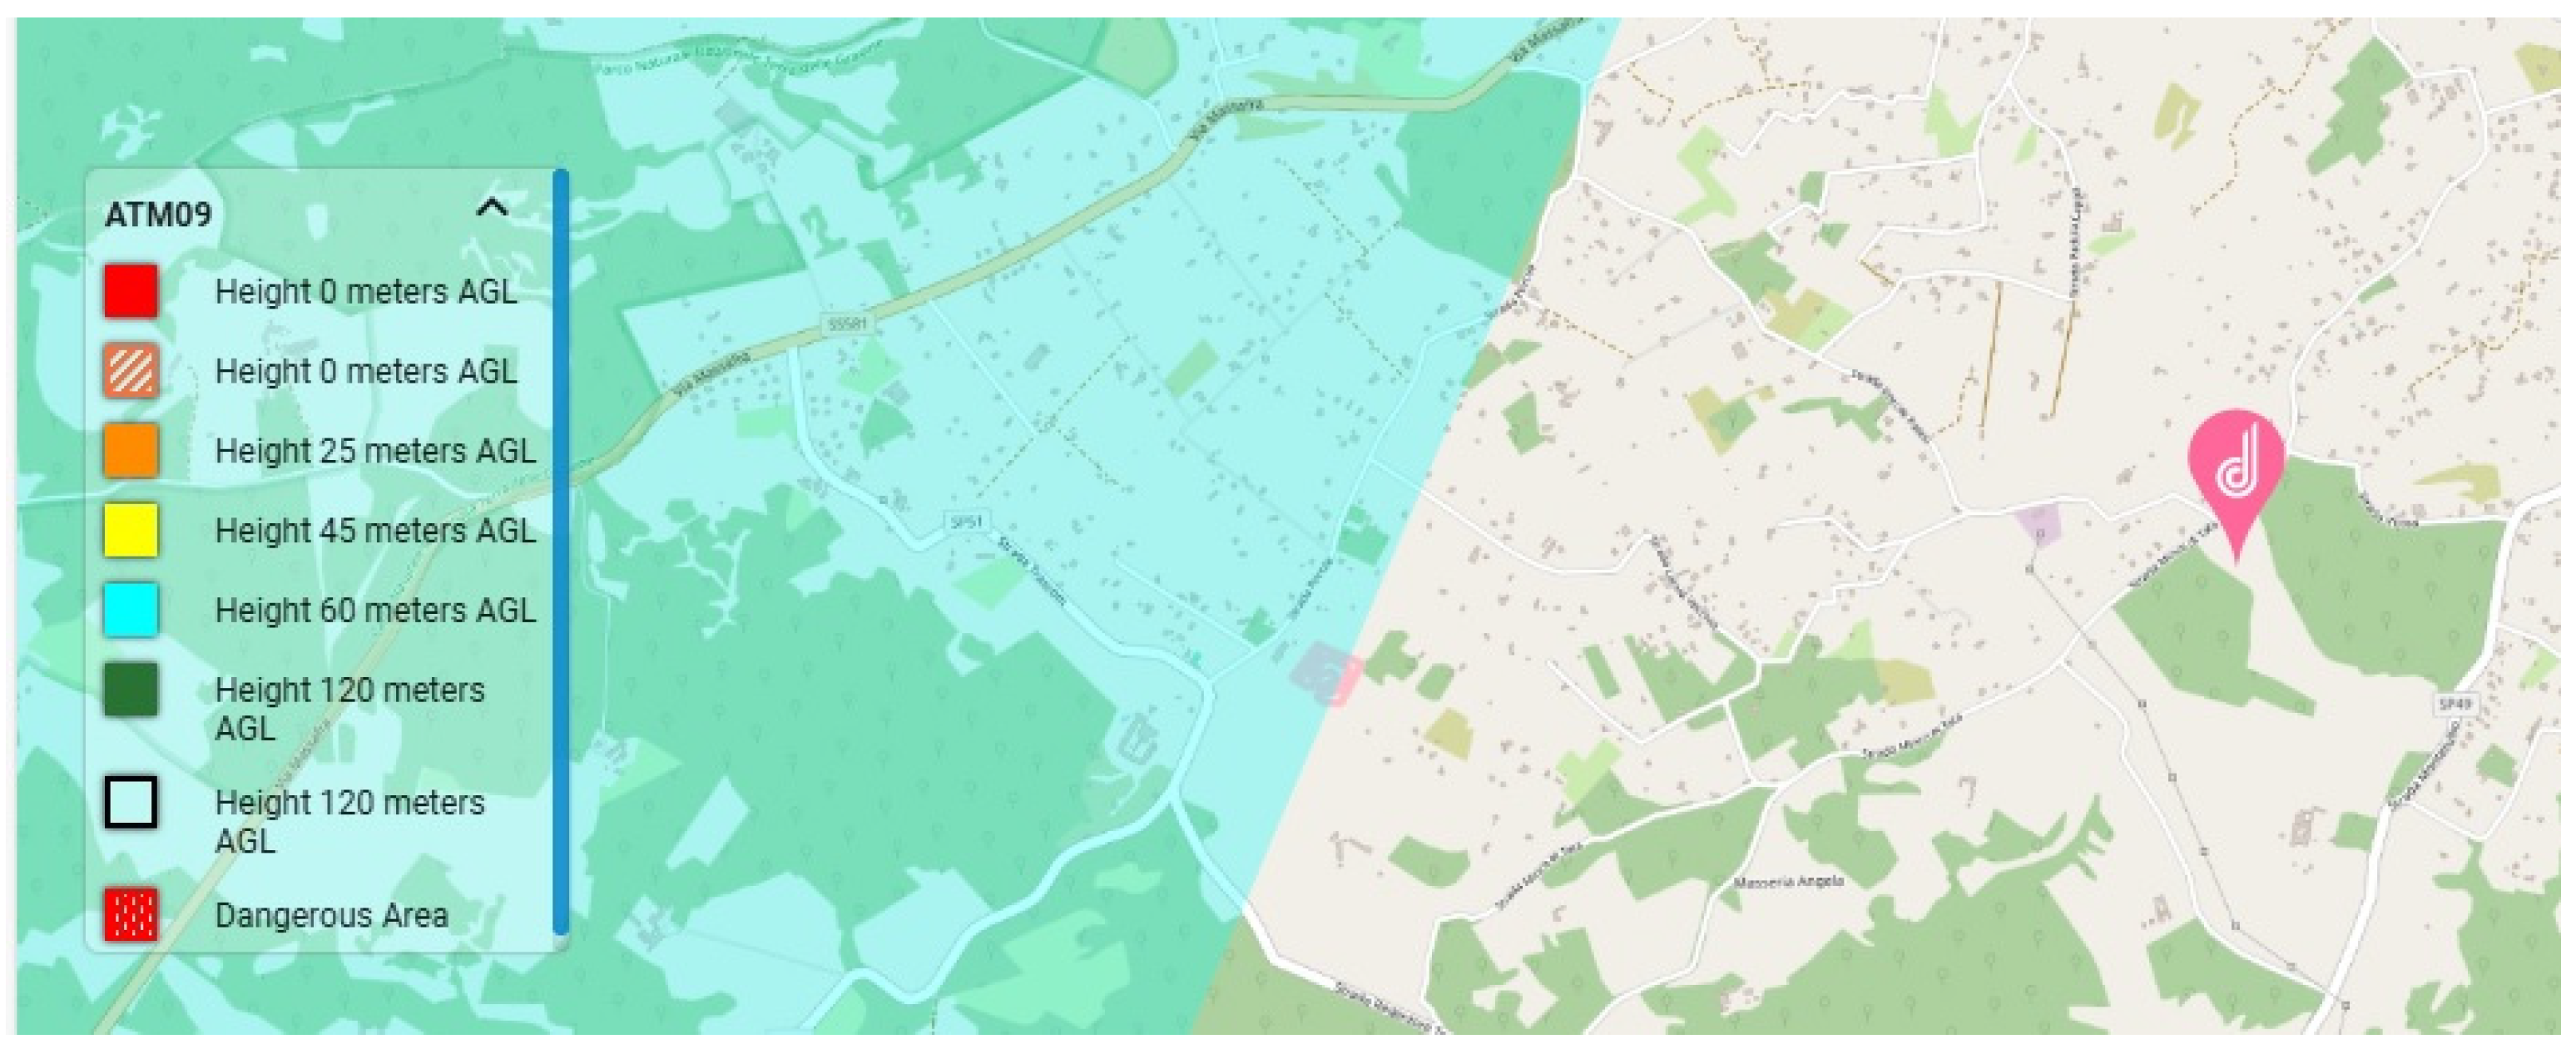
Before starting the flight missions, the first step was to consult the Italian aeronautical maps dedicated to drone flights in order to verify the possible presence of restricted areas from an aeronautical point of view (
Figure 7).
This phase ended with the finding that the chosen test area was free of any aeronautical constraint that prohibited flying from UAVs.
The three flights with the UAV took place, respectively, at 6:00 p.m. UTC on 16 February 2021, at 6:00 a.m. UTC on 17 February 2021, and at 6:00 a.m. UTC on 27 February 2021 (
Figure 8).
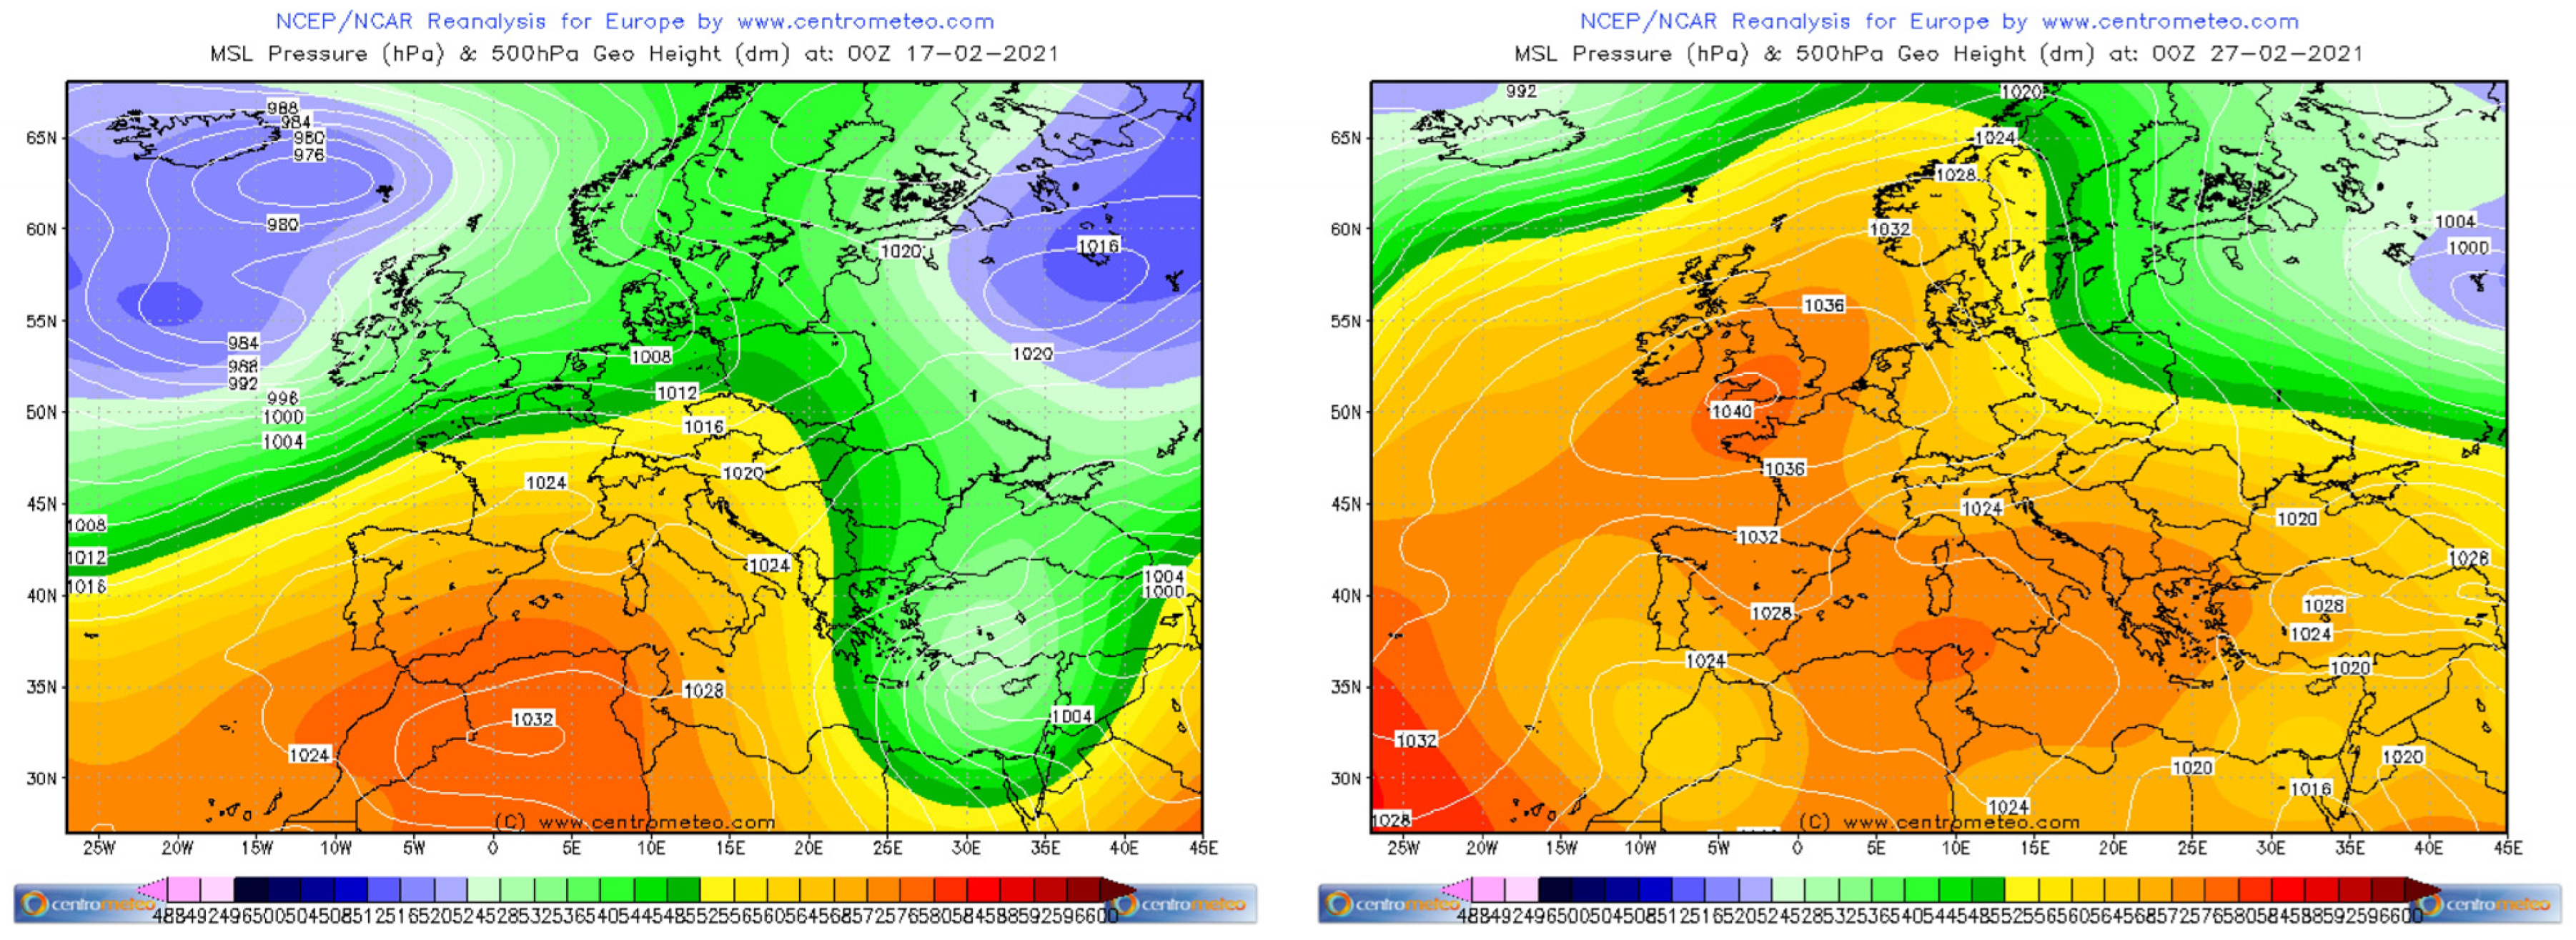
From a meteorological point of view, the conditions for the flights were favorable thanks to the location on the study area, but more generally in Italy, of high pressure (
Figure 9). These thermobaric conditions combined with the absence of wind allowed the formation of the so-called thermal inversion, particularly accentuated in the valleys and depressions (similarly to the test area in question). The most important feature in periods of thermal inversion is the increase in temperature with the increase in altitude. This peculiarity is particularly accentuated in the coldest hours of the day.
From an operational point of view, the three flights reached the maximum altitude of 80 m from the deepest point of the sinkhole in a time of 80 s, each at a climb speed of 1 m/s. Considering the flight parameters, the data logger was preset to a sampling frequency of 1 s. The choice of these parameters allowed the minimization of the thermal inertia of the sensor installed on the UAV. Therefore, for each flight carried out, 160 temperature measurements were collected, thus covering the acquisition of the atmospheric parameters detected by the data logger, including the ascent and descent path of the drone for each meter of altitude. At the end of the ascent, before starting the descent phase, the drone hovered for 10 min at a height of 80 m above the ground. This phase allowed a rapid check of all flight parameters and the data sampled during this time period were excluded from the study.
The three ground weather stations (positioned at different altitudes above mean sea level) were also set to a sampling rate of 1 s. The choice of this parameter allows minimization of the thermal inertia of the weather stations. This standardized the data acquired by the meteorological stations with those acquired by the data logger on board the UAV and then to proceed to a comparison useful for the possible validation of the methodology proposed in this research work. Before the tests, to avoid acquisition time deviations, the same timestamp was set both on the sensor installed on the UAV and on the ground weather stations. This allowed a perfect temporal alignment between all the thermal data acquisition sensors. Furthermore, the correct reading of the UAV altitude was addressed in a double cross-check. In particular, during the ascent and descent flights, the flight altitude indicated by the UAV GPS and the flight altitude calculated considering the physical law of uniform rectilinear motion were simultaneously checked. This calculation was made possible thanks to the ascent and descent speed set to 1 m/s and the use of a digital stopwatch to calculate the associated flight time. By crossing these checks, the flight altitude indicated by the UAV GPS was effectively validated.
3. Results
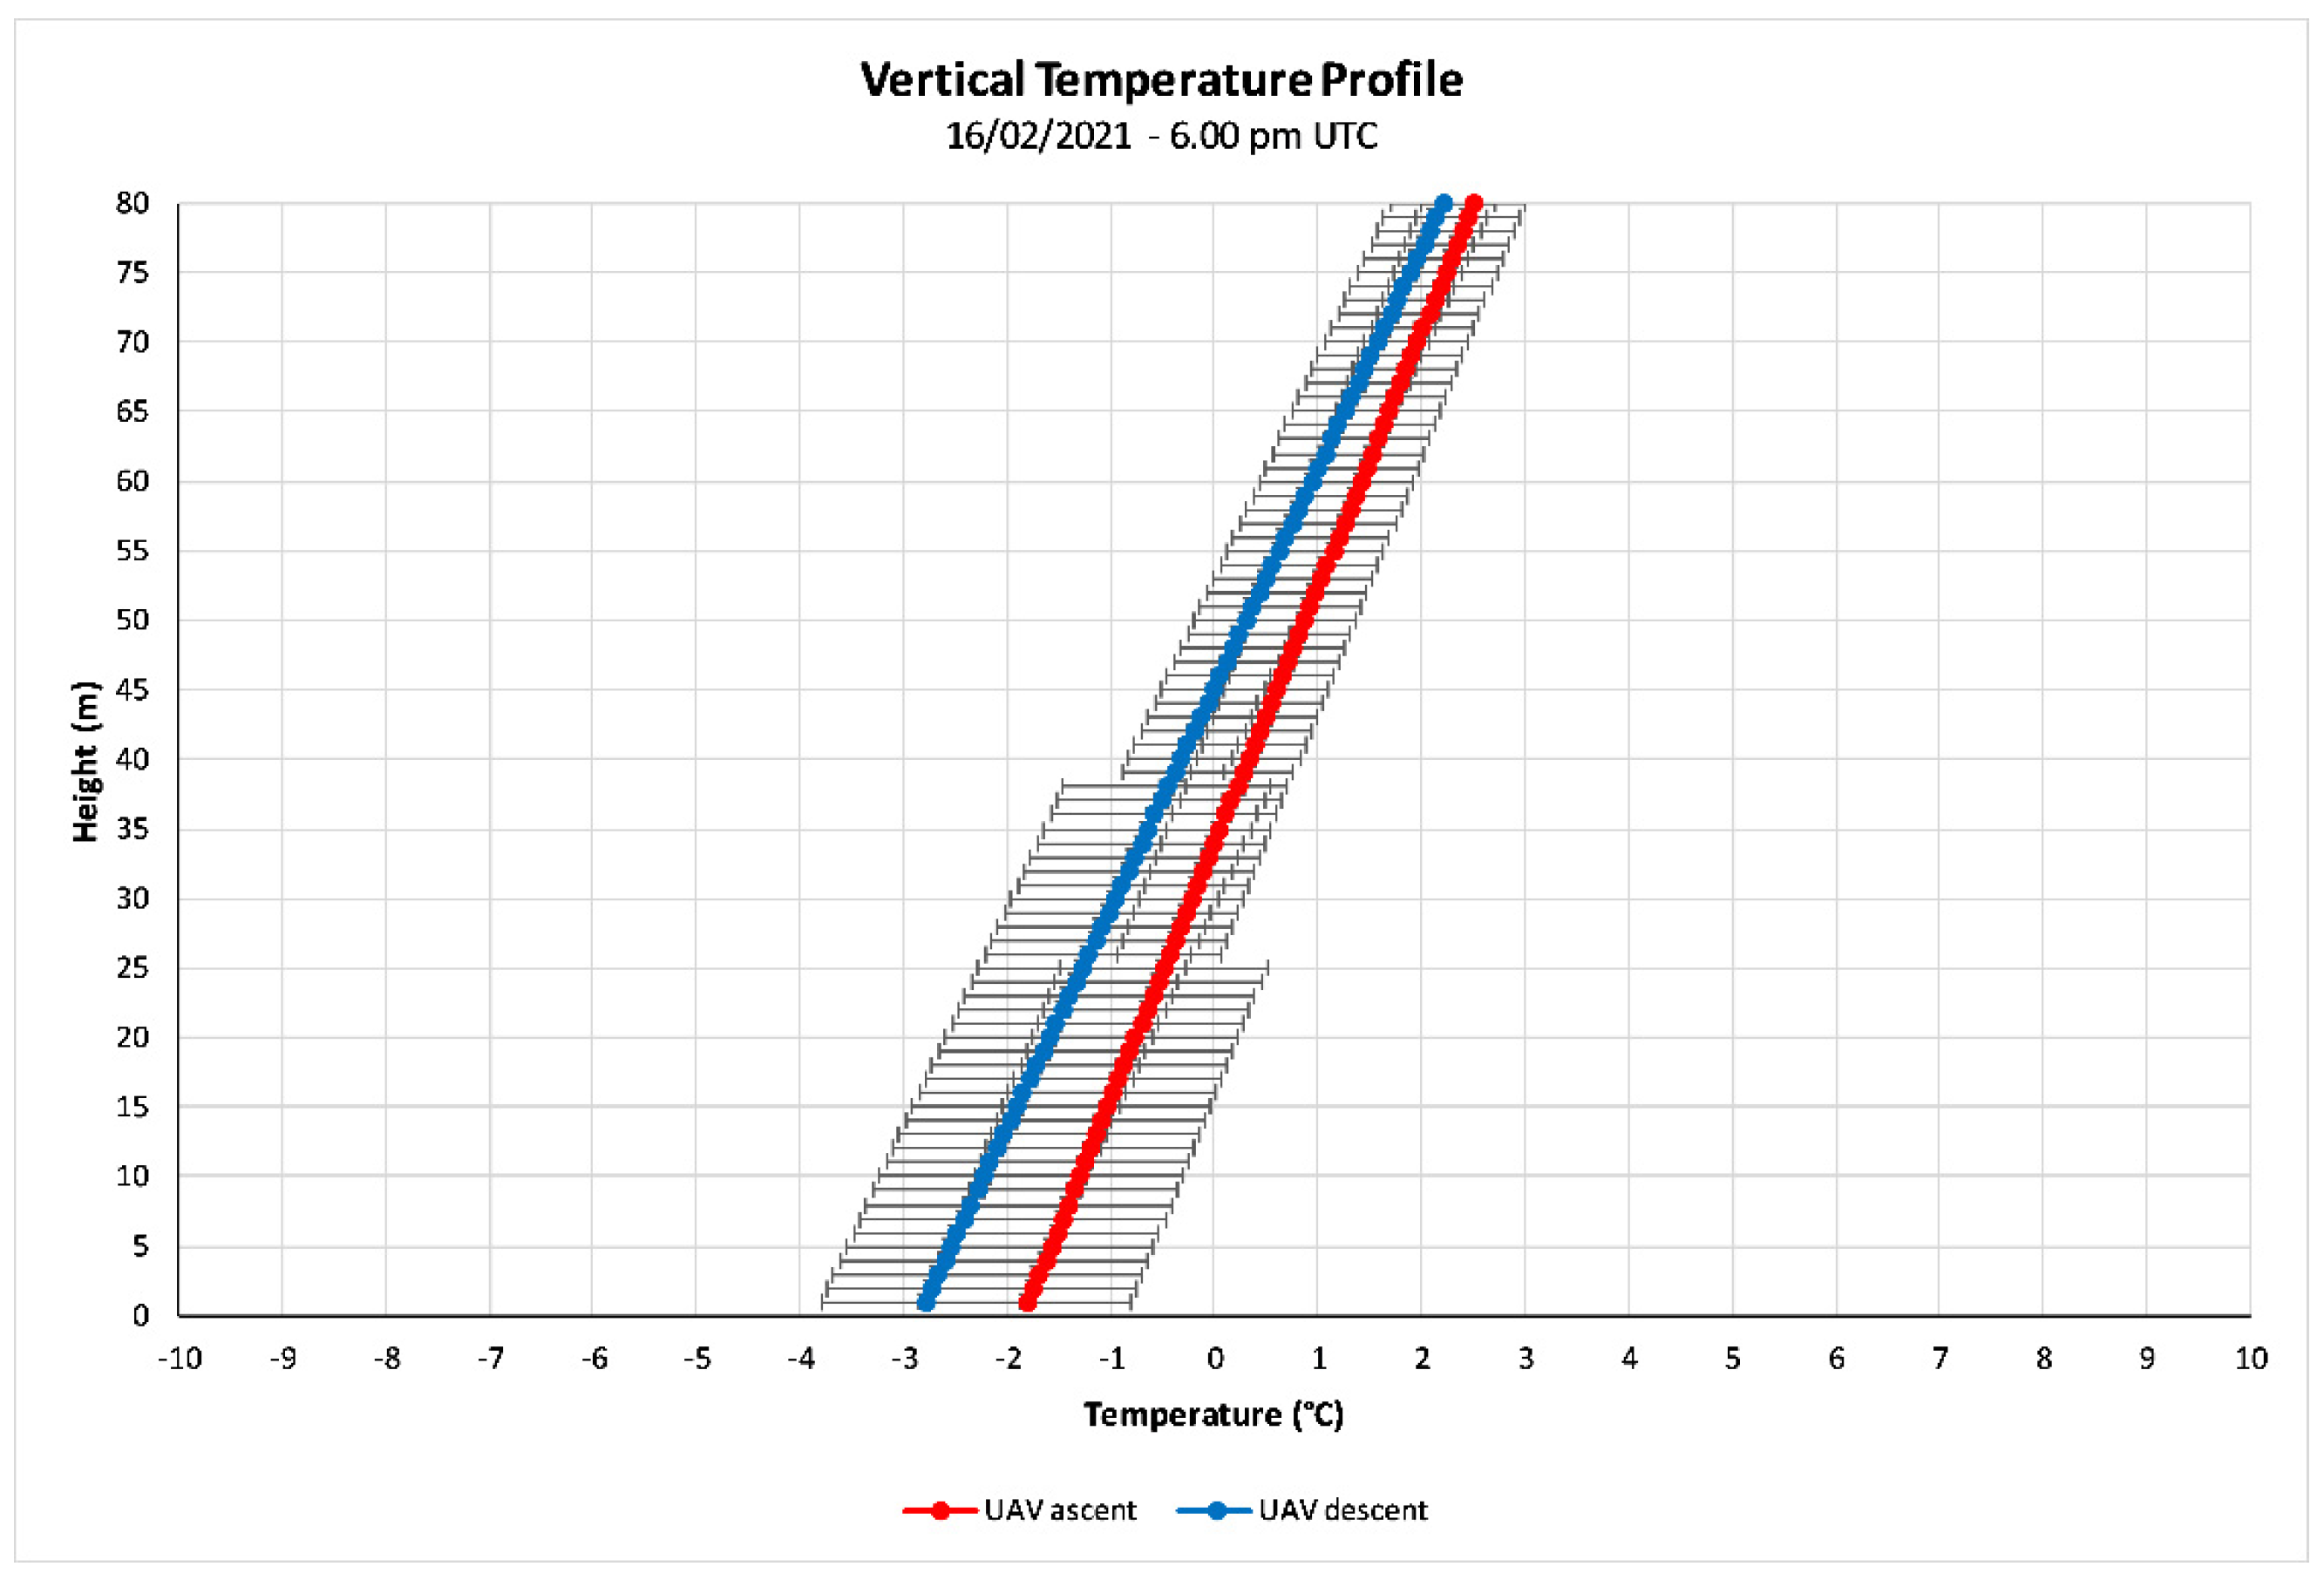
All the data acquired by the data logger installed on the UAV and by the three weather stations positioned on the ground were downloaded to the PC through proprietary software. Subsequent processing made it possible to obtain the following vertical temperature profiles (
Figure 10) for both ascent and descent of the drone in the three flight missions:
The two vertical temperature profiles clearly show the formation of a thermal inversion in the sinkhole at 06:00 p.m. on 16 February 2021 in the ascent flight, with its intensification in the subsequent descent path. Moreover, the graph shows a decrease in temperature of 1 °C at 1 m of altitude over a timespan of 160 s. This rate of decrease occurs up to an altitude of about 40 m. From this altitude onwards, the rate of decrease attenuated until reaching the maximum flight and acquisition altitude where the thermal difference was reduced to 0.3 °C.
The validation of these thermal data acquired in flight took place from the processed data coming from the three meteorological stations positioned on the ground at different altitudes (
Table 1) but corresponding to the altitude differences of the entire flight, i.e., 80 m, as described in the previous chapter.
The data reported in the previous tables show an almost perfect alignment between the data acquired by the data logger installed on the UAV (
Table 2) and the data acquired by the three ground weather stations. From a statistical point of view, the data from the three meteorological stations and the data from the data logger installed on the UAV show a high correlation coefficient equal to 1 and an RMSE value equal to 0.
A further validation of this methodology took place from the processing of all the data acquired the morning after the previous flight and in particular at 06:00 a.m. on 17 February 2021 (
Figure 11).
Also, in this case, the two temperature profiles clearly show the presence of thermal inversion within the site subject of this study. In particular, unlike the previous flight, this atmospheric situation begins to diminish and is demonstrated by the increase in temperatures (at medium–low altitudes) between the drone’s ascent and descent path. Only in the 60–80 m altitude range is there is a slight decrease in temperature between the descent path and the previous ascent path of the drone.
Also, for this flight mission, the thermal data coming from the three meteorological stations positioned on the ground were acquired at the same time (
Table 3).
From the previous tables, also in this case, an almost perfect alignment can be seen between the data acquired by the data logger installed on the UAV (
Table 4) and the data acquired by the three meteorological stations on the ground.
In fact, from a statistical point of view, the data from the three meteorological stations and the data from the data logger installed on the UAV show a high correlation coefficient equal to 1 and an RMSE value equal to 0.56.
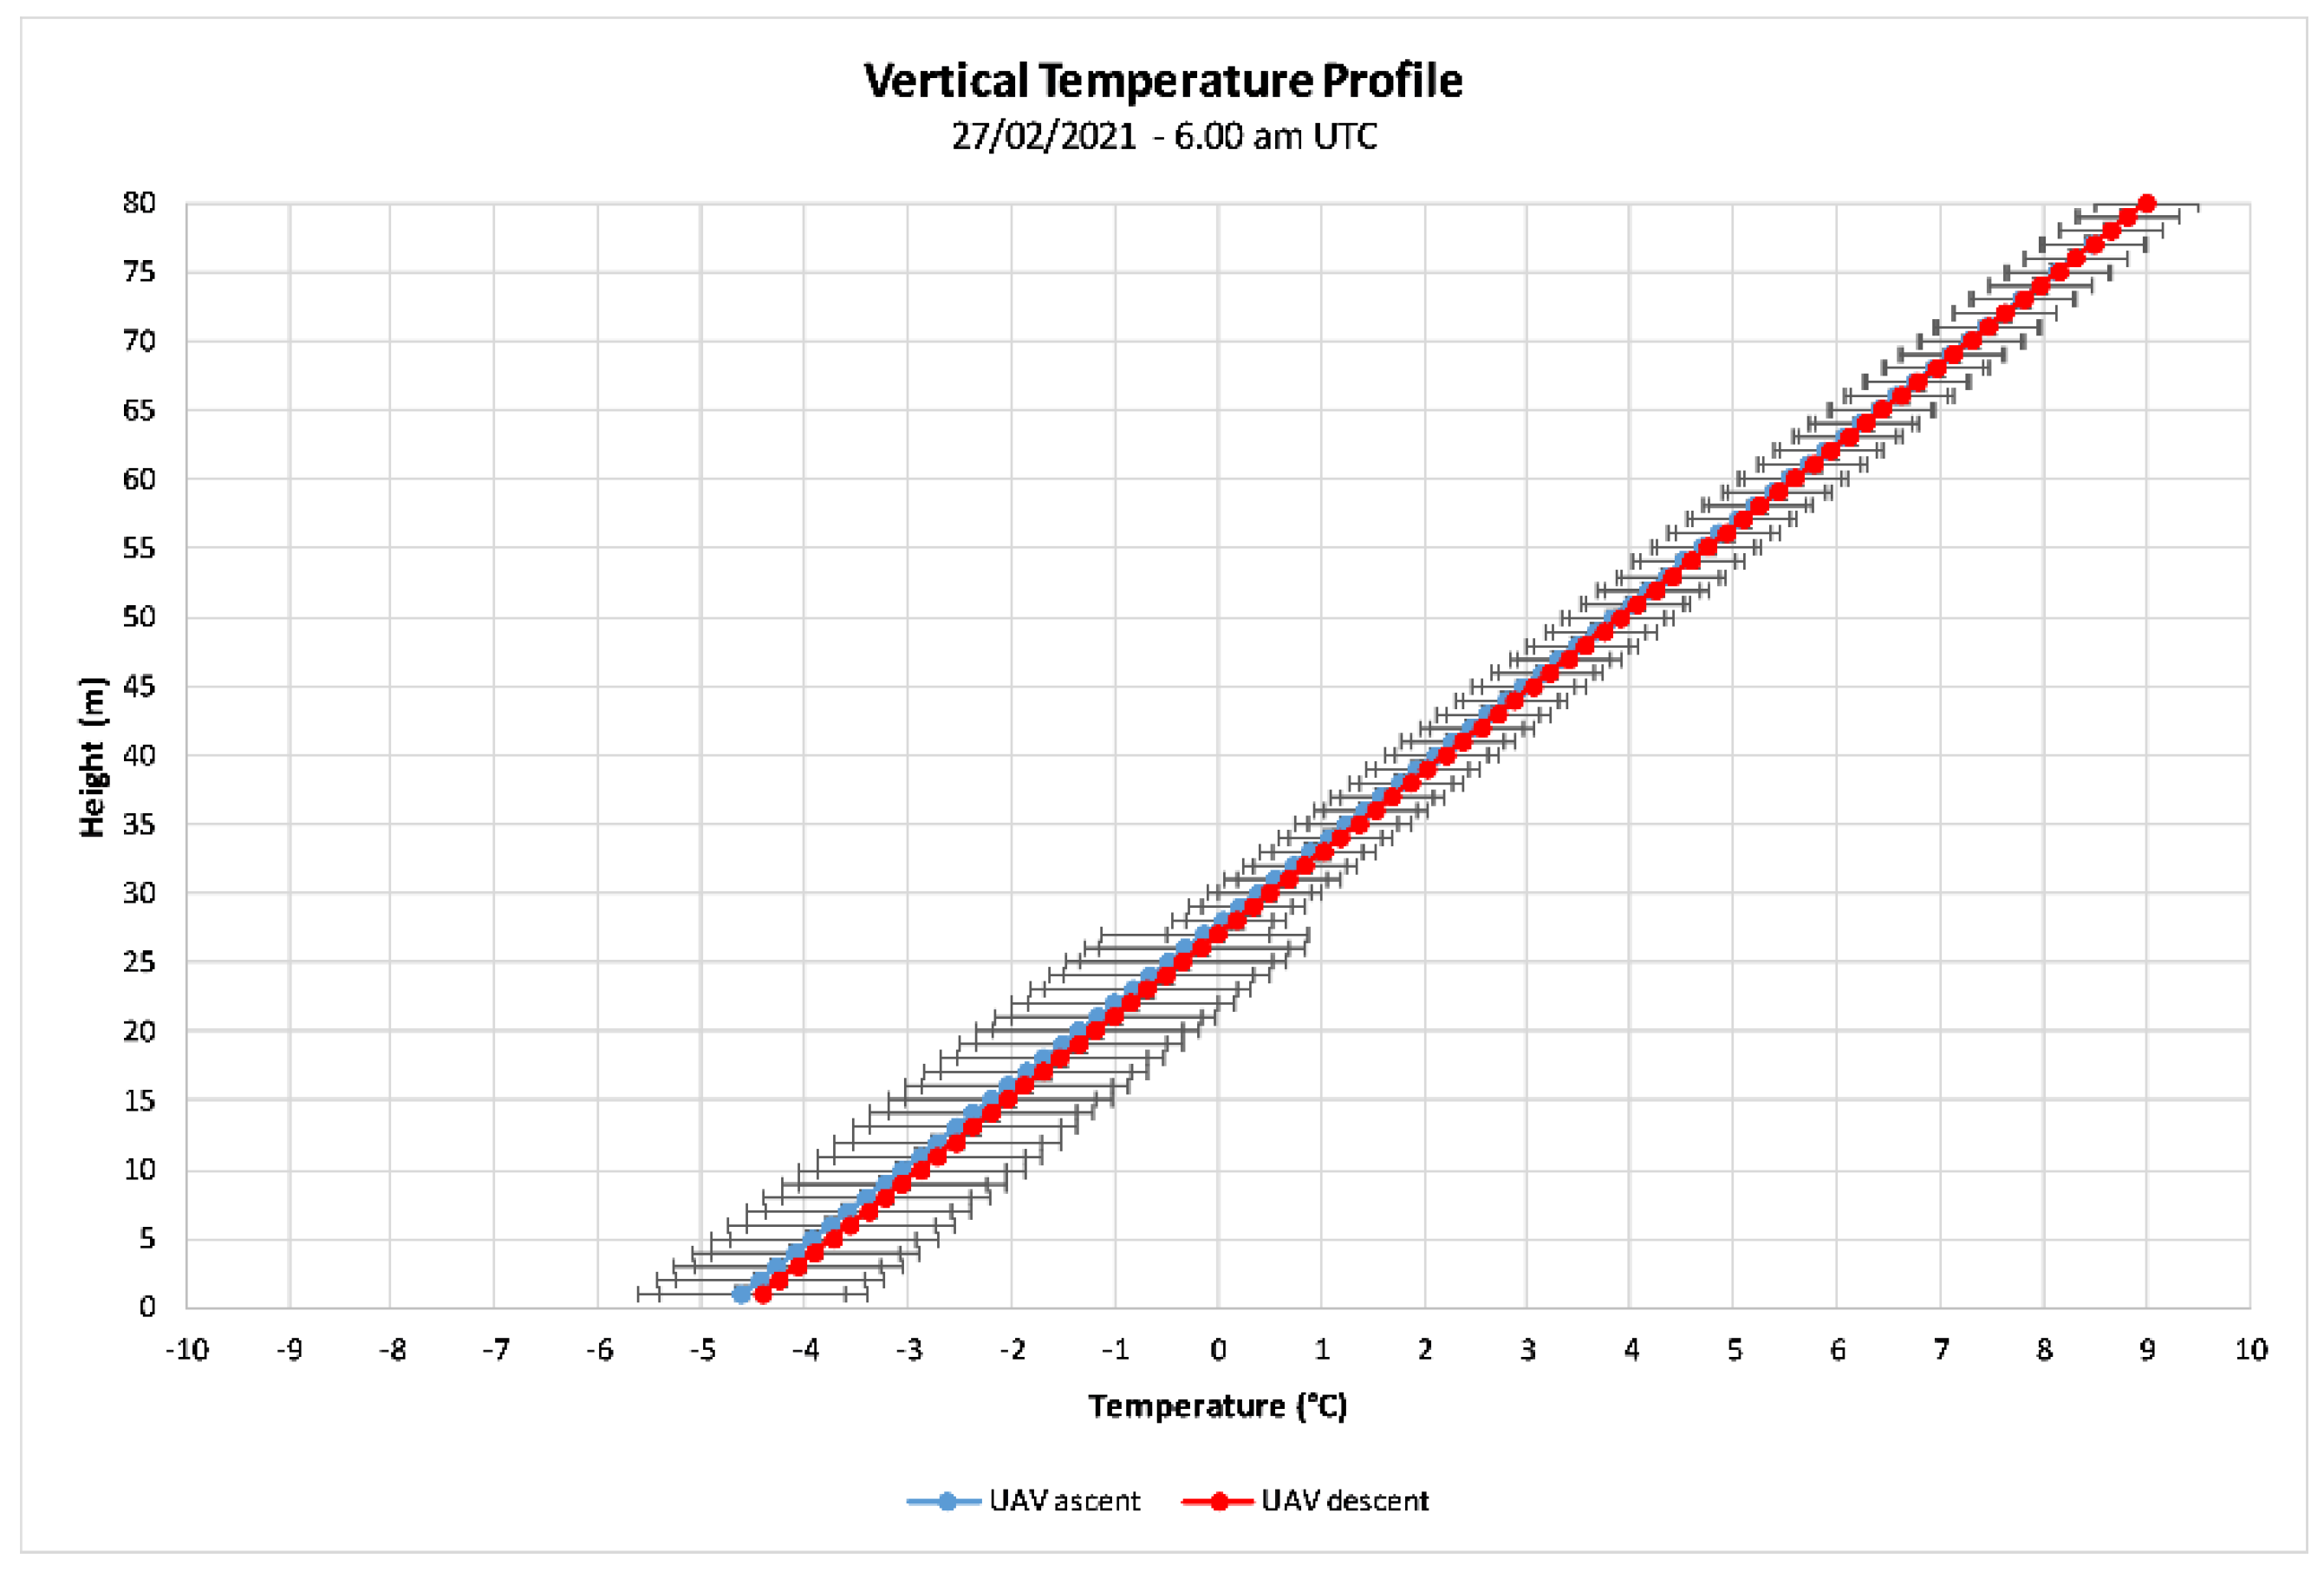
A final validation of this methodology took place through the processing of all the data acquired in the last flight made at 06:00 a.m. on 27 February 2021 (
Figure 12).
Also, for this flight mission, the thermal data coming from the three meteorological stations positioned on the ground were acquired at the same time (
Table 5).
From the previous tables, an almost perfect alignment can be seen between the data acquired by the data logger installed on the UAV (
Table 6) and the data acquired by the three meteorological stations on the ground. Again, all data acquired by the sensors show a high correlation coefficient of 1 and an RMSE value equal to 0.56 for UAV ascent phase and an RMSE value equal to 0.46 for UAV descent phase.
The only decimal thermal differences that are identified are justified once again by the accuracy values of the sensors used for this work.
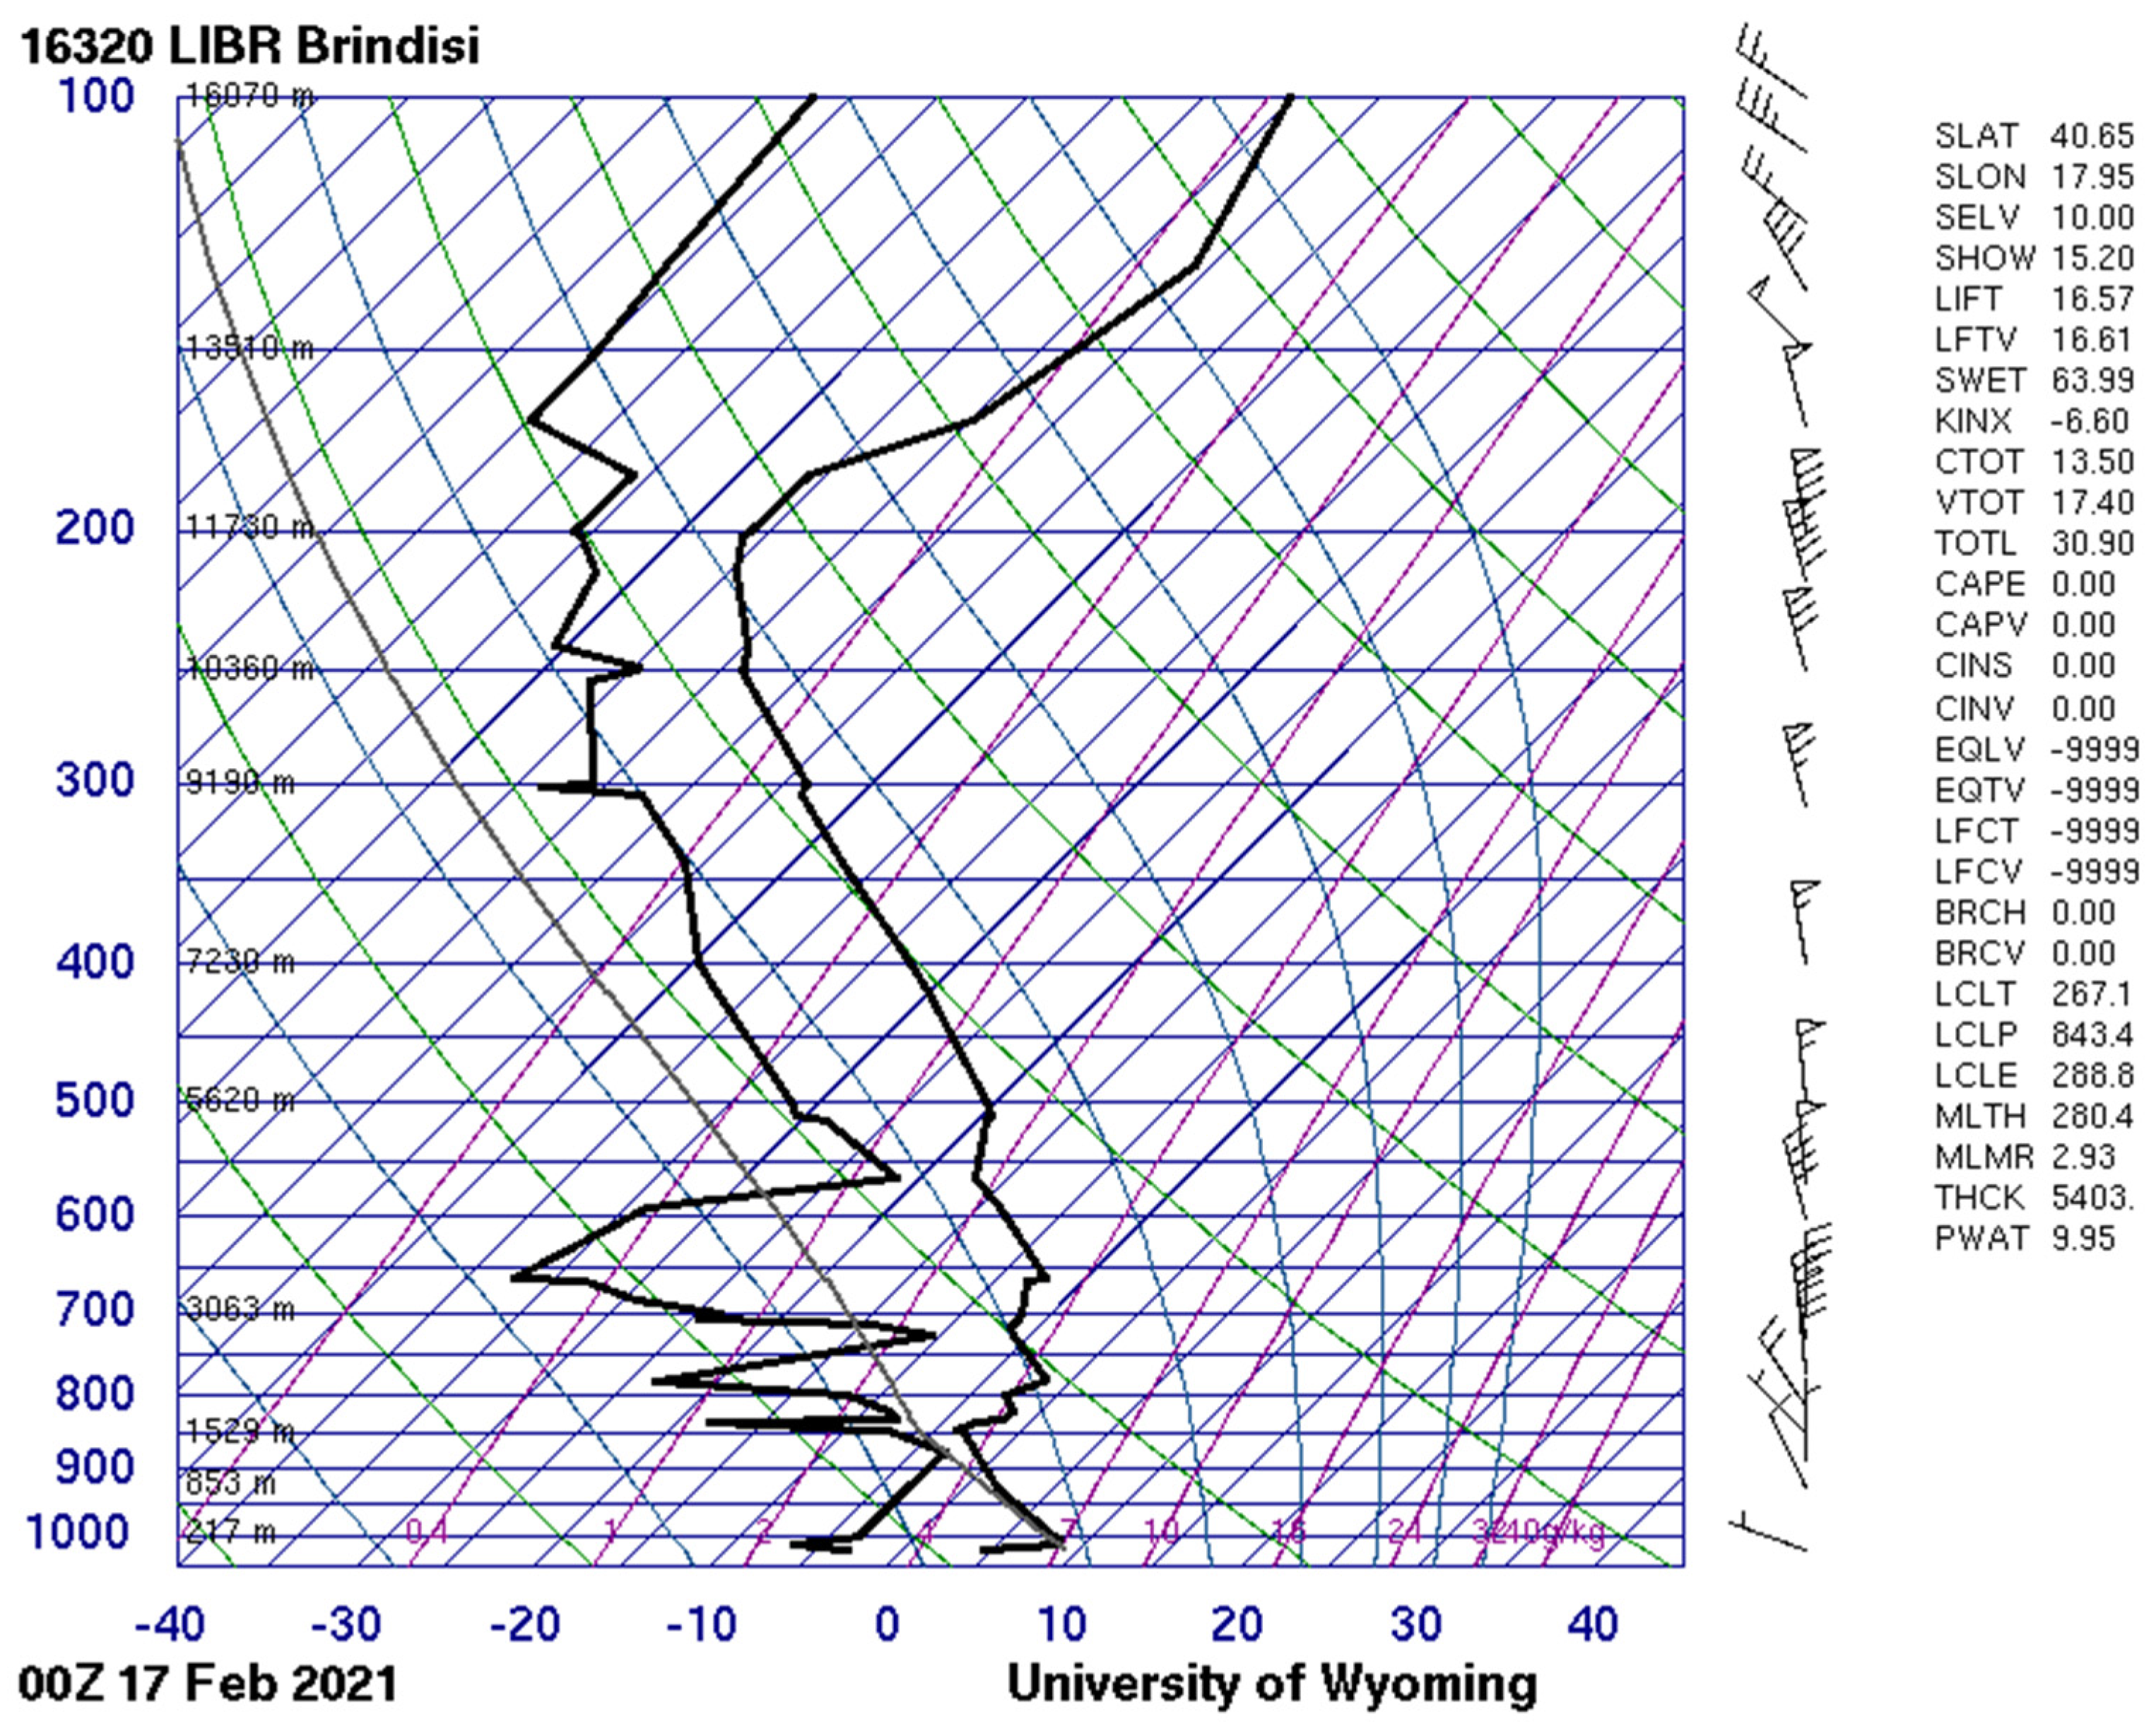
Finally, as a last validation on a larger scale, this meteorological situation rcharacterized by thermal inversion in the lower layers of the atmosphere was also found in the radio sounding carried out with the balloon launched from Brindisi airport at 00Z on 17 February 2021 (
Figure 13) and at 00Z on 27 February 2021 (
Figure 14). Brindisi airport is approximately 60 km from the area covered by this study.
4. Conclusions
The strong growth in the use of UAVs combined with continuous innovation and miniaturization of sensors applied to environmental monitoring has allowed us to experiment with the methodology described in this research work.
The aim was to find an auxiliary solution to the most common and consolidated instrument used in the world of atmospheric radio sounding. In fact, the experimental and validated but preliminary data of this research work demonstrated that the proposed system consisting of a UAV vehicle equipped with an atmospheric sensor (in this case, of temperature) was found to be suitable for small-scale atmospheric monitoring.
The novel aspect of this study is the ability to monitor these areas with innovative but above all versatile instruments and sensors such as UAVs. In fact, thermal monitoring of the atmospheric column of these areas with the application of this methodology could provide useful indications for the geomorphological evolution of sinkholes since variations in atmospheric temperature could influence the geological characteristics of these areas.
However, in the near future, the massive use of this methodology, followed by further technological progress, could be fundamental for the knowledge of small-scale meteorological situations often not predicted by the most common atmospheric models used for meteorological forecasts. This aspect is of fundamental importance given the era of climate change we are experiencing and which causes an increasingly frequent extremization of atmospheric phenomena which, especially on a small scale, are difficult to predict.
Author Contributions
Conceptualization, C.C. and S.A.; data curation, C.C. and S.A.; formal analysis, C.C. and S.A.; investigation, C.C. and S.A.; methodology, C.C. and S.A.; software, C.C. and S.A; supervision, C.C. and S.A.; validation, C.C. and S.A.; visualization, C.C. and S.A.; writing—original draft, C.C. and S.A.; writing—review and editing, C.C. and S.A. All authors have read and agreed to the published version of the manuscript.
Funding
This research received no external funding.
Institutional Review Board Statement
Not applicable.
Informed Consent Statement
Not applicable.
Data Availability Statement
Data is contained within the article.
Acknowledgments
The authors would like to thank the reviewers for their contributions and constructive comments for the improvement of the manuscript.
Conflicts of Interest
The authors declare no conflicts of interest.
References
- Caccamo, M.T.; Magazù, S. A Physical–Mathematical Approach to Climate Change Effects through Stochastic Resonance. Climate 2019, 7, 21. [Google Scholar] [CrossRef]
- Parra, R. Effects of global meteorological datasets in modeling meteorology and air quality in the andean region of southern Ecuador. In Proceedings of the 12th International Conference on Air Quality, Science and Application, Thessaloniki, Greece, 9–13 March 2020; Moussiopoulos, N., Sokhi, R.S., Tsegas, G., Fragkou, E., Chourdakis, E., Pipilis, I., Eds.; University of Hertfordshire: Hatfield, UK, 2020; p. 54. [Google Scholar]
- Sharma, A.; Fernando, H.J.; Hamlet, A.F.; Hellmann, J.J.; Barlage, M.; Chen, F. Urban meteorological modeling using WRF: A sensitivity study. Int. J. Climatol. 2017, 37, 1885–1900. [Google Scholar] [CrossRef]
- Gsella, A.; De Meij, A.; Kerschbaumer, A.; Reimer, E.; Thunis, P.; Cuvelier, C. Evaluation of MM5, WRF and TRAMPER meteorology over the complex terrain of the Po Valley, Italy. Atmos. Environ. 2014, 89, 797–806. [Google Scholar] [CrossRef]
- Wilson, S.H.S.; Atkinson, N.C.; Smith, J.A. The development of an airborne infrared interferometer for meteorological sounding studies. J. Atmos. Ocean. Technol. 1999, 16, 1912–1927. [Google Scholar] [CrossRef]
- Daniels, T.S.; Moninger, W.R.; Mamrosh, R.D. Tropospheric airborne meteorological data reporting (TAMDAR) overview. In Proceedings of the 86th AMS Annual Meeting, New Orleans, LA, USA, 1 January 2008. [Google Scholar]
- Voss, P.B.; Hole, L.R.; Helbling, E.F.; Roberts, T.J. Continuous in-situ soundings in the Arctic boundary layer: A new atmospheric measurement technique using controlled meteorological balloons. J. Intell. Robot. Syst. 2013, 70, 609–617. [Google Scholar] [CrossRef]
- Shuqing, M.; Hongbin, C.; Gai, W.; Yi, P.; Qiang, L. A miniature robotic plane meteorological sounding system. Adv. Atmos. Sci. 2004, 21, 890–896. [Google Scholar] [CrossRef]
- Haig, T.O.; Lally, V.E. Meteorological sounding systems. Bull. Am. Meteorol. Soc. 1958, 39, 401–409. [Google Scholar] [CrossRef][Green Version]
- Thomas, H.A. The determination of the meteorological conditions of the atmosphere by the use of radio-sounding balloons. Proc. R. Soc. London. Ser. A Math. Phys. Sci. 1938, 167, 227–250. [Google Scholar]
- Wirth, L.; Oettershagen, P.; Ambühl, J.; Siegwart, R. Meteorological path planning using dynamic programming for a solar-powered UAV. In Proceedings of the 2015 IEEE Aerospace Conference, Big Sky, MT, USA, 7–14 March 2015; pp. 1–11. [Google Scholar]
- Elston, J.; Argrow, B.; Stachura, M.; Weibel, D.; Lawrence, D.; Pope, D. Overview of small fixed-wing unmanned aircraft for meteorological sampling. J. Atmos. Ocean. Technol. 2015, 32, 97–115. [Google Scholar] [CrossRef]
- Spiess, T.; Bange, J.; Buschmann, M.; Vorsmann, P. First application of the meteorological Mini-UAV ‘M2AV’. Meteorol. Z. 2007, 16, 159–170. [Google Scholar] [CrossRef]
- Martin, S.; Bange, J.; Beyrich, F. Meteorological profiling of the lower troposphere using the research UAV “M2AV Carolo”. Atmos. Meas. Tech. 2011, 4, 705–716. [Google Scholar] [CrossRef]
- Shimura, T.; Inoue, M.; Tsujimoto, H.; Sasaki, K.; Iguchi, M. Estimation of wind vector profile using a hexarotor unmanned aerial vehicle and its application to meteorological observation up to 1000 m above surface. J. Atmos. Ocean. Technol. 2018, 35, 1621–1631. [Google Scholar] [CrossRef]
- Buschmann, M.; Bange, J.; Vörsmann, P. 6.7 MMAV—A Miniature Unmanned Aerial Vehicle (Mini-UAV) for Meteorological Purposes. Tech. Univ. Braunschw. 2004. [Google Scholar]
- Zhang, Y.; Dong, T.; Liu, Y. Design of meteorological element detection platform for atmospheric boundary layer based on UAV. Int. J. Aerosp. Eng. 2017, 2017, 1831676. [Google Scholar] [CrossRef]
- Efremov, D.; Khaykin, S.; Lykov, A.; Berezhko, Y.; Lunin, A. A new stratospheric sounding platform based on unmanned aerial vehicle (UAV) droppable from meteorological balloon. In Proceedings of the 40th COSPAR Scientific Assembly, Moscow, Russia, 2–10 August 2014; Volume 40, p. PSB-1. [Google Scholar]
- Novotný, J.; Bystřický, R.; Dejmal, K. Meteorological application of uav as a new way of vertical profile of lower atmosphere measurement. Chall. Natl. Def. Contemp. Geopolit. Situat. 2018, 2018, 115–120. [Google Scholar] [CrossRef]
- Whiteman, C.D.; Haiden, T.; Pospichal, B.; Eisenbach, S.; Steinacker, R. Minimum temperatures, diurnal temperature ranges, and temperature inversions in limestone sinkholes of different sizes and shapes. J. Appl. Meteorol. 2004, 43, 1224–1236. [Google Scholar] [CrossRef]
- Lehner, M.; Whiteman, C.D.; Dorninger, M. Inversion build-up and cold-air outflow in a small Alpine sinkhole. Bound. Layer Meteorol. 2017, 163, 497–522. [Google Scholar] [CrossRef]
- Whiteman, C.D.; Pospichal, B.; Eisenbach, S.; Weihs, P.; Clements, C.B.; Steinacker, R.; Dorninger, M. Inversion breakup in small Rocky Mountain and Alpine basins. J. Appl. Meteorol. 2004, 43, 1069–1082. [Google Scholar] [CrossRef]
- Steinacker, R.; Whiteman, C.D.; Dorninger, M.; Pospichal, B.; Eisenbach, S.; Holzer, A.M.; Baumann, K. A sinkhole field experiment in the Eastern Alps. Bull. Am. Meteorol. Soc. 2007, 88, 701–716. [Google Scholar] [CrossRef]
- Pospichal, B.; Eisenbach, S.; Whiteman, C.D.; Steinacker, R.; Dorninger, M. Observations of the cold air outflow from a basin cold pool through a low pass; Extended Abstracts, Vol. A. In Proceedings of the International Conference on Alpine Meteorology and MAP Meeting, Brig, Switzerland, 19–23 May 2003; pp. 153–156. [Google Scholar]
- Yao, W.; Zhong, S. Nocturnal temperature inversions in a small, enclosed basin and their relationship to ambient atmospheric conditions. Meteorol. Atmos. Phys. 2009, 103, 195–210. [Google Scholar] [CrossRef]
- Pieri, P.; Festa, V.; Moretti, M.; Tropeano, M. Quaternary tectonic activity of the Murge area (Apulian foreland-Southern Italy). Ann. Geophys. 1997, 40. [Google Scholar] [CrossRef]
- Ricchetti, G.; Ciaranfi, N.; Luperto Sinni, E.; Mongelli, F.; Pieri, P. Geodinamica ed evoluzione sedimentaria e tettonica dell’avampaese apulo. Mem. Della Soc. Geol. Ital. 1988, 41, 57–82. [Google Scholar]
- Laviano, A.; Marino, M. Biostratigraphy and paleoecology of Upper Cretaceous carbonate successions in the Gargano Promontory. Mem. Della Soc. Ital. 1996, 51, e1036. [Google Scholar]
- Spalluto, L. Facies evolution and sequence chronostratigraphy of a “mid”-Cretaceous shallow-water carbonate succession of the Apulia Carbonate Platform from the northern Murge area (Apulia, southern Italy). Facies 2012, 58, 17–36. [Google Scholar] [CrossRef]
- Marsico, A.; Caldara, M.; Capolongo, D.; Pennetta, L. Climatic characteristics of middle-southern Apulia (southern Italy). J. Maps 2007, 3, 342–348. [Google Scholar] [CrossRef]
| Disclaimer/Publisher’s Note: The statements, opinions and data contained in all publications are solely those of the individual author(s) and contributor(s) and not of MDPI and/or the editor(s). MDPI and/or the editor(s) disclaim responsibility for any injury to people or property resulting from any ideas, methods, instructions or products referred to in the content. |
© 2025 by the authors. Licensee MDPI, Basel, Switzerland. This article is an open access article distributed under the terms and conditions of the Creative Commons Attribution (CC BY) license (https://creativecommons.org/licenses/by/4.0/).
