Review

High-Resolution Global Methane Mapping: Advances in Satellite Remote Sensing, Machine Learning, and Policy Frameworks


by
Amit Kumar Singh
1,* and
Madhubala
2
1
Department of Civil, Building and Environmental Engineering, Sapienza University of Rome, 00184 Rome, Italy
2
Division of Basic Sciences, ICAR-Indian Institute of Pulses Research, Kanpur 208024, Uttar Pradesh, India
*
Author to whom correspondence should be addressed.
Methane 2026, 5(3), 21; https://doi.org/10.3390/methane5030021
Submission received: 14 May 2026 / Revised: 8 June 2026 / Accepted: 6 July 2026 / Published: 7 July 2026

Abstract

Methane ( C H 4 ) is the second most important anthropogenic greenhouse gas, accounting for approximately 30% of current global warming. Since 2007, atmospheric methane concentrations have been increasing at an accelerating rate, reaching a record 1945.85 ppb in November 2025. The emergence of high-resolution satellite constellations has transformed our ability to detect, quantify, and attribute methane emissions from space. This review provides a comprehensive analysis of the current state of high-resolution global methane mapping, examining: (1) the evolution of satellite missions from coarse-resolution sounders like TROPOMI (5.5 × 7 km) to very high-resolution imagers including WorldView-3 (3.7 m), GHGSat (50 m), and the recently launched Tanager-1 (30 m); (2) advances in retrieval algorithms, including the transition from physics-based matched filter methods to deep learning approaches such as U-Net architectures achieving F1-scores of 78.4% on Sentinel-2 imagery; (3) integration of satellite observations with atmospheric inverse models for flux estimation; (4) the impact of satellite-derived data on policy frameworks including the Global Methane Pledge and EPA’s Super-Emitter Program; and (5) remaining challenges including cloud contamination, detection limit trade-offs, and the need for sustained validation networks. We synthesize findings from over 200 peer-reviewed studies and analyze 42 years of NOAA global methane observations to demonstrate how the convergence of improved spatial resolution, machine learning, and international coordination is enabling unprecedented transparency in global methane monitoring. The review concludes with recommendations for future satellite missions and data assimilation strategies needed to meet the Global Methane Pledge target of 30% emission reductions by 2030.

1. Introduction

Methane ( C H 4 ) is a potent greenhouse gas with a global warming potential approximately 28–36 times that of carbon dioxide over a 100-year timeframe and 84–87 times over a 20-year period [1]. Since the pre-industrial era, atmospheric methane concentrations have more than doubled, rising from approximately 722 ppb in 1750 to a record 1945.85 ppb in November 2025, as measured by the NOAA Global Monitoring Laboratory [2]. This increase is responsible for approximately 0.6 °C of the total global temperature rise observed to date and represents nearly one-third of the total radiative forcing from anthropogenic greenhouse gas emissions [3].
The period since 2007 has been particularly concerning. After a brief stabilization in the early 2000s, methane concentrations began rising again, and the growth rate has accelerated significantly since 2014 (Figure 1). In 2021 and 2022, the largest year-over-year increases on record were observed, with annual growth rates exceeding 15 ppb/year [4]. This acceleration has outpaced the scenarios used in climate models, raising serious concerns about achieving the Paris Agreement temperature targets.
Addressing methane emissions represents one of the most cost-effective near-term climate mitigation strategies available. Unlike C O 2 , which persists in the atmosphere for centuries, methane has an atmospheric lifetime of only 9–12 years, meaning that aggressive emission reductions can yield significant climate benefits within decades [5]. The Intergovernmental Panel on Climate Change (IPCC) has identified that reducing methane emissions by 45% by 2030 could avoid nearly 0.3 °C of warming by 2040 [6]. Furthermore, methane mitigation in the fossil fuel sector is often economically favorable, as captured methane can be sold as natural gas, turning a climate liability into an economic asset.
The landscape of methane monitoring has been fundamentally transformed by advances in satellite remote sensing [7]. Where once scientists relied on sparse ground-based measurement networks and coarse climate models, a new generation of satellite instruments now provides near-global, high-frequency observations of atmospheric methane at spatial resolutions ranging from meters to kilometers [8]. The TROPOspheric Monitoring Instrument (TROPOMI) aboard Sentinel-5P has provided daily global coverage since 2017, while commercial constellations such as GHGSat and public-private partnerships like Carbon Mapper’s Tanager-1 have pushed spatial resolution to 30–50 m, enabling direct attribution of emissions to individual facilities [9].
This convergence of technological capabilities arrives at a critical policy juncture. The Global Methane Pledge, launched at COP26 in 2021, now includes over 150 countries committed to reducing collective methane emissions by at least 30% from 2020 levels by 2030 [10]. The U.S. Environmental Protection Agency has established a Methane Super-Emitter Program that leverages third-party satellite observations for regulatory enforcement, and the European Union’s Copernicus C O 2 Monitoring ( C O 2 M ) mission will provide unprecedented operational capacity for anthropogenic emission verification starting in 2027 [11,12].
This review synthesizes the current state of high-resolution global methane mapping, examining satellite capabilities, retrieval algorithms (including deep learning), flux estimation, policy frameworks, and remaining challenges to achieving international reduction targets. To ensure reproducibility, a systematic literature review was conducted querying Web of Science, Scopus, and Google Scholar. Search terms included combinations of “methane remote sensing,” “high-resolution satellite,” “methane plume detection,” “machine learning,” and “atmospheric inversion.” The temporal scope primarily spans from 2017 (coinciding with TROPOMI’s launch) to early 2026, alongside foundational historical papers. Studies were selected based on three inclusion criteria: (1) peer-reviewed articles or official agency reports; (2) presentations of novel algorithms, validation campaigns, or clear policy linkages; and (3) quantitative emission assessments. After screening for relevance, over 200 publications were synthesized.

2. Satellite Missions for Methane Mapping

2.1. Evolution of Methane-Observing Satellite Capabilities

The history of satellite-based methane observation can be divided into three distinct eras: the coarse-resolution era (2002–2016), characterized by instruments such as SCIAMACHY (2002–2012) and TES (2004–2018) with spatial resolutions of 30–60 km; the global mapping era (2017–present), initiated by the launch of TROPOMI; and the high-resolution attribution era (2019–present), marked by the operational deployment of instruments capable of facility-scale emission detection. This progression reflects both technological advancement and evolving scientific and policy requirements [13,14,15].
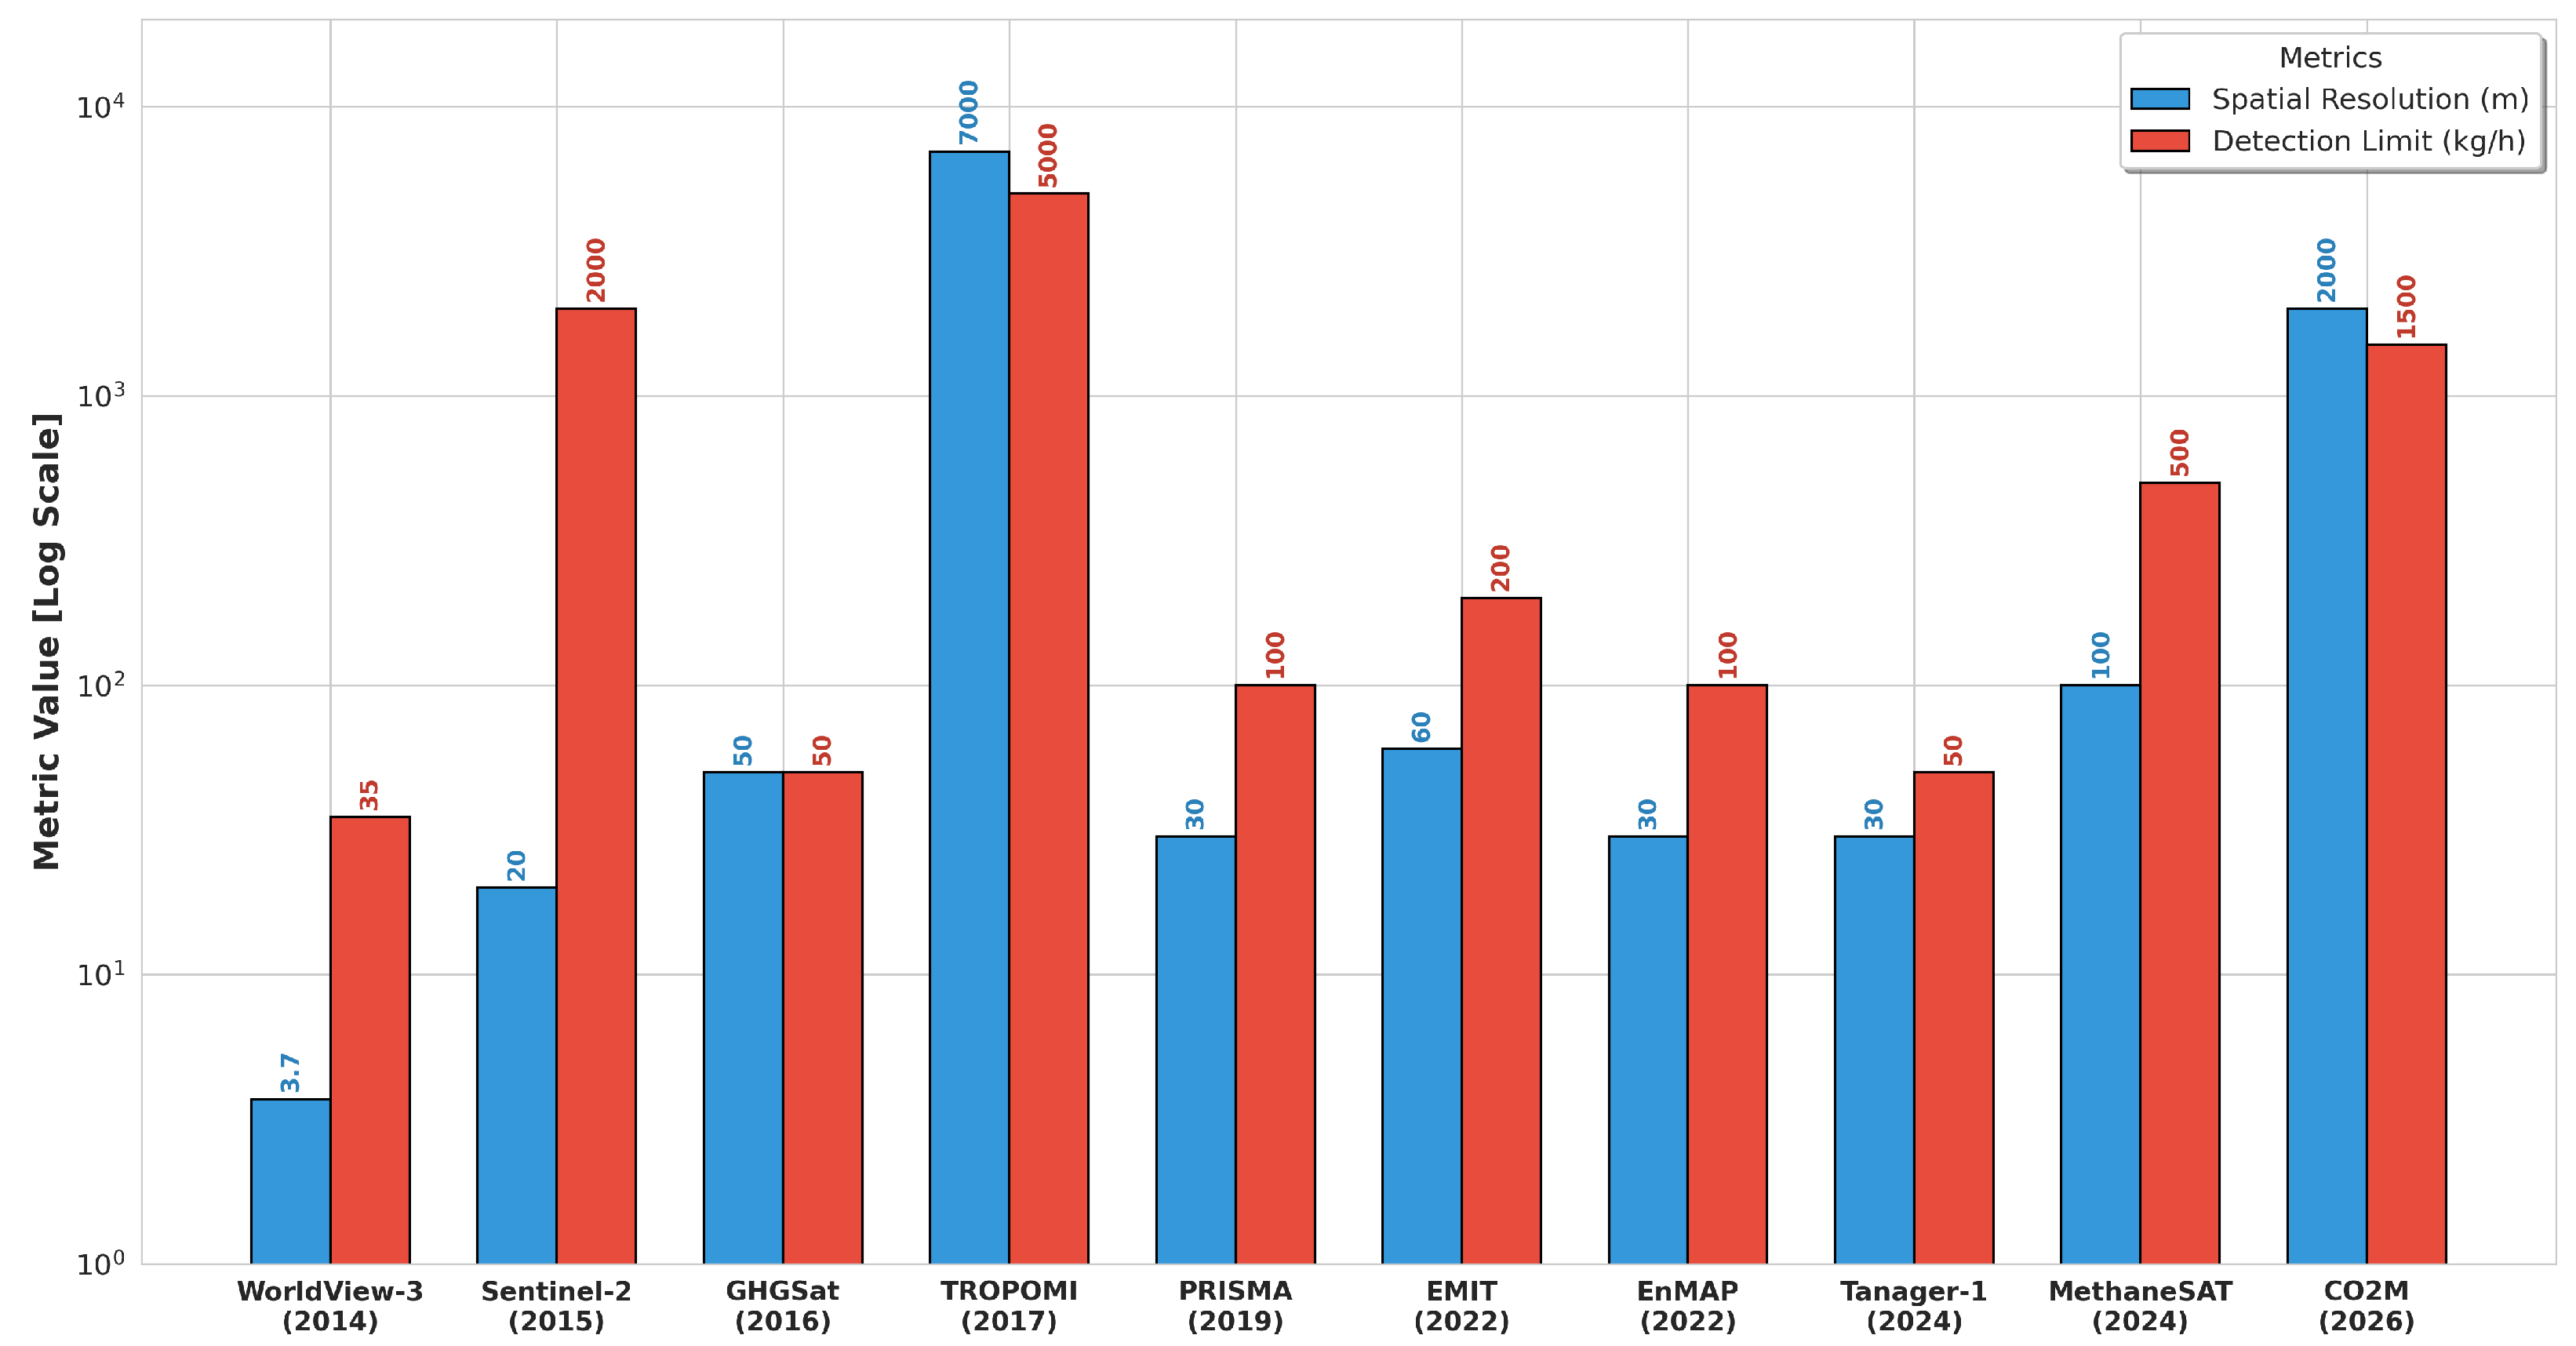
The earliest space-based methane measurements were obtained by the Interferometric Monitor for Greenhouse Gases (IMG) aboard ADEOS in 1996, followed by the Atmospheric Infrared Sounder (AIRS) on NASA’s Aqua satellite, which began operation in 2002 [16,17]. These instruments provided valuable information about methane’s global distribution but were limited by coarse spatial resolution (13–45 km) and sensitivity to the mid-to-upper troposphere rather than the planetary boundary layer where emissions occur [18]. The Japanese Greenhouse gases Observing SATellite (GOSAT), launched in 2009, represented a significant advance, providing column-averaged dry-air mole fractions of methane ( X C H 4 ) at 10.5 km spatial resolution, sufficient to constrain large-scale fluxes but not to identify individual sources [19], highlighting the necessary trade-off between spatial resolution and detection limits (Figure 2).

2.2. Current-Generation Global Mapping Instruments

2.2.1. TROPOMI/Sentinel-5 Precursor

The TROPOspheric Monitoring Instrument (TROPOMI), launched aboard the European Space Agency’s Sentinel-5 Precursor satellite in October 2017, represents the current benchmark for global methane mapping [20,21]. TROPOMI provides daily global coverage with a nadir spatial resolution of 5.5 × 7 km (improved from the initial 7 × 7 km after a 2023 resolution enhancement), a spectral range covering the shortwave infrared (SWIR) methane absorption band at 2300 nm, and single-overpass precision of approximately 0.5% for X C H 4 [22,23]. These capabilities have enabled unprecedented detection of large methane point sources, known as “super-emitters,” with emission rates typically exceeding 1000 kg/h [24,25]. TROPOMI’s daily global coverage has proven particularly valuable for identifying transient emission events, which may persist for only hours to days and would be missed by less frequent high-resolution sensors [26]. Research has shown that up to 25% of TROPOMI-detected plumes are transient and not directly linked to known continuous sources, highlighting the importance of sustained temporal coverage [27].

2.2.2. GOSAT-2 and TanSat

GOSAT-2, the successor to the original GOSAT mission, was launched by JAXA in October 2018. It maintains the 10.5 km spatial resolution of its predecessor but with improved spectral resolution and signal-to-noise ratio in the SWIR bands, enabling more precise X C H 4 retrievals [28,29,30]. China’s TanSat, launched in 2016, provides complementary observations with a nadir resolution of 2 × 2 km, focusing primarily on carbon dioxide but including methane channels. Together, these instruments provide a crucial validation backbone for higher-resolution missions and contribute to global flux inversion systems [31,32].

2.3. High-Resolution Point-Source Imagers

The identification and mitigation of methane super-emitters requires spatial resolution sufficient to attribute detected plumes to individual facilities or pieces of infrastructure. A new generation of instruments has pushed spatial resolution into the meter to tens-of-meters range, fundamentally changing what is possible from space-based observation.

2.3.1. GHGSat Constellation

GHGSat, operated by the Montreal-based company of the same name, operates the first commercial satellite constellation dedicated to methane monitoring. Beginning with the demonstration satellite “Claire” in 2016, the constellation has expanded to 12 operational satellites as of 2025, with plans for 14 [33]. GHGSat instruments provide a spatial resolution of approximately 50 m with a swath width of 12 km, achieving detection limits of approximately 50 kg CH4/h under favorable conditions [34]. The constellation’s architecture enables daily revisits to targeted sites, making it particularly valuable for monitoring high-priority facilities and verifying mitigation actions. GHGSat has demonstrated commercial viability by partnering with major energy producers including Saudi Aramco, Petrobras, Total, and Chevron, and its data products have been approved for use under the U.S. EPA’s Methane Super-Emitter Program [35]. The company reports that operators using GHGSat data have mitigated more than 20 million tons of C O 2 -equivalent emissions to date.

2.3.2. Carbon Mapper/Tanager

The Carbon Mapper consortium, a public-private partnership involving NASA’s Jet Propulsion Laboratory (JPL), Planet Labs, the State of California, Arizona State University, and RMI among others, launched its first satellite, Tanager-1, in August 2024. Tanager-1 carries a visible-to-shortwave infrared (VSWIR) imaging spectrometer developed at JPL, providing 30-m spatial resolution, 5 nm spectral sampling across the 400–2500 nm range, and a nadir swath width of approximately 19 km. Commissioning was completed in January 2025, with routine data publication beginning in February 2025 [36].
Carbon Mapper’s design philosophy emphasizes detection completeness for high-emission point sources. The minimum detection limit for methane is approximately 66–144 kg/h for images with 25% surface albedo, 45° solar zenith angle, and 3 m/s wind speed, with detection limits varying as a function of imaging mode and environmental conditions [37]. Each satellite provides multiple imaging modes with varying degrees of ground motion compensation, allowing trade-offs between detection limit and spatio-temporal coverage. In its first year of operation, Tanager-1 published 5392 methane plumes across 2800 individual sources in 44 countries for oil and gas, 71 for waste, 17 for coal, and 12 for electricity generation [38].
A defining feature of the Carbon Mapper program is its commitment to open data. All methane plume detections are published on a freely accessible data portal that had attracted over 63,000 unique users from 178 countries within the first year. This transparency model has enabled rapid translation of satellite observations into mitigation action, exemplified by a pipeline leak in the Permian Basin detected on 9 October 2024, with an estimated emission rate of 7100 kg CH4/h. Following notification by Carbon Mapper, the operator voluntarily repaired the leak, and a subsequent Tanager-1 observation on October 24 confirmed zero methane at the location [39,40].

2.3.3. Hyperspectral Missions: EnMAP, PRISMA, and EMIT

The Environmental Mapping and Analysis Program (EnMAP) is a German hyperspectral satellite mission launched in April 2022. It provides 30 m spatial resolution with 30 km swath width and approximately 8 nm spectral sampling at 2300 nm [41]. Roger et al. (2024) demonstrated that EnMAP’s spectral resolution in the methane absorption region is approximately 2.7 nm finer than PRISMA, with signal-to-noise ratios approximately twice as large, leading to improved retrieval sensitivity [42]. EnMAP has successfully detected plumes from onshore oil and gas, coal mining, and uniquely among satellite missions, offshore oil and gas facilities, detecting plumes with flux rates as low as approximately 1 t/h under favorable conditions over water [43,44,45].
PRISMA (PRecursore IperSpettrale della Missione Applicativa), an Italian Space Agency mission launched in March 2019, was the first hyperspectral mission to demonstrate systematic methane plume mapping from space. PRISMA’s 30 m resolution and spectral coverage of the 2300 nm methane absorption feature established the foundation for subsequent hyperspectral missions and provided critical validation datasets for algorithm development [46,47,48,49,50].
NASA’s Earth Surface Mineral Dust Source Investigation (EMIT), launched to the International Space Station in July 2022, was originally designed to map surface mineralogy but was found to provide exceptional methane detection capabilities [51,52]. Operating at approximately 60 m spatial resolution with a 75 km swath, EMIT has mapped more than 1000 methane plumes across six continents, with data products freely available through the NASA Land Process Distributed Active Archive Center (LP DAAC) and the U.S. Greenhouse Gas Center [53]. EMIT’s unique orbital characteristics-constrained by the ISS orbit at 51.6° inclination provide dense temporal sampling at mid-latitudes but limited polar coverage.

2.3.4. WorldView-3: Pushing the Resolution Frontier

The commercial WorldView-3 satellite, launched by DigitalGlobe (now Maxar) in August 2014, represents the current spatial resolution frontier for methane mapping from space. Although not designed as a methane sensor, six of WorldView-3’s eight SWIR bands overlap with methane absorption features near 2300 nm. The satellite’s exceptional 3.7 m ground sample distance in SWIR, combined with high signal-to-noise ratio and pointing capabilities enabling daily revisit, allows detection of methane plumes from individual pieces of infrastructure [54,55,56,57].
Sánchez-García et al. (2022) [58] demonstrated detection of 26 independent point-source emissions over methane hotspot regions including oil and gas fields in Algeria and Turkmenistan, and the Shanxi coal mining region in China [58]. Notably, WorldView-3 detected very small leaks (<100 kg/h) from oil pipelines in Turkmenistan, establishing a new lower bound for satellite-based emission detection. The 3.7 m resolution enables precise attribution of emissions to specific infrastructure components and, critically, allows discrimination of true methane plumes from surface artifacts that cause false positives in lower-resolution data [59,60].

2.4. Multispectral Missions: Bridging Coverage and Resolution

Sentinel-2

The Sentinel-2 constellation (Sentinel-2A, launched 2015; Sentinel-2B, 2017) provides a unique bridging capability between global coverage and high spatial resolution. Although not designed for methane detection, Sentinel-2’s SWIR bands (particularly Band 11 at 1560–1650 nm and Band 12 at 2100–2280 nm) exhibit sensitivity to methane absorption features. The constellation provides global coverage every 2–5 days at 20 m resolution, enabling systematic monitoring of known methane sources at a spatial scale sufficient to identify individual large facilities [61,62,63].
The primary challenge for Sentinel-2 methane detection is the relatively weak methane absorption signal in its broad spectral bands compared to dedicated hyperspectral instruments. Traditional physics-based retrieval methods, including the multi-band multi-pass (MBMP) algorithm and the Varon ratio technique, have demonstrated capability for quantifying large leaks but suffer from high false-positive rates over heterogeneous surfaces and require extensive manual validation [63,64,65].

2.5. Planned and Emerging Missions

2.5.1. MethaneSAT

MethaneSAT, developed by the Environmental Defense Fund in partnership with Harvard University and the Smithsonian Astrophysical Observatory, was launched in March 2024 [60]. The instrument is designed to provide wide-swath (approximately 200 km), high-precision methane measurements at approximately 100 m spatial resolution, with particular focus on quantifying total emissions from oil and gas basins rather than individual point sources. While initial operations were successful, the project experienced a setback when contact was lost with the satellite in June 2025; recovery efforts are ongoing [66].
While Table 1 outlines the spatial and temporal capabilities of these missions, quantifying their detection reliability requires assessing retrieval accuracy and uncertainty. Across current validation literature, global area mappers like TROPOMI typically demonstrate high accuracy with low systematic bias and precision uncertainties around 10 ppb. Conversely, high-resolution point-source imagers and multispectral sensors exhibit larger single-sounding uncertainties (Table 2), these higher uncertainties are primarily driven by localized variations in wind speed and surface albedo rather than instrument bias, maintaining typical overall retrieval accuracies of 5% to 10% under optimal viewing conditions.

2.5.2. Copernicus CO2M Mission

The Copernicus Anthropogenic Carbon Dioxide Monitoring (CO2M) mission, developed by ESA on behalf of the European Union, represents the next major advance in operational greenhouse gas monitoring [71]. The constellation will consist of three identical satellites (CO2M-A, CO2M-B, and CO2M-C) carrying a combined CO2 and NO2 Imaging Spectrometer (CO2I), a Multi-Angle Polarimeter (MAP), and a Cloud Imager (CLIM). The first satellite is scheduled for launch in 2027, with the full constellation achieving revisit times of approximately 3 days at European latitudes [52].
C O 2 I will measure atmospheric methane with a precision of 10 ppb at 2 × 2 km spatial resolution, a swath width of 250 km, and simultaneous N O 2 measurements enabling direct attribution of C O 2 and C H 4 enhancements to fossil fuel combustion sources [72]. The MAP instrument will characterize aerosol properties for atmospheric correction, while CLIM will provide cloud masking at sub-kilometer resolution. C O 2 M will form the space component of the European C O 2 Monitoring and Verification Support capacity ( C O 2 M V S ), providing independent verification of national greenhouse gas inventories in support of the Paris Agreement [73].

3. Retrieval Algorithms and Machine Learning

3.1. Physics-Based Retrieval Methods

The foundation of satellite methane retrieval is the Beer–Lambert law applied to solar backscattered radiation measured in the SWIR spectral region around 2300 nm, where methane has strong rotational–vibrational absorption bands. For hyperspectral instruments with sufficient spectral resolution to resolve individual methane absorption lines, the standard approach involves fitting measured radiance spectra to forward-modeled spectra computed by radiative transfer codes such as VLIDORT or DISORT [66,74].
The matched filter technique, widely used for imaging spectrometers including AVIRIS, PRISMA, EnMAP, and EMIT, operates by computing the correlation between the measured spectrum and a modeled methane absorption spectrum. This approach effectively enhances the signal-to-noise ratio by leveraging the full spectral shape of the methane absorption feature rather than individual channels. The output is a methane concentration enhancement map ( X C H 4 ) representing the excess column methane above background. Matched filter retrievals achieve typical precision of 10–50 ppb depending on instrument characteristics and surface conditions [75].
For multispectral instruments like Sentinel-2 and WorldView-3, which lack the spectral resolution for line-by-line fitting, alternative approaches have been developed. The Varon ratio method normalizes the radiance in a methane-sensitive band by a methane-free reference band to estimate methane transmittance. The Sánchez regression method extends this approach by using multi-linear regression of plume-free imagery to predict the expected radiance in the absence of methane, providing a more robust background estimate that reduces false positives over heterogeneous surfaces [76].

3.2. Deep Learning for Methane Plume Detection

The application of deep learning to satellite methane detection has emerged as one of the most significant methodological advances in the field. While physics-based numerical methods, such as matched filter algorithms, have been foundational for methane plume detection, they suffer from inherent limitations that restrict their operational scalability. First, they exhibit high false-positive rates over spectrally complex surfaces. Because matched filters rely on linear background assumptions, variations in surface albedo, urban infrastructure, or agricultural patterns can mimic the shortwave infrared (SWIR) absorption signature of methane, causing spectral confusion. Second, physics-based methods struggle to separate weak plume signals from sensor noise, limiting the detection of small emissions near the instrument’s detection limit. Finally, to mitigate these false positives, these methods require intensive, subjective manual validation by human analysts. This manual bottleneck limits scalability, highlighting the necessity of adopting deep learning techniques as a robust, automated alternative capable of handling non-linear background variations and processing massive satellite data streams [77,78].
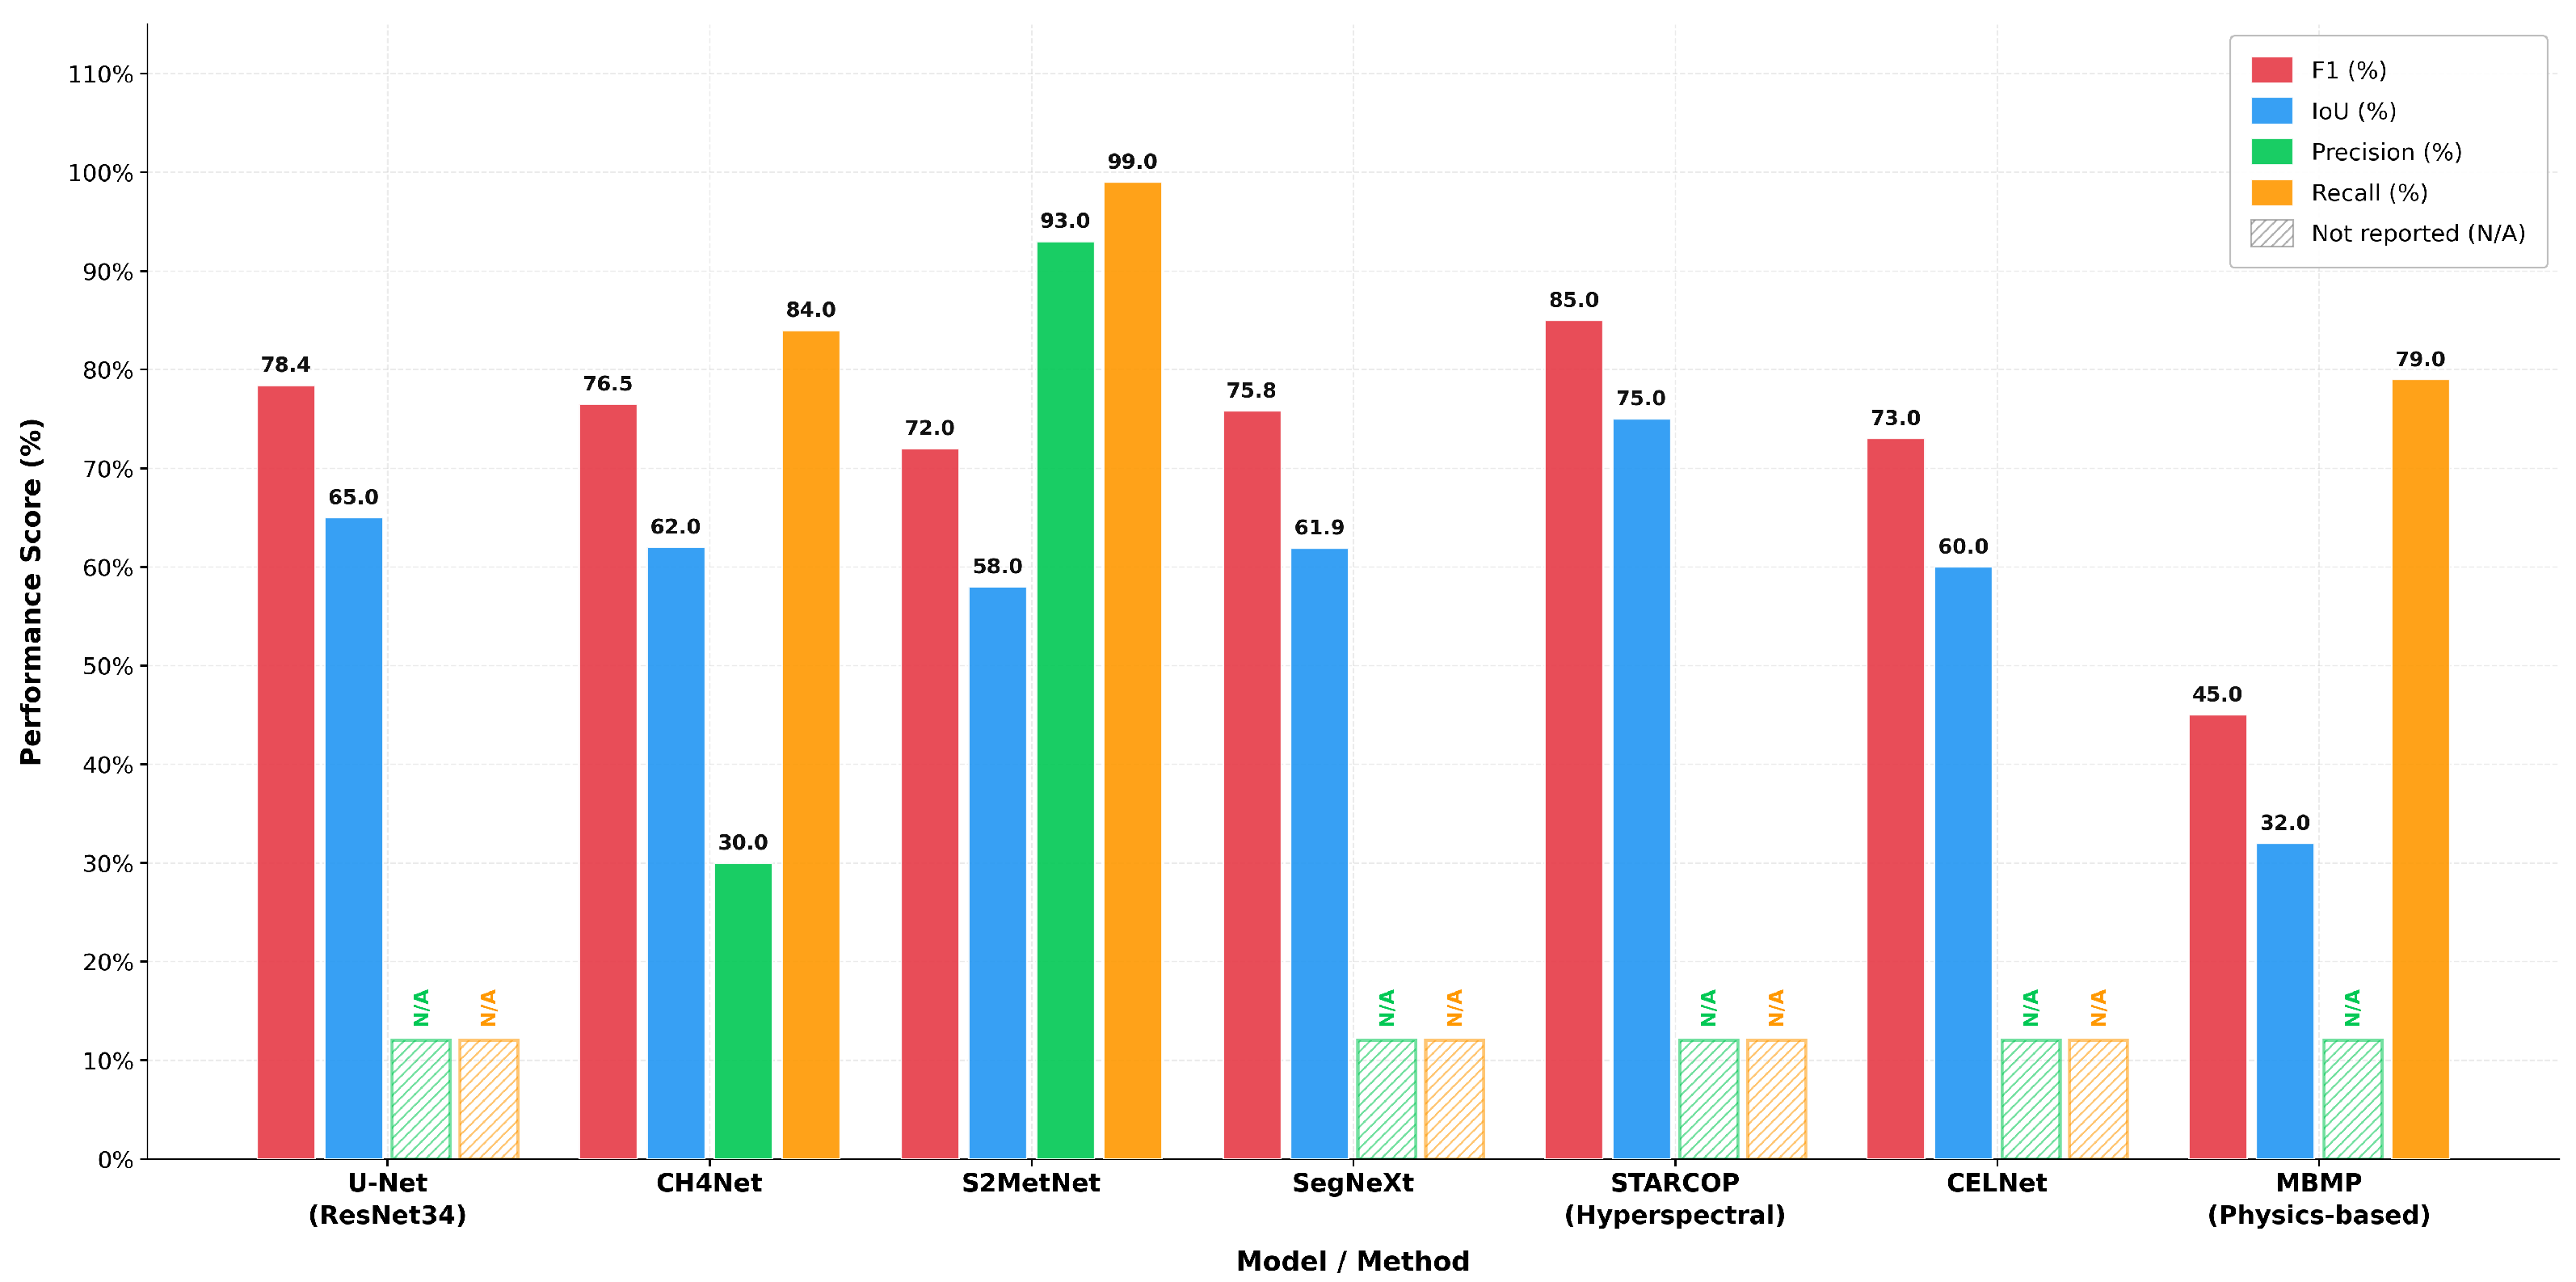
The first major deep learning application for methane detection was the STARCOP dataset and model was developed for hyperspectral imagery. STARCOP used a semantic segmentation approach with a U-Net architecture trained on expert-labeled methane plumes from airborne hyperspectral data, achieving F1-scores exceeding 85% and significantly outperforming matched filter methods [79].

3.2.1. Sentinel-2 Deep Learning Approaches

For Sentinel-2 multispectral imagery CH4Net is developed, a U-Net-based model trained on a large annotated dataset of methane plumes. CH4Net demonstrated that deep learning could effectively distinguish true methane plumes from false positives caused by surface spectral features, cloud edges, and thin cirrus, achieving an F1-score of 76.5% on validation data.
A novel feature engineering approach was introduced by Tran et al. (2025) [80] that combines the Varon ratio and Sánchez regression techniques as dual-input channels to a U-Net with ResNet34 encoder. This method achieves an F1-score of 78.39% and, most significantly, enables detection of small plumes down to 400 m2 (single pixel at 20 m resolution), surpassing the detection limits of both pure physics-based methods and earlier deep learning approaches. The key insight is that stacking both spectral enhancement techniques creates a pseudo-RGB input where methane signals are reinforced in two channels while the third channel suppresses false positives [80].

3.2.2. Model Architectures and Performance

Systematic comparison of deep learning architectures for methane plume detection reveals that U-Net variants consistently outperform alternative approaches. The ResNet34 encoder provides the optimal balance between feature extraction capability and spatial localization precision, while lighter architectures such as MobileNetV2 suffer from overfitting despite faster training. Transformer-based models such as SegNeXt show promise for capturing global context but produce more scattered false positives due to their global attention mechanisms amplifying background patterns (Figure 3).
Despite the impressive performance metrics reported in recent literature, such as the high F1-scores for U-Net architectures, a broader critical assessment reveals several methodological challenges. Current machine learning models heavily rely on limited and often imbalanced training datasets, where background images vastly outnumber positive plume instances. Furthermore, labeling uncertainties pose a significant challenge; the subjective nature of manually drawing plume masks introduces inherent biases into the training data. Transferability is also a major hurdle. Models trained on data from specific geographic regions (e.g., the arid Permian Basin) or specific sensors often struggle to generalize when applied to different biomes, seasons, or instruments without extensive retraining or domain adaptation. Moving forward, the operational deployment of these models will require massive, open-source, multi-sensor benchmark datasets and advanced domain adaptation techniques to ensure reliable cross-regional generalization.

3.3. Emission Rate Quantification

Detecting methane plumes is only the first step; accurate quantification of emission rates is essential for mitigation prioritization and regulatory compliance. The standard approach for emission rate estimation from single satellite overpasses applies the integrated mass enhancement (IME) method, which relates the total methane mass enhancement in the observed plume to the emission rate using wind speed data:
Q = I M E × U _ e f f / L
where Q is the emission rate (kg/s), IME is the integrated mass enhancement (kg), U_eff is the effective wind speed (m/s), and L is a characteristic plume length scale (m). The effective wind speed is typically derived from meteorological reanalysis products (ERA5, GFS) or assimilated weather models, and represents the single largest source of uncertainty in emission rate estimates, typically contributing 30–50% of total uncertainty [81,82].
Machine learning approaches have also been applied to direct emission rate prediction. Jongaramrungruang presented MethaNet [83], a CNN model that predicts methane emission rates directly from 2D plume imagery without requiring explicit wind speed input, instead learning the relationship between plume morphology and emission rate from training data. This approach reduces reliance on auxiliary meteorological data but requires extensive validation across diverse atmospheric conditions [83].

3.4. Tiered Observation Systems and Data Fusion

The diverse capabilities of current satellite missions have motivated the development of tiered observation systems that integrate multiple data sources. The tip-and-cue approach uses wide-swath, coarse-resolution instruments (TROPOMI) to identify regions of interest, which are then targeted by high-resolution sensors (GHGSat, Tanager-1) for detailed source attribution. This strategy optimizes the use of limited high-resolution observing capacity while maintaining comprehensive spatial coverage [84].
Data fusion approaches combining Sentinel-5P (daily, 7 km), Sentinel-2 (2–5 days, 20 m), and Sentinel-3 (intermediate resolution) have demonstrated the potential to balance spatial resolution, temporal coverage, and detection sensitivity. The S2MetNet project established a benchmark dataset showing that deep learning models trained on multi-sensor data outperform single-sensor approaches in quantifying methane emissions. Similarly, ensemble methods that combine predictions from multiple models or multi-resolution observations increase detection reliability by reducing the impact of individual sensor limitations [85,86].

4. Global Methane Budget and Source Attribution

4.1. The Global Methane Budget

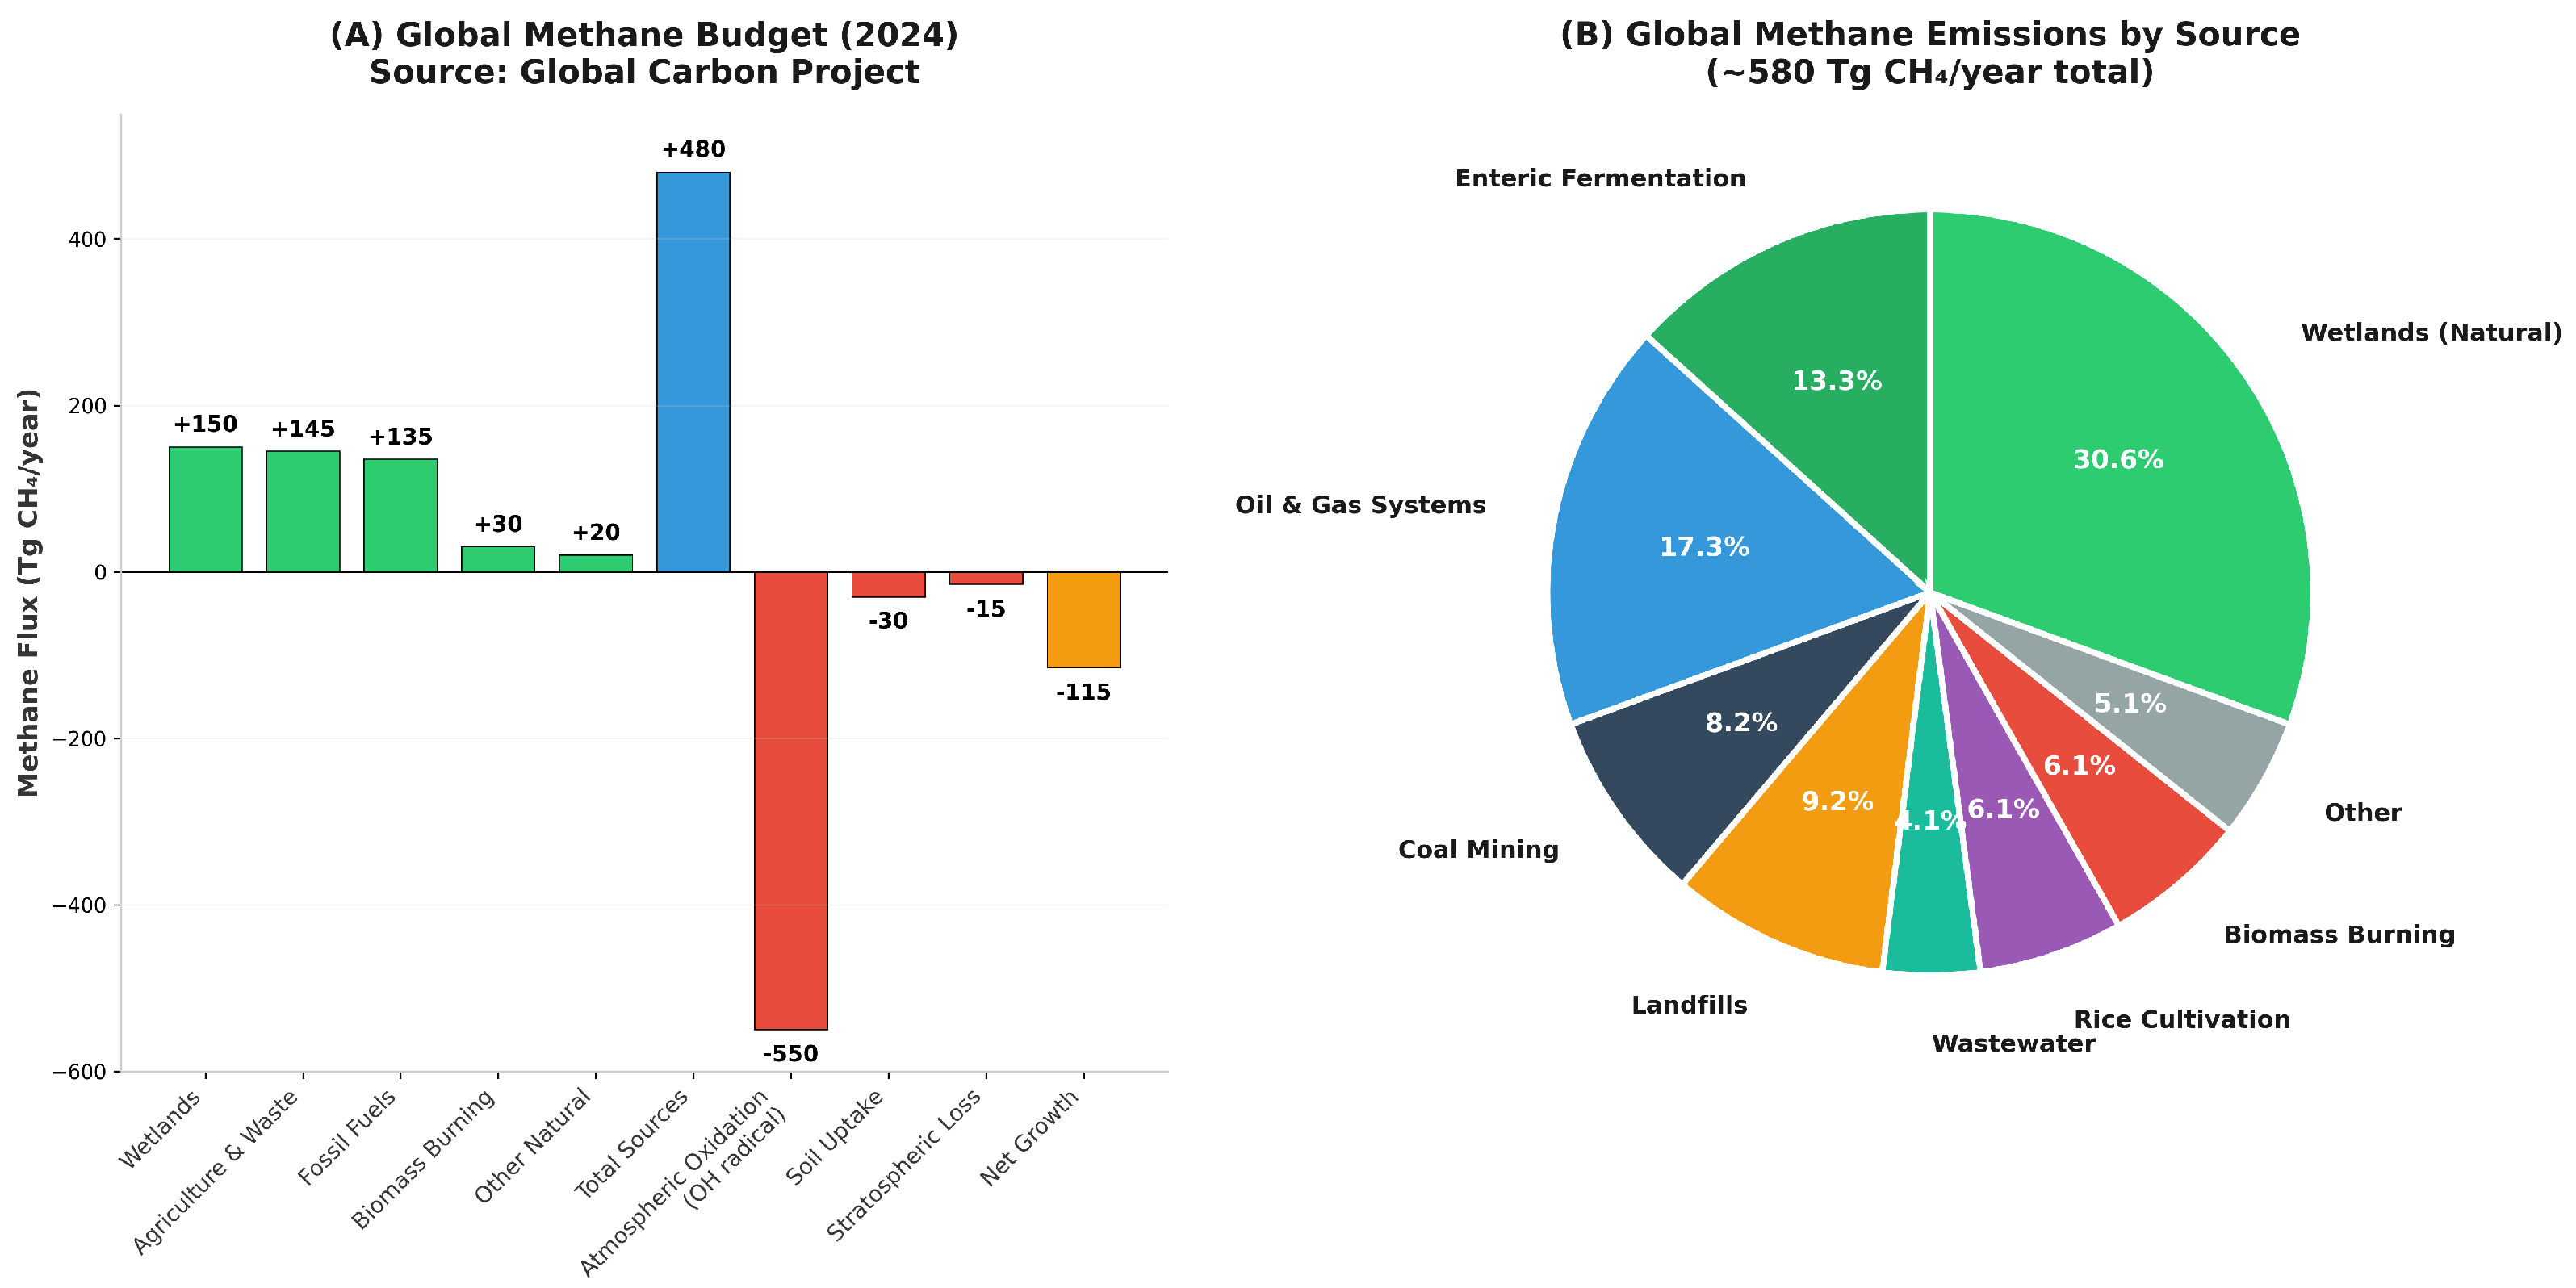
The Global Carbon Project’s 2024 Global Methane Budget provides the most comprehensive assessment of methane sources and sinks. For the 2000–2020 period, total global methane emissions averaged approximately 580 Tg CH4/year, comprising natural sources (40%) and anthropogenic sources (60%). Natural sources are dominated by wetlands (∼150 Tg/year), with smaller contributions from geological seeps, termites, and ocean emissions. Anthropogenic sources are approximately equally split between the fossil fuel sector (∼135 Tg/year from oil, gas, and coal) and agriculture/waste (∼145 Tg/year from enteric fermentation, rice cultivation, landfills, and wastewater) [87].
Atmospheric methane is removed primarily through oxidation by the hydroxyl radical (OH) in the troposphere, accounting for approximately 550 Tg/year or about 90% of total sinks. Additional sinks include soil uptake (∼30 Tg/year) and stratospheric destruction (∼15 Tg/year). The global methane budget is heavily influenced by a complex mixture of anthropogenic and natural sources (Figure 4). The imbalance between sources and sinks of approximately 15–20 Tg/year drives the observed atmospheric growth rate of 6–15 ppb/year [88].
A concerning finding from the Global Methane Budget 2024 is that anthropogenic emissions appear to be the main driver of the post–2007 increase, with equal contributions from the fossil fuel sector and agriculture/waste. Emissions increased by approximately 50 Tg/year between the 2000–2006 average and 2020, representing a nearly 9% increase over the period. This trend is inconsistent with the emissions reductions needed to meet the Global Methane Pledge target of 30% reduction by 2030 [89].

4.2. Source Attribution from Satellite Observations

4.2.1. Fossil Fuel Sector

The oil and gas sector has been the primary focus of high-resolution satellite monitoring due to the concentration of emissions from production, processing, and transportation infrastructure, and the cost-effectiveness of mitigation. Satellite observations have consistently revealed that official inventories substantially underestimate actual emissions, primarily because inventories rely on emission factors and activity data that do not capture super-emitter events and abnormal process conditions [90].
Studies using TROPOMI data have identified systematic underestimation of oil and gas methane emissions across all major producing basins. In the Permian Basin (United States), satellite-derived estimates exceed inventory values by a factor of 1.5–2.5. In Turkmenistan, one of the world’s largest methane-emitting countries, satellite observations revealed that oil and gas infrastructure accounts for emissions far exceeding reported values, with some fields showing emission rates among the highest globally. The ability of high-resolution satellites to detect and attribute individual super-emitters has enabled targeted mitigation that can achieve disproportionate emission reductions. Research indicates that in some basins, a large share of total emissions can be isolated to a select number of super-emitters, making targeted mitigation highly effective [91].
Coal mining represents another major fossil fuel source of methane, particularly in China, which accounts for approximately half of global coal production. Satellite-based detection of coal mine methane presents unique challenges due to the diffuse nature of ventilation emissions and the complex topography of mining regions. Nevertheless, TROPOMI and high-resolution sensors have successfully identified major emitting mines, and the Shanxi coal mining region has been a focus of WorldView-3 validation campaigns [92,93].

4.2.2. Waste Sector

Solid waste landfills are the third-largest source of anthropogenic methane in many countries. Carbon Mapper’s airborne and satellite studies have revealed that a small fraction of landfill sites account for a disproportionate share of total waste sector emissions. A November 2024 study found that of 10,000 waste sites surveyed, large methane emissions were detected at 371 sites across 71 countries, which together emitted 6.1 million metric tons of methane per year-approximately 9% of global anthropogenic waste sector emissions. These “super-emitter” landfills represent a significant mitigation opportunity, as many are in jurisdictions with regulatory frameworks that could mandate remediation [94].

4.2.3. Agriculture

Agricultural methane emissions, primarily from enteric fermentation in ruminant livestock and rice cultivation, are the most challenging to monitor from space due to their diffuse nature and the spectral complexity of agricultural landscapes. Satellite detection of individual agricultural methane sources is generally limited to concentrated point sources such as large dairy operations and rice paddies under specific conditions. However, regional-scale agricultural emissions can be constrained through atmospheric inverse modeling that assimilates satellite X C H 4 observations with prior emission inventories [95,96].

4.2.4. Natural Sources: Wetlands and Permafrost

Wetlands represent the largest single source of atmospheric methane, with emissions that vary strongly with temperature, water table depth, and vegetation type. Satellite observations contribute to wetland methane understanding through two approaches: (1) regional-scale flux inversions that use atmospheric methane measurements to constrain total wetland emissions; and (2) mapping of wetland extent and inundation dynamics using optical and SAR imagery that inform process-based models. The Arctic Methane and Permafrost Challenge (AMPAC), a transatlantic initiative between NASA and ESA, aims to improve observation capabilities for Arctic methane sources, including thawing permafrost and subsea hydrate deposits. Upcoming SAR missions and multi-sensor constellations are expected to significantly advance seasonal representation and source attribution in high-latitude regions [97,98].

4.3. Atmospheric Inverse Modeling

Atmospheric inverse modeling provides the critical link between satellite-observed methane concentrations and surface emission fluxes. Inverse models use atmospheric transport models to relate emission patterns at the surface to concentration fields in the atmosphere, then optimize emission estimates to minimize the mismatch between modeled and observed concentrations. The Community Inversion Framework (CIF) developed by the Global Carbon Project provides a standardized platform for methane flux inversions, enabling intercomparison of results from different research groups [99].
Maksyutov et al. demonstrated global high-resolution methane flux inversion using a Lagrangian–Eulerian coupled tracer transport model at 0.1° spatial resolution, assimilating both ground-based monitoring network data and GOSAT satellite retrievals. The coupled transport model better reproduces ground-based continuous observations at mid- and high latitudes in winter by resolving both anthropogenic emission plumes and near-surface transport in the shallow boundary layer. Inverse modeling combining ground-based and satellite observations successfully removes large-scale biases while retaining local-scale variability containing information on anthropogenic emissions [100].
Recent advances in high-resolution inverse modeling using TROPOMI data have enabled attribution of emissions to individual countries, basins, and even facility clusters. However, significant challenges remain, including the characterization and minimization of aggregation errors, the representation of model transport errors, and the limited sensitivity of column measurements to boundary layer emissions where most sources are located [101].
A critical limitation in atmospheric inverse modeling is how uncertainties in chemical transport models propagate directly into methane flux estimates. Flux inversions are highly sensitive to the accurate simulation of atmospheric transport. Errors in parameterized planetary boundary layer (PBL) dynamics, vertical mixing, and high-resolution wind speed and direction can easily be misinterpreted by the model as variations in surface emissions. In many regional inversions, these transport errors dominate the overall uncertainty budget, sometimes exceeding the uncertainties stemming from the satellite retrievals themselves. Therefore, improving the assimilation of localized meteorological data and developing high-resolution transport models that accurately represent complex terrain and boundary layer physics are vital for reducing biases in top-down emission estimates.

5. Policy Frameworks and Mitigation Impact

5.1. The Global Methane Pledge

The Global Methane Pledge (GMP), launched at COP26 in November 2021 by the United States and European Union, now includes over 150 countries representing more than 50% of global anthropogenic methane emissions. Signatories commit to work together to collectively reduce anthropogenic methane emissions by at least 30% below 2020 levels by 2030. The 2025 Global Methane Status Report, produced by UNEP and the Climate and Clean Air Coalition (CCAC), provides the most comprehensive assessment of progress to date [102].
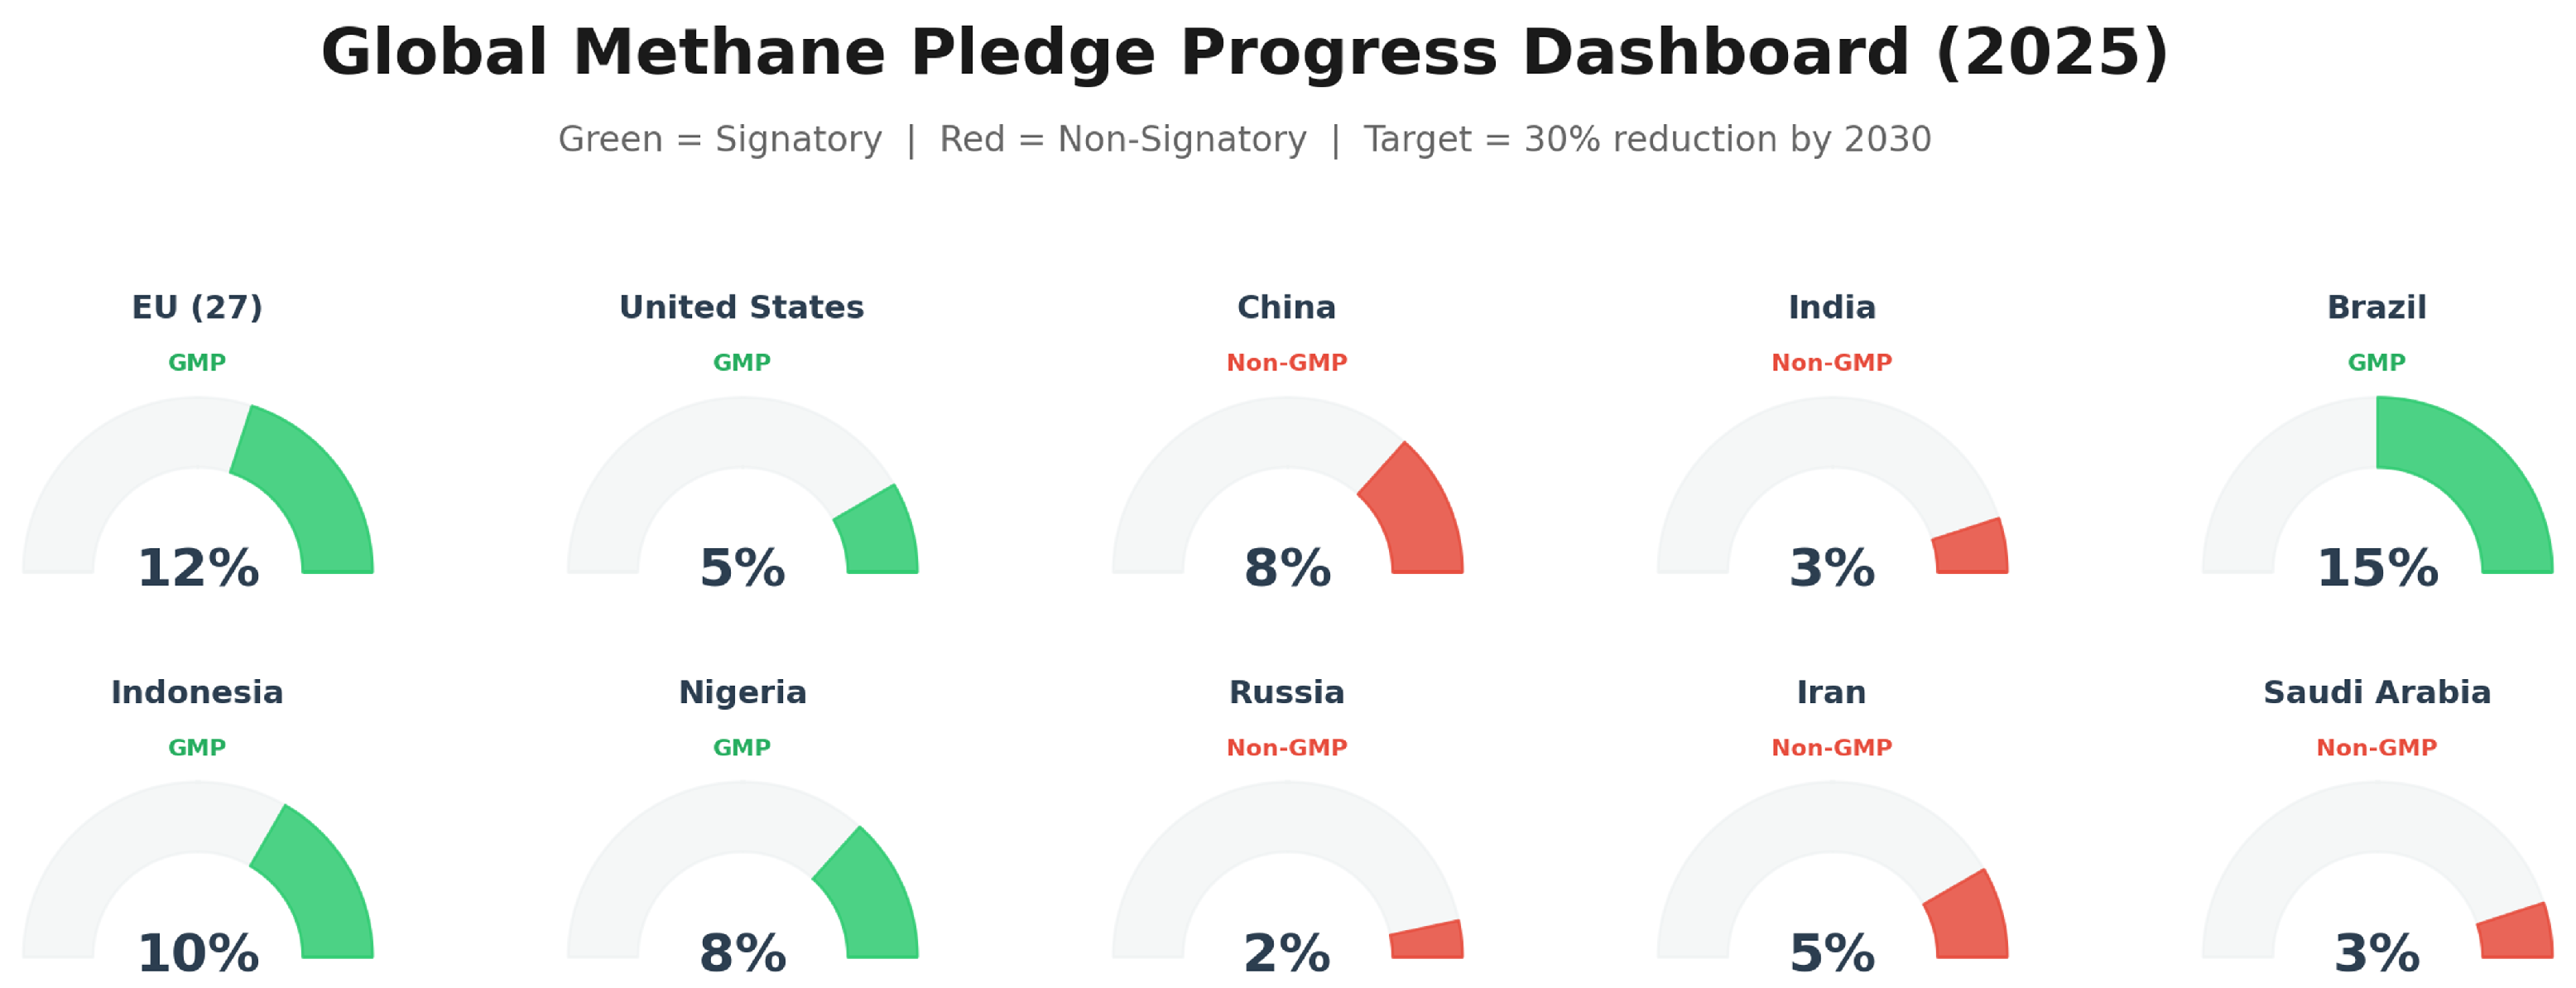
Significant progress has been made since 2021: 81% of Nationally Determined Contributions (NDCs) now include methane measures in at least one sector, compared to just 50% prior to the GMP launch. As of November 2025, 23% of countries include quantified methane targets in their NDC 3.0 submissions. However, only full-scale implementation of proven and available control measures will close the gap to the GMP target. The UNEP-CCAC Global Methane Status Report shows that projected 2030 emissions under current legislation are lower than earlier forecasts due to national policies, sectoral regulations, and market shifts, but a significant gap remains between current trajectories and the targeted reductions (Figure 5).
The climate benefits of meeting the GMP target are substantial. Full implementation of maximum technically feasible methane reductions would avoid 0.2 °C of warming by 2050, prevent over 180,000 premature deaths annually, and avoid nearly 19 megatonnes of crop losses per year by 2030. The estimated value of these benefits exceeds USD $330 billion annually by 2030-more than double the cost of taking action [103,104].

5.2. Oil and Gas Decarbonization Charter (OGDC)

At COP28 in December 2023, more than 50 leading oil and gas companies launched the Oil and Gas Decarbonization Charter (OGDC), establishing ambitions to achieve net-zero operational emissions by 2050 and near-zero methane emissions by 2030. The International Energy Agency (IEA), UNEP’s International Methane Emissions Observatory (IMEO), and the Environmental Defense Fund (EDF) developed a framework of 25 metrics to assess and track company progress toward these goals [105].
The 2025 Pledges to Progress assessment evaluated 116 companies representing approximately 80% of global oil and gas production. Key findings include: (1) the average company scored only 9 out of 25 possible points; (2) companies scored much higher on target-setting metrics (66%) than on implementation strategies (18%) or disclosure (21%); (3) OGDC signatories averaged 12 points versus 9 for non-signatories; and (4) no company received full credit for methane investment reporting. These results indicate that while industry commitment has expanded significantly, transparency and concrete action remain insufficient.

5.3. U.S. Regulatory Framework

The U.S. Environmental Protection Agency’s Methane Super-Emitter Program, established as part of the 2024 New Source Performance Standards (NSPS) for oil and natural gas facilities, represents a landmark in satellite-enabled environmental regulation. Under this program, certified third parties may submit methane super-emitter event notifications to EPA using approved remote-sensing technology, including satellite detection. A super-emitter event is defined as a methane release exceeding 100 kg/h [106]. Upon receiving a validated notification, the responsible facility operator must initiate an investigation within 5 days and report findings to EPA within 15 days.
California has emerged as a leader in operationalizing satellite data for methane mitigation. Under SB 1383, California committed to reducing methane emissions by 40% from 2013 levels by 2030. The state’s Satellite Data Purchase Program, funded by cap-and-trade revenues, has contracted with Carbon Mapper for three years of high-resolution methane plume data from Tanager-1, with up to seven additional satellites planned. This program includes $5 million in community engagement grants to improve public access to satellite data and establish plume notification methods [107].

5.4. European Union Policy

The EU Methane Strategy, adopted in October 2020, established a comprehensive framework for methane emission reduction across all sectors. Key elements include requirements for the oil and gas industry to adopt Leak Detection and Repair (LDAR) programs, mandates for measuring, reporting, and verification (MRV) of methane emissions, and restrictions on venting and flaring [108]. The forthcoming C O 2 M mission will provide independent verification of anthropogenic C O 2 and C H 4 emissions, complementing national inventory reporting with transparent, satellite-derived data [109].

5.5. Impact of Satellite Observations on Mitigation Action

The translation of satellite observations into concrete emission reductions is accelerating. GHGSat reports that armed with its data, operators have mitigated more than 20 million tons of C O 2 -equivalent emissions. Carbon Mapper’s early demonstration in the Permian Basin-a pipeline leak detected, reported, and repaired within 15 days-illustrates the potential for rapid response when satellite data flows directly to operators and regulators [110].
However, assessing the true policy effectiveness of these monitoring systems requires a critical perspective. While facility-scale success stories and operator-reported mitigations are encouraging, the connection between satellite observations and sustained, measurable emission reductions at regional or global scales remains largely qualitative. Many reported emission reductions are self-reported by industry actors and lack independent, top-down verification. Furthermore, while satellites excel at identifying super-emitters, evaluating the cumulative impact of mitigating these large point sources against the backdrop of diffuse, continuous area emissions remains difficult. For policy frameworks to be deemed truly effective, future research must demonstrate statistically significant, satellite-verified declines in regional methane inventories over multi-year periods, closing the loop between observation, intervention, and atmospheric response.
The open-data model adopted by Carbon Mapper and NASA represents a paradigm shift in environmental monitoring. The Tanager-1 data portal has reached over 63,000 users across diverse stakeholder groups: regulators and policymakers, commercial operators, NGOs, academic researchers, journalists, and community groups. This broad accessibility ensures that satellite data serves not only top-down regulatory compliance but also bottom-up accountability from civil society.

6. Challenges and Future Directions

6.1. Technical Challenges

6.1.1. Detection Limit and Spatial Coverage Trade-Offs

The fundamental trade-off between spatial resolution, spectral resolution, temporal coverage, and detection limit remains the primary constraint on global methane monitoring. Area-mapping instruments like TROPOMI provide daily global coverage but at spatial resolutions too coarse for direct facility attribution. Point-source imagers like GHGSat and Tanager-1 provide facility-scale detection but cover limited geographic areas. Bridging this gap requires either constellations of high-resolution satellites or improved algorithms for detecting smaller plumes in lower-resolution data. The planned C O 2 M constellation represents a middle ground with 2 km resolution and 3-day revisit, but this may still be insufficient for detection of individual point sources.

6.1.2. Cloud Contamination and Data Gaps

Cloud cover remains a major limitation for passive optical methane sensors. Regions with persistent cloud cover, including tropical wetland areas and high-latitude regions in winter, experience significant data gaps. The dependence on solar illumination further restricts observations to daytime only and limits performance at high latitudes during winter. Active sensors (lidar) could potentially overcome these limitations, and NASA’s Arctic Methane and Permafrost Challenge (AMPAC) initiative has identified active optical instruments as a priority for future satellite missions. The Methane Sounder concept, proposed for the NASA Earth System Observatory, would provide the first space-based lidar measurements of atmospheric methane.

6.1.3. Quantification Uncertainty

While detection capabilities have advanced dramatically, emission rate quantification remains challenging. The dominant source of uncertainty is wind speed, which can vary by 30–50% across a plume and is poorly constrained by reanalysis products at the spatial and temporal scales relevant to individual satellite overpasses. Additional uncertainties arise from plume height assumptions, background methane estimation, and instrument calibration. Controlled release experiments, in which known quantities of methane are released and measured simultaneously by satellite and ground sensors, are essential for validation but remain limited in number and geographic coverage.

6.1.4. Spectral Interferences and False Positives

Spectral interference from surface features, cloud edges, and thin cirrus remains a significant source of false positives in methane retrievals. Over spectrally complex surfaces such as urban areas, mining regions, and agricultural landscapes, surface reflectance variations can mimic methane absorption signatures. Deep learning approaches have reduced but not eliminated these false positives, and manual validation remains standard practice for publication of high-confidence plume detections. Improved training datasets spanning diverse geographic and surface conditions are needed to further reduce false positive rates.

6.2. Future Satellite Missions and Constellations

The period 2025–2030 will see a dramatic expansion of methane-monitoring satellite capacity. Carbon Mapper plans to expand from one to at least four Tanager satellites, significantly increasing global coverage. GHGSat is adding two additional satellites to its constellation, bringing the total to 14. ESA’s C O 2 M constellation will add three dedicated anthropogenic emission monitoring satellites. NASA’s Earth System Observatory includes the Atmospheric Observing System (AOS) with methane-sounding capabilities, and the Surface Biology and Geology (SBG) mission with a VSWIR imaging spectrometer that will extend EMIT’s capabilities.
The concept of “tiered” or “persistent” monitoring systems-combining daily global coverage with on-demand high-resolution tasking is emerging as the preferred architecture. In this paradigm, TROPOMI or C O 2 M provides the “survey” function, identifying regions with anomalous methane enhancements, while GHGSat, Tanager, or WorldView-3 provide the “target” function for detailed source attribution. Machine learning tip-and-cue systems automate the hand-off between survey and target sensors, reducing latency from detection to notification from weeks to hours.

6.3. Advances in Machine Learning

Future advances in methane detection are expected from three machine learning directions: (1) foundation models pretrained on large, diverse remote sensing datasets that can be fine-tuned for methane detection with minimal labeled data; (2) multi-temporal approaches that analyze time series of satellite observations to detect persistent and intermittent emissions; and (3) physics-informed neural networks that incorporate radiative transfer constraints directly into the learning architecture. Data-efficient deep transfer learning frameworks have already demonstrated the ability to adapt models to new geographic domains with high accuracy using limited training examples.

6.4. Integration with Ground-Based and Aerial Networks

Satellite observations cannot achieve complete emission characterization alone. Comprehensive methane monitoring requires integration with ground-based sensor networks, airborne surveys, and facility-level continuous monitoring systems. The Total Carbon Column Observing Network (TCCON) provides essential validation for satellite XCH4 retrievals with precision better than 0.2%. Airborne imaging spectrometers such as AVIRIS-NG provide critical validation data for high-resolution satellite products and enable detection of emission sources too small or transient for current satellite detection limits. The emerging concept of a “system of systems” integrates all these observing platforms within a unified data framework that provides seamless information from global to facility scales.

6.5. Operational and Sustained Monitoring

Perhaps the most critical challenge is ensuring sustained operational monitoring rather than a series of research demonstrations. The transition from research missions (EMIT, Tanager-1) to operational systems ( C O 2 M , SBG) requires long-term commitment to data continuity, calibration, and product validation. International coordination through the Committee on Earth Observation Satellites (CEOS) and the Group on Earth Observations (GEO) provides frameworks for ensuring that the emerging constellation of methane-monitoring satellites functions as an integrated global observing system rather than a collection of independent missions.

7. Conclusions

7.1. Evolution of the Policy Landscape

The policy landscape has evolved rapidly to leverage these new capabilities. The Global Methane Pledge now covers over 150 countries, the U.S. EPA has established the first regulatory framework incorporating satellite super-emitter detection, California has operationalized satellite data purchase for statewide methane monitoring, and the EU’s CO2M mission will provide independent anthropogenic emission verification from 2027. The oil and gas industry, through the OGDC, has committed to near-zero methane by 2030, though independent assessments show that concrete implementation plans and transparent reporting remain insufficient.

7.2. Technological Advancements and Atmospheric Context

The field of high-resolution global methane mapping has undergone a transformation in the past five years. Where once scientists relied on sparse ground networks and coarse climate models, a diverse constellation of satellite instruments now provides unprecedented capability to detect, quantify, and attribute methane emissions from space. The spatial resolution frontier has advanced from tens of kilometers to meters, detection limits have fallen from thousands to tens of kilograms per hour, and temporal revisit has progressed from monthly to daily for targeted locations. These technical advances are underpinned by revolutionary developments in machine learning, which have enabled automated detection of methane plumes with accuracy approaching that of expert analysts.
Our analysis of 42 years of NOAA global methane observations demonstrates that these monitoring advances arrive at a critical moment. Atmospheric methane concentrations reached a record 1945.85 ppb in November 2025, with growth rates averaging 10–15 ppb/year over the past decade far exceeding the trajectory needed to meet climate goals. The gap between estimated emissions and measured atmospheric concentrations is widening, suggesting that current inventories may be missing significant sources.

7.3. Pathways to Mitigation and Critical Research Gaps

The pathway to achieving the Global Methane Pledge target of 30% reduction by 2030 is technically feasible and economically favorable, particularly in the fossil fuel sector where captured methane has commercial value. Satellite-derived data provides the transparency and accountability needed to ensure that pledges translate into action. However, realizing this potential requires: (1) continued expansion of high-resolution satellite constellations with sustained operational funding; (2) advancement of machine learning methods for automated detection and quantification; (3) integration of satellite observations with atmospheric inverse models for comprehensive flux estimation; (4) strengthening of regulatory frameworks that leverage satellite data for enforcement; and (5) investment in ground-based and airborne validation networks to ensure data quality and traceability.
To fully realize this potential and achieve international reduction targets, several critical research gaps must be addressed in the coming decade. First, there is a pressing need for the establishment of robust, continuous ground-based and airborne validation networks to anchor satellite retrievals. Second, future missions should explore active sensing technologies, such as spaceborne LiDAR, to overcome limitations associated with passive sensors, particularly regarding nighttime observations and high-latitude monitoring where solar illumination is poor. Third, the community must develop advanced data assimilation frameworks capable of fusing multi-scale observations from 50 m point-source imagers to 5 km area mappers into cohesive global models. Finally, the operational integration of machine learning methods requires a shift from localized research demonstrations to generalized, sensor-agnostic platforms capable of real-time, global plume detection and quantification.

Author Contributions

Conceptualization, A.K.S. and M.; methodology, A.K.S.; software, A.K.S.; validation, A.K.S. and M.; formal analysis, A.K.S.; investigation, A.K.S.; resources, A.K.S.; data curation, A.K.S.; writing—original draft preparation, A.K.S.; writing—review and editing, A.K.S. and M.; visualization, A.K.S.; supervision, M.; project administration, M. All authors have read and agreed to the published version of the manuscript.

Funding

This research received no external funding.

Institutional Review Board Statement

Not applicable.

Informed Consent Statement

Not applicable.

Data Availability Statement

No datasets were generated during the current study.

Acknowledgments

The authors would like to acknowledge the use of the generative AI tool Google Gemini 3.1 Pro for proofreading, grammatical corrections, and language editing during the preparation of this manuscript. The authors reviewed and edited the content as needed and take full responsibility for the final version of the paper.

Conflicts of Interest

The authors declare no conflicts of interest.

References

  1. Centi, G.; Perathoner, S. Reduction of Non-CO2 Greenhouse Gas Emissions by Catalytic Processes. In Handbook of Climate Change Mitigation and Adaptation; Springer: Berlin/Heidelberg, Germany, 2025; pp. 2147–2188. [Google Scholar] [CrossRef]
  2. Lan, X.; Thoning, K.W.; Dlugokencky, E.J. Trends in Globally-Averaged CH4, N2O, and SF6 Determined from NOAA Global Monitoring Laboratory Measurements. Version 2026-03; NOAA Global Monitoring Laboratory: Boulder, CO, USA, 2022. [CrossRef]
  3. He, J.; Naik, V.; Horowitz, L.W. Interpreting changes in global methane budget in a chemistry-climate model constrained with methane and isotopic observations. AGU Adv. 2026, 7, e2025AV001822. [Google Scholar] [CrossRef]
  4. Nisbet, E.G.; Manning, M.R. What is causing the methane surge? Science 2026, 391, 556–557. [Google Scholar] [CrossRef] [PubMed]
  5. Rahman, M.M.; Shults, R.; Arshad, A.; Sankaran, R.; Tran, T.N.D.; Keshk, H.M.; Raihan, A.; Lakshmi, V.; Rahman, M. Quantifying Methane-Climate Interactions in Eastern Saudi Arabia Using Geospatial and Machine Learning Modelling. IEEE J. Sel. Top. Appl. Earth Obs. Remote Sens. 2026, 19, 8504–8517. [Google Scholar] [CrossRef]
  6. Cain, M.; Jenkins, S.; Allen, M.R.; Lynch, J.; Frame, D.J.; Macey, A.H.; Peters, G.P. Methane and the Paris Agreement temperature goals. Philos. Trans. R. Soc. A 2022, 380, 20200456. [Google Scholar] [CrossRef] [PubMed]
  7. Li, F.; Lin, K.; Yan, Y.; Bai, S.; Huang, Q.; Feng, C.; Sun, S.; Zhao, S.; Zhou, W.; Zhou, C.; et al. Comparing the performance of different hyperspectral satellite imaging spectroscopy in mapping methane point-source emissions. Remote Sens. Environ. 2026, 334, 115224. [Google Scholar] [CrossRef]
  8. Mostafa, M.S.; Du, K. Satellite-Based Methane Emission Monitoring: A Review Across Industries. Remote Sens. 2025, 17, 3674. [Google Scholar] [CrossRef]
  9. Duren, R.; Cusworth, D.; Ayasse, A.; Howell, K.; Diamond, A.; Scarpelli, T.; Kim, J.; O’Neill, K.; Lai-Norling, J.; Thorpe, A.; et al. The Carbon Mapper emissions monitoring system. Atmos. Meas. Tech. 2025, 18, 6933–6958. [Google Scholar] [CrossRef]
  10. Malley, C.S.; Borgford-Parnell, N.; Haeussling, S.; Howard, I.C.; Lefèvre, E.N.; Kuylenstierna, J.C.I. A roadmap to achieve the global methane pledge. Environ. Res. Clim. 2023, 2, 011003. [Google Scholar] [CrossRef]
  11. Courrèges-Lacoste, G.B.; Pachot, C.; Ouslimani, H.; Durand, Y.; Pasquet, A.; Chanumolu, A.; Fernandez, M.M.; Caleno, M.; Bastirmaci, T.; Birtwhistle, A.; et al. Progress on the development of the Copernicus CO2M mission. In Sensors, Systems, and Next-Generation Satellites XXVIII; SPIE: Bellingham, WA, USA, 2024; Volume 13192, pp. 185–199. [Google Scholar] [CrossRef]
  12. Weimer, M.; Hilker, M.; Noël, S.; Reuter, M.; Buchwitz, M.; Fuentes Andrade, B.; Lang, R.; Sierk, B.; Meijer, Y.; Bovensmann, H.; et al. A study of measurement scenarios for the future CO2M mission: Avoidance of detector saturation and the impact on XCO2 retrievals. Atmos. Meas. Tech. 2025, 18, 3321–3340. [Google Scholar] [CrossRef]
  13. Wu, X.; Zhang, X.; Chuai, X.; Huang, X.; Wang, Z. Long-term trends of atmospheric CH4 concentration across China from 2002 to 2016. Remote Sens. 2019, 11, 538. [Google Scholar] [CrossRef]
  14. Massart, S.; Agusti-Panareda, A.; Aben, I.; Butz, A.; Chevallier, F.; Crevoisier, C.; Engelen, R.; Frankenberg, C.; Hasekamp, O. Assimilation of atmospheric methane products into the MACC-II system: From SCIAMACHY to TANSO and IASI. Atmos. Chem. Phys. 2014, 14, 6139–6158. [Google Scholar] [CrossRef]
  15. de Leeuw, G.; van der A, R.; Bai, J.; Xue, Y.; Varotsos, C.; Li, Z.; Fan, C.; Chen, X.; Christodoulakis, I.; Ding, J.; et al. Air quality over China. Remote Sens. 2021, 13, 3542. [Google Scholar] [CrossRef]
  16. Jiang, Y.; Zhang, L.; Zhang, X.; Cao, X. Methane retrieval algorithms based on satellite: A review. Atmosphere 2024, 15, 449. [Google Scholar] [CrossRef]
  17. Jacob, D.J.; Turner, A.J.; Maasakkers, J.D.; Sheng, J.; Sun, K.; Liu, X.; Chance, K.; Aben, I.; McKeever, J.; Frankenberg, C. Satellite observations of atmospheric methane and their value for quantifying methane emissions. Atmos. Chem. Phys. 2016, 16, 14371–14396. [Google Scholar] [CrossRef]
  18. Fiore, A.M.; Mickley, L.J.; Zhu, Q.; Baublitz, C.B. Climate and tropospheric oxidizing capacity. Annu. Rev. Earth Planet. Sci. 2024, 52, 321–349. [Google Scholar] [CrossRef]
  19. Oshio, H.; Yoshida, Y.; Matsunaga, T.; Deutscher, N.M.; Dubey, M.; Griffith, D.W.T.; Hase, F.; Iraci, L.T.; Kivi, R.; Liu, C.; et al. Bias correction of the ratio of total column CH4 to CO2 retrieved from GOSAT spectra. Remote Sens. 2020, 12, 3155. [Google Scholar] [CrossRef]
  20. Schneising, O.; Buchwitz, M.; Reuter, M.; Bovensmann, H.; Burrows, J.P.; Borsdorff, T.; Deutscher, N.M.; Feist, D.G.; Griffith, D.W.T.; Hase, F.; et al. A scientific algorithm to simultaneously retrieve carbon monoxide and methane from TROPOMI onboard Sentinel-5 Precursor. Atmos. Meas. Tech. 2019, 12, 6771–6802. [Google Scholar] [CrossRef]
  21. Lindqvist, H.; Kivimäki, E.; Häkkilä, T.; Tsuruta, A.; Schneising, O.; Buchwitz, M.; Lorente, A.; Martinez Velarte, M.; Borsdorff, T.; Alberti, C.; et al. Evaluation of Sentinel-5P TROPOMI methane observations at northern high latitudes. Remote Sens. 2024, 16, 2979. [Google Scholar] [CrossRef]
  22. Liu, R.; Li, S.; Zhang, G.; Liu, M.; Lu, X.; Peng, S.; Shen, L.; Zhang, Y.; Zhuang, M.; Zuo, X.; et al. Recent advances in TROPOMI-based methane source detection: A systematic review. GISci. Remote Sens. 2026, 63, 2650822. [Google Scholar] [CrossRef]
  23. Chauhan, A.; Raval, S. Satellite-Derived Approaches for Coal Mine Methane Estimation: A Review. Remote Sens. 2025, 17, 3652. [Google Scholar] [CrossRef]
  24. Irakulis-Loitxate, I.; Guanter, L.; Maasakkers, J.D.; Zavala-Araiza, D.; Aben, I. Satellites detect abatable super-emissions in one of the world’s largest methane hotspot regions. Environ. Sci. Technol. 2022, 56, 2143–2152. [Google Scholar] [CrossRef] [PubMed]
  25. Wang, Y.; Guo, X.; Huo, Y.; Li, M.; Pan, Y.; Yu, S.; Baklanov, A.; Rosenfeld, D.; Seinfeld, J.H.; Li, P. Toward a versatile spaceborne architecture for immediate monitoring of the global methane pledge. Atmos. Chem. Phys. 2023, 23, 5233–5249. [Google Scholar] [CrossRef]
  26. Dubey, L.; Cooper, J.; Hawkes, A. Minimum detection limits of the TROPOMI satellite sensor across North America and their implications for measuring oil and gas methane emissions. Sci. Total Environ. 2023, 872, 162222. [Google Scholar] [CrossRef] [PubMed]
  27. de Jong, T.A.; Maasakkers, J.D.; Irakulis-Loitxate, I.; Randles, C.A.; Tol, P.; Aben, I. Daily global methane super-emitter detection and source identification with sub-daily tracking. Geophys. Res. Lett. 2025, 52, e2024GL111824. [Google Scholar] [CrossRef]
  28. Imasu, R.; Matsunaga, T.; Nakajima, M.; Yoshida, Y.; Shiomi, K.; Morino, I.; Saitoh, N.; Niwa, Y.; Someya, Y.; Oishi, Y.; et al. Greenhouse gases Observing SATellite 2 (GOSAT-2): Mission overview. Prog. Earth Planet. Sci. 2023, 10, 33. [Google Scholar] [CrossRef]
  29. Tanimoto, H.; Matsunaga, T.; Someya, Y.; Fujinawa, T.; Ohyama, H.; Morino, I.; Yashiro, H.; Sugita, T.; Inomata, S.; Müller, A.; et al. The greenhouse gas observation mission with Global Observing SATellite for Greenhouse gases and Water cycle (GOSAT-GW): Objectives, conceptual framework and scientific contributions. Prog. Earth Planet. Sci. 2025, 12, 8. [Google Scholar] [CrossRef]
  30. Someya, Y.; Yoshida, Y.; Ohyama, H.; Nomura, S.; Kamei, A.; Morino, I.; Mukai, H.; Matsunaga, T.; Laughner, J.L.; Velazco, V.A.; et al. Update on the GOSAT TANSO–FTS SWIR Level 2 retrieval algorithm. Atmos. Meas. Tech. 2023, 16, 1477–1501. [Google Scholar] [CrossRef]
  31. Hu, K.; Liu, Z.; Shao, P.; Ma, K.; Xu, Y.; Wang, S.; Wang, Y.; Wang, H.; Di, L.; Xia, M.; et al. A review of satellite-based CO2 data reconstruction studies: Methodologies, challenges, and advances. Remote Sens. 2024, 16, 3818. [Google Scholar] [CrossRef]
  32. Hu, K.; Feng, X.; Zhang, Q.; Shao, P.; Liu, Z.; Xu, Y.; Wang, S.; Wang, Y.; Wang, H.; Di, L.; et al. Review of satellite remote sensing of carbon dioxide inversion and assimilation. Remote Sens. 2024, 16, 3394. [Google Scholar] [CrossRef]
  33. Lin, K.-C.; Matthews, W.; Olsen, S. Middle spacepowers’ integration with the global supply chain for the space industry: Taiwan and Thailand. Bus. Polit. 2025, 27, 521–547. [Google Scholar] [CrossRef]
  34. Jervis, D.; McKeever, J.; Durak, B.O.A.; Sloan, J.J.; Gains, D.; Varon, D.J.; Ramier, A.; Strupler, M.; Tarrant, E. The GHGSat-D imaging spectrometer. Atmos. Meas. Tech. 2021, 14, 2127–2140. [Google Scholar] [CrossRef]
  35. Gasim, A.; Matar, W.; Muhsen, A. Using Satellite Technology to Measure Greenhouse Gas Emissions in Saudi Arabia; King Abdullah Petroleum Studies and Research Center: Riyadh, Saudi Arabia, 2023. [Google Scholar]
  36. Li, X.; Zhang, Y.; de Leeuw, G.; Yao, X.; He, Z.; Wu, H.; Yang, Z. A Review of City-Scale Methane Flux Inversion Based on Top-Down Methods. Remote Sens. 2025, 17, 3152. [Google Scholar] [CrossRef]
  37. Erland, B.M.; Thorpe, A.K.; Gamon, J.A. Recent advances toward transparent methane emissions monitoring: A review. Environ. Sci. Technol. 2022, 56, 16567–16581. [Google Scholar] [CrossRef] [PubMed]
  38. Carbon Mapper. Tanager-1: One Year in Space. Available online: https://carbonmapper.org/articles/tanager-1-one-year-in-space (accessed on 10 May 2026).
  39. Zavala-Araiza, D.; Omara, M.; Gautam, R.; Smith, M.L.; Pandey, S.; Aben, I.; Almanza-Veloz, V.; Conley, S.; Houweling, S.; Kort, E.A.; et al. A tale of two regions: Methane emissions from oil and gas production in offshore/onshore Mexico. Environ. Res. Lett. 2021, 16, 024019. [Google Scholar] [CrossRef]
  40. Ilonze, C.; Emerson, E.; Duggan, A.; Zimmerle, D. Assessing the progress of the performance of continuous monitoring solutions under a single-blind controlled testing protocol. Environ. Sci. Technol. 2024, 58, 10941–10955. [Google Scholar] [CrossRef] [PubMed]
  41. Braham, N.A.A.; Albrecht, C.M.; Mairal, J.; Chanussot, J.; Wang, Y.; Zhu, X.X. Spectralearth: Training hyperspectral foundation models at scale. IEEE J. Sel. Top. Appl. Earth Obs. Remote Sens. 2025, 18, 16780–16797. [Google Scholar] [CrossRef]
  42. Roger, J.; Irakulis-Loitxate, I.; Valverde, A.; Gorroño, J.; Chabrillat, S.; Brell, M.; Guanter, L. High-resolution methane mapping with the EnMAP satellite imaging spectroscopy mission. IEEE Trans. Geosci. Remote Sens. 2024, 62, 4102012. [Google Scholar] [CrossRef]
  43. Roger, J.; Guanter, L.; Gorroño, J. Assessing the Detection of Methane Plumes in Offshore Areas Using High-Resolution Imaging Spectrometers. Atmos. Meas. Tech. 2025, 18, 5545–5567. [Google Scholar] [CrossRef]
  44. Pandey, S.; Worden, J.; Cusworth, D.H.; Varon, D.J.; Thill, M.D.; Jacob, D.J.; Bowman, K.W. Relating multi-scale plume detection and area estimates of methane emissions: A theoretical and empirical analysis. Environ. Sci. Technol. 2025, 59, 7931–7947. [Google Scholar] [CrossRef] [PubMed]
  45. Pandey, S.; van Nistelrooij, M.; Maasakkers, J.D.; Sutar, P.; Houweling, S.; Varon, D.J.; Tol, P.; Gains, D.; Worden, J.; Aben, I. Daily detection and quantification of methane leaks using Sentinel-3: A tiered satellite observation approach with Sentinel-2 and Sentinel-5p. Remote Sens. Environ. 2023, 296, 113716. [Google Scholar] [CrossRef]
  46. De Luca, G.; Carotenuto, F.; Genesio, L.; Pepe, M.; Toscano, P.; Boschetti, M.; Miglietta, F.; Gioli, B. Improving PRISMA hyperspectral spatial resolution and geolocation by using Sentinel-2: Development and test of an operational procedure in urban and rural areas. ISPRS J. Photogramm. Remote Sens. 2024, 215, 112–135. [Google Scholar] [CrossRef]
  47. Vangi, E.; D’Amico, G.; Francini, S.; Giannetti, F.; Lasserre, B.; Marchetti, M.; Chirici, G. The new hyperspectral satellite PRISMA: Imagery for forest types discrimination. Sensors 2021, 21, 1182. [Google Scholar] [CrossRef] [PubMed]
  48. Musacchio, M.; Silvestri, M.; Romaniello, V.; Casu, M.; Buongiorno, M.F.; Melis, M.T. Comparison of ASI-PRISMA data, DLR-EnMAP data, and field spectrometer measurements on “Sale ‘e Porcus”, a salty pond (Sardinia, Italy). Remote Sens. 2024, 16, 1092. [Google Scholar] [CrossRef]
  49. Alicandro, M.; Candigliota, E.; Dominici, D.; Immordino, F.; Masin, F.; Pascucci, N.; Quaresima, R.; Zollini, S. Hyperspectral PRISMA and Sentinel-2 preliminary assessment comparison in Alba Fucens and Sinuessa archaeological sites (Italy). Land 2022, 11, 2070. [Google Scholar] [CrossRef]
  50. Ranghetti, M.; Boschetti, M.; Ranghetti, L.; Tagliabue, G.; Panigada, C.; Gianinetto, M.; Verrelst, J.; Candiani, G. Assessment of maize nitrogen uptake from PRISMA hyperspectral data through hybrid modelling. Eur. J. Remote Sens. 2023, 56, 2117650. [Google Scholar] [CrossRef] [PubMed]
  51. Proestakis, E.; Amiridis, V.; Pérez García-Pando, C.; Tsyro, S.; Griesfeller, J.; Gkikas, A.; Georgiou, T.; Gonçalves Ageitos, M.; Escribano, J.; Myriokefalitakis, S.; et al. Quantifying dust deposition over the Atlantic Ocean. Earth Syst. Sci. Data 2025, 17, 4351–4395. [Google Scholar] [CrossRef]
  52. Ustin, S.L.; Middleton, E.M. Current and Near-Term Earth-Observing Environmental Satellites, Their Missions, Characteristics, Instruments, and Applications. Sensors 2024, 24, 3488. [Google Scholar] [CrossRef] [PubMed]
  53. Shinn, H.; Roberts, J. Alaska Exclusive Economic Zone: Ocean Exploration and Research: Bibliography; NCRL subject guide 2020-08; NOAA Central Library: Silver Spring, MD, USA, 2020. [CrossRef]
  54. Andries, A.; Morse, S.; Murphy, R.J.; Lynch, J.; Woolliams, E.R. Using data from earth observation to support sustainable development indicators: An analysis of the literature and challenges for the future. Sustainability 2022, 14, 1191. [Google Scholar] [CrossRef]
  55. Asadzadeh, S.; de Souza Filho, C.R. Investigating the capability of WorldView-3 superspectral data for direct hydrocarbon detection. Remote Sens. Environ. 2016, 173, 162–173. [Google Scholar] [CrossRef]
  56. Karimzadeh, S.; Tangestani, M.H. Evaluating the VNIR-SWIR datasets of WorldView-3 for lithological mapping of a metamorphic-igneous terrain using support vector machine algorithm; a case study of Central Iran. Adv. Space Res. 2021, 68, 2421–2440. [Google Scholar] [CrossRef]
  57. Jennewein, J.S.; Hively, W.; Lamb, B.T.; Daughtry, C.S.T.; Thapa, R.; Thieme, A.; Reberg-Horton, C.; Mirsky, S. Spaceborne imaging spectroscopy enables carbon trait estimation in cover crop and cash crop residues. Precis. Agric. 2024, 25, 2165–2197. [Google Scholar] [CrossRef]
  58. Sánchez-García, E.; Gorroño, J.; Irakulis-Loitxate, I.; Varon, D.J.; Guanter, L. Mapping methane plumes at very high spatial resolution with the WorldView-3 satellite. Atmos. Meas. Tech. 2022, 15, 1657–1674. [Google Scholar] [CrossRef]
  59. Sherwin, E.D.; Rutherford, J.S.; Chen, Y.; Aminfard, S.; Kort, E.A.; Jackson, R.B.; Brandt, A.R. Single-blind validation of space-based point-source detection and quantification of onshore methane emissions. Sci. Rep. 2023, 13, 3836. [Google Scholar] [CrossRef] [PubMed]
  60. Miller, C.C.; Roche, S.; Wilzewski, J.S.; Liu, X.; Chance, K.; Souri, A.H.; Conway, E.; Luo, B.; Samra, J.; Hawthorne, J.; et al. Methane retrieval from MethaneAIR using the CO2 proxy approach: A demonstration for the upcoming MethaneSAT mission. Atmos. Meas. Tech. 2024, 17, 5429–5454. [Google Scholar] [CrossRef]
  61. Varon, D.J.; Jervis, D.; McKeever, J.; Spence, I.; Gains, D.; Jacob, D.J. High-frequency monitoring of anomalous methane point sources with multispectral Sentinel-2 satellite observations. Atmos. Meas. Tech. 2021, 14, 2771–2785. [Google Scholar] [CrossRef]
  62. Gorroño, J.; Varon, D.J.; Irakulis-Loitxate, I.; Guanter, L. Understanding the potential of Sentinel-2 for monitoring methane point emissions. Atmos. Meas. Tech. 2023, 16, 89–107. [Google Scholar] [CrossRef]
  63. Zambrano-Luna, B.A.; Sysoeva, L.; Gao, S.; Milne, R.; Burkus, Z.; Wang, H. Improved monitoring of methane emissions for the oil and gas sector with Sentinel-2 satellite observations. Atmos. Environ. 2025, 363, 121594. [Google Scholar] [CrossRef]
  64. Ehret, T.; De Truchis, A.; Mazzolini, M.; Morel, J.-M.; D’aspremont, A.; Lauvaux, T.; Duren, R.; Cusworth, D.; Facciolo, G. Global tracking and quantification of oil and gas methane emissions from recurrent sentinel-2 imagery. Environ. Sci. Technol. 2022, 56, 10517–10529. [Google Scholar] [CrossRef] [PubMed]
  65. Mehrdad, S.M.; Zhang, B.; Guo, W.; Du, S.; Du, K. First Investigation of Long-Term Methane Emissions from Wastewater Treatment Using Satellite Remote Sensing. Remote Sens. 2024, 16, 4422. [Google Scholar] [CrossRef]
  66. Guanter, L.; Roger, J.; Warren, J.; Sargent, M.; Zhang, Z.; Roche, S.; Miller, C.C.; Steiner, M.; Hadfield, H.; Omara, M.; et al. Surveying methane point-source super-emissions across oil and gas basins with MethaneSAT. Atmos. Chem. Phys. 2026, 26, 2941–2963. [Google Scholar] [CrossRef]
  67. Lorente, A.; Borsdorff, T.; Butz, A.; Hasekamp, O.; aan de Brugh, J.; Schneider, A.; Wu, L.; Hase, F.; Kivi, R.; Wunch, D.; et al. Methane retrieved from TROPOMI: Improvement of the data product and validation of the first 2 years of measurements. Atmos. Meas. Tech. 2021, 14, 665–684. [Google Scholar] [CrossRef]
  68. Guanter, L.; Irakulis-Loitxate, I.; Gorroño, J.; Sánchez-García, E.; Cusworth, D.H.; Varon, D.J.; Cogliati, S.; Colombo, R. Mapping methane point emissions with the PRISMA spaceborne imaging spectrometer. Remote Sens. Environ. 2021, 265, 112671. [Google Scholar] [CrossRef]
  69. Zhang, X.; Maasakkers, J.D.; Roger, J.; Guanter, L.; Sharma, S.; Lama, S.; Tol, P.; Varon, D.J.; Cusworth, D.H.; Howell, K.; et al. Global Identification of Solid Waste Methane Super Emitters Using Hyperspectral Satellites. Environ. Sci. Technol. 2025, 59, 18134–18145. [Google Scholar] [CrossRef] [PubMed]
  70. Reuter, M.; Hilker, M.; Noël, S.; Di Noia, A.; Weimer, M.; Schneising, O.; Buchwitz, M.; Bovensmann, H.; Burrows, J.P.; Bösch, H.; et al. Retrieving the atmospheric concentrations of carbon dioxide and methane from the European Copernicus CO2M satellite mission using artificial neural networks. Atmos. Meas. Tech. 2025, 18, 241–264. [Google Scholar] [CrossRef]
  71. Durand, Y.; Courrèges-Lacoste, G.B.; Pachot, C.; Pasquet, A.; Chanumolu, A.; Meijer, Y.; Fernandez, V. Status on the development of the Copernicus CO2M mission: Monitoring anthropogenic carbon dioxide from space. In Sensors, Systems, and Next-Generation Satellites XXVII; SPIE: Bellingham, WA, USA, 2023; Volume 12729, pp. 214–229. [Google Scholar] [CrossRef]
  72. Jacob, D.J.; Varon, D.J.; Cusworth, D.H.; Dennison, P.E.; Frankenberg, C.; Gautam, R.; Guanter, L.; Kelley, J.; McKeever, J.; Ott, L.E.; et al. Quantifying methane emissions from the global scale down to point sources using satellite observations of atmospheric methane. Atmos. Chem. Phys. 2022, 22, 9617–9646. [Google Scholar] [CrossRef]
  73. Janssens-Maenhout, G.; Pinty, B.; Dowell, M.; Zunker, H.; Andersson, E.; Balsamo, G.; Bézy, J.-L.; Brunhes, T.; Bösch, H.; Bojkov, B.; et al. Toward an Operational Anthropogenic CO2 Emissions Monitoring and Verification Support Capacity. Bull. Am. Meteorol. Soc. 2020, 101, E1439–E1451. [Google Scholar] [CrossRef]
  74. Xie, Y.; Zhu, Z.; Weng, F.; Li, Z.; Han, X. Simulations of GaoFen-5 Directional Polarimetric Camera (DPC) Observations Using the Advanced Vector Discrete Ordinate Radiative Transfer Model. Adv. Atmos. Sci. 2025, 42, 486–500. [Google Scholar] [CrossRef]
  75. Liang, M.; Zhang, Y.; Chen, L.; Tao, J.; Fan, M.; Yu, C. An Effective Quantification of Methane Point-Source Emissions with the Multi-Level Matched Filter from Hyperspectral Imagery. Remote Sens. 2025, 17, 843. [Google Scholar] [CrossRef]
  76. Růžička, V.; Mateo-Garcia, G.; Gómez-Chova, L.; Vaughan, A.; Guanter, L.; Markham, A. Semantic segmentation of methane plumes with hyperspectral machine learning models. Sci. Rep. 2023, 13, 19998. [Google Scholar] [CrossRef] [PubMed]
  77. Prajesh, P.J.; Ragunath, K.; Neethirajan, S. Satellite remote sensing and artificial intelligence for livestock greenhouse gas benchmarking: Measurement, attribution, and verification challenges. Environ. Sci. Adv. 2026, 5, 941–965. [Google Scholar] [CrossRef]
  78. Jahan, I.; Mehana, M.; Matheou, G.; Viswanathan, H. Deep Learning-Based quantifications of methane emissions with field applications. Int. J. Appl. Earth Obs. Geoinf. 2024, 132, 104018. [Google Scholar] [CrossRef]
  79. Růžička, V.; Markham, A. HyperspectralViTs: General Hyperspectral Models for On-Board Remote Sensing. IEEE J. Sel. Top. Appl. Earth Obs. Remote Sens. 2025, 18, 10241–10253. [Google Scholar] [CrossRef]
  80. Tran, K.D.M.; Nguyen, H.V.; Rawi, A.B.M.; Athinarayanarao, H.; Vo, B.-N. Robust Small Methane Plume Segmentation in Satellite Imagery. In Proceedings of the 2025 14th International Conference on Control, Automation and Information Sciences (ICCAIS); IEEE: Piscataway, NJ, USA, 2025; pp. 134–139. [Google Scholar] [CrossRef]
  81. Hakkarainen, J.; Ialongo, I.; Varon, D.J.; Kuhlmann, G.; Krol, M.C. Linear integrated mass enhancement: A method for estimating hotspot emission rates from space-based plume observations. Remote Sens. Environ. 2025, 319, 114623. [Google Scholar] [CrossRef]
  82. Hasan, M.H.; Zhang, P.; Chen, J.; Shi, G.; Abichou, T.; Yu, H. Exploring uncertainties in the integrated mass enhancement method for remote sensing retrievals of methane emissions. Waste Manag. 2025, 200, 114759. [Google Scholar] [CrossRef] [PubMed]
  83. Jongaramrungruang, S.; Thorpe, A.K.; Matheou, G.; Frankenberg, C. MethaNet—An AI-driven approach to quantifying methane point-source emission from high-resolution 2-D plume imagery. Remote Sens. Environ. 2022, 269, 112809. [Google Scholar] [CrossRef]
  84. Schuit, B.J.; Maasakkers, J.D.; Bijl, P.; Mahapatra, G.; van den Berg, A.-W.; Pandey, S.; Lorente, A.; Borsdorff, T.; Houweling, S.; Varon, D.J.; et al. Automated detection and monitoring of methane super-emitters using satellite data. Atmos. Chem. Phys. 2023, 23, 9071–9098. [Google Scholar] [CrossRef]
  85. Naus, S.; Maasakkers, J.D.; Gautam, R.; Omara, M.; Stikker, R.; Veenstra, A.K.; Nathan, B.; Irakulis-Loitxate, I.; Guanter, L.; Pandey, S.; et al. Assessing the Relative Importance of Satellite-Detected Methane Superemitters in Quantifying Total Emissions for Oil and Gas Production Areas in Algeria. Environ. Sci. Technol. 2023, 57, 19545–19556. [Google Scholar] [CrossRef] [PubMed]
  86. Radman, A.; Mahdianpari, M.; Varon, D.J.; Mohammadimanesh, F. S2MetNet: A novel dataset and deep learning benchmark for methane point source quantification using Sentinel-2 satellite imagery. Remote Sens. Environ. 2023, 295, 113708. [Google Scholar] [CrossRef]
  87. Tiwari, S.; Singh, C.; Singh, J.S. Wetlands: A Major Natural Source Responsible for Methane Emission. In Restoration of Wetland Ecosystem: A Trajectory Towards a Sustainable Environment; Singh, J.S., Singh, C., Eds.; Springer: Singapore, 2019; pp. 59–74. [Google Scholar] [CrossRef]
  88. Saunois, M.; Stavert, A.R.; Poulter, B.; Bousquet, P.; Canadell, J.G.; Jackson, R.B.; Raymond, P.A.; Dlugokencky, E.J.; Houweling, S.; Patra, P.K.; et al. The Global Methane Budget 2000–2017. Earth Syst. Sci. Data 2020, 12, 1561–1623. [Google Scholar] [CrossRef]
  89. Thanwerdas, J.; Saunois, M.; Berchet, A.; Pison, I.; Bousquet, P. Investigation of the renewed methane growth post-2007 with high-resolution 3-D variational inverse modeling and isotopic constraints. Atmos. Chem. Phys. 2024, 24, 2129–2167. [Google Scholar] [CrossRef]
  90. Tripathy, D.B.; Pradhan, S.; Meher, L.C. Monitoring Methane and Mitigation Technologies in different Sectors. Water Air Soil Pollut. 2025, 236, 8627. [Google Scholar] [CrossRef]
  91. Esparza, Á.E.; Rowan, G.; Newhook, A.; Deglint, H.J.; Garrison, B.; Orth-Lashley, B.; Girard, M.; Shaw, W. Analysis of a tiered top-down approach using satellite and aircraft platforms to monitor oil and gas facilities in the Permian basin. Renew. Sustain. Energy Rev. 2023, 178, 113265. [Google Scholar] [CrossRef]
  92. Chen, Z.; Jacob, D.J.; Nesser, H.; Sulprizio, M.P.; Lorente, A.; Varon, D.J.; Lu, X.; Shen, L.; Qu, Z.; Penn, E.; et al. Methane emissions from China: A high-resolution inversion of TROPOMI satellite observations. Atmos. Chem. Phys. 2022, 22, 10809–10826. [Google Scholar] [CrossRef]
  93. Chen, Q.; Cai, D.; Xia, J.; Zeng, M.; Yang, H.; Zhang, R.; He, Y.; Zhang, X.; Chen, Y.; Xu, X.; et al. Remote sensing identification of hydrothermal alteration minerals in the Duobuza porphyry copper mining area in Tibet using WorldView-3 and GF-5 data: The impact of spatial and spectral resolution. Ore Geol. Rev. 2025, 180, 106573. [Google Scholar] [CrossRef]
  94. Singh, C.K.; Kumar, A.; Roy, S.S. Quantitative analysis of the methane gas emissions from municipal solid waste in India. Sci. Rep. 2018, 8, 2913. [Google Scholar] [CrossRef] [PubMed]
  95. Tedeschi, L.O.; Abdalla, A.L.; Álvarez, C.; Anuga, S.W.; Arango, J.; Beauchemin, K.A.; Becquet, P.; Berndt, A.; Burns, R.; De Camillis, C.; et al. Quantification of methane emitted by ruminants: A review of methods. J. Anim. Sci. 2022, 100, skac197. [Google Scholar] [CrossRef] [PubMed]
  96. Feng, S.; Jiang, F.; Zhang, Y.; Chen, H.; Zhuang, H.; Wang, S.; Bai, S.; Wang, H.; Ju, W. High-resolution regional inversion reveals overestimation of anthropogenic methane emissions in China. Atmos. Chem. Phys. 2025, 25, 15121–15143. [Google Scholar] [CrossRef]
  97. Bloom, A.A.; Bowman, K.W.; Lee, M.; Turner, A.J.; Schroeder, R.; Worden, J.R.; Weidner, R.; McDonald, K.C.; Jacob, D.J. A global wetland methane emissions and uncertainty dataset for atmospheric chemical transport models (WetCHARTs version 1.0). Geosci. Model Dev. 2017, 10, 2141–2156. [Google Scholar] [CrossRef]
  98. Bartsch, A.; Gay, B.A.; Schüttemeyer, D.; Malina, E.; Miner, K.; Grosse, G.; Fix, A.; Tamminen, J.; Bösch, H.; Parker, R.J.; et al. Advancing the Arctic Methane Permafrost Challenge (AMPAC) With Future Satellite Missions. IEEE J. Sel. Top. Appl. Earth Obs. Remote Sens. 2025, 18, 6279–6298. [Google Scholar] [CrossRef]
  99. Thanwerdas, J.; Saunois, M.; Berchet, A.; Pison, I.; Vaughn, B.H.; Michel, S.E.; Bousquet, P. Variational inverse modeling within the Community Inversion Framework v1.1 to assimilate δ13C(CH4) and CH4: A case study with model LMDz-SACS. Geosci. Model Dev. 2022, 15, 4831–4851. [Google Scholar] [CrossRef]
  100. Mancoridis, V.; Bue, B.; Lee, J.H.; Thorpe, A.K.; Cusworth, D.; Ayasse, A.; Brodrick, P.G.; Duren, R. Multiplatform Methane Plume Detection via Model and Domain Adaptation. IEEE Trans. Geosci. Remote Sens. 2025, 63, 5526012. [Google Scholar] [CrossRef]
  101. Hemati, M.; Mahdianpari, M.; Nassar, R.; Shiri, H.; Mohammadimanesh, F. Urban methane emission monitoring across North America using TROPOMI data: An analytical inversion approach. Sci. Rep. 2024, 14, 8493. [Google Scholar] [CrossRef] [PubMed]
  102. Olczak, M.; Piebalgs, A.; Balcombe, P. A global review of methane policies reveals that only 13% of emissions are covered with unclear effectiveness. ONE Earth 2023, 6, 519–535. [Google Scholar] [CrossRef]
  103. Höglund-Isaksson, L. Global anthropogenic methane emissions 2005–2030: Technical mitigation potentials and costs. Atmos. Chem. Phys. 2012, 12, 9079–9096. [Google Scholar] [CrossRef]
  104. Van Vuuren, D.P.; den Elzen, M.G.J.; Lucas, P.L.; Eickhout, B.; Strengers, B.J.; van Ruijven, B.; Wonink, S.; van Houdt, R. Stabilizing greenhouse gas concentrations at low levels: An assessment of reduction strategies and costs. Clim. Change 2007, 81, 119–159. [Google Scholar] [CrossRef]
  105. Scarpelli, T.R.; Jacob, D.J.; Grossman, S.; Lu, X.; Qu, Z.; Sulprizio, M.P.; Zhang, Y.; Reuland, F.; Gordon, D.; Worden, J.R. Updated Global Fuel Exploitation Inventory (GFEI) for methane emissions from the oil, gas, and coal sectors: Evaluation with inversions of atmospheric methane observations. Atmos. Chem. Phys. 2022, 22, 3235–3249. [Google Scholar] [CrossRef]
  106. Cusworth, D.H.; Bon, D.M.; Varon, D.J.; Ayasse, A.K.; Asner, G.P.; Heckler, J.; Sherwin, E.D.; Biraud, S.C.; Duren, R.M. Duration of super-emitting oil and gas methane sources. Nat. Commun. 2026, 17, 68804. [Google Scholar] [CrossRef] [PubMed]
  107. Yang, C.; Yeh, S.; Zakerinia, S.; Ramea, K.; McCollum, D. Achieving California’s 80% greenhouse gas reduction target in 2050: Technology, policy and scenario analysis using CA-TIMES energy economic systems model. Energy Policy 2015, 77, 118–130. [Google Scholar] [CrossRef]
  108. Cheadle, L.C.; Tran, T.; Nyarady, J.F.; Lozo, C. Leak detection and repair data from California’s oil and gas methane regulation show decrease in leaks over two years. Environ. Chall. 2022, 8, 100563. [Google Scholar] [CrossRef]
  109. Kaminski, T.; Scholze, M.; Rayner, P.; Voßbeck, M.; Buchwitz, M.; Reuter, M.; Knorr, W.; Chen, H.; Agustí-Panareda, A.; Löscher, A.; et al. Assimilation of atmospheric CO2 observations from space can support national CO2 emission inventories. Environ. Res. Lett. 2022, 17, 014015. [Google Scholar] [CrossRef]
  110. Gao, M.; Xing, Z. Estimating Methane Emissions by Integrating Satellite Regional Emissions Mapping and Point-Source Observations: Case Study in the Permian Basin. Remote Sens. 2025, 17, 3143. [Google Scholar] [CrossRef]
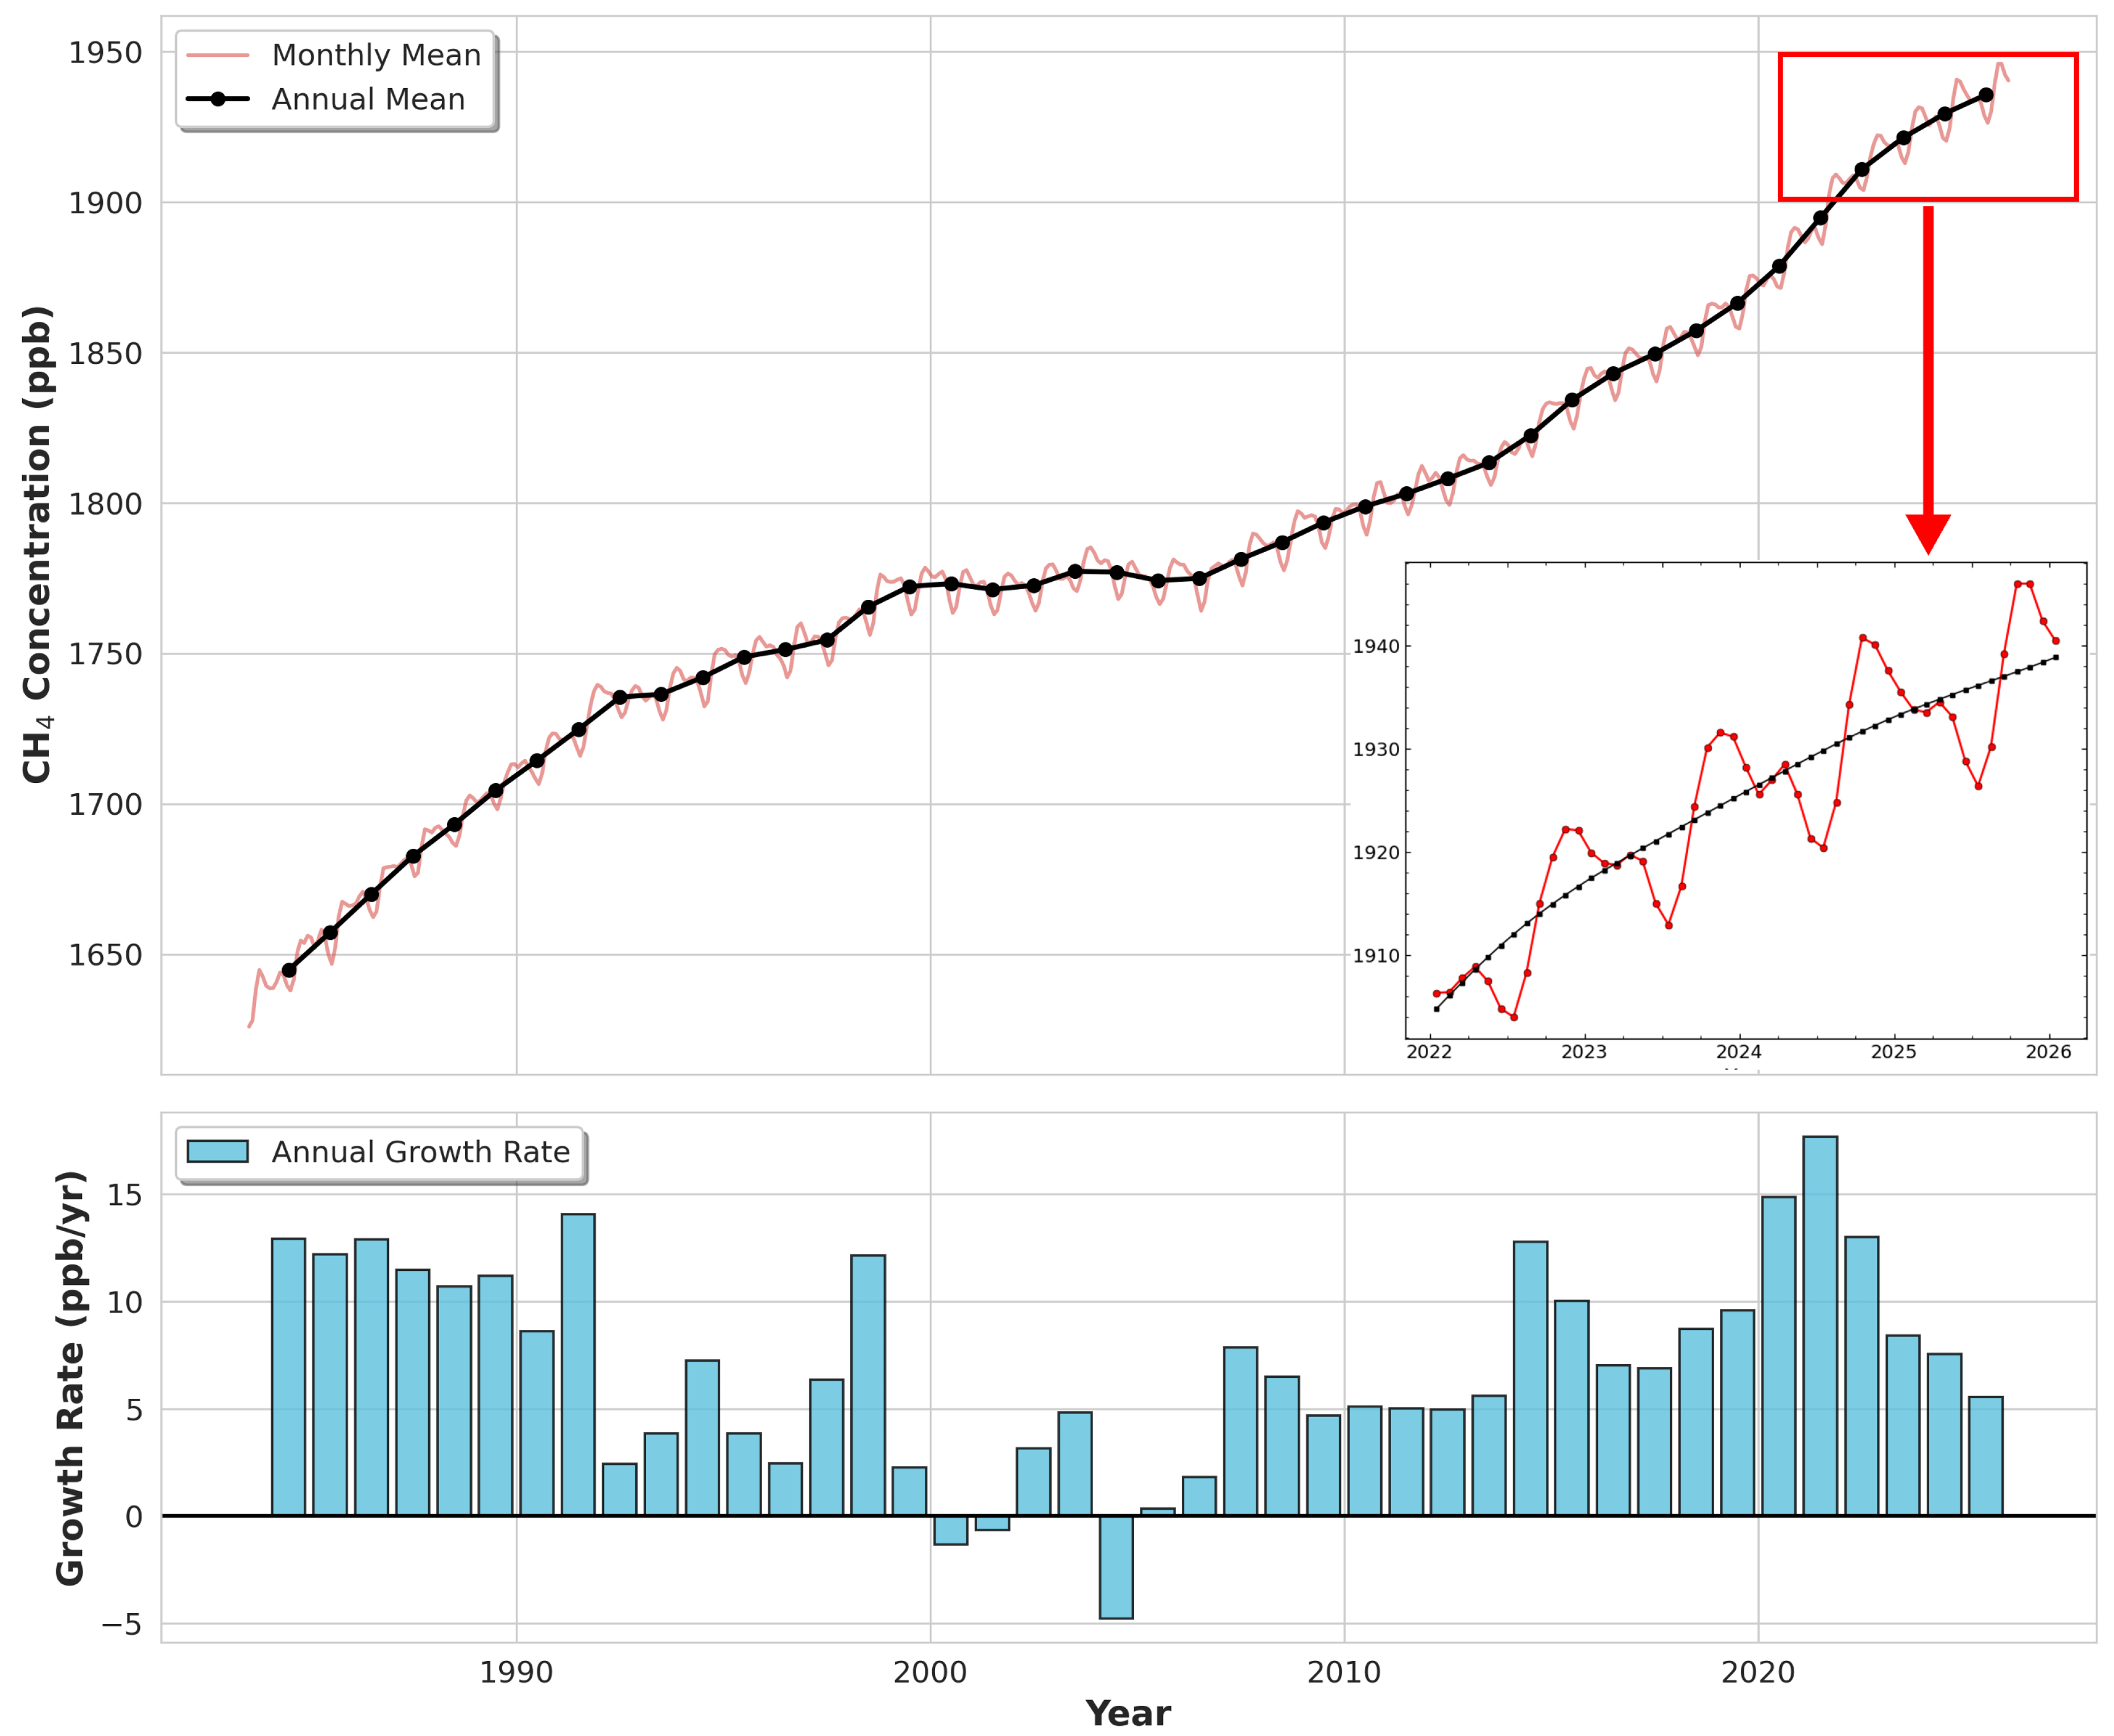
Figure 1. Global atmospheric methane concentration trends derived from NOAA measurements [2].
Methane 05 00021 g001
Figure 2. Chronological comparison of spatial resolution and methane emission detection limits across major current and planned satellite missions.
Methane 05 00021 g002
Figure 3. Performance comparison of deep learning architectures for methane plume detection.
Methane 05 00021 g003
Figure 4. Global methane budget distribution among anthropogenic and natural sources.
Methane 05 00021 g004
Figure 5. Progress of policy frameworks and mitigation impacts under the Global Methane Pledge.
Methane 05 00021 g005
Table 1. Comparison of current and planned satellite missions for methane mapping.
MissionLaunchSpatial ResolutionSwathRevisitDetection LimitTypeValidation Reference
TROPOMI (S5P)2017 5.5 × 7  km a2600 kmDaily 1000  kg/hArea mapper[67]
Sentinel-2 A/B2015/201720 m b290 km2–5 days 2000  kg/hMultispectral[61]
WorldView-320143.7 m13.1 km < 1 day 33  kg/hVHR[58]
GHGSat2016–2024 25 –50 m c12 kmDaily 100  kg/h dPoint source[34]
PRISMA201930 m30 km29 days e 100  kg/hHyperspectral[68]
EnMAP202230 m30 km27 days 100  kg/hHyperspectral[69]
EMIT (ISS)202260 m75 kmVariable 200  kg/hHyperspectral[69]
Tanager-1202430 m19 kmDaily 70 –100 kg/hPoint source[9]
Carbon Mapper2025+30 m19 kmDaily 66  kg/hPoint source[9]
CO2M2027 2 × 2  km250 km3–4 days 100  kg/hArea mapper[70]
a Current SWIR-band resolution (upgraded from 7 × 7 km in August 2019). b Resolution of the SWIR bands used for methane retrieval; other bands range from 10 m to 60 m. c Original demonstrator GHGSat-D: > 50 m; commercial constellation (C1–C11): 25 m. d Under ideal conditions; typical operational threshold is 100 kg/h. e Nominal nadir repeat cycle; off-nadir pointing enables 6 -day revisit.
Table 2. Operational status, uncertainty ranges, and retrieval accuracy for satellite methane missions.
MissionOperational StatusUncertainty RangeRetrieval Accuracy
TROPOMI (S5P)Operational (since Apr. 2018)1–2% (XCH4)Bias < 0.5 %; RMSE 0.7 %
Sentinel-2 A/BOperational (A: 2015; B: 2017)20–30% per retrieval aDetection-based; no column accuracy
WorldView-3Operational (since 2014)10–30% (emission rate) 15 % quantification error
GHGSatOperational (constellation)1–5% (column precision) bBias < 1 %; RMSE 1–5%
PRISMAOperational (since 2019)10–25% (emission rate) 20 % quantification error
EnMAPOperational (since Nov. 2022)10–25% (emission rate) 20 % quantification error
EMIT (ISS)Operational (since Jul. 2022)10–30% (emission rate) 25 % quantification error
Tanager-1Operational (since Jan. 2025)10–20% (emission rate) < 15 % quantification error
Carbon MapperPlanned (2025+)Expected 10–20%Target < 15 %
CO2MPlanned (launch 2027) < 10  ppb (CH4 precision)Target bias < 0.5 %
a Multispectral retrievals are highly scene-dependent (surface albedo, wind speed); uncertainty can exceed 30% under non-ideal conditions. b Precision varies with surface reflectance, terrain, and solar zenith angle.
Disclaimer/Publisher’s Note: The statements, opinions and data contained in all publications are solely those of the individual author(s) and contributor(s) and not of MDPI and/or the editor(s). MDPI and/or the editor(s) disclaim responsibility for any injury to people or property resulting from any ideas, methods, instructions or products referred to in the content.