


Abstract
Biogenic or microbial methane (CH4) emissions, believed to be the main driver of the recent surge in global atmospheric CH4 emissions, have altered monitoring, measurement, and mitigation of fossil-fuel emissions. As of 1981, over 20% of the world’s natural gas reserves were biogenic in origin. Additional biogenic CH4 reserves from coal have been discovered since 1981 mixed (40–80%) with thermogenic CH4. Biogenic CH4 accumulates up to 100% in coal reservoirs in the Powder River Basin (PRB), USA. Biogenic CH4 is generated by microbial breakdown of fossil organic matter as an early-stage (primary) type during burial over geologic time and is rarely preserved. Also, biogenic CH4 is generated as a late-stage (secondary) type from recent geologic to present times and is commonly preserved. Late-stage biogenic CH4 is sustained by nutrients and microbes in meteoric/surface waters discharged into coal aquifers. Groundwater is pumped from wells in coal aquifers to desorb and produce CH4 and dewater coal mines. The co-produced water with dissolved CH4 is discharged into diverse surface aquatic systems. The emission factors (EFs) of co-produced water are 2.0522 × 10⁻⁹ Gg CH4/gal of water in the PRB and 2.0694 × 10⁻³ Gg CH4/well in the Black Warrior Basin, U.S. Accurate data on biogenic CH4 emissions from coal sources is a major gap in the accounting of current global groundwater-driven CH4 whose average flux is estimated to be 3.9 ± 6.2 mmol/m2/day or accounting for up to 70% of CH4 emissions from surface aquatic systems. Biogenic CH4 emissions from coal mining and coalbed gas extractions and related infrastructures are overlooked because the focus has been on coalmine methane (CMM) emissions. CMM data from ground-based measurements is highly variable and used by the Intergovernmental Panel on Climate Change three-tier system to estimate EFs for national inventories. However, 90% of CMM emissions are attributable to a small group of the most coal-consuming-and-producing countries but fails to capture other coal sources worldwide. This created gaps and “blind spots” in “unstructured” low-concentration, diffused biogenic CH4 emission data. These key “blind spots” include sources from flooded, abandoned coal mines; coalbed methane (CBM) co-produced water with dissolved CH4 and infrastructures/facilities; and groundwater drawdown from water withdrawals during coal mining and CBM extraction. Also, a critical “blind spot” is the mixing of biogenic CH4 emissions from subsurface coals with biogenic CH4 generated at the surface from wetlands, agriculture, and landfills/wastes, which grew 85% from 2008 to 2020. Limited understanding of the mixing of biogenic CH4 from diverse sources and their contributions to global methane requires accurate attribution of overlapping isotopic signatures (δ13CCH4 and δD). This paper addresses knowledge gaps in coalbed biogenic CH4 emissions by a systematic review of the literature and specific study cases, which provided insights on key “blind spots” in their mitigation.
1. Introduction
Methane (CH4), a major contributor to global greenhouse gas (GHG) emissions, was elevated to prominence at the 2021 UN Climate Change Conference (COP26) in Glasgow after many decades of being overshadowed by carbon dioxide (CO2) [1]. Although CH4 was recognized in the 1997 Kyoto Protocol as a major GHG under the United Nations Framework Convention on Climate Change (UNFCCC) [2], its short-lived yet potent atmospheric impact was overshadowed by carbon dioxide (CO2). CO2 is less potent but has a longer-term warming effect on climate. The climate policy shift toward CH4 was driven by the European Union and the United States to achieve a 30% reduction in GHG emissions by 2030 and net-zero emissions by 2050, as called for in the 2015 Paris Agreement. About 150 countries committed to the Global Methane Pledge launched at the COP26 to reduce CH4 emissions and submit national CH4-emission inventories to the UNFCCC.
A driver of the shift in the importance of atmospheric CH4 is the record-breaking increase since 2007, presumably due to the onset of natural gas development from shale formation in the United States (U.S.) [3,4,5]. However, CH4 emissions from natural gas have declined from 8% to 2% over the past 3 decades [6]. Instead, the rise in atmospheric CH4 from 2007 to 2014 was attributed to isotopic shifts (δ13CCH4) with increasing emissions of biogenic or microbial CH4 depleted in 13C [7]. Furthermore, this observation was supported by a record-high atmospheric CH4 growth rate during 2020–2022, driven by increased emissions from wetlands, waste, and agriculture [8]. This study [8], focusing on the rapid shift in CH4 carbon isotopes from 2008 to 2022, is complicated, as shown by box modeling that balances the mass of microbial CH4 emissions, adjusted for increased fossil-fuel CH4 emissions, with decreased hydroxyl (OH) radical or oxidation reactions. The model shows incremental increases in microbial CH4 emissions of 14 Tg yr−1 in 2008, concurrent with a 10 Tg yr−1 increase in fossil-fuel CH4 emissions, followed in 2014 by an additional 22 Tg yr−1 in microbial CH4 emissions and a simultaneous 3 Tg yr−1 increase in fossil-fuel CH4 emissions [8]. This observation is succeeded by an increase in microbial CH4 emissions of 32 Tg yr−1 in 2020, with no increase in fossil-fuel CH4 emissions. So about 85% of the atmospheric CH4 growth from 2008 to 2020 was driven by increased microbial CH4 emissions [8].
Biogenic or microbial CH4 is generated by microorganisms through methanogenesis by anaerobic decomposition of organic matter in peats found in most latitudinal wetlands largely (85%) located in the pantropical regions (tropics and subtropics) where annual average CH4 fluxes from 2001 to 2020 are the highest (>200 g m−2 yr−1) (Figure 1) [9,10]. This study [10] indicates the primary mechanism for biogenic CH4 transmission from the wetland peats to the atmosphere is plant-mediated transport (>70%), e.g., through plant internal air spaces (aerenchyma), followed by molecular diffusion (passive movement of gas molecules from high- to low-concentration areas), and ebullition (e.g., gas bubbles from tropical peats). Methane emissions are controlled by seasonality, especially in the temperate and boreal regions while in the tropics, CH4 emissions tend to stabilize (~11 Tg mon−1) [9]. New research on atmospheric CH4 emissions found high methanogenic activity in the boreal-arctic wetlands across North America, Europe, and Asia, giving rise to biogenic CH4 emissions [9,11]. Global warming-induced increases in groundwater temperature, permafrost thawing, and shifting precipitation accelerate microbial conversion of carbon to CH4. These processes trigger a positive feedback loop with increased GHG emissions driving further atmospheric warming and perpetuating the degradation of frozen-stored carbon. That is, continuous microbial breakdown of carbon into CH4 creates self-enforcing cycle such as warming, which leads to more thawing and drives more CH4 generation that causes more warming! Atmospheric CH4 levels increased 2.6 times above pre-Industrial Revolution levels [12].
Figure 1.
Global and zonal wetland CH4 emissions from 2001 to 2020. The pantropical (38° N to 56° S; 117° W to 161° E) peatlands, which comprise 65% of the global wetlands [10], record the highest annual average CH4 flux (>200 g m−2 yr−1) [9]. Adopted from Xiao et al., 2024 [9]. Reuse of this figure from Xiao et al. 2024 [9], an open access article, is permitted under Creative Commons Licence 4.0, https://creativecommons.org/licenses/by-nc-nd/4.0/ (accessed on 27 October 2025).
Biogenic CH4 emissions also arise from human activities (anthropogenic), including agriculture (cultivation of organic-rich soils), cattle digestion (enteric fermentation), waste decomposition in landfills and wastewater treatment plants, biomass burning, and the storage of livestock manure [13,14,15,16]. These dispersed anthropogenic biogenic CH4 emissions are mixed with wetland biogenic CH4, creating uncertainty in the attribution of CH4 fluxes and confounding bottom-up (small-scale, local sites) and top-down (large-scale, regional sites) measurements. Also, biogenic CH4 emissions are highly variable in wetlands because not all accumulate peat in bogs/mires/swamps [17]. About 65% of wetlands are peatlands or peat-forming environments and accumulate peat deposits [1,10,17]. Moreover, wetlands and peatlands are influenced by human activities (e.g., agriculture), and increased emissions from these natural systems are in part anthropogenic [1]. The complexity and variability of wetlands are exemplified along the Amazon River, where floodplain “shallow peats” (swamps) are influenced by water flow and release one-third as much CH4 as the adjoining “deep peats” (bogs/mires) [1,17,18]. The spatial and temporal variability of biogenic CH4 generation in the Amazonian peats reflect the difficulty of mitigating wetland gas emissions.
In 1981, over 20% of the discovered natural gas reserves worldwide were reported as biogenic gas, and 80% as thermogenic or mixed (thermogenic/biogenic) gases [19,20]. Since the 1980s, new biogenic gas reserves in coal and shale beds have been discovered and production has increased worldwide [1]. This newly discovered biogenic gas, often mixed with thermogenic gas, is known as coalbed methane (CBM), coalseam gas (CSG), coalmine methane (CMM), and abandoned mine methane (AMM). Biogenic gas typically consists of 95–99% pure CH4 [21]. So, for all intents and purposes, the biogenic gas component in coal is predominantly biogenic CH4. In contrast to thermogenic gas, biogenic gas contains minor amounts of CO2 and nitrogen, and trace amounts of hydrocarbon gases (e.g., ethane, propane, butane, and pentane), which are low to rare, respectively [22]. Because biogenic gas is often mixed with thermogenic gas, certain coal basins in China (e.g., Ordos Basin) have average proportions of biogenic CH4 ranging from 62% to 74% between coal beds [23]. In another part of the Ordos Basin, the same coal beds contain biogenic CH4 at 48–50% [24]. In contrast, all 10 coal beds in the Powder River Basin, USA, produced as much as 100% biogenic CH4 (CO2 reduction) not mixed with thermogenic gas from >29,000 wells [1,17,25,26,27]. Other studies suggest production in specific shale gas is up to 30% biogenic CH4 [28,29]. The variable occurrence of biogenic CH4 between coal beds and coal basins exemplifies the complexity of technically mitigating biogenic CH4 emissions worldwide.
About 90% of global CMM emissions are attributable to 7 major coal producing and consuming countries [Figure 2] [30]. China accounts for about 50% of the total global CMM emissions. Active underground coal mine operations are major sources of CMM, accounting for 70% of global emissions, while surface mines account for the remainder [31]. These estimates of global CMM emissions do not include AMM emissions from abandoned coal mines. Traditionally, the primary mitigation technologies for CH4 emissions have been the capture of CMM by pre-drainage boreholes and ventilation air methane (VAM) systems [32,33]. These technologies are effective because they target 60–70% of underground coal mine emissions [30,31]. The technology includes boreholes directionally drilled within coal beds (in-seam) to pre-drain high-concentration CMM prior to mining, which is then captured, collected, and used for coal mine electricity generation, heating, ventilation, coal drying, and fueling boilers [33]. The VAM technology creates a dilute mixture of CH4 (<1%) and air, which is exhausted from underground coal mines. The VAM is mitigated by thermal oxidizers, which burn the low-concentration CH4 into carbon dioxide and water vapor, reducing its warming impact by >95% [31]. This study [31] suggests VAM is the single most important mitigation measure, which would reduce CMM by 30% on a global level. Satellite trackers such as GHGSat have uncovered small (>100 kg/hr) CH4 emissions while Sentinel-5P detect larger (5 t/hr) CH4 emissions from coal mines [31]. But these CH4 emissions originate from active coal-mine point sources compared to lower-concentration and diffused CH4 emissions from abandoned coal mines.
Figure 2.
Frequency diagram of the top seven countries that emitted coalmine methane (CMM). China, as the world’s largest coal producer and consumer, is the largest CH4 emitter, driven by coal consumption. Adopted from IEA, 2022 [30]. Reuse of this figure from IEA [30] is permitted under Creative Commons Licence CC BY 4.0, https://www.iea.org/terms/creative-commons-cc-licenses (accessed on 27 October 2025).
Globally, the International Energy Agency [31] estimates that the abatement potential of CMM emissions from steam coal (subbituminous/bituminous rank) and lignite (low rank) is about 50%, while that of coking coal (high rank) is about 60%. Abatement potentials for CMM emissions vary with mining methods, with about 70% in underground mines and 20% in surface mines. Abatement potentials of CMM emissions also vary between countries, exemplified by China producing mainly high rank coals (anthracite, bituminous) in underground mines while Indonesia producing mainly low rank coals (subbituminous) in surface mines [31]. These coal variables reveal different abatement strategies for CMM emissions in China and Indonesia. China’s underground coal mine abatement strategy for CH4 emissions is the traditional technical capture of CMM utilizing pre-drainage boreholes and VAM. In Indonesia, the abatement strategy for CMM emissions from surface coal mines is direct release into the atmosphere, as the emissions are diffuse and at low concentrations, making capture technically challenging. Here, economic barriers, lack of regulation, and low CH4 concentrations relative to those in underground coal mines make mitigation expensive and unfeasible, unlike high-concentration pre-drainage boreholes in China [31].
The discovery of biogenic CH4 in coal beds mined in China and Indonesia from 2007–2014 [34,35,36,37,38] has complicated mitigation of CH4 emissions because these countries are among the small group of major CMM-emitting countries (Figure 2). In Indonesia, extraction of subbituminous coals from surface mines adjacent to wetlands (e.g., Kalimantan, Borneo) allows the mixing of anthropogenic and natural biogenic CH4 [1,17]. Here, [31] it is estimated that about 25% of the Indonesian surface-mine CMM could be mitigated using pre-mine drainage borehole technology drilled from the surface. This mitigation technology has been used for decades in Australia, Canada, Russia, and the United States, where biogenic CH4 in mineable coal beds was discovered about 4 decades ago [1,17]. Most of these coal-producing countries account for about 85% of the total global CMM emissions (see Figure 1). As in Indonesia, many surface coal mines in these countries are on farmlands and ranchlands, resulting in similar mixing of anthropogenic biogenic CH4 from diverse surficial sources, which is a “blind spot” in biogenic CH4 emissions accounting.
The finding of biogenic CH4 in coal beds worldwide presented a complex mix of economic opportunities, environmental risks, and mitigation challenges, but it also revealed a major “blind spot” in emissions mitigation. One critical “blind spot” is the discovery of biogenic CH4 in flooded, abandoned coal mines in the Ruhr Basin [39,40]. The presence of living methanogens in the coal-mine water and recent generation of biogenic CH4 based on isotopic composition analysis indicate the coals are active “bioreactors” in the Ruhr flooded, abandoned coal mines. For four decades, technology for pre-draining and capturing CMM in underground coal mines has been used to extract CBM/CSG biogenic CH4 from deep unmineable coal beds beyond the coal mines within the same coal basin [1,17]. This intrabasin coal and gas development is made possible by the dual-function (dual-role) coal beds, where CBM/CSG and solid fuel are extracted simultaneously in coal basins worldwide [1,17]. The regional stratigraphic connectivity of dual-role coal beds has enlarged and complicated the abatement potential for biogenic CH4 emissions basinwide. These regionalized CH4 emissions have transformed traditional local point-source emissions into unintended “unstructured,” widespread, fugitive CH4 emissions. That is, localized diffuse CH4 emissions from gas wells, pipelines, and co-produced water discharged points in the basin center, and coal mine pits and facilities in the basin margin, create a highly ineffective abatement strategy. Also, simultaneous basinwide development of CMM and CBM/CSG initiate environmental risks by the encroachment of coal operations into areas with other sources (e.g., ranchlands, agricultural lands, landfills, wetlands) of biogenic CH4. This permits the mixing and overlap of biogenic CH4 emissions from shallow to deep coal sources with surficial, natural, and anthropogenic sources, complicating scientific, technical, and economic abatement strategies.
This study systematically reviews and synthesizes the current literature and research to identify knowledge gaps regarding shallow- and deep-sourced coalbed biogenic CH4 emissions relative to surficial-sourced biogenic CH4 emissions from wetlands, agriculture, and landfills. Also, the study provides synthesis and insights on key “blind spots” in biogenic CH4 emissions from groundwater CH4 co-produced during heavy dewatering of coal aquifers by coal mining and coalbed gas extractions. Thus, this paper explores the role of groundwater drawdown in terms of long-lasting CH4 fluxes after extraction ceases. Moreover, this article provides feedback on legacy biogenic CH4 emissions from flooded abandoned coal mines that are omitted from national inventory estimates. Finally, the impacts of “unstructured” coalbed biogenic CH4 emissions on mitigation is assessed by understanding sources, measurements, uncertainties, and generations in ensuing sections.
2. Understanding Sources, Measurements, and Uncertainties of Biogenic CH4 Emissions
Understanding the differences between atmospheric biogenic CH4 emissions from natural (wetlands) and anthropogenic (agriculture, waste, biomass) sources, and from mainly coal and natural gas (Energy) sources is crucial for obtaining accurate ground-based measurements for estimations of national inventories (Figure 3) [30]. Knowledge of the similarities and differences among these diverse sources of biogenic CH4 can inform more effective mitigation strategies. This often results in mixing of biogenic CH4 sourced from human activities, natural processes, coal, and natural gas.
Figure 3.
Sources of atmospheric methane emissions from natural, anthropogenic, and energy sectors. Anthropogenic (caused or produced by humans) includes agriculture, waste, and biomass burning. Adopted from IEA, 2022 [30]. Reuse of this figure from IEA [30], an open access article, is permitted under Creative Commons Licence CC BY 4.0, https://www.iea.org/terms/creative-commons-cc-licenses (accessed on 27 October 2025).
Biogenic CH4 is unique as a sustainable, low-temperature energy source produced by the microbial decomposition of organic matter in oxygen-deprived environments (e.g., wetlands, landfills, digestive systems). Its diverse sources stem from its varied origins (acetoclastic vs. hydrogenotrophic metabolic pathways of methanogenesis), diverse environments (freshwater/brackish wetlands, landfills, farmlands, digestive system, marine sediments), and distinct formation types (early-stage or late-stage generation) [1,17,20,22,23,24,25]. Acetoclastic (fermentation) methanogenesis involves the breakdown of acetate (CH3COOH) into CH4 and carbon dioxide (CO2) by methanogens. Hydrogenotrophic (CO2 reduction) methanogenesis reduces CO2 using hydrogen (H2) to generate CH4. The biogenic methanogenesis fractionation is shown in Table 1 [1,20,22,23,25,26,34,35,36,37,38,39,40,41,42,43,44]. Biogenic CH4 originated in low-temperature (from <50 °C to 100 °C) environments, while thermogenic CH4, commonly formed in coal and oil/gas, is generated under high pressure and temperature (from >157 °C to 221 °C) [42,43]. Biogenic and thermogenic CH4 in coal are distinguished by their stable carbon (δ13C) and hydrogen (δD or δ2H) compositions. Biogenic CH4 is characterized by very light δ13C values and typically ranges from −90‰ to −55‰. Hydrogen isotopes are typically between −400‰ and −150‰. In contrast, thermogenic CH4 is characterized by heavier δ13C values and typically ranges from −55‰ to −35‰. Hydrogen isotopes are typically >−200‰ [42,43].
Table 1.
Methanogenesis fractionation of biogenic methane (CH4) according to metabolic pathways, substrates, common microbes, key environments, intermediates, and depths observed in coal worldwide. Depths * of occurrence of biogenic coalbed gas are generally reported to occur from >100 to >1000 m. Acetoclastic and hydrogenotrophic methanogenesis generally occur in shallow and deep coal beds controlled by geology and hydrology, but it varies between coal basins worldwide. For example, in the Powder River Basin, USA, hydrogenotrophic (CO2 reduction) occurs in stratigraphically correlated Wyodak-Anderson coal zone from 59 to 488 m (from basin margin to center). H, hydrogen; C, carbon; CO2, carbon dioxide; pH, acidity. Compiled from Flores and Moore [1]; Rice and Claypool [20]; Rice [22]; Bao et al. [23]; Flores et al. [25], Rice et al. [26]; Tao et al. [34]; Tang et al. [35]; Guo et al. [36]; Susilawati et al. [37]; Guo et al. [38]; Beckmann et al. [40]; Wormald et al. [41]; Gründger et al. [42]; Bao et al. [43]; Cheung et al. [44].
Uncertainty arises from misattribution of the sources of biogenic CH4 due to the dynamic interchange of CH4 fluxes between various sources. Natural processes in wetlands are the largest natural source, accounting for 35% of atmospheric CH4 emissions [13]. This recent study indicates that 65% of top-down estimates of 2020 CH4 emissions are attributable to human activities (anthropogenic). The largest anthropogenic sources of CH4 emissions are agriculture, fossil fuels, and landfill decomposition. Bioaugmentation and bio- stimulation of coal to re-generate CH4 for renewable energy and accompanying emissions, can be classified as anthropogenic in origin [1,17]. Human-induced microbial methanogenesis in depleted coal reservoirs by injecting co-produced water, microbes, and nutrients or amendments to stimulate and accelerate metabolic activities in the subsurface ecosystem is an emerging and innovative technology. Supercharging microbial activity in coal reservoirs has been successful in bench- and field-scale applications regenerating new CBM/CGS for economic and sustainable energy extraction [1,17].
Thus, understanding the sources of biogenic CH4 emissions is essential as they are a major driver of recent increases in atmospheric CH4, especially following the discovery of new biogenic gas reserves in coal and shale. Accurately identifying and measuring these sources, especially from all types of coal operations, is critical for effective mitigation targets.
2.1. Understanding Sources of Biogenic CH4 Emissions
Understanding CH4 sources is crucial because it helps identify who (humans/nature) and what (energy, agriculture, peatlands/wetlands, landfills) is emitting this potent GHG (see Figure 3). Also, knowledge enables targeted emission reduction strategies, monitoring of climate impacts (such as ozone formation), and assessment of mitigation potential, especially because CH4 is potent but short-lived. This means that possible mitigation/reduction measures offer quick benefits in reducing climate warming. Also, pinpointing sources (e.g., super-emitters or super-leaks in fossil-fuel operations versus seasonal wetland releases) enables effective deployment of technology and addresses both climate change policies and local air quality. The biogenic CH4 from both sources is critical for attributing atmospheric emissions because the energy-rich gas is derived from fossilized organic matter with isotopic signatures distinct from those of recent wetland organic matter. Key reasons for understanding sources include targeted mitigation, policy and accountability, climate-modeling accuracy, detection of super-emitters, air quality and health, understanding natural cycles, and rapid reductions in warming.
Different sources require different solutions, such as identifying whether it’s cows, landfills, oil/gas, or coal mine leaks, to direct mitigation efforts (e.g., capturing/using gas from landfills or coal mines, reducing fossil-fuel flaring). Differentiating between human-caused (anthropogenic) and natural sources is essential for setting realistic climate goals and policies. Also, this increases the accuracy of national inventories for reporting to the UNFCCC. Accurate source data improves climate models that predict future warming trajectories, and assessing methane’s role as the second-most important GHG after CO2. Identifying sudden, large CH4 releases (super-emitters) from oil/gas fields, coal mines, or landfills allows for rapid intervention and mitigation. Methane contributes to ground-level ozone, so understanding its sources helps protect public health and reduce pollution [45]. Identifying natural sources (e.g., peatlands, wetlands, termites), helps distinguish them from human-caused increases, and helps clarify climate feedback loops, such as warming peatlands/wetlands releasing more CH4 emissions. Because CH4 has a short atmospheric life (around 12 years) [45], reducing its emissions yields faster climate benefits than reducing long-lived gases like CO2, making source identification critical for near-term warming control.
Methane from fossil fuel operations (e.g., oil/gas wells, processing plants, pipeline infrastructure, coal mining) accounts for about 40% of human-caused CH4 emissions [30]. Coal mining operations account for approximately 38% of CH4 emissions worldwide compared with 33% for natural gas and 29% for oil operations. For coal mining operations, mitigation is more challenging than in oil and gas due to lower concentrations and the dispersed, varied nature of facilities (e.g., coal mine highwalls, conveyor belts or transportation trucks, silos, coal trains, preparation/processing plants, etc.) from which CH4 emissions originate. Abandoned coal mines include underground shaft mines, drift mines, and surface mines, as well as quarries, and associated silting or tailing ponds where CH4 is emitted at variable concentrations. Surface coal mine spoil piles serve as reservoirs of microbial communities to degrade lignin in coal fragments in the spoils [46,47,48]. These mining waste acting as “bioreactors” [39,40,49,50] support microbial communities that produce CH4, or the methanogenesis process that emits high biogenic CH4 concentrations. Methane concentrations range from 33 to 95 vol% with higher concentrations at coal mines closed decades ago [48]. Coal mine silting ponds or tailings/settling ponds are crucial containment areas where water mixed with fine coal waste (tailings) and wastewater are held, allowing with metals and minerals to settle out. Minerals such as pyrite (FeS2), gypsum (CaSO4·2H2O), siderite (FeCO3), apatite (Ca5(PO4)3F) etc., contain elements that can support and nourish microbial metabolic activity. The tailings ponds or mine sludge also serve as “bioreactors” [50,51,52,53,54] in which the vast majority of coaly material and metals/minerals are submerged, creating an anoxic environment necessary for anaerobic microorganisms, including methanogens, to thrive and generate biogenic CH4 that is emitted [50,54]. So, flooded abandoned mines and tailings ponds as “bioreactors” can serve as long-term CH4 emitters, potentially acting as super-emitters for a considerable time, especially if not properly managed or mitigated. The metabolic pathway that dominates in an abandoned mine or coal tailing pond is heavily influenced by substrate availability, pH and alkalinity, syntrophic acetate oxidation, and microbial community structure (see Table 1). Metabolic pathways of flooded abandoned coal mines, exemplified in the Ruhr Basin, include both acetoclastic (fermentation) and hydrogenotrophic (CO2 reduction) methanogenesis [39,40].
Other potential CH4 super-emitters, often ignored as a “blind spot”, include abandoned CBM wells and associated co-produced water impoundments and aquatic environments. Unlike working conventional natural gas wells, abandoned coalbed gas wells are closely spaced (8 wells/mi2 or 2.589 km2) and have a 10–15-year lifespan [17]. These abandoned CBM wells can continue to leak biogenic CH4 for decades, or even for “eternity,” if not properly plugged. For example, ten abandoned or orphaned shut-in coalbed gas wells in the Powder River Basin emitted biogenic gas ranging from 1.6 to 4530 mg CH4/hr (mean emissions), with an average of 653 mg CH4/hr as of 12–16 December 2020 [55]. This study [55] disregarded these coalbed gas wells as potential real-time “bioreactors” that produced biogenic gas for 17 years from the most productive Big George coal aquifer in the basin [25]. This article [55] interprets that conditions in these abandoned wells are such that continued groundwater flow in the wellbores connected to meteoric/surface-water recharge stopped gas desorption and emission. This recharge process introduces timing (temporal) and distance (spatial) uncertainties of biogenic CH emissions. Also, groundwater recharge replenishes nutrients and microbial communities, thereby facilitating methanogenesis and the generation of new CH4 that is released into the atmosphere [17]. This cyclical generation and emission of new biogenic CH4 in abandoned CBM wells could take place for decades. The existence of these potentially long-lasting, high-CH4-emitting abandoned coalbed gas wells, along with related co-produced groundwater impoundments and aquatic environments underscores the importance of properly mitigating their significant GHG impacts. No proper methods are currently being used to mitigate this co-produced groundwater containing dissolved CH4.
2.2. Measurement and Tracking Approaches of Methane Emissions
Approaches for measuring CH4 emissions include various spatial scales, both local sources (small-scale, bottom-up) and atmospheric platforms (large-scale, top-down) [56]. Combining the strengths of both approaches presumably yields accurate and reliable national emission inventories that inform effective mitigation strategies. The top-down approach applies inverse modeling methods to infer atmospheric CH4 emissions using prior data from the bottom-up approach, providing improved national inventories [57]. Foremost are satellite observations like Greenhouse Gases Observing Satellite (GOSAT), Tropospheric Monitoring Instrument (TROPOMI), and PRecursore IperSpettrale della Missione Applicativa (PRISMA) that detect and quantify CH4 emissions from local sources, particularly from use of coal, oil, and natural gas [57,58,59]. The International Energy Agency (IEA) Global Methane Tracker (GMT) uses the latest satellite data and aircraft observations to track CH4 emissions, focusing on fossil fuels, bioenergy, and non-energy sectors [60]. The GMT raises awareness of mitigation models and informs policymakers of CH4-emission reduction, particularly from fossil fuels and coals’ biogenic CH4.
The most critical measurement by satellite sensors is distinguishing diffused emissions of biogenic CH4 from coal, oil/gas, wetland, landfill and farmland sources. Modern satellite sensors can distinguish biogenic CH4 emissions (e.g., landfills and wetlands) from thermogenic CH4 sources (e.g., coal mines, oil/gas facilities) by using high-resolution, pixel-level mapping to identify “super-emitters” [61,62,63]. Satellite sensors (e.g., TROPOMI, GHGSat, NASA EMIT) can distinguish biogenic CH4 emissions (e.g., wetlands vs. livestock) from anthropogenic sources (e.g., coal mine, oil/gas, and groundwater CH4 surface aquatic systems). Analysis of unique spectral fingerprints in the shortwave infrared range allows the instruments to identify specific absorption patterns of CH4 in reflected sunlight [62]. Using advanced imaging spectrometers, satellites identify specific emission signatures, allowing them to differentiate compounds, map hotspots, and estimate emission rates, as seen with GHGSat’s and PRISMA’s high-resolution technology [59,63]. However, current satellite sensors cannot directly measure the isotopic signatures (e.g., δ13C) of methane to distinguish between sources. But sensors can separate biogenic CH4 from wetland and coal emissions by combining high-resolution spatial mapping, regional atmospheric modeling, and known spatial-temporal locations of these sources [64,65].
Airborne measurements and visualization of CH4 emissions come from aircraft equipped with specialized sensors (e.g., lidar, spectrometers) that fly through discrete plumes from diverse sources [66]. Quantification employs methods such as the mass-balance approach to estimate CH4 releases from sources including oil/gas fields, landfills, and wetlands. This approach provides higher-resolution data, often revealing much higher emissions and offering more precise measurements than reported inventories. The mass-balance method measures the difference in CH4 concentration upwind and downwind of a source area (e.g., surface coal mine) to calculate total emissions, often using Gaussian dispersion models. Planes carry sophisticated instruments, including thermal infrared (TIR) imagers, spectrometers (AVIRIS), and lidar systems (like Bridger Photonics), to detect and map CH4 plumes. Aircraft fly repeated patterns, often in a grid or around a source, measuring CH4 concentrations and wind speed/direction to calculate the rate of emission (flux) [56,66]. The challenge for an airborne platform is that its reliability depends on calm wind conditions, as convective conditions can lift plumes out of the measurement layer, potentially causing an underestimation of emissions [56,66].
The GMT provides country-level historical data and inventories of CH4 emissions from fossil-fuel facilities, which account for about one-third of the global CH4 emissions [60]. However, most national inventories of CH4 emissions are underreported to the UNFCCC relative to satellite observations, which are about 80% higher than the totals reported by countries (Figure 4) [66]. For example, studies reveal inconsistent trends of significant gaps and uncertainties between bottom-up and top-down estimates of CH4 emissions from the oil and gas sectors in the U.S. [67,68,69]. These studies show that bottom-up estimates of CH4 emissions from oil and gas basins are significantly lower than top-down estimates in the Permian Basin, Texas. Satellite estimates from May 2018 to March 2019 recorded the largest CH4 emissions in the U.S., twice as high as bottom-up estimates in the basin [69,70,71]. The discrepancy is probably from intentional massive venting and flaring point sources due to inadequate gas processing and transportation infrastructures.
Figure 4.
Energy-related methane emissions reported to the UN Framework Convention on Climate Change (UNFCCC) and IEA estimates, 2025. IEA estimates of measured methane emissions tend to be higher than the reported emissions that countries report to the UNFCCC. The estimate of global energy-related methane emissions is 80% higher than the total reported by countries to the UNFCCC. Adopted from IEA, 2025 [66]. Reuse of this figure from IEA [66], an open access article, is permitted under Creative Commons Licence CC BY 4.0, https://www.iea.org/terms/creative-commons-cc-licenses. (accessed on 27 October 2025).
The quantification algorithms applied to bottom-up estimates of CH4 emissions require input from a solitary point source of CH4 plumes [72]. Overlapping CH4 plumes from multiple point sources worsen quantification errors when plumes are not separated or isolated. Separation splits and isolates overlapping CH4 plumes into single-source points, enabling the application of high-precision quantification models to achieve fine spatial resolution in plume images [72].
This bottom-up approach is exemplified by monitoring (2020 and 2023) coal mine ventilation shaft point sources for CMM emissions using top-down PRISMA hyperspectral satellite data for quantification (Figure 5) [59]. The study shows that top-down estimates of mean CH4 fluxes are generally lower than bottom-up estimates, which is attributed to difficulties in quantification due to dense vegetation and the area’s terrain. Despite discrepancies in mean emissions, robust statistical measures (e.g., the interquartile range) that are less affected by outliers are useful for interpreting data variability, spread, and skewed distributions [59]. However, the lack of isotopic signatures in CH4 emissions from the studied mine, although presumed to be thermogenic, introduces uncertainty about the local source of the bottom-up data. Bottom-up data collection may be required to create national inventories of gas origin in coal mines, especially in regions where coal is reported to host biogenic gas.
Figure 5.
Diagram showing PRISMA satellite top-down (TD) data and site measurements of methane emissions from two ventilation air methane (shaft) sources at an underground longwall coal mine in Virginia, USA. RTO = regenerative thermal oxidizer. Adopted from Karacan et al., 2025 [59]. Reuse of this figure from Karacan et al. [59], an open access article, is permitted under Creative Commons Licence CC BY 4.0, http://creativecommons.org/licenses/by/4.0 (accessed on 27 October 2025).
To create CH4 emissions inventories at national, regional, and local levels, an estimation method was developed to provide a numerical basis for setting and tracking emission mitigation goals. The value that represents the quantity of a CH4 emissions released to the atmosphere by a specific activity from a source (e.g., coal mine) is expressed as an emission factor [73]. The emission factor is typically expressed as the weight of the CH4 emissions per unit weight, volume, distance, or duration of the activity. This formula provides a standardized way to quantify and estimate emissions from various activities or sources. Source-specific testing to confirm the accuracy of emissions data and periodic retesting are required to confirm the emission factor [73]. Emission factors are used as a basis for developing reduction and control programs, appropriate mitigation strategies, and national or global emission reports submitted to the UNFCCC. They are also used for accounting, managing, understanding the impact, and meeting regulatory requirements related to CH4 emissions. Most of all, the standardized approach enables governments and global organizations to set emissions limits and mitigation targets.
The IPCC tier system is a hierarchy of methodological complexity, where the lower tier generally yield higher uncertainty due to reliance on default data, while higher tiers aim to reduce uncertainty through country-specific measurements and detailed local site or ground-based data. The source uncertainties in the higher tiers, driven by the complexity of coal geology and properties, are explained in the following section.
2.3. Sources of Uncertainties and Tier Systems of Emission Factors
Sources of uncertainty in CH4 emissions include the wide variability of their sources, limited knowledge of their origin, analytical and measurement limitations, and technical differences in collecting bottom-up data among countries. More specifically, significant differences in CH4 emission factors for a given source, such as a coal mine and/or coalbed methane well in a coal basin, coalfield, or coal beds, lead to large discrepancies and uncertainties among reporting countries. For example, CMM emissions from underground or surface coal mines are estimated using bottom-up approaches that rely on measurements from safety sensors or control devices. But these measurements involve calculating CH4 emissions using emission factors derived from parameters, such as the gas content of the coal beds, coal bed depths, and coal production volumes in coal mines [74]. However, the gas content of coal is controlled by other properties and variables (e.g., porosity/permeability, maceral composition, moisture, ash content, rank) to determine CMM emissions. For instance, the gas content of high-rank coals (e.g., anthracite) is usually higher than that of low-rank coals (e.g., lignite) (Table 2).
Table 2.
Coal properties, variables, and uncertainty drivers. The uncertainties are significantly affected by the limited data on the coal properties, geology and hydraulic parameters. These uncertainties require robust modeling techniques simulation to quantify risk, estimate methane emissions, and optimize mitigation strategies. CH4, methane; m, meter; mD, millidarcy. Compiled from Flores [17]; Flores and Moore [1].
The interrelationships of the coal properties and variables driving uncertainty levels are exemplified by burial depths of coal beds, which control the formation of coal porosity (pores/voids and cleats/fractures) and coal permeability (connectivity of pores and cleats/fractures) developed in coal matrix/macerals (organic matter) [1,17]. CH4 molecules are adsorbed on the surface of coal pores/fractures and mainly held by physical adsorption (Van der Waals forces), which determines the gas content and volume of the coal. In many coal aquifers where biogenic CH4 accumulates, the gas is adsorbed (physical adsorption), and the hydrostatic pressure of the formation water (groundwater) holds the gas in place within the coal pores and cleats/fractures. Also, coal pores are semi-closed, which, along with low permeability or pore connectivity, creates a high-porosity/low-permeability systems that traps biogenic CH4, often hindering its desorption or release. Thus, poor coal pore connectivity makes it difficult for the gas to desorb, migrate, or diffuse, prolonging gas residence in the coal reservoir and mitigation. Addressing unmitigated emissions from the residual CH4 in coal reservoirs requires the application of enhanced coalbed methane (ECBM) recovery technique using CO2 injection into the coal to displace/replace the CH4 molecules for sequestration) [1,17]. The success or failure of ECBM sequestration depends not only depends on coal porosity/permeability but also relies on coal shrink/swell properties. Coal shrinkage and swelling are critical sorption-induced phenomena in which the coal matrix changes volume as it adsorbs (takes in) or desorbs (releases) CH4 and CO2 molecules) [1,17]. Moisture content of wet coals is less influenced by swelling than dry coals, making them more suitable for CO2 sequestration. Thus, these specific coal properties and variables must be accurately analyzed and included in the database at the coal mine sites for national inventories and reporting CH4 emissions. The uncertainty levels of CMM emissions mainly from underground and surface mines must be determined from the coal bed properties and mitigation practices.
Ground-based data collection often overlooks the highly localized nuances between coal properties (coal rank, gas content, and bed thickness) and their specific extraction sites (mines or basins) [74]. This knowledge gap, which results in use of generic or default values, is exemplified in the Ordos Basin (OB) in China and Bowen Basin (BB), Australia. The bituminous and anthracite coals in OB/BB contain more gas (6–20 m3/t; 3–16 m3/t, respectively) than the subbituminous coals (ave. 1–2 m3/t) in the Powder River Basin (PRB) in the U.S. [1,17]. But the thicker (<68 m) coal beds at 50–600 m deep in the PRB compensate for the gas content of the higher rank coal beds in OB (1–20 m thick; 100–>2000 deep) and BB (<45 m; 100–900 m deep) [1,17]. The level and influence of uncertainty (Table 2) are judge by coal depth in which porosity/permeability is reduced at >1000 m and gas content is unpredictable. Coal gas content could be reduced at 700–800 m deep. These ground-based data should serve to calibrate the IPCC tier-system framework.
Existing IPCC guidelines on CH4 emissions accounting methods include three-tiered systems for estimating and reporting GHG emissions [75]. Each tier, from Tier 1 to Tier 3, requires progressively more data and produces more accurate results [73,74,75]. Countries choose the most appropriate reporting levels for emission factors, categorized into low, medium, and high ranges of uncertainty, to estimate, for example, CMM emissions for a given coal region, basin, or mine [75]. The highest uncertainty is given to the Tier 1 emission factor, which provides a rough estimate and is less accurate due to limited data availability. Reported uncertainty is reduced to medium in Tier 2, which is more accurate and supported by more data than Tier 1 and is designed for country-specific refinement to better reflect national, regional, coal basin, or coal mine conditions. The lowest level of uncertainty is Tier 3 assessment, which uses the most accurate and precise estimates from measured data, such as from specific coal mines for national inventories and reporting. The progression from Tier 1 to Tier 3 reflects decreasing uncertainty in CH4 emissions estimates, with greater data granularity and increased precision of the CH4 emissions factor for a given source type (e.g., surface, underground, or abandoned mine). Data accuracy is important because it determines the absolute CH4 emissions for coal mine, coalfield, coal basin, and country region considered. The variability of uncertainty, especially at the Tier 3 level, creates inconsistencies between economically developed and underdeveloped countries. Moreover, this difference is exacerbated between technologically developed and less developed countries.
The top-down approach uses atmospheric CH4 concentration data at scales ranging from local to broad geographic areas to assess total emissions from aggregated multiple sources [56]. A bottom-up approach to CH4 emissions from point sources (local areas) extrapolates findings to a larger scale or broader (conterminous) area. For example, measuring the ratio of stable carbon isotopes in atmospheric CH4 enables models to estimate the proportions of thermogenic gas emissions from fossil fuel sources and biogenic CH4 emissions from wetlands, agriculture, and waste/landfill sources. But the discovery of large biogenic CH4 or natural gas reserves, including coalbed gas and CMM, requires better isotopic coverage to conduct bottom-up estimates. Microbial-driven CH4 emissions from coal exhibit spatiotemporal variability due to the interplay of geological, tectonic, hydrological, and groundwater factors, as well as microbiological factors [1,17]. That is, CH4 is generated in coal beds by anaerobic microorganisms, and the rate and amount of gas release change over time, differ from one location to another, and vary with depth and coal characteristics. Also, the mining of coal beds at various depths and the development of coalbed gas, which require the massive withdrawal of groundwater containing CH4 from coal aquifers, present local and regional uncertainties of CH4 emissions due to seasonal and climatic conditions [1,17]. These observations require specialized and sophisticated analytical methods, the availability of which varies between countries; thus, creating relative uncertainty in reporting systems.
Understanding the sources, measurements, and uncertainties of biogenic CH4 is crucial for identifying its generation and accumulation in coal. These factors facilitate the identification and distinction of the biogenic CH4 sources elaborated in the next section.
3. Coalbed Biogenic CH4 Stages of Generation and Accumulation
Simply put, biogenic CH4 forms from the anaerobic microbial decomposition of organic matter in peat, often in organic-rich sediments/sedimentary rocks, as well as in coal beds [20,22]. Gas generation in these organic-rich rocks involves CO2 reduction (hydrogenotrophic) by hydrogen (H2) produced by anaerobic microorganisms during the breakdown of organic matter [22]. After oxygen (O2) is consumed, sulfate (SO4) reduction becomes a dominant microbial activity. Once SO4 is depleted, CH4 generation becomes the dominant process via hydrogenotrophic methanogenesis, in which methanogens (methanogenic archaea) use H2 to reduce CO2 to CH4 [25]. This process requires low concentrations of sulfate to avoid thermodynamic competition with sulfate-reducing bacteria (SRB).
Early-stage (primary) and late-stage (secondary) biogenic CH4 in coal beds represent two distinct generations of microbial CH4, differing mainly in the timing of generation, geological/tectonic settings, and the source of microbial activity [1,20,22]. Early-stage (primary) biogenic CH4 forms during the early sedimentation, deposition, and burial history of low-rank coals (peats to subbituminous rank; vitrinite reflectance or Ro values <0.5%) [20,22]. It’s generation and preservation are promoted by rapid deposition with enclosed coastal and fluvial sediments, influenced by high rates of basin subsidence, and permitting rapid burial. Late-stage (secondary) biogenic CH4 is generated during recent geologic time (tens of thousands to a few million years ago) and is associated with active groundwater systems [20,22]. Coal beds are commonly aquifers in which late-stage biogenic CH4 generation can occur at any rank. The uplift and erosion of ancient coal-bearing rocks facilitated influx of meteoric water bringing new microbes and nutrients into the degraded organic matter of the coal beds. This requires the coal-bearing rocks found along basin margins or in areas where uplift has allowed freshwater to flush through old, previously compacted and lithified sedimentary rocks [1].
3.1. Stages of Biogenic CH4 Generation
Biogenic CH4 in coal beds can be generated during the early stage of burial history from peat to brown coal or lignite but continued intensification of heat and pressure during coalification nullifies its retention [20,22]. However, the notion of non-retention of early-stage biogenic CH4 during early coalification was disproved by the discovery of deeply buried microbial communities including hydrogenotrophic methanogens, at subsea depths (2466 m below the seafloor or b.s.f.) in Miocene lignites at the IODP C0020 drill site off the Shimokita Peninsula, Japan [76]. The main reaction of carbon dioxide (CO2) in coal methanogenesis is hydrogenotrophic methanogenesis, in which hydrogen (H2) acts as an electron donor to reduce CO2 to methane (CH4) (see Table 1) [1,17,24]. This microbial process occurs in anoxic environments within coal beds, typically expressed as CO2 + 4H2 → CH4 +2H2O.
The lignites and associated sediments host microbial life and metabolic potential inherited from freshwater (tidal-terrestrial) peat precursor, which generates CH4 through methylotrophic methanogenesis, and were trapped and survived burial for 20 million years (Figure 6) [76,77]. The methylotrophic (acetoclastic) pathway is less dependent on syntrophy than hydrogenotrophic pathway, which explains the methanogens’ survival in geological isolation for 20 million years. Cell count analysis from the lignites and sediments below 1500 m b.s.f. ranged from ~102 to 103 cells cm−3, which peaks in the lignite beds [76]. The temperature for biogenic CH4 generation in the lignite beds (Ro(vitrinite reflectance) = 0.5–0.7%) is at ∼70 °C, which is lower than the temperature for thermogenic CH4 generation of >150 °C [76,77,78]. The Shimokita Peninsula is a forearc basin that has undergone both subsidence and uplift related to plate tectonics. The biogenic gas- and microbial-bearing Miocene lignites and sediments are interpreted to be rapidly deposited during periods of subsidence preceding uplift.
Figure 6.
Depth charts at right of the Pliocene–Miocene strata showing (a) microbial cell concentrations, (b) δ13C and δD of methane, and (c) (C1/C2) ratios, δ13C of carbon dioxide, and depth temperature gradient at the IODP C0020 drill site off the Shimokita Peninsula, Japan. Adopted from Inagaki et al. (2016) [76]. Scanning electron micrograph (image at left) showing methanogenic communities in the Miocene coals from about 2 km depth at the IODP C0020 drill site off the Shimokita Peninsula, Japan. Microbial cultivation was performed in a continuous-flow bioreactor at 40 °C for 694 days. Bar: 10 µm. Adopted from Inagaki et al., 2016 [76]. Reuse of these figures from Inagaki et al. [76], an open access article, is permitted under the Creative Commons Attribution 3.0 Licence, https://doi.org/10.5194/sd-21-17-2016 (accessed on 27 October 2025).
As coal matures, thermogenic CH4 is generated by the thermal alteration of the organic matter, which occurs at great depths and intense heat and pressure in the basin. However, following uplift of the coal-bearing basin, late-stage or secondary biogenic CH4 generation can be triggered in the shallower coal beds by the intrusion of meteoric surface water, which brings in fresh nutrients and microbes. Late-stage biogenic CH4 in coal aquifers can be generated from recent geologic time (tens of thousands to several million years ago) to modern times. CH4 generation is associated with active groundwater ecosystems, surface water recharge, and the uplift and exposure of coal-bearing rocks at the surface [22,79,80,81]. Groundwater systems played significant roles in generating biogenic CH4 in coal aquifers, in producing from these gas reservoirs, and in CH4 emissions in coal basins worldwide [1,17]. Groundwater provides the necessary chemical and hydrodynamic (hydro-chemical) environment for CH4 to form and accumulate in the coal. Once CH4 forms and accumulates in the coal, groundwater traps it within the coal-matrix fractures/pores by providing hydrostatic pressure that keeps the CH4 bonded or adsorbed on the surfaces of these voids. To release CH4, producers must lower the hydrostatic pressure in the coal matrix by pumping large volumes of groundwater out of the well. As water is removed, the pressure drops, and CH4 desorbs from the coal, flows to the wellbore, and reaches the wellhead on the surface.
The decline curves of gas production from coalbed gas and natural gas wells, shown in Figure 7 [82], can be used to forecast differences in CH4 emission volumes throughout the wells’ lifetimes. The coalbed gas wells show water production is initially high (phase 1) and then declines exponentially, while CH4 production increases over time as the coal bed dewaters, eventually reaching the peak (phase 2) before declining late (phase 3) in the well’s life. On the other hand, the natural gas wells reach peak production rate relatively quickly and then enter a phase of decline. Also, large volumes of groundwater are produced from the coalbed gas wells, which decline as gas production increases, reaching a later peak. In natural gas wells, lower formation water volumes are incidental to gas extraction. Thus, the potential for large volumes of CH4 emissions from coalbed gas wells occurs during later peak production, compared to the early peak production in natural gas wells.
Figure 7.
Charts showing coalbed gas/water production curves versus natural gas/water production curves from multiple State sources in the U.S. (A) Rate of coalbed gas production (thousand cubic feet (MCF)/month) shown in red and rate of water production (barrels/month) shown in blue. The production rate is divided into three phases. (B) The rate of natural gas production (thousand standard cubic feet (SCF)/month) is shown in red, and the rate of water production (barrels/month) is shown in purple. Adopted from Cook, 2005 [82]. Reuse of the figure from Cook [82] is permitted by the article published under the public domain with the U.S. Government, https://pubs.usgs.gov/dds/dds-069/dds-069-d/REPORTS/69_D_CH_23.pdf (accessed on 27 October 2025).
Generation of late-stage (secondary) biogenic CH4 in coal aquifers (e.g., subbituminous and bituminous ranks) is well documented in major coalbed gas-producing U.S. basins [24,79,80,81]. Also, late-stage biogenic CH4 was recorded in major coalbed gas-producing basins in Australia (Bowen, Surat, and Sydney) [83,84,85,86], Canada (Western Canada Sedimentary Basin) [87], and China (Qinshui, Ordos, and Junggar Basins) [88,89,90]. The coal aquifers in these global coal basins include subbituminous, bituminous, and anthracite ranks. Late-stage biogenic CH4 can occur in coal beds of any rank, provided the following parameters are met. The initial microbial process in the coal aquifer is probably aerobic oxidation, which provides a new food supply for the anaerobic community, which can be brought to life when dissolved O2 in the water depleted [22]. Late-stage biogenic CH4 generation is due mainly to reduction of CO2 produced in the previous oxidation phase by electrons (hydrogen or H2) or generated by fermentation of oxidized substrates produced by earlier oxidation (Figure 8) [17,22,24,25,91]. New biogenic CH4 generated by microbes is an ongoing process in real time, particularly in shallow, wet coal beds actively being fed by fresh groundwater recharge, such as in abandoned coal mines and coalbed gas wells [1,17].
Figure 8.
Series of biogeochemical reactions and processes developed along the flow path of the groundwater from surficial recharge areas to down dip of the coal aquifer in the Powder River Basin, Wyoming, U.S. This biogeochemical model is modified to show the potential contribution of exogenous water sourced from overlying and water-rock interaction with vertically and laterally juxtaposed fluvial channel sandstone aquifers. Ca, calcium; Cl, chloride; Mg, magnesium; Na, sodium; Fe, iron; K, potassium; SO4, sulfate; HCO3, bicarbonate; CH4, methane. Source: Adopted from Flores, 2014 [17], modified from Brinck et al., 2008 [91]. Reuse of the figure from Flores [17] is permitted by Elsevier, Inc., as agreed to in the “3. Rights” section of the Publishing Agreement with Romeo M. Flores made on 31 August 2011.
3.2. Groundwater Is Key to Biogenic CH4 Accumulation and Generation
Groundwater ecosystems in coal aquifers connected to meteoric/surface water recharge are crucial parameters in initiating and sustaining methanogenic pathways in the coal aquifers by introducing microorganisms, nutrients, electron acceptors, and altering the geochemical environment to generate and accumulate biogenic CH4 as well as affecting the chemical composition of coalbed gas (see Figure 8) [1,17,24,25,92]. Surface runoff and meteoric water carry active microbial communities from the surface into shallow coal beds particularly along coal basin margins. This process introduces the necessary hydrolytic bacteria and methanogenic archaea that can degrade the complex organic matter in coal beds. Water flows from the surface to subsurface coal aquifers and carries essential nutrients, terminal electron acceptors, and dissolved atmospheric gases into the coal’s subsurface environment [22,24,25,80]. Changes in solute concentrations influence the microbial communities present and dominant methanogenic pathways [93].
Meteoric water intrusion is a critical mechanism for deep coal biosphere reactivation by breaking the metabolic dormancy of long-isolated microorganisms, primarily through the delivery of surface-derived energy sources and the drastic alteration of subsurface redox potentials [94]. This process transforms stable, energy-limited subsurface ecosystems into active biogeochemical hotspots by altering the thermodynamic state of the environment. Thus, the meteoric water intrusion performs as an “input” that relieves nutrient limitations and shifts the environmental redox potential from low-energy anaerobic states to high-energy environments, triggering the metabolic reactivation of dormant microbes in the coal aquifer [95].
Biodegradation of solid coal requires a water-hydrocarbon interface (e.g., coal cleats, fractures, pores) where microorganisms can access the organic matter. Surface water flushed into the groundwater (formation water) in coal aquifers creates this necessary environment, and the size of the interface influences the rate of coal degradation. Surface water primes the groundwater ecosystem by injecting water that, at times, contains amendments or nutrients, such as algal extracts that can stimulate resident microbial communities to generate new CH4 resources [96,97]. Specific water composition derived mainly from water/rock interactions can influence which methanogenic pathway becomes dominant [25]. Studies suggest that hydrogenotrophic methanogenesis (CO2 reduction) is dominant while acetoclastic methanogenesis also occurs in certain coal basins [83,98,99]. Methanogenesis relies on the cooperation of microbial consortia, such as where fermentative bacteria break down complex coal polymers into simpler organic compounds. Methanogenic archaea then use these organic products for energy to generate CH4 in the coal. Ultimately, introducing surface water recharge sustains these consortia by providing essential ingredients, geochemical environments with groundwater flow and water/rock interactions dissolving rock minerals, and altering the composition of water types basinward, fundamentally driving and enhancing coal bioconversion into CH4 (see Figure 8) [1,17,24].
A critical factor limiting microbial conversion of coal into CH4 is bioavailability [1,17]. Bioavailability in coal bioconversion to CH4 refers to the accessibility and susceptibility of coal’s complex organic structure to microbial biodegradation [100]. The structural complexity, often described as a 3D network of aromatic and aliphatic compounds, inherently resists microbial degradation. Thus, the initial solubilization and depolymerization steps are critical for unlocking carbon for microbial use [101]. This process is coal-rank dependent, exemplified by high-rank coals containing highly condensed aromatic structures. This makes it extremely resistant (recalcitrant) to microbial degradation. In contrast, low-rank coals are more susceptible to biodegradation due to higher oxygen content and smaller aromatic rings, which provide “biological doorways” for microbial attack [102]. To overcome low natural availability in coal, methods such as chemical (e.g., hydrogen peroxide), physical, and thermal pre-treatments are used to increase the surface area and generate more soluble compounds [103,104].
Biogenic CH4 is commonly mixed with thermogenic CH4 in coal aquifers across coal basins, including those in the United States (San Juan and Black Warrior Basins), China (Huainan, Ordos Basins), and Germany (Ruhr Basin). This mixing is primarily controlled by basin hydrodynamics, coal rank, and the geological history of burial, uplift, and erosion, which allows groundwater to intrude into previously deeply buried coal beds, bringing microbes and nutrients. Gases in coalbed CH4 wells in the north-central part of the San Juan Basin are a mixture of thermogenic (25–50%), secondary biogenic (15–30%), and migrated thermogenic gases, driven by regional overpressure and meteoric recharge [79]. In coalbed gas wells in the Black Warrior Basin, thermogenic gas is the primary source (about 70–80%), but the actual proportion in each area depends highly on the local geological and hydrological conditions [80]. Isotope data from the Panxie coal mining area of the Huainan coalfield in China confirm that the coalbed CH4 consists of both biogenic and thermogenic gases, with the generation process occurring in distinct stages: primary thermogenic gas followed by late-stage biogenic gas generated by CO2 reduction [105]. In the Liulin Block of the eastern Ordos Basin, China, the proportions of mixed secondary biogenic gas and thermogenic gas are 48.0% to 49.7%, respectively [24]. Mixed thermogenic and biogenic gases generated by CO2 reduction are widely observed in active, and more pronounced in abandoned, coal mines in the Ruhr Basin [39,40]. These studies [39,40] indicate a significant portion of the microbial CH4 might be generated “today by living methanogenic microbes in mine waters” in flooded abandoned coal mines by acetoclastic methanogenesis [39,40].
With deeper burial and increased coalification, which result in higher temperatures and pressures, coals are enriched in carbon as large amounts of volatile matter rich in H2 and O2 are released [1,17,22]. Methane, CO2, and water are the most important byproducts of this devolatilization process [106]. The generation of CH4 from residual kerogen and thermal cracking of previously formed heavier hydrocarbons is thermogenic in origin [20,22]. Cracking mainly occurs in high-volatile bituminous and low-volatile anthracite(Ro values > 0.6%) under high-pressure, high-temperature conditions. The process of coalification is characterized by the chemical evolution of different types of kerogen, with the elimination of oxygen-containing volatiles, such as CO2 and water, and the generation and subsequent elimination of hydrogen-rich volatiles, notably CH4 and oil, during later stages of thermal generation [106]. As a result of thermal cracking, isotopically lighter CH4 is prevalent in hydrogen-rich kerogen, whereas isotopically heavier CH4 is predominant in oxygen-rich kerogen [22].
Distinguishing biogenic CH4 from thermogenic CH44H4 in coals is easier than differentiating biogenic CH4 from coal and other anthropogenic and natural sources (e.g., wetlands, agriculture, landfills). Biogenic and thermogenic CH4 originate from distinct generation processes (low temperature microbiology versus high temperature geology) that yield distinct, non-overlapping isotopic signatures [1,17,107]. In contrast to biogenic CH4, thermogenic CH4 is distinguished by the common presence of heavier hydrocarbons (>C2+ values). For example, in bituminous coal, enrichment of heavy isotope 13C in CH4 and ethane increase with coal rank, and enrichment of deuterium (CH4 δD values more positive than −250‰) increase with coal rank [22]. Biogenic CH4 from different sources (e.g., coal vs. wetlands) often overlaps in isotopic signatures. Also, thermogenic CH4 can be altered to appear biogenic, complicating its identification [78,107]. The key to effective mitigation strategies is distinguishing the isotopic signatures of biogenic CH4 from those of coal formed geologically in the subsurface and from other sources formed recently on the surface.
4. Distinguishing Isotopic Signatures of Biogenic CH4 from Coal and Other Sources
Distinguishing the isotopic signatures of biogenic CH4 from fossil fuels, natural, and anthropogenic sources using δ13C (δ13CCH4) is difficult due to complicating factors. These challenges are mainly due to overlapping isotopic ranges among sources, variability in reaction conditions within a single source, between sources, and across source materials, and the effects of secondary processes such as oxidation.
For example, early-mature thermogenic CH4 can have a δ13CCH4 value similar to primary microbial or biogenic CH4 within the range from −65 to −55‰ [108]. This study [108] indicates that thermogenic CH4 undergoes chemical fractionation due to differences in the diffusion rates of CH4 relative to ethane and propane during migration into shallow subsurface intervals (e.g., higher-porosity reservoirs). Most importantly, microbial processes and isotopic signatures are complex and inconsistent [109,110]. These studies [109,110] indicate that isotopic signatures vary with specific microbes, metabolic pathway diversity (e.g., hydrogenotrophic or CO2 reduction, methylotrophic/acetoclastic or acetate fermentation), and environmental parameters, such as available substrates and energy levels. Acetoclastic methanogenesis is 13C-enriched in CH4 relative to hydrogenotrophic methanogenesis [111]. Also, the isotopic signature values can vary based on the original composition of the carbon (e.g., organic matter from parent plant material; C3/C4 photosynthetic pathways) and hydrogen (e.g., groundwater or formation water) sources, so a single isotopic signature is not always definitive. Distinguishing source material of coal from ancient C3 plants (“old carbon”) and modern C4 plants (“new carbon”), which both show low-to-high δ13C signatures, respectively, and creates a profound analytical “blind spot” [112,113,114,115,116,117,118,119,120,121,122] (Table 3).
Table 3.
Summary of difference between “old carbon” and “new carbon” based on geologic time, dominant plant type, photosynthesis, atmospheric CO2, isotopic signature, and analytical issue. Ma, mega-annum (one million years); ppm V, parts per million by volume; ppm, parts per million; C, carbon; CO2, carbon dioxide; VPDB, Vienna Pee Dee Belemnite, the international standard for reporting stable carbon isotope ratios (13C/12C). Carbon isotopic signature based on Meyers [112] study of marine organic matter in black shales. Atmospheric CO2 based on carbonate fossil soils (paleosols) study by * Breecker et al. [113] and by ** The Cenozoic CO2 Proxy Integration Project (CenCO2PIP) Consortium [114]. Also, compiled from Osborne et al. [115]; Edwards et al. [116]; Gowik and Westhoff [117]; Osborne et al. [118]; Wang et al. [119]; Hare et al. [120]; Polissar et al. [121]; Kirkels et al. [122].
Additional complications arise after emissions into the atmosphere, due to oxidation of CH4 fluxes [123]. The primary sink for atmospheric CH4 is its oxidation by the hydroxyl (OH) radical, which causes isotopic fractionation, preferentially consuming the lighter isotopes of carbon and hydrogen and enriching the residual CH4 in the heavier isotopes such as 13C and 2H (deuterium, D) [123]. This reaction, which reduces and limits atmospheric CH4 concentration, is affected by solar radiation, ozone, and water vapor. When the OH radical reacts with CH4, the radical does not disappear; instead, it is recycled, and the broadening tropical zones over time provide more moist air, which creates hydroxyl molecules. Increasing OH concentration will accelerate CH4 oxidation and reduce atmospheric CH4 concentration [124]. The degree of CH4 oxidation by OH can vary regionally due to differences in sunlight intensity, making simple signature comparisons unreliable.
The intermixing of CH4 fluxes from various sources complicates the accurate measurement and attribution of atmospheric CH4 emissions. This complexity presents significant challenges for monitoring and assessing uncertainty in the development of effective mitigation strategies. One of the most significant impacts of intermixed CH4 fluxes is the effect on the atmosphere’s oxidizing capacity [123]. The primary sink for CH4 in the troposphere is the hydroxyl radical (OH). When CH4 concentrations increase significantly, a chemical feedback loop reduces the abundance of OH [123]. This increases the atmospheric lifespan of CH4 and other pollutants, leading to more climate warming. Since different sources require distinct reduction and mitigation strategies, knowledge of source types permits the formulation of national, regional, and local inventories [123]. Many potential strategies to facilitate the implementation of these measures are exemplified by separate bottom-up and top-down strategies for the fossil fuel, agriculture, and waste sectors, particularly between biogenic gas sources [56]. The reliance on standard isotopic signatures (e.g., δ13C) for CH4 source attribution is increasingly creating source attribution errors in national inventories because “biogenic fossil methane” from coal beds can be mistaken for modern anthropogenic and natural biogenic CH4 sources (e.g., wetlands, landfills) [125,126] (see Table 3). This confusion obscures the true source of emissions, leading to mitigation strategies that may incorrectly target sectors such as agriculture or landfills while underestimating fugitive emissions from the fossil fuel industry.
Biogenic CH4 emissions from CBM/CSG and coal mining extractions occur at a basin scale that includes farmlands and ranchlands with a variety of anthropogenic biogenic CH4 sources (e.g., agriculture, livestock, landfills, wetlands). So, their attribution has large uncertainties. Measurement of radioactive isotope carbon-14 (14C) analysis is a critical diagnostic tool for tracing CH4 sources [127,128,129]. Because fossil fuels are millions of years old, CH4 derived from coal—whether it is thermogenic or biogenic CH4—is considered “dead radiocarbon” because all 14C has decayed (14C has relatively short half-life 5730 years) [127,128,129]. This characteristic enables scientists to clearly distinguish biogenic coal CH4 from younger sources, such as landfill gas and livestock emissions, which contain modern, active 14C.
4.1. Distinguishing Isotopic Signatures of Biogenic CH4
Analysis of the carbon isotopic composition of CH4 (δ13CCH4) is the most effective means of tracking its sources and sinks [8,130]. Different sources of biogenic CH4 produce distinctive δ13CCH4 signatures and values (‰ VPDB) [7,8,123,131,132,133]. Microbial-processed CH4 emissions from natural wetland, livestock, and landfill sources have lower δ13CCH4 values (global mean of −62‰) than anthropogenic biomass and biofuel burning (global mean of −24‰) and fossil fuel CH4 emissions (global mean of −45‰) (Table 4) [1,7,8,24,111,131,134,135,136,137].
Table 4.
Differences in values of isotopic signatures of biogenic methane relative to VPDB from coal, anthropogenic, and natural sources. VPDB, Vienna Pee Dee Belemnite, the international standard for reporting stable carbon isotope ratios (13C/12C); VSMOW Vienna Standard Mean Ocean Water, the international standard for hydrogen (deuterium or D) isotope; δ13C, stable carbon isotope; ‰, per mil; D, deuterium; CH4, methane. C3 and C4 refer to two distinct photosynthetic pathways plants use to fix carbon dioxide, differing in the initial carbon molecule produced (3-carbon for C3, 4-carbon for C4) and in their environmental adaptations. C3 plants thrive in cooler, wetter conditions (like rice and wheat) while C4 plants excel in hot, dry environments (like corn and sugarcane). Compiled from Flores and Moore [1]; Nisbet et al. [7]; Michel et al. [8]; Flores et al. [25]; Zazzeri et al. [111]; Riddell-Young et al. [131]; Bakkaloglu et al. [133]; Basu et al. [134]; Dong et al. [135]; Oh et al. [136]; Lu et al. [137].
However, methanogenic pathways complicate the isotopic signatures of biogenic CH4 generated from the acetate fermentation pathway (δ13C-CH4: range from −90 to −45‰) [133,138] (Figure 9). Also they are more enriched in 13C and less enriched in 2H than biogenic CH4 generated from CO2 reduction or the hydrogenotrophic pathway (δ13C-CH4: range from −90 to −60‰; δ2H-CH4) [133,138] (Figure 9). Thus, the global mean isotopic signatures overlap between biogenic CH4 from wetlands, livestock, landfills, and fossil fuels.
Figure 9.
Flowchart of stepwise (e.g., (1), (2), (3)) methanogenic pathways for conversion of organic matter to methane in a freshwater environment. (4). Acetotrophic methanogens breakdown acetate into CH4 and carbon dioxide. H2-consuming methanogens are also called hydrogenotrophic methanogens; CH4, methane; CO2, carbon dioxide; H, hydrogen. Source: Adopted from Flores, 2014 [17], modified from Zinder, 1993 [139]. Reuse of the figure from Flores [17] is permitted by Elsevier, Inc., as agreed to in the “3. Rights” section of the Publishing Agreement with Romeo M. Flores made on 31 August 2011.
The isotopic signatures of biogenic CH4 for each source are determined by examining the variations in ratios of stable carbon-12 (12C) to slightly heavier carbon-13 (13C) isotopes as well as hydrogen isotopes, specifically the deuterium δD (2H) to hydrogen (1H) [133,140]. The (13C/12C) ratio is expressed as a delta value (δ13C). Combining carbon isotope analysis with hydrogen isotope analysis (δD) helps differentiate between specific biogenic CH4 and other sources. A more refined tracing of sources is proposed by Bakkaloglu et al. and Haghnegahdar et al. [133,141] using methane’s “clumped isotopologues” (e.g., 13CH3D, 12CH2D2) to distinguish between microbial and fossil sources. Clustered (or “clumped”) isotopes of CH4, specifically the isotopologues 13CH3D, 12CH2D2, provide a definitive record of CH4 formation temperature [78,142,143,144]. Biogenic CH4 typically forms at temperatures below ~80 °C, while thermogenic CH4 forms at higher temperatures (>60 °C to >200 °C) [78]. Thus, clumped isotopes allow calculation of formation temperature, separating low-temperature biogenic CH4 from high-temperature thermogenic CH4 regardless of whether the gas has migrated. During migration or secondary processes, thermogenic CH4 can lose heavy isotopes (carbon-13 and deuterium), making it appear “falsely light or biogenic” using conventional isotope analysis [22]. In a CBM/CSG mixed gas system, clumped isotopes have been used to identify secondary microbial CH4 generated by biodegradation previously mistaken for thermogenic CH4 [144]. However, these carbon-isotope analyses of CH4 account only for thermogenic, not biogenic, CH4 in natural and coalbed gases. Although there is some overlap between these fossil fuel gases, the thermogenic CH4 is generally enriched in 13C and deuterium (D, 2H) with δ13CCH4 values ranging from −45‰ to −15‰ [133]. Methane produced by microorganisms in wetlands, landfills, and agriculture has very little δ13C, so the signature of microbial CH4 is “lighter” than that produced by fossil fuels, such as natural gas [133]. The biogenic CH4 generated in coal beds is derived from ancient plant remains (fossil carbon; see Table 3). So the CH4 produced by microorganisms from old carbon sources yields δ13C values in coals that often range from approximately −40‰ to −60‰, though these values can vary based on coal rank or maturation (coalification), depth, and methanogenic processes [133].
The transition zone is characterized by a shift from highly depleted (lighter) 13C and 2H (deuterium) values in biogenic CH4 to enriched (heavier) values in thermogenic CH4. The biogenic CH4 typically shows δ 13C values that range from >−70‰ to −50‰, while the thermogenic CH4 range from −50‰ to −20‰ (see Figure 10). The deuterium isotope (δD or δ2H) values in the transition zone (orange, see Figure 10) between hydrogenotrophic (CO2 reduction) and methylotrophic (Fermentation) pathways frequently range from −300‰ to −250‰ relative to VSMOW. These transition zones result in overlapping gas types that are difficult to separate from distinctive isotopic signatures of biogenic CH4. However, “clumped isotopologue” can aid in identifying CH4 emissions by analyzing the “clumping” of heavy isotopes within CH4 molecules, thereby distinguishing between thermogenic and microbial sources, which often have overlapping “bulk” isotopic signatures [141,142,143,144].
Figure 10.
Chart showing compositional fields of gas types (e.g., thermogenic versus biogenic and transition fields—blue/orange) based on the carbon isotope of methane (δ13C) and deuterium isotope of methane (δD). Methanogenic pathways for biogenic CH4 include fermentation (acetoclastic) or methylotrophic, CO2 reduction, or hydrogenotrophic. Source: Adopted from Flores, 2014 [17], modified from Whiticar et al., 1986 [145]. Reuse of the figure from Flores [17] is permitted by Elsevier, Inc., as agreed to in the “3. Rights” section of the Publishing Agreement with Romeo M. Flores made on 31 August 2011.
The isotopic compositional fields related to methanogenic pathways for biogenic CH4 (e.g., CO2 reduction or hydrogenotrophic vs. acetate fermentation or methylotrophic) or the thermal maturity of the source rock for thermogenic gas are best shown in Figure 10 [17,145]. Combining these isotopic data with the molecular composition (e.g., δ13C-CH4; δ2H-CH4 or D, 2H) is a powerful tool for robust genetic characterization of gas types. Each gas type occupies a distinct, empirically defined field based on its unique formation processes. However, the transition zone (blue, see Figure 10) between biogenic and thermogenic gas fields exist because natural gas accumulations are frequently mixtures of methane from both microbial and thermal sources.
4.2. Variations of Coalbed Biogenic CH4 Isotopic Signatures
The isotopic signature of CH4 produced during coalification of organic matter in coal is controlled by the CH4 origin pathway [111]. Coalification correlated with burial depth intensification of temperature and pressure, which transforms the fossil organic matter in precursor peat over geologic time, affects the isotopic composition of coal-generated CH4.
Also, the isotopic signature is influenced by the stages of biogenic CH4 generation (early- and late-stages) during coalification. Post-generation processes such as desorption, diffusion, migration, mixing, and oxidation in coal aquifers contribute to variations in the isotopic signature of biogenic CH4. Isotopic fractionation during biogenic CH4 migration over a long time or distance, or has undergone desorption and diffusion, becomes isotopically heavier because the lighter isotopes are preferentially released or moved faster [146]. The oxidation of biogenic CH4 occurs during migration into more oxidized coal aquifers, in which preferential consumption of lighter isotopes leaves the remaining CH4 pool isotopically heavier (enriched in 13C and 2H or D) [22,146].
The above isotopic-fractionation process within coal aquifers is probably exemplified by the biogenic CH4 in the Powder River Basin with highly variable δ13CCH4 signatures based on 165 gas and water samples collected from 10 major/minor producing subbituminous C–A rank coal beds ranging from 51 to 700 m deep [25]. Here, the δ13C CH4 signatures range from >−53.5‰ to −64.9‰ for the isotopically heavier biogenic CH4 distributed in the deep central part (653–198 m in depth) of the basin and from −65.4‰ to <−83.4‰ for isotopically lighter biogenic CH4 distributed in selected areas of the shallow (97–197 m) margins of the basin. The trends in δ13CCH4 indicate that the heaviest CH4 isotopes are in the central part of the basin, where conditions are more anoxic and hydrogen is available, which is typically associated with CO2 reduction or hydrogenotrophic methanogenesis [25,26]. In contrast, during migration into more oxidized zones (typically shallower aquifers), CH4-oxidizing microbes preferentially consume lighter isotopes (12C and H1) and are dominated by fermentative (acetoclastic) methanogenesis. Coincidentally, the coal ranks at the deep central part of the Powder River Basin are subbituminous A and B (higher end of the low-rank coal with more carbon content), and at the shallow margins are subbituminous C (lower end of the low rank-coal or less carbon content). More importantly, biogenic CH4 generation in the deep central part of the Powder River Basin is dominated by CO2 reduction, a specific type of hydrogenotrophic methanogenesis, and minor methyl-type fermentation (acetoclastic) methanogenesis sustained by nutrients from surface water recharge and occurs in the shallow eastern and northwestern basin margins [25,26].
The concept of isotopic fractionation during gas desorption in CBM production is more pronounced in high-rank coals and depends on the “speed of pressure reduction” [147,148]. When pressure (e.g., hydrostatic) is reduced the CH4 adsorbed in the coal matrix desorbs and diffuses. The isotopically lighter CH4, which contains a lighter carbon isotope (12C), desorbs and diffuses more rapidly than the heavier CH4, which contains a heavier isotope (13C) [147,148]. Because 12CH4 escapes faster, the initial gas released during early stages of CBM/CSG production or coal mining dewatering is depleted in 13C, making it appear more “biogenic” (lighter or false biogenic) than the bulk composition of the source. As production continues, the coal reservoir becomes depleted in the lighter isotope (12C). Consequently, the remaining CH4 desorbs later and becomes increasingly enriched in 13C, resulting in a heavier isotope signature [147,148]. The key implication of this phenomenon is that isotopic analysis of CH4, particularly during early CBM/CSG production, may not accurately represent the true maturity or genetic origin of the CH4 [148]. Also, for coal mines, this means CH4 leaking from long-closed, abandoned, or newly opened, low-flow areas might appear artificially light. Thus, this requires careful analysis to determine if it is true biogenic CH4 or just fractionated thermogenic CH4. Lastly, analysis between truly biogenic and thermogenic CH4 focuses on other indicators such as ethane-to-methane ratio [22,25]. The dynamic fractionation during CBM/CSG production and coal mining dewatering reflects the challenges in measuring fugitive CH4 and unreliable and accurate emission tracking, which is a significant “blind spot” in mitigation.
Similar methanogenic pathways toward the generation and accumulation of biogenic CH4 are observed in various rank coals (e.g., subbituminous, bituminous, anthracite) in coal basins in Australia [83,84,149,150], Canada [44,87], China [89,151], India [152], Poland [153], and the U.S. [25,80,81,154]. Australia and China have replaced the U.S., Canada, and the European Union as major producers of coalbed CH4 since 2008 [1]. In the Australian and Chinese coal basins, the main methanogenic pathway for biogenic CH4 generation is CO2 reduction (hydrogenotrophic), and the minor methanogenic pathway is acetate fermentation. In the Australian Bowen, Surat, and Sydney Basins, with coal ranks ranging from subbituminous to anthracite, the δ13CCH4 signatures range from −60‰ to −40‰, −57.3‰ to −54.2‰, and −76.8‰ to −50.1‰, respectively [83,84,155,156]. These δ13CCH4 signatures indicate that late-stage biogenic CH4 generated in the Australian basins is mixed with a thermogenic CH4 component that is produced in CSG wells.
In the Chinese Ordos and Qinshui Basins with coal ranks from bituminous to anthracite, the δ13CCH4 signatures range from −81.9‰ to −9.1‰, with most falling between −65‰ and −30‰, [157]. The biogenic CH4 generated by methylotrophic (acetate fermentation) methanogens originates from the eastern margin of the Ordos Basin [35,157,158]. In the southern Qinshui Basin, the δ13CCH4 signatures are mainly <−55‰ with biogenic CH4 generated by CO2 reduction (hydrogenotrophic) methanogenesis [36,159]. The Chinese coal basins contain biogenic CH4 that is mixed with a major thermogenic CH4 component. The δ13CCH4 signatures range from −32.58‰ to −26.7‰ [36,159], often in deeper parts of the basins. The mixed gases are often produced in single wells, which are difficult to isolate.
Even for the same source, such as coalmine CH4 emissions, the isotopic signature varies depending on the geologic and biogenic processes involved. A study of δ13CCH4 signatures from different coal mine types in the United Kingdom, Australia, and Poland indicates that the progression in coal rank and generation of biogenic CH4 is due to the incursion of groundwater affecting coal-derived CH4 signatures [111]. As a result of this study [111], bituminous coal extracted in surface (opencast) mines was analyzed to have a δ13CCH4 signature average value of −65‰ compared to underground deep mines with δ13CCH4 signatures ranging from −65‰ to −55‰. Also, anthracite coal in opencast and underground deep mines has 13CCH4 signatures of −40‰ and −30‰, respectively. Shallow coal mines extracting various coal ranks are exposed to meteoric water, most likely associated with the microbial generation of lighter biogenic CH4. The study concluded that the isotopic signatures in global atmospheric models of coalmine CH4 emissions are region- or nation-specific, requiring more detailed research, given the wide global variation in coal rank [111].
Thermogenic gas, such as CH4, contains more 13C and has a distinct 2H/1H isotopic signature compared to biogenic gas, which is characterized by a 13C-depleted signature and broader 2H values (VSMOW) [78]. The molecular composition of thermogenic gas typically contains other hydrocarbons like ethane, propane, and butane, in addition to CH4, in contrast to biogenic gas, which is primarily CH4 [20]. Thermogenic gas forms at high temperatures and pressures, while biogenic CH4 forms at low temperatures generated by microbes sustained by surface water recharge. By extrapolation, deep coals generally contain thermogenic gas, and shallow coals comprise biogenic CH4. These gas-generation processes in coals essentially suggest that deep underground mines are composed of thermogenic gas, whereas shallow surface mines contain biogenic gas. However, the biogenic CH4 potential in a coal mine producing thermogenic gas in Hubei, China, could be stimulated by indigenous microorganisms [160]. The highly diverse fermentative bacteria and acetotrophic, hydrogenotrophic, and methylotrophic methanogens in the Triassic coal of the coal mine could be enriched to regenerate biogenic CH4. Mixed thermogenic and biogenic gases are widely observed in coals in coal mines in the Ruhr Basin in Germany [39,40] as well as in the eastern Ordos Basin [157], Huaibei Coalfield [161,162], and Qinshui Basin [151,163] in China. In the Chinese coal mine examples, the mixed thermogenic and biogenic gases, which formed at depths of 250 to 1000 m [162], are impossible to separate, but both gases can be mitigated by drilling and capturing in advance of mining, as well as by VAM [32,33].
5. Sources of CH4 Emissions in Coal Mine and Coalbed Gas Operations
The total CH4 emissions from coal sector operations originate from two diversified areas of mining operations: mineable shallow coal beds and drilling for commercial gas production of deep unmineable coal beds (Table 5) [1,16,17,30,31,59,164,165]. The key problem in mitigating CMM from mining operations is that the CH4 concentration in emissions is low and from diffused/dispersed point sources, such as in underground, surface and abandoned coal mines (Table 5). The lower the CH4 concentration, the more difficult it is to abate the emissions technically and economically [166].
Table 5.
Summarizes the key types of CH4 emissions and gas types in coal sector operations. Also, it differentiates between point sources and diffuse/disperse flow types along with their primary mitigation challenges. CH4, methane, CMM, coalmine methane; VAM, ventilation air methane; AMM, abandoned mine methane; CBM, coalbed methane; CSG, coalseam gas methane; %, percent. Compiled from Flores and Moore [1]; USEPA [16]; Flores [17]; IEA [30,31]; Beckmann et al. [40]; Thielmann et al. [39]; Karacan et al. [59,164]; Karacan [165].
So, the dominant and singular focus of the global source of CH4 emissions is on CMM from underground coal mine operations and production, surface (open-cut) mining, and post-mine processing and transportation. However, indirect (fugitive) emissions come from CMM and from the energy required to process and transport the coal (Figure 11) [30,166]. According to IEA [166] shown in Figure 11 the lowest 10% coal production (Mtce) has a total average emissions intensity of 80 kg (kg) of CO2-eq/tce. In contrast, the highest 10% coal production (Mtce) has emissions intensity of 1000 kg CO2-eq/tce. Thus, the most emissions intensive coal produces greater than ten times more indirect emissions than the least emissions [166].
Figure 11.
Chart showing indirect carbon dioxide (CO2) and methane (CH4) emissions intensity from global coal supply based on 2018 data. The indirect emissions intensities are from different coal mine extraction points and the associated methods of processing and transporting the extracted coal. Indirect emissions come from CMM but also from energy required to extract (e.g., draglines, trucks, shovels, conveyor belts, crushers), process (e.g., washing requires electric-powered systems), and transport (e.g., trains, ships) the coal. Emissions intensities are measured in kilogram (kg) of greenhouse gas expressed as CO2 equivalents (e) for every (million) tonne of coal equivalent (tce) globally. The CH4 emissions intensities are related in the chart against the energy released by burning one million metric tons of standard coal (Mtce). Adopted from IEA, 2022 [30] and IEA, 2019 [166]. Reuse of this figure from IEA [30] is permitted under Creative Commons Licence CC BY 4.0, https://www.iea.org/reports/global-methane-tracker-2025 (accessed on 27 October 2025).
The least-known source of CH4 or CMM emissions from coal mining is from operations during the degasification of mineable coal using boreholes in advance of mining and the production of natural gas (CBM/CSG) from associated deep unmineable (“intensive coal”) coal beds. Often, the gas captured by this pre-drainage process is utilized for electricity generation to run equipment and factifies in the mine site. Depending on the quality of the gas (>95% CH4) and the availability of nearby pipeline infrastructure, the captured gas is injected into the local natural gas grid and marketed as CBM/CSG. Thus, prior to coal mine operations, it is necessary to invest capital for drainage technologies, pipeline networks, and monitoring equipment [166].
Worldwide (e.g., U.S., China, India, Russia), there is a blurring of lines in the common usage of CMM and natural gas (CBM/CSG) development [32]. While CMM is traditionally viewed as a safety hazard [32,164,165], these and other top-emitting countries (see Figure 2) are moving toward treating it as a valuable source of clean energy, effectively merging it into the natural gas (CBM/CSG) market [33].
Simply put, the geological origin of CH4 from coal beds does not support separating GHG inventories, as in the U.S. EPA’s catalogs of CMM and coalbed methane (CBM). In China, CH4 (CMM), which is recovered from coal beds in coal mines in the shallow part of the coal basins, is developed in the same coal beds in the deep basin as a part of natural gas (coalbed gas or CBM/CSG), focusing heavily on utilizing this resource for energy and safety as mandated by the government’s Five-Year Plans [33]. As exemplified in the Huainan mining area (Anhui Province) CBM pre-drainage system is essential for extracting coal safely and efficiently [167,168]. Because Huainan’s deep coal beds have low permeability, high gas pressure, and a high risk of outbursts, operators implement regional CBM pre-mining drainage methods to mitigate explosions and capture the gas for energy use. These methods include first mining outburst-prone coal to relieve stress and gas pressure in adjacent outburst-prone coal, making CBM extraction more efficient. Also, surface vertical wells and underground-to-surface target “sweet spots” around longwall mining goafs prevent fugitive CMM emissions. Although surface/ground and underground drilling methods are effective, CBM extractions fail due to borehole instability and blockages due to tectonically sheared coal beds. Thus, technical and operational conflicts between CBM production and coal mining in the Huainan mining area are driven by complex geological conditions, technical incompatibilities, and rights overlap [167,168]. The separation between CBM exploration/mining rights from traditional coal mining rights has led to coordination issues. To mitigate these conflicts, the industry uses the “Huainan Model” of co-exploitation through stress-relief mining to prevent outbursts.
In India, Coal India Limited, which accounts for 80% of the country’s coal production, along with its subsidiaries, was granted permission by the government to explore and develop CBM/CMM from mineable coals and all other coal-bearing rocks within their coal-mining leases [1]. In U.S. coal basins where both gases (CMM and coalbed gas) are produced from the same coal beds, coal mines (in the shallow margins of the basin) and natural gas companies (in the deeper part of the basin) have filed lawsuits about lost gas. In the Powder River Basin, natural gas companies sued coal mine operators for lost gas reserves resulting from decades of dewatering of coal beds in coal mines leased by both companies. Dewatering lowered the basin groundwater level (drawdown), which in turn reduced the hydrostatic pressure in the coal reservoir, causing gas desorption and emissions down-basin of the coal mines [17]. Coal mines drill shallow coalbed gas wells from the surface to drain CH4 (CMM) and groundwater from the mineable coal beds in advance of mining. This drilling technique allows the capture of the gas for energy use in the mines’ facilities but also contributes to CH4 emissions from abandoned boreholes. This mode of draining CMM serves as a precursor to the production of coalbed gas from deeper unmineable coal beds [165]. The key to both coal operations is the shared coal aquifers in which the groundwater system is co-produced during development.
The shared groundwater system refers to the lateral stratigraphic connectivity of the groundwater within the same coal aquifer (dual-role coal), which is both mined on the surface along the basin margin and developed for gas in the basin center [1,17,80]. Active pumping of water wells in the surface coal mine area causes localized cone of depression drawing groundwater towards the wells from all surrounding directions. This localized drawdown, or lowering of the groundwater table/level, creates a low-pressure area and a hydraulic gradient, promoting gas flow in the coal aquifer. The gas migrates updip through the coal beds, faults, fractures, and fissures in the overlying rock (overburden) above the coal aquifers and invisibly escapes to the atmosphere. This process is analogous to “transverse hydraulic conductivity” in multi-seam mining of the upper coal bed, creating a fractured zone in the overburden that extends to the lower coal bed [169,170]. The fractures and fissures provide pathways for gas migration and invisible emissions.
5.1. Sources of CH4 Emissions from Coal Mines
Mixed biogenic and thermogenic methane is released by active surface (open-cut or opencast) and underground coal mines as CMM, abandoned coal mines as AMM, and coal preparation/processing, and coal storage and transport as fugitive methane [1,17,73,164,165,169]. The difference between these sources lies in the degree of CH4 emissions’ diffusivity, with surface coal mines emitting more than abandoned coal mines and less than underground coal mines. That is, surface coal mines emit CMM over large areas (e.g., open pits, highwalls with exposed coal beds, extended facilities such as spoil piles and coal storage areas) rather than from the VAM mitigation point source in underground coal mines. Most U.S. CMM emissions are from VAM systems (60.2%), followed by minor emissions from abandoned mines (11.8%), post-mining surface operations (11.8%), surface mines (11.2%), and drainage or pre-drainage systems (4.3%) [171,172,173]. As of 2023, coal mining accounts for 31% of the CH4 emissions in the energy sector worldwide [171,172,173].
In surface coal mines, the extraction of shallow subsurface coal beds over large areas involves blasting to fragment the overlying rocks (overburden) by blasting, thereby releasing trapped CH4 into the atmosphere. Blasting enables large-scale surface mining and the removal of large volumes of soil and rock through mechanical excavation (e.g., trucks and shovels), causing CMM to seep over a broader surface area. Also, blast-fractured and freshly exposed coal beds in the highwalls serve as point sources of high concentrations of CMM emissions controlled by coal’s properties. But properties such as gas content, rank, permeability, pressure, desorption rate, water/moisture content, and pace of advancement of the coal face or highwall vary over time [32,33]. These mine-site-specific data, such as gas contents of mined or in-situ coal beds analyzed from cores over time, are traditional standardized data for bottom-up Tier 2/3 emission factors estimations. Thus, updated CH4 emissions from surface coal mines are calculated over time using the emissions factors of the USEPA guidelines [73]. Normally, an isolation flux chamber is used by placing an enclosure on the mine surface, flowing known air through it, and measuring CH4 concentration in the outlet air to find the flux (kgCH4/km2/day). However, this technique is inherently problematic due to poor spatial and temporal representation across the large surface area of a coal mine.
While remote sensing offers expansive, time-series data, it often fails to capture fine-scale, ground-level details, creating a critical gap between spectral pixels and meteorological processes, such as in surface coal mines. Satellite-based monitoring of CH4 emissions in coal mining faces significant challenges due to episodic leakages driven by variable microclimatic conditions, creating a “blind spot” in mitigation. Although satellites provide broad, long-term observation of CH4 emissions, they are predominantly passive sensors that require specific conditions, which can lead to missed detection of emission peaks [171]. Satellites like TROPOMI (near-daily) or GHGSat (targeted) pass over a site only at certain times of the day. If a peak emission event occurs outside this observation window (e.g., at night or on the weekend) it will not be captured [173]. Detection thresholds indicate that high-resolution satellites such as GHGSat can detect individual CH4 plumes as small as ~100 kg/hr with precision. However, many smaller or more diffuse CH4 leaks from coal mining operations may remain below the detection limit [172]. The intersection of surface reflectivity (albedo) and complex topography in or around surface and underground mines creates a highly variable setting that challenges traditional modeling techniques [173,174,175]. For example, surface coal mine highwalls and spoil piles (30–100 m relief) act as topographic barriers, creating turbulence, cold-air pooling, stagnant air pockets, or channeling wind, which can cause unnatural microclimate to form [173]. Surface coal mines expose various rock layers, overburden, and infrastructure, each with distinct albedo values. Dark, freshly excavated rock absorbs more solar radiation, increasing localized heating, while light-colored and weathered, exposed rock reflects it [171]. These surface coal mine unnatural microclimatic, albedo, and topographic conditions make CH4 dispersion models difficult to measure and mitigate due to the lack of reliable baseline data.
Historically, it was assumed that surface (or opencast) mines released very little CH4 because the shallower coal beds they access contain less gas than deeper seams. Also, the shallower coal beds, usually found in basin margins, occur in zones of low hydrostatic pressure that adsorb or hold CH4 in the coal’s pore systems and are controlled by fluctuations of groundwater level in the zones. However, recent studies utilizing advanced remote-sensing satellite data and airborne instruments have challenged this assumption and confirmed that some surface mines are significant, concentrated point sources of CH4. These super-emitter events are often caused by concentrated gas releases, such as those at the Hail Creek open-cut mine in the Bowen Basin in Queensland, Australia [175]. The diffuse nature of CMM emissions in the opencast coal mine requires advanced techniques, such as aircraft-based lidar to map mine topography and remote sensing instruments to measure top-down CH4 concentration gradients (Figure 12) [175]. The CMM emissions emanate from bituminous, hard coking coal typically containing thermogenic gas, but potential biogenic gas in Bowen Basin Permian coal measures is suggested by high hydraulic conductivity and groundwater recharge [176]. Also, the within-pit source of CMM emissions does not account for potential in-situ biological gas production from water management ponds, disturbed soils, and exposed coal stockpiles [175]. Thus, the uncertainty of the biogenic origin of the gas in the Hail Creek opencast mine contributes to potential under-reporting of the origin of CMM emissions.
Figure 12.
(A) Australian Hail Creek opencast coal mine methane (CH4) plumes on 28 September 2023, by Borchardt et al., 2025 [175] are depicted in two image insets to the west and downwind of the mine. Two curtains were flown by aircraft, with atmospheric CH4 concentrations (in parts per billion) interpolated between different transect heights on a blue-to-red color scale. The first and second curtains were flown about 4 and 12 kms downwind of the mine, respectively. The CH4 plume imaged by the MAMAP2DL spectrometer onboard the aircraft is shown with the yellow-to-red color scale. The LIDAR-derived topography of the mine is shown in terrain colors. (B) Plots of raw coal gas content (in m3 t−1) vs. depth for all boreholes in the Bowen Basin are shown to depths of 300 m below the surface (blue). Red dots are coal gas contents from the Rangal Coal Measures and Fort Cooper Coal Measures. The dashed line represents the basinwide mean in situ coal CH4 gas content of 1.65 m3 t−1. The boxes are inferred coal CH4 content derived from top-down emission rate quantifications. ppb = parts per billion, km = kilometer, m = meter, mbgs = meter below ground surface, m3/t = cubic meter per tonne, PBL = Planetary Boundary Layer, AMSL = Above Mean Sea Level, MAMAP2DL = Methane Airborne Mapper 2D-Light, RCM = Rangal Coal Measures, FCCM = Fort Cooper Coal Measures. Adopted from Borchardt et al., 2025 [175]. Reuse of this figure from Borchardt et al. [175], an open access article, is permitted under Creative Commons Licence CC BY 4.0, https://creativecommons.org/licenses/by/4.0/ (accessed on 27 October 2025).
A common strategy during mining operations to prevent large-scale CMM emissions from surface coal mines (e.g., Hail Creek coal mine) is to drill surface boreholes into the coal beds to drain them before mining and capture CH4 for beneficial use [17]. The pre-drainage system includes drilling boreholes in front of or in advance of mining and continues as coal extraction moves into adjoining or deeper areas where more concentrated gas is encountered. So, they are documented sources of CH4 emissions. Gas pre-drainage in surface coal mines is determined by site-specific geological conditions, mining methods, and operational requirements. Geological conditions include coal-bed depth (e.g., gas content increases with depth) and geological structures (e.g., faults, folds) [32,33,177]. Operational requirements include vertical drilling from the surface into the coal, horizontal drilling from the surface or directional drilling for more precise targeting of gas-rich areas, and maintaining boreholes within the bed [178,179,180,181]. Pre-drainage boreholes drilled from the surface-to-inseam coal, are a primary method for mitigating CH4 emissions in coal mining and are designed to convert uncontrolled, diffuse CH4 releases into controlled, captured, and usable gas. Also, this method significantly reduces the amount of gas that would otherwise be released into the underground coal mine’s VAM.
In contrast to surface coal mines where the CH4 is dispersed, underground coal mines are more contained, controlled, and managed. Also, methane emissions from underground coal mines are usually more than those from surface coal mines, as deeper coal beds tend to contain higher CH4 content [31,32,33,172]. The ventilation systems in underground coal mines are the single most important source of CMM emissions, which accounts for about 30% of global CMM emissions [31,172]. VAM comes from coal beds, where the trapped CH4 is released during mining operations, such as coal excavation, exposure of coal faces, and drilling for gas in front of longwall mining. Large fans move air through the mine to keep CH4 levels below explosive limits (5–15%). Diluted CH4 is typically less than 1% and is released to the atmosphere via VAM by moving fresh air into the mine [17,59,172]. Because coal mine exhaust flow rates are high, VAM is a major source of CH4 emissions in active coal mines [73]. On-site recovery and use of VAM can be used to heat mine facilities or to dry coal [172]. An alternative method to reduce CMM emissions uses thermal oxidation to destroy VAM, even at very low concentrations. To reduce reliance on VAM systems, an underground coal mine degasification system is used to remove trapped CMM by drilling in-seam boreholes in advance of longwall mining. Underground coal mine pre-drainage systems include directional, horizontal, and cross-layer drilling [33,179,180,181]. Multiple boreholes from the same site and cross-measure drilling at an angle to drain CH4 above and below working areas maximize space efficiency and CMM recovery in underground coal mines [178,179,180,181].
Abandoned coal mines, especially underground mines, are a significant source of CH4 emissions because they continue to release AMM that was trapped as residual CH4 in the coals and surrounding rocks, even after a mine has closed. AMM continues to be released from abandoned underground coal mines for decades and, presumably, when flooded with groundwater, stops leaking after 7 years (Figure 13) [182]. The figure shows a decline curve for flooded abandoned coal mines, indicating a 50% decrease in CH4 emissions in about 1 year after abandonment. In contrast, it takes about 5.5 years to reduce about 50% of CH4 emissions for non-flooded (dry) abandoned coal mines. Additionally, it takes about 7–8 years to reduce CH4 emissions to 0% in flooded abandoned coal mines, whereas during the same period, CH4 emissions decrease by about 40% in non-flooded abandoned coal mines. This process is known as the “piston effect,” in which flooding a coal mine creates hydrostatic pressure that can trap residual CH4 within the coal. However, continued gas generation from the submerged coal bed can increase pressure in the unflooded voids above the water level, forcing gas to the surface and into the surface atmosphere. As groundwater levels rise in an abandoned, flooded coal mine, the rising groundwater behaves like a piston, displacing and forcing CH4 trapped in the coal bed, mine voids, and gobs towards the surface through fractures or mine shafts [180]. Simultaneously, the influx of water in the coal bed creates a hydrostatic pressure effect. This water fills pores, fissures, and fractures within the coal bed, significantly reducing CH4 desorption from the coal, trapping much of the gas within the coal matrix and unexploited coal beds. However, in the coal bed above the groundwater level, the residual CH4 (thermogenic) in the coal matrix desorbs through a reduction in gas pressure that exceeds the adhesive forces holding the gas in micropores.
Figure 13.
Chart showing the presumed decline curves of abandoned mine methane (AMM) emissions from flooded and dry coal mines. The curves show that AMM emissions decline faster in flooded than in dry abandoned coal mines. Adopted from Kholod et al., 2020 [182]. Reuse of this figure from Kholod et al. [182], an open access article, is permitted under Creative Commons Licence CC BY 4.0, https://creativecommons.org/licenses/by/4.0/ (accessed on 27 October 2025).
If the groundwater table continues to rise due to persistent flooding, the gas-free micropores will be filled, creating a favorable habitat for microbial life. The succeeding methanogenic process (see Table 1) perpetuates the emission cycle in the flooded abandoned coal mine. That is, the flushing of groundwater through the coal bed can reintroduce microbes and nutrients, helping to initiate and sustain biogenic CH4 production in abandoned underground coal mines [39,40]. Acetoclastic methanogenesis as a primary source of biogenic CH4 was discovered in groundwater from flooded abandoned underground coal mines and drainage water [39]. However, acetoclastic and hydrogenotrophic microbes often work in flooded abandoned coal mine. The biogenic CH4 generated in the flooded coal mine can escape to the surface over time through natural fissures, fractures, and abandoned boreholes and ventilation shafts in the overlying rock strata. Largely flooded abandoned underground coal mines have associated reduced gas reservoirs where small barometric pressure fluctuations can cause the mine to “breathe,” meaning air flows into the mine during periods of high barometric pressure, which promotes AMM emissions [183]. In contrast, dry or partially flooded abandoned underground coal mines will continue to emit biogenic CH4 to the atmosphere at rates that depend on the remaining coal, the coal’s gas content, water level, and climatic conditions [184]. Biogenic CH4 emissions from abandoned underground coal mines will increase faster than those from active underground coal mines as more mines are closed over time. For example, China has closed 12,000 to 13,000 underground coal mines from 2011 to 2019 and is projected to reach 15,000 closures by 2030 as coal supply is reduced [185]. The contribution of biogenic CH4 emissions from flooded abandoned coal mines warrants further study of the potential long-term impacts of these biogenic gas emissions and their technical/scientific mitigation.
Fugitive CH4 emissions from coal mining operations are generated by coal preparation, processing, storage, and transport facilities [1,73]. Dispersed, low-concentration fugitive CH4 emissions are released during coal handling and cleaning during preparation and transportation to market. Unintentional releases of residual CH4 from sources such as preparation plants, storage yards, bunkers or silos, and transport systems account for the total of fugitive emissions. Coal preparation is a process of crushing and cleaning raw coal to remove impurities, improving its quality and making it more suitable for market and industrial use [1,73]. Preparation includes reducing coal size through crushing and screening and removing unwanted materials such as rock, ash, and some sulfur using wet and dry methods. Wet methods involve using a liquid medium, such as washing with water, hydrocyclones to sort coal by density, and froth flotation to recover fine particles. Dry methods use airflow and vigorous shaking to separate materials, often performed before washing. The cleaned coal is dried to remove excess water. Throughout these processes at various stages of preparation, residual CH4 is released as fugitive emissions and is difficult to mitigate. Also, the organic-rich wastewater from these processes is discharged into settling or silting ponds, which are primarily physical sedimentation basins. These ponds/basins can act as “passive bioreactors” by promoting anaerobic digestion of organic matter in the accumulated sludge, which slowly emit biogenic CH4.
5.2. Sources from Coalbed Gas Development and Co-Produced Groundwater
Coalbed gas (CBM/CSG) development involves extracting natural gas from coal beds by drilling wells into the coal and pumping out groundwater to lower the hydrostatic pressure [17]. This intensive groundwater withdrawal reduces hydrostatic pressure, allowing the CH4 adsorbed onto the coal’s matrix pore and fracture systems, to be desorbed and to flow into the gas well and to the wellhead on the surface. This process creates unintended potentially large atmospheric CH4 emissions at the wellhead and co-produced water collection sites because CBM/CSG water is at peak production initially when the well starts to desorb gas (see Figure 6). The hydrostatic pressure must drop below a specific threshold (the critical desorption pressure) before CH4 can begin to detach or desorb (Langmuir model) from the coal matrix and fractures. The process requires significant groundwater withdrawal and management, as large volumes of water are co-produced. This process raises environmental concerns including impacts on groundwater-dissolved CH4 and on atmospheric CH4 emissions from surface land [17,186,187,188,189,190,191]. The co-produced groundwater is often pumped and collected into diverse, interconnected surface aquatic systems such as natural ponds or lakes, impoundments or reservoirs along alluvial plains, creeks, streams, and rivers. Major coal-producing regions, notably Qinshui and Ordos Basin (China), the Black Warrior and Powder River Basins (U.S.), and Bowen/Surat Basins (Australia), extract large volumes of co-produced water related to CBM/CSG production. China’s CBM co-produced water extraction range from 10 to 271,280 L per well per day as of 2014 [191]. Australia’s CSG-associated co-produced water extraction has stabilized to about 52,000 megaliters per year with 82% from Surat Basin as of 2025 [192]. The Powder River Basin yielded a total 1.4 billion m3 of CBM co-produced water from about 29,000 wells during the 1987–2020 period [1]. The Black Warrior Basin yield over 1.6 billion barrels CBM co-produced water from more than 2900 wells as of 2011 [193]. In the Powder River Basin, co-produced groundwater from up to 10 closely-spaced coalbed gas wells is connected to an outfall (manifold system) where water is discharged and collected in a nearby pond or impoundment (Figure 14) [17]. Here, during the 1987–2020 period, 1.08 billion m# of co-produced water with coal fines and microbiota were discharged into diverse surface aquatic environments from 29,026 CBM wells [17]. These surface aquatic environments probably became active bioreactors where distinct microbial guilds decomposed organic matter into biogenic CH4 and CO2 that were emitted. Groundwater pumped out into countless ponds/impoundments and into aquatic environments during the co-production of CH4 from coal beds worldwide is a potential source of global atmospheric CH4 emissions [186,187]. This phenomenon is highlighted by a study based on global groundwater CH4 concentrations data, which shows that sites with low-to-high methane concentrations require days to decades for unconsumed CH4 to leak into local streams, where it can escape into the atmosphere and contribute to global warming [186].
Figure 14.
(A) Map showing landscapes where water impoundments are constructed in relation to drainages and surrounding areas. Water impoundments (B) and outfalls or manifold systems (C) are in the watersheds of the Belle Fourche River, Powder River, Little Powder River, and Tongue River, which drain northward to the Yellowstone River and to the Powder River Basin, Wyoming and Montana. Cheyenne River drains east–northeast to the Missouri River (not shown). Adopted from Flores, 2014 [17]. Reuse of the figures from Flores [17] is permitted by Elsevier, Inc., as agreed to in the “3. Rights” section of the Publishing Agreement with Romeo M. Flores made on 31 August 2011.
In the Surat Basin (Walloon Coal Measures), Australia, the maximum estimated CH4 emission from coalseam gas (CSG) co-produced water is 1.88 × 10⁻³ teragrams per year (Tg/yr) using the closed-sampling method (isoflask) [186]. However, using the open-sampling method (vial), the maximum estimated CH4 emission is only 9.56 × 10⁻⁷ Tg/yr, with the difference attributed to gas loss during sampling [186]. Considering only CSG in the Surat Basin in Australia, the maximum estimated CH4 emission from co-produced water is 8.94 × 10⁻⁴ Tg/yr or 893,522 kg/yr. This study [186] suggests a maximum emission factor for CSG co-produced water based on actual dissolved gas (CH4) measurements of 0.031 tonnes per Megalitre (ML) of co-produced water. Also, this study [186] contrasted the CSG emission factor in the Surat Basin with an EPA Memorandum report that indicated co-produced water emissions for the 2020 Greenhouse Gas Intensity (GHGI) emission factors specifically for the Powder River Basin (PRB), U.S., is 0.22 lb/bbl (0.63 kg/m3) based on an assumed CH4 concentration of 542.9 mg/L at 700 ft (~213 m) well depth. This CH4 emission factor for coalbed gas (CBM) in the PRB is much higher than that for CSG co-produced water in the Surat Basin, likely due to the PRB’s freshwater origin. However, in the PRB where over 30 trillion liters were estimated to be produced, 95% of groundwater biogenic CH4 co-produced with coalbed gas is directly emitted into the atmosphere through impoundments (64%), direct discharge into aquatic environments (treated or untreated) (20%), surface irrigation for agriculture (8%), drip irrigation for agriculture (3%), and underground or subsurface injection control (5%) [1,17,187].
Methane in groundwater is in a dissolved state, much like carbonation in soda, but can also form pure gas pockets that can be released as CO2 or CH4 [1,17,188]. During gas production, groundwater rises to the surface as co-produced water, which is discharged into impoundments and aquatic systems, where decreases in atmospheric pressure and temperature cause CH4 dissolved in the water to be released. Methane emissions from groundwater pumping across the U.S., while small (0.2% of the total annual U.S. CH4 emissions relative to total global emissions), represent an important source that should be quantified and included in the global CH4 budgets [188,189,194]. A significant portion of the groundwater pumped in the U.S. comes from wells in natural gas fields and from groundwater wells in which the CH4 content is biogenic in origin [195,196,197]. The biogenic CH4 either migrated from nearby coal aquifers [196] or was partly contaminated from gas wells [197]. These studies [196,197] emphasized that biogenic CH4 emissions from groundwater withdrawal may be significant locally where groundwater CH4 concentrations are high, up to 98% in the Denver–Julesburg Basin of northeastern Colorado, U.S. [197]. In some areas, the reaction of CH4 emissions with volatile organic compounds (VOCs) results in ground- or low-level ozone formation [198]. For example, in the Powder River Basin, Wyoming, U.S., groundwater CH4 is potentially emitted from more than 3000 surface impoundments and from CH4 leaks [55] at >29,000 CBM wells [27]. CH4 interacts with VOCs likely released through natural outgassing from disturbed coal beds in 12–15 operating surface coal mines that supply 43% of U.S. coal [44,198,199]. Unintended consequences from mining activity include fuel evaporation from heavy machinery, dust-suppression chemicals, and coal-mine water [1,17], which potentially contribute to ground-level ozone formation [44,198,199].
During drilling for coalbed gas (CBM) using vertical drilling techniques, as well as specialized stimulation and completion techniques to improve gas production, varying amounts of CH4 are released from developmental gas wells. In addition to pressure drops, adsorbed CH4 in the coal is released and captured at the surface in the wellhead, where gas is also emitted. The gas is collected through a multi-tiered infrastructure network comprising gas gathering, compression, and transportation systems [17]. Potential CH4 emissions from these gas infrastructures originate from point sources at wellheads, from small-diameter gathering pipelines entering compression stations, and from feeders into larger-diameter transmission pipelines (interstate/intrastate) that transport gas over long distances to processing plants and storage facilities [17]. At the wellheads, CH4 emissions continue during the abandonment stage after production ceases. The typical lifespan of CBM wells in the U.S. is 10–20 years.
Abandoned coalbed gas wells have the potential to serve as real-time producers and emitters of biogenic CH4 as has been observed in abandoned coal mines. Real-time regeneration of biogenic CH4 in coal beds is an ongoing process in abandoned coal mines on a human timescale [39,40]. The biogenic CH4 produced from coalbed gas wells was generated in the coal aquifers in recent geologic time [22]. But new biogenic CH4 can be regenerated and reproduced in much shorter time in bioreactor coal aquifers [1,17]. This prospect has led some to argue that coalbed gas (CBM/CSG) can be considered as a renewable or sustainable resource [1,17]. The debate about renewability stems from the different rates and conditions involving continuous but slow regeneration (thousands to hundreds years) and the accumulation of economic deposits. However, significant research has successfully addressed how to accelerate biogenic CH4 production in coal “bioreactors” [1]. Methods such as pairing bioaugmentation and biostimulation by introducing an appropriate mix of specialized microbial consortia (hydrolytic bacteria and methanogens) and essential trace nutrients and electron acceptors have successfully regenerated new CH4 yields in both laboratory and field pilot tests [1]. Research shows that combining both methods maximizes the breakdown of recalcitrant carbon within coal structures, yielding the highest CH4 concentrations and the fastest production rates [17].
The precise number of total coalbed gas wells worldwide is unknown; most were drilled between the late 1990’s and the late 2000’s with production lifespans up to 20 years [17]. The lifespan indicates that a great number of these wells have ceased production and abandoned. It’s estimated that tens of thousands of coalbed gas wells exist globally based on well counts in the most productive coal basins. They include about 29,000 in the Powder River Basin (PRB) in the U.S., about 20,000 in the Western Coal Sedimentary Basin in Canada, about 18,000 in the Qinshui, Ordos, and Junggar Basins in China, and about 7500 in the Bowen and Surat Basins in Australia [1]. All these coal basins contain coals with various amounts of biogenic gas. About 5000 wells have been abandoned in the PRB. Research on potential CH4 regeneration and emissions from abandoned coalbed gas wells was demonstrated by Nivitanont [55]. A comparison of CH4 emission estimates from plugged and unplugged abandoned wells of conventional natural gas (CNG) and unconventional coalbed gas (UCG) in the U.S. is shown in Figure 15 [55]. The range of mean CH4 emissions estimates (100–1000 mg CH4/hr) for Wyoming (PRB) abandoned UCG wells is lower than for abandoned CNG wells across the entire U.S [55]. The highest CH4 emitting UCG well in the PRB is 4.53 g CH4/hr. Although the estimate of CH4 emissions from UCG abandoned wells is low, the potential for long-term emissions is high due to the biogenic origin of the gas in the PRB. Similar fugitive CH4 emissions from an abandoned coal exploration borehole in Queensland, Australia revealed a mean emission rate of 235 tonnes per annum [200].
Figure 15.
Chart showing the interquartile range of mean CH4 emissions and the whiskers signifying 95% confidence interval for the mean estimate (orange line) of conventional natural gas wells in various States compared to the unconventional coalbed gas wells in the Powder River Basin, Wyoming, from the study by Nivitanont et al. (2023) [55]. The study [55] produced this figure by compiling data from Kang et al. [201]; Townsend-Small et al. [140]; Reddick et al. [202]; Lebel et al. [203]; Saint-Vincent et al. [204]; Townsend-Small et al. [205]; and Williams et al. [206]. Reuse of this figure from Nivitanont et al. [55], an open access article, is permitted under Creative Commons Licence CC BY 4.0, http://creativecommons.org/licenses/by/4.0 (accessed on 27 October 2025). *: The EPA used the mean emissions estimates from the Townsend-Small et al. 2016 [140] for the GHGI unplugged wells “entire U.S. EFs”.
The diverse coal sources, coupled with continuous biogenic CH4 regeneration in disturbed aquifers and the imprecision of inventories that separate low-concertation CBM from CMM, creates a scenario where total mitigation is technically undetectable and economically prohibitive. Also, it creates “blind spots” in biogenic CH4 emissions.
6. Insights on “Blind Spots” in Coalbed Biogenic CH4 Emissions for Mitigation
Legacy biogenic CH4 emissions from coal mining and coalbed gas operations are critical “blind spots” because of their long-lasting impacts and significant contributions to GHG. These key “blind spots” include biogenic emissions from abandoned coal mines; mixing of biogenic CH4 from coal with other sources such as wetlands, agriculture, and landfills; CBM/CSG co-produced water; and groundwater drawdown from coal mining and coalbed gas (CBM/CSG) dewatering operations. What these legacy “blind spots” in biogenic CH4 emissions from coal have in common is the gap in basic knowledge due to limited ground-based data, which is influenced by variable coal properties (see Table 2).
The measurement/data “blind spot” relies on quantitative (e.g., number of samples, wells, mines) and qualitative (e.g., CH4 flow rates and concentrations) measurements from coal mines especially CMM emissions estimated from VAM systems for national inventories [16,30,31,55,56,59,73,74,172,199]. For some reasons this study finds that CMM emissions measurement relies primarily on its flow rates than specific coal properties in the mines. Presumably, measuring emissions requires calculating the exact mass of CH4 flushed out by multiplying the total VAM by CH4 concentrations [73]. Gas concentrations are influenced by various interrelated coal properties (see Table 2). Also, bottom-up measurements derived from ground-based data are overreported in top-down estimates and require improvements to ground-based datasets and the addressing of methodology gaps [30,31]. Often, the high variability of coal properties within and between coal beds and between coal mines is overlooked creating uncertainties in accurately estimating, forecasting, and modeling CH4 emissions. This is a significant challenge for mitigation, given that coalbed CH4 is a complex mixture of thermogenic, biogenic, and mixed gases generated from early to late stages of the geologic time. Moreover, the biogenic CH4 has been generated during recent geologic time to the present day (see Table 1). The atmospheric mixing of biogenic CH4 emissions from coal with other recently generated anthropogenic (e.g., agriculture such as cattle feedlots/grazing, piggeries) and natural sources (e.g., wetlands) is a key “blind spot” that further complicates mitigation [137,199,200]. Moreover, “blind spots” in biogenic CH4 emissions from surface coal mines, flooded abandoned coal mines, coalbed gas wells, and groundwater CH4, have been overlooked for mitigation due to being “unstructured” source of fugitive CH4 emissions.
“Unstructured” fugitive emissions, which are key “blind spots” are unintentional diffuse leaks of low-concentration biogenic CH4 emissions released from coal-associated operations, facilities, and infrastructure. These “unstructured” emissions are sporadic, diffuse, and scattered across all stages of the coal and coalbed gas production over large basin-scale landscapes. Many technologies like large-scale satellites and aerial imaging, which are designed to detect strong, concentrated “point source hotspots,” are less effective for “unstructured” emissions due to inherent limitations in spatial resolution, sensitivity, and operational constraints [4,172]. Thus, mitigation of “unstructured” biogenic CH4 emissions is difficult in many regions, particularly those with mixed coal mining, coalbed gas extraction, and agricultural/waste-related activities [137]. Here, the low-concentration signals from deep coal mining and coalbed gas extractions are drowned out by the high volume of surface biogenic CH4 (e.g., wetlands, agriculture, landfills), a phenomenon defined as Urban/Rural Isotopic Noise [198]. However, in a coal basin in Queensland, Australia, a ground-based survey of CH4 emissions of an abandoned coal exploration hole using a Quantum Gas LiDAR system did not interfere with multiple potential CH4 sources (e.g., gas wells, pipelines, processing plants, coal mines, groundwater pumping, and cattle) [207]. The abandoned coal hole was drilled to a depth of 102 m and contains 27 coal beds. The mean emission rate from 1756 measurements taken in 7 days is 235 t/a 26.9 kg/hr, which is classified as a “super emitter.” This is one legacy hole of an estimated 130,000 abandoned coal explorations in Queensland [207].
More importantly, measurements and monitoring of biogenic CH4 emissions from coal are strongly eclipsed by CMM emissions from active surface and underground coal mining operations. CMM is perceived as a major source, accounting for up to 33% of the total global fossil fuel CH4 emissions during 2008–2017 period [14]. This perception is exemplified by Figure 16 [30], which shows satellite top-down measurements of large CH4 “super emitters” (100/kg/h according to USEPA [208]) with flow rates ranging from <20 to >100 t/hr (<20,000 to >100,000 kg/hr) from global coal mine operations. Presumably, CH4 emissions are from coal mining and supply, but the sites monitored in coal basins also include coalbed gas development operations with abandoned wells. So, coal operations as used here represent the complexity and totality of CH4 emissions from coal worldwide. But it does not wholly account for the source of biogenic CH4 emissions from abandoned coal mines (AMM), which are increasing in number as active mines are closed [1].
Figure 16.
Global map showing large-scale CH4 (e.g., CMM) leaks related to coal operations (e.g., coal mining) and supply. Flow rates range from <20 to >100 t/hr, with the largest leak in the coal-producing Shanxi Province in China. Kayrros analysis based on modified Copernicus satellite data from 2019 to 2021. Adopted from IEA, 2022 [30]. Reuse of this figure from IEA [30] is permitted under Creative Commons Licence CC BY 4.0, https://www.iea.org/terms/creative-commons-cc-licenses (accessed on 27 October 2025).
6.1. Key “Blind Spot” in Biogenic CH4 Emissions from Flooded Abandoned Coal Mines
AMM accounts for a significant and growing share of global fugitive CH4 emissions, which continues for years to decades as more coal mines are closed under Global Climate change policies. Thus, AMM represents a long-lasting impact and significant legacy. Between China and the U.S., the two largest coal-producing countries have closed about 37,500 coal mines since 2015–2017 [209]. AMM is often an overlooked and forgotten source of potent CH4 emissions, estimated to contribute about 4.7 ± 0.94 Mt of CH4 annually [209,210,211,212]. This makes the abandoned coal mine CH4 emissions a major, but underreported source of atmospheric GHG. Abandoned coal mines in the European Union that have been closed since 2015 could emit 298 million cubic meters (MCM) of CH4 per year [213]. Total AMM emissions were forecast to be 17% in 2010 and increase to 24% in 2050 [182].
The CH4 emission estimates are based on the traditional concept that once coal mining ceases, groundwater pumping, used to keep the active underground mine drained, is usually halted leading to flooding of mine coals and workings. This should lead to a progressive reduction in the available AMM and, under hydrostatic pressure, to reduced gas desorption of residual CH4 molecules stored in the coal matrix. Thus, several research studies assumed that CH4 generation and desorption would cease upon flooding of the coal mine [182,183,214]. However, CH4 adsorbed in the coal cleats/fractures may be available to flow as “free gas” towards a low pressure zone, such as the atmosphere of an abandoned coal mine [1,17]. In flooded, abandoned, underground coal mines, the gas reservoir hydrostatic pressures are reduced when small barometric pressure fluctuations occur in the coal mine atmosphere. This causes the mine to “breathe,” meaning air flows into the mine during periods of high barometric pressure promoting AMM emissions [183]. This process poses a threat to coal mine safety if there is a continuous biogenic CH4 generation and buildup reach explosive conditions [32]. Thus, under this situation, mitigation is required, particularly flaring the AMM can create conflict with gas licensees in some countries [209].
The “blind spot” in the coal mine water flooding concept is that groundwater flooding also supplies nutrients that support the methanogenesis of living methanogens in the mine water, thereby biodegrading the coal and old timbers [39,40,215]. This real-time methanogenesis transformed the closed and flooded abandoned coal mines in the Ruhr and Saar region into a legacy of active and perpetual “bioreactors.” The 2004 Thielmann et al. [39] study estimated between 38% and 90% of the CH4 at 13 sites sampled within 14 months from the Ruhr basin closed and flooded abandoned coal mines is microbial in origin [40,215]. This study [39] found that four out of six coal mine water samples contained living methanogenic microorganisms with an isotopic composition of 64‰ δ13CCH4 and −439‰ δD. The study interprets biogenic CH4 production as the oxidation of organic substances (coal and/or mine timber) to carbon dioxide (CO2) by bacteria, with the CO2 reduced by archaeal methanogens. At one study site (4), CO2 levels rose after closure of the coal mine in 1929, and it’s assumed that microbial CO2 accumulated over 70 years. In addition, the radiocarbon age of the CO2 is approximately 13,000a (Years Before Present). In succeeding studies, other scientists performed isotope analysis of CH4 collected from co-generation plants in the former coal mining areas at Ruhr and Saar during the 2019–2020 period [214]. This study [214] performed isotope composition analysis of 45 samples collected from 2019 to 2020, a 1-year period, indicating that microbial CH4 (δ13CCH4, −80‰) increased by 2% at a Saar site and 4% at a Ruhr site. Also, microbial CH4 ranges from 42% to 44% at 3 sites in the Saar area and 69% to 78% in 3 sites at the Ruhr area [214].
The discovery of active CH4-generating microbes in flooded abandoned coal mines reveals a legacy of indefinite continuous, in-situ sources of CH4 emissions. That is, CH4 production does not diminish over time as previously thought by Kholod et al. [182]. This discovery shifts the flooded abandoned coal mines from passive biogenic CH4 emission sources to active, long-term or perpetual GHG threats, necessitating immediate monitoring, mitigation (e.g., flaring/capture for power generation), and serious reassessment of national carbon inventories based on more accurate and detailed data [209]. Also, real-time generation of biogenic AMM means official that data is likely underreports the actual contribution to global CH4 emission. Thus, updating the status of flooded abandoned coal mines emissions should require standard field and laboratory methodologies for assessing microbial methanogenic activity in the mine waters of flooded coal mines to ensure the accuracy of a national inventory of AMM. Often, it is assumed that when coal mines are flooded by groundwater and surface water, gas is produced for only a few years after flooding or about 7 years [182]. However, this concept was not followed in the 2017 update of the database on AMM emissions of U.S. abandoned coal mines for inventory of U.S. Greenhouse Gas Emissions and Sinks [216]. The national AMM emissions inventory prioritized non-flooded abandoned coal mines as candidates for recovery and utilization opportunities. So, 91 flooded abandoned coal mines that closed from 1990 to 2002, which generated 95–4458 kg/hr (0.35–4.5 mmcfd) of CH4 were removed from the AMM opportunities list for mitigation and were ineligible for offset credits to reduce or sequester GHG emissions.
6.2. Key “Blind Spot” in Mixing Biogenic CH4 Emissions from Subsurface Coal and Other Recent Surficial Sources
Biogenic CH4 from deep unmineable coal beds developed for CBM/CSG and from shallow mineable coal beds is overlooked as a significant sources of biogenic CH4 emissions. Deep CBM biogenic CH4 is primarily generated by reduction of CO2 with molecular hydrogen (H2), a process known as hydrogenotrophic methanogenesis [25,26]. The isotopic signatures of deep-generated hydrogenotrophic CBM mix and overlap with traditional δ13C and hydrogen isotope δD (deuterium) signatures formed by acetoclastic methanogenesis in shallow mineable coal beds. Production of these coalbed biogenic CH4 from CBM/CSG development wells and infrastructures creates complex emissions. These emissions, in turn, mix with other biogenic CH4 emissions originating from the surface, such as agriculture, landfills, and wetlands. Overlapping of these biogenic CH4 isotopic signatures can be distinguished by new analysis of clumped isotopes [142]. This gas mixing from different sources is a key “blind spot,” which makes universal mitigation technically challenging. This requires advanced analytical techniques such as measuring the abundance of doubly substituted CH4 clumped isotopes [142]. The high cost and extreme analytical complexity of these techniques render them largely unfeasible for widespread, large-scale, or routine, real-time monitoring of emission sites [142].
Another complicating factor in CBM/CSG development is the production of mixed thermogenic and biogenic CH4, specially in high-rank coals. The key to distinguishing biogenic CH4 from thermogenic CH4 is the stable carbon isotope ratio (13C/12C), but this tool cannot reliably distinguish among different types of biogenic CH4. Also, for stable isotopes, the isotope fraction is static and can be significantly altered by environmental processes. This makes it challenging to distinguish between recent microbial (biogenic) and geological (thermogenic) sources. Additionally, enrichment in 13C can result from secondary oxidation of CH4 by methanotrophs before emission, thereby making biogenic CH4 “appear” thermogenic in terms of its signature [217]. The primary method of distinguishing CH4 of different origins is stable isotope analysis, which measures the ratios of 13C to 12C and deuterium to hydrogen. Methane-generating microbes or methanogens preferentially metabolize the lighter isotope (12C) over the heavier isotope (13C) [218]. This process is the same whether the microbes are consuming carbon formed in a wetland or landfill, on agricultural land, or from coal. However, wetlands and agricultural lands contain carbon derived from recent plant remains, whereas coal carbon originated from geologically ancient plant remains with different geobiological and geochemical properties and was affected by maturation processes over geologic timescales.
An in-depth, detailed study in the Surat Basin in Queensland, Australia where CSG development is adjacent to coal mines, cattle feedlots, grazing cattle, piggeries, landfills, raw water ponds, wastewater treatment plants, and urban centers are sources of biogenic CH4 demonstrates what is possible in attribution of isotopic signatures [137]. This study shows that source attribution is possible when both δ13CCH4 and δDCH4 are measured for CSG, cattle, waste from feedlots and piggeries, and water treatment plants. However, in most field conditions, the use of δ13C CH4 alone is not possible for attribution. Measurements of both isotopic signatures will help in source apportionment where plumes are from mixed source.
Coals are composed of ancient plant remains deposited in coastal and fluvial peatlands, which were “metamorphosed” by high pressure and temperature during variable geologic and tectonic burial [1,17]. Generally, plants are classified as C3 or C4 based on how they initially fix CO2 during photosynthesis (see Table 3). The C3 plants (e.g., wheat and rice) produce a 3-carbon molecule as their first stable product, generally favored by cool, temperate climates [116,118,121]. The C4 plants (e.g., maize and sugarcane) produce a 4-carbon molecule and are better adapted to hot, sunny, dry climates. The evolution and ecological expansion of C3 and C4 plants are closely linked to geological climate shifts, particularly atmospheric CO2 concentrations. Ancient C3 plants (old carbon) and modern C4 plants (new carbon) both share low δ13C signatures, so identifying the specific, abrupt shift to C4 dominance (roughly 24–35 Ma) with C4 grassland expansion (about 5–10 M (117,119,122] can be difficult. In coal, plants are presumably more depleted in 13C than wetland and agricultural plants relative to the atmosphere (see Table 3) [134]. Ancient C3 plants, which formed coal during the Paleozoic and Mesozoic Eras, are even more depleted than modern plants using the C4 photosynthetic pathway [115,116,117,118,134,135]. Consequently, C3 plants are significantly depleted in 13C, giving them a more negative isotope 13C signature (a measure of 13C/12C ratio). The C4 plants in modern wetlands are less depleted in 13C and have more negative isotope 13C values than C3 plants, but this requires further investigation [115,116,117,118,134].
The “C4 revolution” is only clearly identifiable when C4 biomass is high, making the gradual rise of C4 plants difficult to distinguish from shifts in C3-backgrounds, often referred to as a “faint” signal [115,116,117,118,119,122,134,135]. This “blind spot” creates a major challenge in isolating “fresh” surface (e.g., wetlands, landfills) signatures from deep, reactivated ancient carbon deposits (e.g., coal) as “isotopic signals overlap” [118,119,122]. The overlap of isotopic signatures between hydrogenotrophic methanogenesis in deep coal beds and acetoclastic microbial CH4 in shallow wetlands (which can overlap in the δ13CCH4 from −65‰ to −50‰) creates a significant geochemical “blind spot” for source apportionment. This makes it difficult to identify the specific origin of biogenic CH4 when these sources are nearby [219]. Furthermore, the microbial oxidation fringe in the vadose zone acts as a dynamic filter that preferentially consumes the lighter carbon isotope (12C), causing the residual CH4 to become enriched in heavy isotopes (13C and 2H/D). This fractionation can shift the isotopic signature of biogenic CH4 toward that of thermogenic CH4, masking its original biogenic identity [220]. The ambiguity in source attribution complicates the measurement of the precise contribution of modern biogenic versus ancient sources, hampering effective mitigation of CH4 emissions.
6.3. Key “Blind Spot” in Biogenic CH4 Emissions from CBM/CSG Co-Produced Water
A significant knowledge gap in research on the source of biogenic CH4 emission is the co-production of groundwater CH4 from coal mines and coalbed gas operations. Groundwater CH4 in coal-bearing basins and regions worldwide has been underestimated and is a “blind spot” as a significant source of atmospheric biogenic CH4 emissions during coal operations [1,17,186]. Significant uncertainty surrounds the contribution of groundwater-derived biogenic CH4 to atmospheric CH4 emissions, largely because its extraction during coal operations has been overlooked in the global carbon budgets, which are estimated at 3.9 ± 6.2 mmol/m2/day or up to 70% of CH4 emissions [186,221]. Moreover, measuring and quantifying groundwater CH4 emissions are challenging due to mixing with biogenic CH4 from anthropogenic and natural sources, diverse management strategies for co-produced water, multiple and unpredictable escape pathways, variable amounts of co-produced water, and limited data due to the difficulty of measurement in many developed gas fields of coal basins. Groundwater CH4 discharge into surface aquatic systems is often diffuse and hard to quantify, making measurements of its concentration and discharge rate across locations and over time extremely difficult to obtain and thus difficult to mitigate. A large portion of the groundwater CH4 is oxidized and consumed by methanotrophic bacteria before it can escape to the atmosphere [221]. Methanotrophic bacteria consume groundwater CH4 mainly at temperatures of 15–35 °C, near neutral pH levels (6.5–7.5), and in oxidizing environments [222,223,224]. Their physiology is highly adaptable, allowing them to thrive across a broad range of subsurface conditions. Aerobic CH4 oxidation requires the presence of dissolved oxygen (between 1.0 and 8.0 mg/L dissolved oxygen) and positive Oxidation-Reduction Potential (ORP) (typically (>100 mV) [222,223,224]. These studies suggest advanced field-monitoring approaches for accurately assessing net GHG contribution. They include closed-dynamic flux chambers over groundwater discharged zones, stable isotope analysis (δ13CCH4 and δ13CCO2), and tracer tests with inert gases (e.g., sulfur hexafluoride) [225]. This microbial filter is a critical control on atmospheric emissions, but its efficiency varies, adding another layer to uncertainty in net flux estimates. Groundwater can release biogenic CH4 directly into ponds, creeks, rivers, and streams, where it is emitted into the atmosphere via diffusion and ebullition (bubbling), but both processes are highly variable [188,221]. This emission, in turn, is mixed with biogenic CH4 sourced from anthropogenic and natural sources.
A key “blind spot” in measuring CH4 emission factors from co-produced water in CBM/CSG development is reliance on ground-based data collection and analysis methods. This is exemplified by the study of the U.S. Environmental Protection Agency [USEPA, 220] study that established the 2020 Inventory of U.S. Greenhouse Gas Emissions and Sinks (GHGI) using CH4 data from CBM co-produced water. The focus is on co-produced water CH4 in the Powder River Basin (PRB), Wyoming, and Black Warrior Basin (BWB), Alabama [1,17,25,26,193,226]. For the PRB, the calculation of the 2020 GHGI used a base emission factor (EF) of 2.0522 × 10⁻⁹ Gg CH4/gallon of water drained [226]. For the BWB, the calculation of the 2020 GHGI used a base EF of 2.0694 × 10⁻³ Gg CH4/well. These EF values were estimated using an assumed CH4 concentration in co-produced water of 542.9 mg/L (0.19 lbs/bbl) at a well depth of 233 m (700 ft) [226]. This sole dataset was used to estimate EFs for CH4 emissions from co-produced water of the PRB/BWB wells from the 1900 to 2018 period. The co-produced water CH4 emissions of the PRB (43–50,005 metric tons), which are biogenic in origin, are about 3.5 times higher than the co-produced water CH4 emissions in the BWB (2768–12,796 metric tons), which are biogenic/thermogenic in origin, (Figure 17) [226]. Interestingly, the bar graphs of co-produced water CH4 emissions for both coal basins indicate relative stability and consistency, with no significant change during the 13-year period (2005–2018). Whether these patterns result from using only CH4 concentration data from water at 233 m (700 ft) well depth is unknown because details are unavailable [226]. Statistical accuracy requires a larger sample size considering that the datasets of CBM wells in the PRB include ~29,000 wells ranging from 60–914 m (198–3000 ft) in depths and in the BWB include ~5500 wells ranging from 91–726 m (300–2500 ft) in depths [25,80,218]. Thus, the dataset used to develop the 2020 U.S. GHGI may not be representative of the key co-produced water CH4 emissions, hindering efforts to track mitigation strategies and provide accurate data for future climate policy.
Figure 17.
A histogram chart showing coalbed methane (CBM) co-produced water CH4 emissions from 1990 to 2018 for the Powder River Basin (PRB) and Black Warrior Basin (BWB). The CBM co-produced water emissions were determined by USEPA (2021) [226] by combining the co-produced water yearly activity data (volume in barrels) with the co-produced water emission factors (pound/barrel) for the PRB and BWB. The bar graphs from 2005 to 2018 show the co-produced water CH4 emissions in the PRB are 3.5 times higher than in the BWB. However, over the 13-year period, the co-produced water CH4 emissions data values remain constant. The difference in the co-produced water CH4 emissions between the two basins is exclusively freshwater (Na–HCO3-type water) in the PRB and nearly potable freshwater and hypersaline water (Na–HCO3- to NaCl-type water) in the BWB [26,193]. Data compiled from USEPA [226].
6.4. Key “Blind Spot” in Biogenic CH4 Emissions from Groundwater Drawdown
Biogenic CH4 emissions from groundwater during CBM/CGS and coal mining extraction are a “blind spot” driven by the process of groundwater drawdown or water-level decline. The lowering of groundwater level is caused by pumping water from local well sites to gas-field well sites to desorb gas in coal aquifers [1,17]. During CBM/CSG development, large amounts of biogenic CH4 are gathered from gas wells, processed by gas compressors and treatment plants, and transported by pipeline networks on the surface. During this coalbed gas extraction process, large volumes of co-produced water containing dissolved CH4 are discharged into surface aquatic systems where the change in temperature and pressure causes the water to degas and CH4 diffuses out of the water at the water-air interface.
The result of extracting CBM/CSG co-produced water is groundwater drawdown. To desorb CH4 in the coal reservoirs into the well, reservoir hydrostatic pressure is reduced by pumping groundwater out of the coal aquifer, thereby desorbing and diffusing gas in the coal matrix and allowing it to flow through cleat/fractures into the borehole. Groundwater withdrawal from a coal reservoir or aquifer results in a cone of depression in the water level in the well. However, several hundred pumping wells in a coalbed gas field expand the cone of depression, causing groundwater levels to decline regionally as gas and water production increase. For example, in the central PRB, groundwater drawdown in the Big George coal is up to 305 m at the gas field’s center and covers areas from 350 to 1300 km2 (Figure 18) [1,17]. Dewatering at the 12 surface coal mines (north, middle and south mines) along the PRB eastern margin resulted in a groundwater-level decline of up to 35 m. The area of groundwater drawdown ranges from 1350 to 1650 km2 (Figure 18).
Figure 18.
Map showing groundwater drawdown of the Wyodak-Anderson coal zone consisting of one to four/five merging and splitting coal beds (aquifers) that are both mined and developed for coalbed gas during a 40-year period in the Powder River Basin, Wyoming, U.S. Groundwater drawdown caused by coal mine dewatering is shown in red contour lines at the eastern basin margin. Groundwater drawdown caused by pumping water from coalbed gas wells is shown in black contour lines basinwide. Modified from Flores and Moore [1] and Summers and Brogan [227]. Reuse of the figure originally from Summers and Brogan [227] is permitted by the article published under the public domain with the U.S. Government.
The stratigraphic connectivity of the coal zones both mined for coal and extracted for CBM (dual-role coal beds) in the PRB created a groundwater drawdown covering 52,000–56,000 km2 area (Figure 18) [1]. The groundwater drawdown began with the large-scale surface coal mining and coalbed gas extraction during the 1970s to 1980s, respectively. This combined coal operations resulted in biogenic CH4 emissions from a dense, high-impact super-emitter region characterized by significant fugitive leaks and venting. However, mitigating these intense regional biogenic CH4 emissions is technically infeasible due to a conflict of interest between two operators. This conflict is highlighted by the overlapping groundwater drawdown (Figure 18) caused by the dewatering of the coal mines (red contour lines) and CBM wells (black contour lines). The overlapping groundwater drawdown areas create a legal nightmare when assigning responsibilities for CH4 emissions to the coal operators. Also, mitigating CH4 emissions from groundwater drawdown is complicated by the long timeframe required for restoring regional groundwater levels through natural surface recharge, which may be stymied by climate change.
In summary, groundwater CH4 released during aquifer pumping such as dewatering coal beds for mining or CBM/CSG development, is often excluded from the global carbon budget. That is, it is notoriously difficult to quantify and has historically been treated as a localized water-quality or safety issue rather than a broad atmospheric emission source [13,15,192,228]. Dissolved CH4 in water is highly variable and often goes unquantified. Emissions depend heavily on pumping rates, water usage, and the physical characteristics of depressurizing water at the surface [188]. Historically, emissions reporting has been divided strictly by sector [186]. Groundwater management falls under water resource agencies, while CBM/CSG extraction or coal mining operations fall under energy and resource departments. The volume of fugitive emissions from pumping deep, gassy aquifers was assumed to be negligible compared to large-scale fugitive emissions from operational coal and gas wells [228]. However, emerging research indicates this underestimation leaves a major “blind spot” in fossil fuel-related GHG tracking [31,60]. Current scientific consensus emphasizes that widespread groundwater pumping requires systematic quantification to fully resolve the inconsistencies in worldwide GHG accounting [188]. Researchers actively call for standardized methodologies for dissolved gas measurements to accurately fold these emissions into both bottom-up inventories and top-down atmospheric inversion methods.
7. Conclusions
Methane is a potent, short-lived GHG, and its mitigation offers a rapid and significant opportunity to slow the rate of near-term global warming. Literature review indicates human activities are responsible for about 60% of total global CH4 emissions and have caused atmospheric concentrations to more than double since the pre-industrial period. Anthropogenic and natural sources (e.g., wetlands, agriculture, landfills) are significant contributors (85%) of the recent surge of biogenic or microbial CH4 emissions in the atmosphere during the last decade. The recent discovery of biogenic CH4 in coal released during various stages of coal mining and coalbed gas operations has contributed to the surge. “Unstructured” (unintended, low-concentration, and diffused fugitive emissions) sources of biogenic CH4 emissions from coal mine and coalbed gas extractions are ignored favoring traditional mitigation of CMM. This includes capturing high CH4 concentrations and expelling low CH4 concentrations VAM. Since the 1980s, the discovery of biogenic CH4 in coals has revealed that it occurs in high proportions (40–100%), dynamic, and continuous process of generation, which is mixed with thermogenic CH4 in coal reservoirs. The biogenic CH4 is commonly mixed with thermogenic CH4 in high-rank coals (bituminous and anthracite). Low-rank coals (subbituminous) commonly form biogenic CH4. The biogenic CH4 emissions from coal sources create key “blind spots” in accurate ground-based measurement of the gas and attribution of overlap isotope signatures of anthropogenic and natural sources. Most importantly, it creates “blind spots” in legacy biogenic CH4 emissions from active “bioreactors” in flooded abandoned coal mines, co-produced water/groundwater CH4 surficial collection reservoirs, and coalmine/coalbed gas wet facilities. Also, decades of extensive dewatering of the same coal aquifers in coal mines and coalbed gas wells at a basin scale create legacy groundwater drawdowns (lowering of water tables). These water depleted, regional coal aquifers take centuries to restore by surface recharge, which is stymied by climate change.
A critical “blind spot” in biogenic gas CH4 emissions is the use of ground-based measurement and analysis methods, which are affected by variable coal properties (e.g., coal rank, composition, depth, porosity/permeability), influencing gas flow rates. Measurements often are limited by the number of samples used for national inventories. The variability of coal properties in coal mines often influences the bottom-up and top-down measurements required by the UNFCCC Tier system. Bottom-up measurements frequently underestimates CH4 emissions compared to top-down satellite observations because they rely on static emission factors, miss unpredictable “super-emitter,” omit unmonitored infrastructure, and delimited by detection capabilities. Detection limits indicate that high-resolution satellites (e.g., GHGSat, SWIR) can detect individual CH4 plumes (<100 kg/hr) with precision but smaller or diffuse, low-concentration CH4 leaks from coal mine and coalbed gas operations may remain below the detection limit. Another key “blind spot” is mixing conditions of thermogenic and biogenic CH4 from deep to shallow coal beds, which also intermix with surface-generated biogenic CH4 from anthropogenic and natural sources. Although carbon (δ13C) and hydrogen (δD) isotopes of CH4 allow distinction between biogenic CH4 from different anthropogenic and natural sources, overlapping of isotope signatures and spatial resolution constraints of current remote sensing remains a significant challenge. Orbital instruments are mainly blind to isotope types when viewed in wide-angle swaths. Thus, in coal basins where coal mines, CBM/CSG wells, livestock feedlots, and water treatment plants coexist, the biogenic CH4 emissions are spatially blended into a single, massive “hot spot” signal.
The most important “blind spots” are “unstructured” biogenic CH4 emissions from coal mining and coalbed gas extractions from dual-role coal beds, which create large-scale regional diffused and dispersed emissions. These basinwide biogenic CH4 emissions from coal-based extractions intermingle with fluxes from coal mine facilities and CBM/CSG infrastructures, as well as fluxes from ranchlands and agricultural lands. CBM/CSG infrastructures (e.g., gas compressors, pipelines, treatment plants) produce dispersed and regional-scale footprints of biogenic CH4 emissions. Additionally, biogenic CH4 emissions are sourced from active, unplugged, and abandoned/orphaned wells. Coal mining facilities outside mine sites such as coal storage areas, spoil piles, preparation plants, and transportation systems, are common sources of fugitive CH4 emissions. Aquatic systems associated with coal preparation plants such as silting ponds are known as “bioreactors” that generate real-time biogenic CH4 emissions. These multiple sources of mix biogenic CH4 emissions, which are low concentration, diffuse, and scattered basinwide, make mitigation technically and economically unrealistic. The technical constraints are physical interventions of fragmented micro-leaks, which are difficult to detect, measure, and pinpoint. Economically, the capital investment to build and maintain basinwide capture systems far outweighs the value of the recovered gas.
Other critical by-products of coal mining and CBM/CSG extractions, which are major “blind spots” in biogenic CH4 emissions, are large volumes of groundwater or co-produced water with dissolved CH4 discharged into diverse surface aquatic systems from wellheads. Massive dewatering of coal aquifers associated with coal mining and CBM/CSG extractions requires thousands of closely spaced wells to depressurize and degas coal reservoirs. The co-produced water contains living archaea, bacteria, nutrients and soluble organic precursors (e.g., coal fines from drilling coal and carbonaceous beds), which are transported within various surface aquatic ecosystems. The spread of microbial communities can initiate biodegradation and methanogenesis in new, non-target areas expanding the mitigation perimeter. Another “blind spot” is that groundwater withdrawal to desorb biogenic CH4 in coal aquifers causes groundwater drawdown. The pumping of large volumes of water creates an extensive, localized drop in the water table, resulting in a cone of depression that expands over large areas and can lowering water tables in nearby agricultural or domestic water-supply wells. Also, residual biogenic CH4 in coal beds above the water table will be slowly released to the surface through wells, faults, fissures, and fractures. Mitigating the release of dissolved CH4 from groundwater during coal mining and CBM/CSG development may be viable by gas stripping through osmosis but could be inefficient and costly. Another critical mitigation method is plugging abandoned CBM/CSG wellbores with cement and mechanical plugs.
Finally, a major “blind spot” in biogenic CH4 emissions is the contribution from flooded, abandoned underground coal mines, which are often ignored as potential legacy emissions. Research on abandoned coal mines reveals flooded old-mine workings as functioning massive, long-term, passive “bioreactors” where methanogens actively metabolize coal beds and old timbers in real time. Thus, flooded, abandoned coal mine “bioreactors” are a latent perpetual engine of biogenic CH4 emissions that continue to increase as thousands more mines are closed. Repurposing biogenic CH4 emissions in flooded abandoned coal mines is a missing policy target for developing GHGI. Emerging research indicates that flooded abandoned coal mines and other “unstructured” sources of biogenic CH4 emissions from coal and coalbed gas extractions are largely uncounted in official national inventories. Research requires standardized measurement and analysis methodologies to accurately fold biogenic CH4 emissions from coal resources into both bottom-up and top-down national inventories.
Funding
This research received no external funding.
Data Availability Statement
The author confirms that the data supporting the findings of this study are available within the article.
Acknowledgments
The author wishes to express gratitude to Lisa Rukstales and Peter Warwick for their review of the original article. Also, Lisa Rukstales edited the figures. Appreciation is extended to the Journal’s editorial reviewers for significantly improving the original article.
Conflicts of Interest
Author Romeo M. Flores was employed by the company GeoSciTech Resources. The author declares that the research was conducted in the absence of any commercial or financial relationships that could be construed as a potential conflict of interest.
References
- Flores, R.M.; Moore, T. Coal and Coalbed Gas: Future Directions and Opportunities, 2nd ed.; Elsevier: Cambridge, MA, USA, 2024; 748p. [Google Scholar]
- UNFCCC. Kyoto Protocol to the United Nations Framework Convention on Climate Change; United Nation: New York, NY, USA, 1998; pp. 1–20. Available online: https://unfccc.int/resource/docs/convkp/kpeng.pdf (accessed on 27 October 2025).
- Bruhwiler, L.; Dlugokencky, E.; Masarie, K.; Ishizawa, M.; Andrews, A.; Miller, J.; Sweeney, C.; Tans, P.; Worthy, D. CarbonTracker-CH4: An assimilation system for estimating emissions of atmospheric methane. Atmos. Chem. Phys. 2014, 14, 8269–8293. [Google Scholar] [CrossRef] [Scilit]
- Schneising, O.; Burrows, J.P.; Dickerson, R.R.; Buchwitz, M.; Reuter, M.; Bovensmann, H. Remote sensing of fugitive methane emissions from oil and gas production in North American tight geologic formations. Earth’s Future 2014, 2, 548–558. [Google Scholar] [CrossRef] [Scilit]
- Vinciguerra, T.; Yao, S.; Dadzie, J.; Chittams, A.; Deskins, T.; Ehrman, S.; Dickerson, R.R. Regional air quality impacts of hydraulic fracturing and shale natural gas activity: Evidence from ambient VOC observations. Atmos. Environ. 2015, 110, 144–150. [Google Scholar] [CrossRef] [Scilit]
- Schwietzke, S.; Sherwood, O.A.; Bruhwiler, L.M.; Miller, J.B.; Etiope, G.; Dlugokencky, E.J.; Michel, S.E.; Arling, V.A.; Vaughn, B.H.; White, J.W.C.; et al. Upward revision of global fossil fuel methane emissions based on isotope database. Nature 2016, 538, 88–91. [Google Scholar] [CrossRef] [Scilit] [PubMed]
- Nisbet, E.G.; Dlugokencky, E.J.; Manning, M.R.; Lowry, D.; Fisher, R.E.; France, J.L.; Michel, S.E.; Miller, J.B.; White, J.W.C.; Vaughn, B.; et al. Rising atmospheric methane: 2007–2014 growth and isotopic shift. Glob. Biogeochem. Cycles 2016, 30, 1356–1370. [Google Scholar] [CrossRef] [Scilit]
- Michel, S.E.; Lan, X.; Miller, J.; Tans, P.; Clark, J.R.; Schaefer, H.; Sperlich, P.; Brailsford, G.; Morimoto, S.; Moossen, H.; et al. Rapid shift in methane carbon isotopes suggests microbial emissions drove record high atmospheric methane growth in 2020–2022. Proc. Natl. Acad. Sci. USA 2024, 121, e2411212121. [Google Scholar] [CrossRef] [Scilit] [PubMed]
- Xiao, H.; Song, C.; Li, S.; Lu, X.; Liang, M.; Xia, X.; Yuan, W. Global wetland methane emissions from 2001 to 2020: Magnitude, dynamics and controls. Earth’s Future 2024, 12, e2024EF00479. [Google Scholar] [CrossRef] [Scilit]
- Gumbricht, T.; Roman-Cuesta, R.M.; Verchot, L.; Herold, M.; Wittmann, F.; Householder, E.; Herold, N.; Murdiyarso, D. An expert system model for mapping tropical wetlands and peatlands reveals South America as the largest contributor. Glob. Change Biol. 2017, 23, 3581–3599. [Google Scholar] [CrossRef] [Scilit] [PubMed]
- Parmentier, F.-J.W.; Thornton, B.F.; Silyakova, A.; Christensen, T.R. Vulnerability of Arctic-Boreal methane emissions to climate change. Front. Environ. Sci. 2024, 12, 1460155. [Google Scholar] [CrossRef] [Scilit]
- Yuan, K.; Li, F.; McNicol, G.; Chen, M.; Hoyt, A.; Knox, S.; Riley, W.J.; Jackson, R.; Zhu, Q. Boreal–Arctic wetland methane emissions modulated by warming and vegetation activity. Nat. Clim. Change 2024, 14, 282–288. [Google Scholar] [CrossRef] [Scilit] [PubMed]
- Jackson, R.B.; Saunois, M.; Martinez, A.; Canadell, J.G.; Yu, X.; Li, M.; Poulter, B.; Raymond, P.A.; Regnier, P.; Ciais, P.; et al. Human activities now fuel two-thirds of global methane emissions. Environ. Res. Lett. 2024, 19, 10100. [Google Scholar] [CrossRef] [Scilit]
- Kirschke, S.; Bousquet, P.; Ciais, P.; Saunois, M.; Canadell, J.G.; Dlugokencky, E.J.; Bergamaschi, P.; Bergmann, D.; Blake, D.R.; Bruhwiler, L.; et al. Three decades of global methane sources and sinks. Nat. Geosci. 2013, 6, 813–823. Available online: https://www.nature.com/articles/ngeo1955 (accessed on 27 October 2025). [CrossRef] [Scilit]
- Saunois, M.; Stavert, A.R.; Poulter, B.; Bousquet, P.; Canadell, J.G.; Jackson, R.B.; Raymond, P.A.; Dlugokencky, E.J.; Houweling, S.; Patra, P.K.; et al. The Global Methane Budget 2000–2017. Earth Syst. Sci. Data 2020, 12, 1561–1623. [Google Scholar] [CrossRef] [Scilit]
- USEPA. Methane Emissions; U.S. Environmental Protection Agency: Washington, DC, USA, 2025. Available online: https://www.epa.gov/ghgemissions/methane-emissions (accessed on 27 October 2025).
- Flores, R.M. Coal and Coalbed Gas: Fueling the Future, 1st ed.; Elsevier: Waltham, MA, USA, 2024; 697p, ISBN 9780123969729. [Google Scholar]
- Winton, R.S.; Flanagan, N.; Richardson, C.J. Neotropical peatland methane emissions along a vegetation and biogeochemical gradient. PLoS ONE 2017, 12, e0187019. [Google Scholar] [CrossRef] [Scilit] [PubMed]
- Grunau, H.R. Natural gas in major basins worldwide attributed to source rock type, thermal history and bacterial origin. In Proceedings of the 11th World Petroleum Congress, London, UK, 28 August–2 September 1983. [Google Scholar]
- Rice, D.D.; Claypool, G.E. Generation, accumulation, and resource potential of biogenic gas. AAPG Bull. 1981, 65, 5–25. [Google Scholar] [CrossRef] [Scilit]
- Mallick, N.; Prabu, V. Energy analysis on coalbed methane (CBM) coupled power systems. J. CO2 Util. 2017, 19, 16–27. [Google Scholar] [CrossRef] [Scilit]
- Rice, D.D. Composition and origins of coalbed gas. In Hydrocarbons from Coal; Law, B.E., Rice, D.D., Eds.; AAPG Studies in Geology No. 38; American Association of Petroleum Geologists Oklahoma: Tulsa, OK, USA, 1993; pp. 159–184. [Google Scholar] [CrossRef] [Scilit]
- Bao, Y.; Hao, Y.; Guo, Z.; Hu, Y.; Li, D. Experimental research on biogenic methane generation pathway and microflora constraints based on in-situ gas-water-microbe. Fuel 2024, 377, 132828. [Google Scholar] [CrossRef] [Scilit]
- Li, Y.; Fu, H.; Su, X.; Yan, D.; Wang, G.; Yang, S.; Chen, X.; Liu, J.; Kong, J. Investigating coalbed gas productivity response from hydrogeochemical and microbial perspectives: A case study of the Liulin block, eastern Ordos Basin, China. Int. J. Coal Geol. 2025, 307, 104817. [Google Scholar] [CrossRef] [Scilit]
- Flores, R.M.; Rice, C.A.; Stricker, G.D.; Warden, A.; Ellis, M.S. Methanogenic pathways of coalbed gas in the Powder River Basin, United States: The geologic factor. Int. J. Coal Geol. 2008, 76, 52–75. [Google Scholar] [CrossRef] [Scilit]
- Rice, C.A.; Flores, R.M.; Stricker, G.D.; Ellis, M.S. Chemical and stable isotopic evidence for water/rock interaction and biogenic origin of coalbed methane, Fort Union Formation, Powder River Basin, Wyoming and Montana, USA. Int. J. Coal Geol. 2008, 76, 76–85. [Google Scholar] [CrossRef] [Scilit]
- Flores, R.M.; Spear, B.D.; Kinney, S.A.; Purchase, P.A.; Gallagher, C.M. After a Century—Revised Paleogene Coal Stratigraphy, Correlation, and Deposition, Powder River Basin, Wyoming and Montana; U.S. Geological Survey Professional Paper 1777; CD–ROM in pocket; U.S. Geological Survey: Reston, VA, USA, 2010; 97p. Available online: https://pubs.usgs.gov/pp/1777/ (accessed on 27 October 2025).
- Milkov, A.V.; Faiz, M.; Etiope, G. Geochemistry of shale gases from around the world: Composition, origins, isotope reversals and rollovers, and implications for the exploration of shale plays. Org. Geochem. 2020, 143, 103997. [Google Scholar] [CrossRef] [Scilit]
- Zhang, Y.; Miao, M.; Xu, J.; Jia, Z.; Li, Q.; Lin, Y.; Wang, M.; Wang, R. Distribution of biogenic gas reservoirs and optimization of favorable zones in the Sanhu Area, Qaidam Basin, China. Sustainability 2023, 15, 9920. [Google Scholar] [CrossRef] [Scilit]
- IEA. Curtailing Methane Emissions from Fossil Fuel Operations, Revised version; International Energy Agency: Paris, France, 2022; Available online: https://www.iea.org/reports/curtailing-methane-emissions-from-fossil-fuel-operations (accessed on 27 October 2025).
- IEA. Global Methane Tracker 2023; International Energy Agency: Paris, France, 2023; Available online: https://www.iea.org/reports/global-methane-tracker-2023 (accessed on 27 October 2025).
- Flores, R.M. Coalbed methane: From mining hazard to gas resource. Int. J. Coal Geol. 1998, 35, 3–26. [Google Scholar] [CrossRef] [Scilit]
- Flores, R.M.; Wang, G.Q.; Qin, D.F.; Xi, Y.; Rukstales, L.R. Advancing CMM drainage, quality, and utilization with horizontal directional-drilled boreholes in Duanshi Coal Mine, southern Qinshui Basin, China. Int. J. Coal Geol. 2019, 209, 1–13. [Google Scholar] [CrossRef] [Scilit]
- Tao, M.X.; Shi, B.G.; Li, J.Y.; Wang, W.C.; Li, X.B.; Gao, B. Secondary biological coalbed gas in the Xinji area, Anhui province, China: Evidence from the geochemical features and secondary changes. Int. J. Coal Geol. 2007, 71, 358–370. [Google Scholar] [CrossRef] [Scilit]
- Tang, Y.Q.; Ji, P.; Lai, G.L.; Chi, C.Q.; Liu, Z.S.; Wu, X.L. Diverse microbial community from the coalbeds of the Ordos Basin, China. Int. J. Coal Geol. 2012, 90–91, 21–33. [Google Scholar] [CrossRef] [Scilit]
- Guo, H.; Yu, Z.; Thompson, I.P.; Zhang, H. A contribution of hydrogenotrophic methanogenesis to biogenic coal bed methane reserves in Southern Qinshui Basin, China. Appl. Microbiol. Biotechnol. 2014, 98, 9083–9093. [Google Scholar] [CrossRef] [Scilit] [PubMed]
- Susilawati, R.; Evans, P.N.; Esterle, J.S.; Robbins, S.J.; Tyson, G.W.; Golding, S.D.; Mares, T.E. Temporal changes in microbial community composition during culture enrichment experiments with Indonesian coals. Int. J. Coal Geol. 2015, 137, 66–76. [Google Scholar] [CrossRef] [Scilit]
- Guo, H.; Zhang, M.; Chen, Z.; Shen, Y.; Lv, J.; Xu, X.; Yu, H. The metabolic process of methane production by combined fermentation of coal and corn straw. Bioresour. Technol. 2021, 337, 125437. [Google Scholar] [CrossRef] [Scilit] [PubMed]
- Thielemann, T.; Cramer, B.; Schippers, A. Coalbed methane in the Ruhr Basin, Germany: A renewable energy resource. Org. Geochem. 2004, 35, 1537–1549. [Google Scholar] [CrossRef] [Scilit]
- Beckmann, S.; Lueders, T.; Kruger, M.; von Netzer, F.; Engelen, B.; Cypionka, H. Acetogens and acetoclastic Methanosarcinales govern methane formation in abandoned coal mines. App. Environ. Microbiol. 2011, 77, 3749–3756. [Google Scholar] [CrossRef] [Scilit] [PubMed]
- Wormald, R.M.; Rout, S.P.; Mayes, W.; Gomes, H.; Humphreys, P.N. Hydrogenotrophic methanogenesis under alkaline conditions. Front. Microbiol. 2020, 11, 614227. [Google Scholar] [CrossRef] [Scilit] [PubMed]
- Gründger, F.; Jiménez, N.; Thielemann, T.; Straaten, N.; Lüders, T.; Richnow, H.H.; Krüger, M. Microbial methane formation in deep aquifers of a coal-bearing sedimentary basin, Germany. Front. Microbiol. 2015, 6, 200. [Google Scholar] [CrossRef] [Scilit] [PubMed]
- Bao, Y.; Wei, C.; Wang, C.; Wang, G.; Li, Q. Geochemical characteristics and generation process of Mixed biogenic and thermogenic coalbed methane in Luling Coalfield, China. Energy Fuels 2014, 28, 4392–4401. [Google Scholar] [CrossRef] [Scilit]
- Cheung, K.; Klassen, P.; Mayer, B.; Goodarzi, F.; Aravena, R. Major ion and isotope geochemistry of fluids and gases from coalbed methane and shallow groundwater wells in Alberta, Canada. Appl. Geochem. 2010, 25, 1307–1329. [Google Scholar] [CrossRef] [Scilit]
- Hayes, F.; Sharps, K.; van Caspel, W.E.; Klimont, Z.; Heyes, C.; Fagerli, H. Global efforts addressing methane emissions is a key factor to further reducing ozone-induced yield losses of crops in Europe. Environ. Pollut. 2025, 382, 126654. [Google Scholar] [CrossRef] [Scilit] [PubMed]
- Krištůfek, V.; Elhottová, D.; Chroňáková, A.; Dostálková, I.; Picek, T.; Kalčík, J. Growth strategy of heterotrophic bacterial population along successional sequence on spoil of brown coal colliery substrate. Folia Microbiol. 2005, 50, 427. [Google Scholar] [CrossRef] [Scilit] [PubMed]
- Urbanová, M.; Kopecký, J.; Valášková, V.; Ságová-Marečková, M.; Elhottová, D.; Kyselková, M.; Moënne-Loccoz, Y.; Baldrian, P. Development of bacterial community during spontaneous succession on spoil heaps after brown coal mining. FEMS Microbiol. Ecol. 2011, 78, 59–69. [Google Scholar] [CrossRef] [Scilit] [PubMed]
- Roy, R.; Mukherjee, A. Physicochemical properties and bacterial population of mine spoils in an opencast coal mine area. Proc. Natl. Acad. Sci. India Sect. B Biol. Sci. 2022, 92, 581–588. [Google Scholar] [CrossRef] [Scilit]
- Johnson, D.B. Chemical and microbiological characteristics of mineral spoils and drainage waters at abandoned coal and metal mines. Water Air Soil Pollut. Focus. 2003, 3, 47–66. [Google Scholar] [CrossRef] [Scilit]
- Akimbekov, N.S.; Digel, I.; Tastambek, K.T.; Marat, A.K.; Turaliyeva, M.A.; Kaiyrmanova, G.K. Biotechnology of microorganisms from coal environments: From environmental remediation to energy production. Biology 2022, 11, 1306. [Google Scholar] [CrossRef] [Scilit] [PubMed]
- Foght, J.M. Microbial metagenomics of oil sands tailings ponds: Small bugs, big data. Genome 2015, 58, 507–510. [Google Scholar] [CrossRef] [Scilit] [PubMed]
- Nicomrat, D.; Dick, W.A.; Tuovinen, O.H. Assessment of the microbial community in a constructed wetland that receives acid coal mine drainage. Microbiol. Ecol. 2006, 51, 83–89. [Google Scholar] [CrossRef] [Scilit] [PubMed]
- Ma, Q.; Qu, Y.Y.; Zhang, X.W.; Shen, W.L.; Liu, Z.Y.; Wang, J.W.; Zhang, Z.J.; Zhou, J.T. Identification of the microbial community composition and structure of coal-mine wastewater treatment plants. Microbiol. Res. 2015, 175, 1–5. [Google Scholar] [CrossRef] [Scilit] [PubMed]
- Ponnudurai, V.; Senthil Kumar, P.; Sankar Muthuvelu, K.; Velmurugan, S.; Subhani, S.; Arumugam, L.; Rajarathinam, R. Investigation on future perspectives of ex-situ biogenic methane generation from solid waste coal and coal washery rejects. Fuel 2022, 318, 123497. [Google Scholar] [CrossRef] [Scilit]
- Nivitanont, J.; Robertson, E.P.; Murphy, S.M.; Burkhart, M.D.; Caulton, D.R. Characterizing methane emissions from orphaned coalbed methane wells in the Powder River Basin. Environ. Res. Commun. 2023, 5, 055004. [Google Scholar] [CrossRef] [Scilit]
- National Academies of Sciences, Engineering, and Medicine. Improving Characterization of Anthropogenic Methane Emissions in the United States; The National Academies Press: Washington, DC, USA, 2018. [Google Scholar] [CrossRef] [Scilit] [PubMed]
- Shen, L.; Jacob, D.J.; Gautam, R.; Omara, M.; Scarpelli, T.R.; Lorente, A.; Zavala-Araiza, D.; Lu, X.; Chen, Z.; Lin, J. National quantifications of methane emissions from fuel exploitation using high resolution inversions of satellite observations. Nat. Commun. 2023, 14, 4948. [Google Scholar] [CrossRef] [Scilit] [PubMed]
- Miller, S.M.; Michalak, A.M.; Detmers, R.G.; Hasekamp, O.P.; Bruhwiler, L.M.P.; Schwietzke, S. China’s coal mine methane regulations have not curbed growing emissions. Nat. Commun. 2019, 10, 303. Available online: https://www.nature.com/articles/s41467-018-07891-7 (accessed on 27 October 2025). [CrossRef] [Scilit] [PubMed]
- Karacan, C.Ö.; Irakulis-Loitxate, I.; Field, R.A.; Warwick, P.D. Temporal and spatial comparison of coal mine ventilation methane emissions and mitigation quantified using PRISMA satellite data and on-site measurements. Sci. Total Environ. 2025, 975, 179268. [Google Scholar] [CrossRef] [Scilit] [PubMed]
- IEA. Global Methane Tracker 2025; International Energy Agency: Paris, France, 2025; Available online: https://www.iea.org/reports/global-methane-tracker-2025 (accessed on 27 October 2025).
- Jacob, D.J.; Turner, A.J.; Maasakkers, J.D.; Sheng, J.; Sun, K.; Liu, X.; Chance, K.; Aben, I.; McKeever, J.; Frankenberg, C. Satellite observations of atmospheric methane and their value for quantifying methane emissions. Atmos. Chem. Phys. 2016, 16, 14371–14396. [Google Scholar] [CrossRef] [Scilit]
- Jacob, D.J.; Varon, D.J.; Cusworth, D.H.; Dennison, P.E.; Frankenberg, C.; Gautam, R.; Guanter, L.; Kelley, J.; McKeever, J.; Ott, L.E.; et al. Quantifying methane emissions from the global scale down to point sources using satellite observations of atmospheric methane. Atmos. Chem. Phys. 2022, 22, 9617–9646. [Google Scholar] [CrossRef] [Scilit]
- Parker, E.; Rosario-Montalvo, I. Out-of-This-World Methane Detection: Using Satellites to Track Super Emitters; Environmental and Energy Study Institute: Washington, DC, USA, 2025; Available online: https://www.eesi.org/articles/view/out-of-this-world-methane-detection-using-satellites-to-track-super-emitters (accessed on 27 October 2025).
- Nisbet, E.G.; Allen, G.; Fisher, R.E.; France, J.L.; Lee, J.D.; Lowry, D.; Andrade, M.F.; Bannan, T.J.; Barker, P.; Bateson, P.; et al. Isotopic signatures of methane emissions from tropical fires, agriculture and wetlands: The MOYA and ZWAMPS flights. Philos. Trans. A. Math. Phys. Eng. Sci. 2022, 380, 20210112. [Google Scholar] [CrossRef] [Scilit] [PubMed]
- Drinkwater, A.; Palmer, P.I.; Feng, L.; Arnold, T.; Lan, X.; Michel, S.E.; Parker, R.; Boesch, H. Atmospheric data support a multi-decadal shift in the global methane budget towards natural tropical emissions. Atmos. Chem. Phys. 2023, 23, 8429–8452. [Google Scholar] [CrossRef] [Scilit]
- Tratt, D.M.; Buckland, K.N.; Hall, J.L.; Johnson, P.D.; Keim, E.R.; Leifer, I.; Westberg, K.; Young, S.J. Airborne visualization and quantification of discrete methane sources in the environment. Rem. Sens. Environ. 2014, 154, 74–88. [Google Scholar] [CrossRef] [Scilit]
- Vaughn, T.L.; Bell, C.S.; Pickering, C.K.; Schwietzke, S.; Heath, G.A.; Pétron, G.; Zimmerle, D.J.; Schnell, R.C.; Nummedal, D. Temporal variability largely explains top-down/bottom-up difference in methane emission estimates from a natural gas production region. Proc. Natl. Acad. Sci. USA 2018, 115, 11712–11717. [Google Scholar] [CrossRef] [Scilit] [PubMed]
- Sargent, M.R.; Floerchinger, C.; McKain, K.; Budney, J.; Gottlieb, E.W.; Hutyra, L.R.; Rudek, J.; Wofsy, S.C. Majority of US urban natural gas emissions unaccounted for in inventories. Proc. Natl. Acad. Sci. USA 2021, 118, e2105804118. [Google Scholar] [CrossRef] [Scilit] [PubMed]
- Riddick, S.N.; Mbua, M.; Santos, A.; Hartzell, W.; Zimmerle, D.J. Potential Underestimate in Reported Bottom-up Methane Emissions from Oil and Gas Operations in the Delaware Basin. Atmosphere 2024, 15, 202. [Google Scholar] [CrossRef] [Scilit]
- Alvarez, R.A.; Zavala-Araiza, D.; Lyon, D.R.; Allen, D.T.; Barkley, Z.R.; Brandt, A.R.; Davis, K.J.; Herndon, S.C.; Jacob, D.J.; Karion, A.; et al. Assessment of methane emissions from the U.S. oil and gas supply chain. Science 2018, 361, 186–188. [Google Scholar] [CrossRef] [Scilit] [PubMed]
- Zhang, Y.; Gautam, R.; Pandey, S.; Omara, M.; Maasakkers, J.D.; Sadavarte, P.; Lyon, D.; Nesser, H.; Sulprizio, M.P.; Varon, D.J.; et al. Quantifying methane emissions from the largest oil-producing basin in the United States from space. Sci. Adv. 2020, 6, eaaz5120. [Google Scholar] [CrossRef] [Scilit] [PubMed] [PubMed Central]
- Pang, Y.; Tian, L.; Hu, D.; Gao, S.; Liu, G. Separating and quantifying facility-level methane emissions with overlapping plumes for spaceborne methane monitoring. Atmos. Meas. Tech. 2025, 18, 455–470. [Google Scholar] [CrossRef] [Scilit]
- USEPA. Best Practices for Estimating Emissions Using Emissions Factors for Clean Air Act Permitting; U.S. Environmental Protection Agency: Washington, DC, USA, 2021; 7p. Available online: https://www.epa.gov/caa-permitting/clean-air-act-permitting-best-practices-documents (accessed on 27 October 2025).
- UNEP. Coal Mine Methane Science Studies Road Map; United Nations Environmental Programme: Nairobi, Kenya, 2022; Available online: https://www.unep.org/resources/other-evaluation-reportsdocuments/coal-mine-methane-science-studies-road-map (accessed on 27 October 2025).
- IPCC. 2019 Refinement to the 2006 IPCC Guidelines for National Greenhouse Gas Inventories; Intergovernmental Panel on Climate Change: Geneva, Switzerland, 2019. Available online: https://www.ipcc.ch/report/2019-refinement-to-the-2006-ipcc-guidelines-for-national-greenhouse-gas-inventories/ (accessed on 27 October 2025).
- Inagaki, F.; Hinrichs, K.-U.; Kubo, Y.; the IODP Expedition 337 Scientists. IODP Expedition 337: Deep Coalbed Biosphere off Shimokita—Microbial processes and hydrocarbon system associated with deeply buried coalbed in the ocean. Sci. Dril. 2016, 21, 17–28. [Google Scholar] [CrossRef] [Scilit]
- Trembath-Reichert, E.; Morono, Y.; Ijiri, A.; Hoshino, T.; Dawson, K.S.; Inagaki, F.; Orphan, V.J. Methyl-compound use and slow growth characterize microbial life in 2-km-deep subseafloor coal and shale beds. Proc. Natl. Acad. Sci. USA 2017, 114, E9206–E9215. [Google Scholar] [CrossRef] [Scilit] [PubMed]
- Stolper, D.A.; Lawson, M.; Davis, C.L.; Ferreira, A.A.; Santos Neto, E.V.; Lewan, M.D.; Martini, A.M.; Tang, Y.; Schoell, M.; Sessions, A.L.; et al. Formation temperatures of thermogenic and biogenic methane. Science 2014, 344, 1500–1503. [Google Scholar] [CrossRef] [Scilit] [PubMed]
- Scott, A.R.; Kaiser, W.R.; Ayers, W.B. Thermogenic and secondary biogenic gases, San Juan Basin, Colorado and New Mexico—Implications for coalbed gas producibility. AAPG Bull. 1994, 78, 1186–1209. [Google Scholar] [CrossRef] [Scilit]
- Pashin, J.C. Dynamics of thermogenic and late-stage biogenic gas generation in coalbed methane reservoirs of the Basin Warrior Basin. In Proceedings of the Society of Exploration Geophysicists, Unconventional Resources Technology Conference, Denver, Colorado, 12–14 August 2013. [Google Scholar] [CrossRef] [Scilit]
- Warwick, P.D.; Breland, F.C., Jr.; Hackley, P.C. Biogenic origin of coalbed gas in the northern Gulf of Mexico coastal plain, U.S.A. Int. J. Coal Geol. 2008, 76, 119–137. [Google Scholar] [CrossRef] [Scilit]
- Cook, T. Calculation of estimated ultimate recovery (EUR) for wells in continuous-type oil and gas accumulations. In Chapter 23 of Petroleum Systems and Geologic Assessment of Oil and Gas in the Southwestern Wyoming Province, Wyoming, Colorado, and Utah; Digital Data Series DDS–69–D; U.S. Geological Survey: Reston, VA, USA, 2005; 6p. [Google Scholar]
- Draper, J.J.; Boreham, C.J. Geological controls on exploitable coal seam gas distribution in Queensland. J. Aus. Petrol. Prod. Expl. Assoc. 2006, 46, 343–366. [Google Scholar] [CrossRef] [Scilit]
- Faiz, M.; Hendry, P. Significance of microbial activity in Australian coal bed methane reservoirs—A review. Bull. Can. Petrol. Geol. 2006, 54, 261–272. [Google Scholar] [CrossRef] [Scilit]
- Papendick, S.L.; Downs, K.R.; Vo, K.D.; Hamilton, S.K.; Dawson, G.K.W.; Golding, S.D.; Gilcrease, P.C. Biogenic methane potential for Surat Basin, Queensland coal seams. Int. J. Coal Geol. 2011, 88, 123–134. [Google Scholar] [CrossRef] [Scilit]
- Hamilton, S.K.; Golding, S.D.; Esterle, J.S.; Baublys, K.A.; Ruyobya, B.B. Controls on gas domains and production behaviour in a high-rank CSG reservoir: Insights from molecular and isotopic chemistry of co-produced waters and gases from the Bowen Basin, Australia. Geosciences 2020, 10, 74. [Google Scholar] [CrossRef] [Scilit]
- Tilley, B.; Muehlenbachs, K. Biogenic gases in the Western Canada Sedimentary Basin. Presented at the AAPG Annual Convention, San Antonio, TX, USA, 20–23 April 2008; Search and Discovery Article #80017. Available online: https://www.searchanddiscovery.com/documents/2008/08156tilley/ (accessed on 27 October 2025).
- Guo, H.; Yu, Z.; Liu, R.; Zhang, H.; Zhong, Q.; Xiong, Z. Methylotrophic methanogenesis governs the biogenic coal bed methane formation in Eastern Ordos Basin, China. Appl. Microbiol. Biotechnol. 2012, 96, 1587–1597. [Google Scholar] [CrossRef] [Scilit] [PubMed]
- Fu, H.; Yang, K.; Li, Y.; Yan, D.; Zhou, Z.; Deng, T.; Su, X.; Wang, G.; Yang, S. Geochemical and biological evidence for the presence of secondary microbial gas in anthracite: A case study in the Songta block, northern Qinshui Basin, China. Int. J. Coal Geol. 2024, 291, 104564. [Google Scholar] [CrossRef] [Scilit]
- Zhang, H.; Cai, C.; Mei, X.; Wang, D.; Liu, D.; Li, E.; Jin, J.; Zheng, M.; Tang, Y. Unrecognized extensive charge of microbial gas in the Junggar basin. Sci. Rep. 2024, 14, 11996. [Google Scholar] [CrossRef] [Scilit] [PubMed]
- Brinck, E.L.; Drever, J.I.; Frost, C.D. The geochemical evolution of water coproduced with coalbed natural gas in the Powder River Basin, Wyoming. Environ. Geosci. 2008, 15, 153–171. [Google Scholar] [CrossRef] [Scilit]
- Wang, B.; Wang, D.; Cao, W.; Li, G.; Hou, W.; Cui, X.; Hou, T.; Shi, M. Review of the hydrogeological controls on coalbed methane (CBM) and development trends. Geofluids 2021, 2021, 8298579. [Google Scholar] [CrossRef] [Scilit]
- Kirk, M.F.; Wilson, B.H.; Marquart, K.A.; Zeglin, L.H.; Vinson, D.S.; Flynn, T.M. Solute concentrations influence microbial methanogenesis in coal-bearing strata of the Cherokee Basin, USA. Front. Microbiol. 2015, 6, 1287. [Google Scholar] [CrossRef] [Scilit] [PubMed]
- Thieringer, P.H.; Honeyman, A.S.; Spear, J.R. Spatial and temporal constraints on the composition of microbial communities in subsurface boreholes of the Edgar experimental mine. Microbiol. Spectr. 2021, 9, e0063121. [Google Scholar] [CrossRef] [Scilit] [PubMed]
- Schuler, C.J.; Briscoe, L.J.; Alexander, S.C.; Alexander, E.C., Jr.; Gralnick, J.A.; Santelli, C.M.; Toner, B.M. Water and rock chemistry inform our understanding of the deep biosphere: Case study in an Archaean Banded Iron Formation. Front. Earth Sci. 2022, 10, 803250. [Google Scholar] [CrossRef] [Scilit]
- Ghani, M.J.; Rajoka, M.I.; Akhtar, K. Investigations in fungal solubilization of coal: Mechanisms and significance. Biotech. Bioprocess Eng. 2015, 20, 634–642. [Google Scholar] [CrossRef] [Scilit]
- Iram, A.; Akhtar, K.; Ghauri, M.A. Coal methanogenesis: A review of the need of complex microbial consortia and culture conditions for the effective bioconversion of coal into methane. Ann. Microbiol. 2017, 67, 275–286. [Google Scholar] [CrossRef] [Scilit]
- Raudsepp, M.J.; Gagen, E.J.; Golding, S.D.; Tyson, G.W.; Southam, G. The effect of bituminous coal on methanogenic mixed cultures and pure cultures of Methanococcus and Methanosarcina. Fuel 2017, 205, 60–70. [Google Scholar] [CrossRef] [Scilit]
- Campbell, B.C.; Greenfield, P.; Gong, S.; Barnhart, E.P.; Midgley, D.J.; Paulsen, I.T.; George, S.C. Methanogenic archaea in subsurface coal seams are biogeographically distinct: An analysis of metagenomically-derived mcrA sequences. Environ. Microbiol. 2022, 24, 4065–4078. [Google Scholar] [CrossRef] [Scilit] [PubMed]
- Sekhohola, L.M.; Igbinigie, E.E.; Cowan, A.K. Biological degradation and solubilisation of coal. Biodegradation 2013, 3, 305–318. [Google Scholar] [CrossRef] [Scilit] [PubMed]
- Chen, T. Bioavailability of Coal for Microbially Enhanced Methane Production. Ph.D. Thesis, University of Queensland, Brisbane, Australia, 2018; 243p. [Google Scholar]
- Wang, Y.; Bao, Y.; Yiliang, H. Recent progress in improving the yield of microbially enhanced coalbed methane production. Energy Rep. 2023, 9, 2810–2819. [Google Scholar] [CrossRef] [Scilit]
- Chen, T.; Rodrigues, S.; Golding, S.D.; Rudolph, V. Improving coal bioavailability for biogenic methane production via hydrogen peroxide oxidation. Int. J. Coal Geol. 2018, 195, 402–414. [Google Scholar] [CrossRef] [Scilit]
- Guo, H.; Li, X.; Zhang, J.; Huang, Z.; Urynowicz, M.A.; Liang, W. The effect of NaOH pretreatment on coal structure and biomethane production. PLoS ONE 2020, 15, e0231623. [Google Scholar] [CrossRef] [Scilit] [PubMed]
- Wei, Q.; Hu, B.; Chen, S.; Feng, S.; Wu, C.; Zheng, C. Composition, origin, and accumulation model of coalbed methane in the Panxie coal mining area, Anhui, Province, China. ACS Omega 2022, 7, 17929–17940. [Google Scholar] [CrossRef] [Scilit] [PubMed]
- Levine, J.R. Coalification: The evolution of coal as source rock and reservoir rock for oil and gas. In Hydrocarbons from Coal; Law, B.E., Rice, D.D., Eds.; AAPG Studies in Geology No. 38; American Association of Petroleum Geologists Oklahoma: Tulsa, OK, USA, 1993; pp. 1–12. [Google Scholar] [CrossRef] [Scilit]
- Townsend-Small, A.; Botner, E.C.; Jimenez, K.L.; Schroeder, J.R.; Blake, D.R.; Sive, B.C.; Bon, D.; Crawford, J.H. Using stable isotopes of hydrogen to quantify biogenic and thermogenic atmospheric methane sources: A case study from the Colorado Front Range. Geophys. Res. Lett. 2016, 43, 11462–11471. [Google Scholar] [CrossRef] [Scilit]
- Cesar, J.; Mayer, B.; Humez, P.A. novel isotopic approach to distinguish primary microbial and thermogenic gases in shallow subsurface environments. Appl. Geochem. 2021, 131, 105048. [Google Scholar] [CrossRef] [Scilit]
- Feinberg, I.; Coulon, A.; Stenke, A.; Schwietzke, S.; Peter, T. Isotopic source signatures: Impact of regional variability on the trend and spatial distribution. Atmos. Environ. 2017, 174, 99–111. [Google Scholar] [CrossRef] [Scilit]
- Garcia, A.K.; Cavanaugh, C.M.; Kacar, B. The curious consistency of carbon biosignatures over billions of years of Earth-life coevolution. ISME J. 2021, 15, 2183–2194. [Google Scholar] [CrossRef] [Scilit] [PubMed]
- Zazzeri, G.; Lowry, D.; Fisher, R.E.; France, J.L.; Lanoisellé, M.; Kelly, B.F.J.; Necki, J.M.; Iverach, C.P.; Ginty, E.; Zimnoch, M.; et al. Carbon isotopic signature of coal-derived methane emissions to the atmosphere: From coalification to alteration. Atmos. Chem. Phys. 2016, 16, 13669–13680. [Google Scholar] [CrossRef] [Scilit]
- Meyers, P.A. Why are the δ13Corg values in Phanerozoic black shales more negative than in modern marine organic matter? Geochem. Geophys. Geosyst. 2014, 15, 3085–3106. [Google Scholar] [CrossRef] [Scilit]
- Breecker, D.O.; Sharp, Z.D.; McFadden, L.D. Atmospheric CO2 concentrations during ancient greenhouse climates were similar to those predicted for A.D. 2100. Proc. Natl. Acad. Sci. USA 2010, 107, 576–580. [Google Scholar] [CrossRef] [Scilit] [PubMed]
- The Cenozoic CO2 Proxy Integration Project (CenCO2PIP) Consortium. Toward a Cenozoic history of atmospheric CO2. Science 2023, 382, eadi5177. [Google Scholar] [CrossRef] [Scilit] [PubMed]
- Osborne, C.P.; Beerling, D.J. Nature’s green revolution: The remarkable evolutionary rise of C4 plants. Philos. Trans. R. Soc. Lond. B Biol. Sci. 2006, 361, 173–194. [Google Scholar] [CrossRef] [Scilit] [PubMed]
- Edwards, E.J.; Osborne, C.P.; Stromberg, C.A.E.; Smith, S.A.; Bond, W.J.; Christin, P.A.; Cousins, A.B.; Duvall, M.R.; Fox, D.L.; Freckleton, R.P.; et al. The origins of C4 grasslands: Integrating evolutionary and ecosystem science. Science 2010, 328, 587–591. [Google Scholar] [CrossRef] [Scilit] [PubMed]
- Gowik, U.; Westhoff, P. The path from C3 to C4 photosynthesis. Plant Physiol. 2011, 155, 56–63. [Google Scholar] [CrossRef] [Scilit] [PubMed]
- Osborne, C.P.; Sack, L. Evolution of C4 plants: A new hypothesis for an interaction of CO2 and water relations mediated by plant hydraulics. Philos. Trans. R. Soc. Lond. B Biol. Sci. 2012, 367, 583–600. [Google Scholar] [CrossRef] [Scilit] [PubMed]
- Wang, C.; Guo, L.; Li, Y.; Wang, Z. Systematic comparison of C3 and C4 plants based on metabolic network analysis. BMC Syst. Biol. 2012, 6, S9. [Google Scholar] [CrossRef] [Scilit] [PubMed]
- Hare, V.J.; Loftus, E.; Jeffrey, A.; Ramsey, C.B. Atmospheric CO2 effect on stable carbon isotope composition of terrestrial fossil archives. Nat. Commun. 2018, 9, 252. [Google Scholar] [CrossRef] [Scilit] [PubMed]
- Polissar, P.J.; Rose, C.; Uno, K.T.; Phelps, S.R.; deMenocal, P. Synchronous rise of African C4 ecosystems 10 million years ago in the absence of aridification. Nat. Geosci. 2019, 12, 657–660. [Google Scholar] [CrossRef] [Scilit]
- Kirkels, F.M.S.A.; de Boer, H.J.; Concha Hernández, P.; Martes, C.R.T.; van der Meer, M.T.J.; Basu, S.; Usman, M.O.; Peterse, F. Carbon isotopic ratios of modern C3 and C4 vegetation on the Indian peninsula and changes along the plant–soil–river continuum—Implications for vegetation reconstructions. Bio. Geosci. 2022, 19, 4107–4127. [Google Scholar] [CrossRef] [Scilit]
- Nicely, J.M.; Canty, T.P.; Manyin, M.; Oman, L.D.; Salawitch, R.J.; Steenrod, S.D.; Strahan, S.E.; Strode, S.A. Changes in global tropospheric OH expected as a result of climate change over the last several decades. J. Geophys. Res. Atmos. 2018, 123, 10774–10795. [Google Scholar] [CrossRef] [Scilit]
- Liu, Y.; Yao, X.; Zhou, L.; Ming, T.; Li, W.; de Richter, R. Removal of atmospheric methane by increasing hydroxyl radicals via a water vapor enhancement Strategy. Atmosphere 2024, 15, 1046. [Google Scholar] [CrossRef] [Scilit]
- Hinrich, S.; Mikaloff Fletcher, S.E.; Veidt, C.; Lassey, K.R.; White, J.W.C. 2016A 21st-century shift from fossil-fuel to biogenic methane emissions indicated by 13CH4. Science 2016, 352, 80–84. [Google Scholar] [CrossRef] [Scilit] [PubMed]
- He, M.; Jacob, D.J.; Estrada, L.A.; Varon, D.J.; Sulprizio, M.; Balasus, N.; East, J.D.; Penn, E.; Pendergrass, D.C.; Chen, Z.; et al. Attributing 2019–2024 methane growth using TROPOMI satellite observations. Sci. Adv. 2026, 12, 15. [Google Scholar] [CrossRef] [Scilit] [PubMed]
- Basu, S.; Miller, J.B.; Lehman, S. Separation of biospheric and fossil fuel fluxes of CO2 by atmospheric inversion of CO2 and 14CO2 measurements: Observation system simulations. Atmos. Chem. Phys. 2016, 16, 5665–5683. [Google Scholar] [CrossRef] [Scilit]
- Graven, H.; Hocking, T.; Zazzeri, G. Detection of fossil and biogenic methane at regional scales using atmospheric radiocarbon. Earth’s Future 2019, 7, 283–299. [Google Scholar] [CrossRef] [Scilit] [PubMed]
- Bezyk, D.; Szugacz, D.; Strapoc, D.; Gorka, M.; Necki, J.; Sowka, I.; van der Veen, C.; Rockmann, T.; Zimnoch, M.; Paweł, J.; et al. Isotope tracing the coalbed methane migration from the underground longwall coal face to the surface of mining area. In Proceedings of the European Geosciences Union General Assembly 2024 (EGU24), Vienna, Austria, 14–19 April 2024; p. 12772. [Google Scholar] [CrossRef] [Scilit]
- Nisbet, E.G. Slaying the methane minotaur. Proc. Natl. Acad. Sci. USA 2023, 120, e2318019120. [Google Scholar] [CrossRef] [Scilit] [PubMed]
- Riddell-Young, B.; Lan, X.; Sherwood, O.A.; Schwietzke, S.; Lan, X. Global inventory of fossil and non-fossil methane δ13C and δD source signature measurements for improved atmospheric modeling, version 2025. NOAA Glob. Monit. Lab. 2025. [Google Scholar] [CrossRef]
- Gropp, J.; Bill, M.; Lloyd, M.K.; Stein, R.A.; Nayak, D.D.; Stolper, D.A. Modulation of methyl–coenzyme M reductase expression alters the isotopic composition of microbial methane. Science 2025, 389, 711–715. [Google Scholar] [CrossRef] [Scilit] [PubMed]
- Bakkaloglu, S.; Cooper, J.; Hawkes, A. Methane emissions along biomethane and biogas supply chains are underestimated. One Earth 2022, 5, 724–736. [Google Scholar] [CrossRef] [Scilit]
- Basu, S.; Agrawal, S.; Sanyal, P.; Mahato, P.; Kumar, S.; Sarkar, A. Carbon isotopic ratios of modern C3–C4 plants from the Gangetic Plain, India and its implications to paleovegetational reconstruction. Palaeogeo. Palaeoclim. Palaeoecol. 2015, 44, 22–32. [Google Scholar] [CrossRef] [Scilit]
- Dong, Y.; Cui, Y.; Wang, J.; Chen, H.; Zhang, F.; Wu, Y.; Li, Z.; Zhu, P.; Jiang, S. Paleozoic carbon cycle dynamics: Insights from stable carbon isotopes in marine carbonates and C3 land plants. Earth-Sci. Rev. 2021, 222, 103813. [Google Scholar] [CrossRef] [Scilit]
- Oh, Y.; Zhuang, Q.; Welp, L.R.; Liu, L.; Lan, X.; Basu, S.; Dlugokencky, E.J.; Bruhwiler, L.; Miller, J.B.; Michel, S.E.; et al. Improved global wetland carbon isotopic signatures support post-2006 microbial methane emission increase. Commun. Earth Environ. 2022, 3, 159. [Google Scholar] [CrossRef] [Scilit]
- Lu, X.; Harris, S.J.; Fisher, R.E.; France, J.L.; Nisbet, E.G.; Lowry, D.; Rockmann, T.; van der Veen, C.; Menoud, M.; Schwietzke, S.; et al. Isotopic signatures of major methane sources in the coal seam gas fields and adjacent agricultural districts, Queensland, Australia. Atmos. Chem. Phys. 2021, 21, 10527–10555. [Google Scholar] [CrossRef] [Scilit]
- Milkov, A.V.; Etiope, G. Revised genetic diagrams for natural gases based on a global dataset of >20,000 samples. Org. Geochem. 2018, 125, 109–120. [Google Scholar] [CrossRef] [Scilit]
- Zinder, S.H. Physiological ecology of methanogens. In Methanogenesis: Ecology, Physiology, Biochemistry & Genetics; Ferry, J.G., Ed.; Chapman & Hall Microbiology Series; Springer: Berlin/Heidelberg, Germany, 1993; pp. 128–206. ISBN 1461360137. [Google Scholar]
- Townsend-Small, A.; Ferrara, T.W.; Lyon, D.R.; Fries, A.E.; Lamb, B.K. Emissions of coalbed and natural gas methane from abandoned oil and gas wells in the United States. Geophys. Res. Lett. 2016, 43, 2283–2290. [Google Scholar] [CrossRef] [Scilit]
- Haghnegahdar, M.A.; Sun, J.; Hultquist, N.; Hamovit, N.D.; Kitchen, N.; Eiler, J.; Ono, S.; Yarwood, S.A.; Kaufman, A.J.; Dickerson, R.R.; et al. Tracing sources of atmospheric methane using clumped isotopes. Proc. Natl. Acad. Sci. USA 2023, 120, e2305574120. [Google Scholar] [CrossRef] [Scilit] [PubMed]
- Stolper, D.A.; Martini, A.M.; Clog, M.; Douglas, P.M.; Shusta, S.S.; Valentine, D.L.; Sessions, A.L.; Eiler, M. Distinguishing and understanding thermogenic and biogenic sources of methane using multiply substituted isotopologues. Geochim. Cosmochim. Acta 2015, 161, 219–247. [Google Scholar] [CrossRef] [Scilit]
- Douglas, P.M.J.; Stolper, D.A.; Eiler, J.M.; Sessions, A.L.; Lawson, M.; Shuai, Y.; Bishop, A.; Kitchen, N. Methane clumped isotopes: Progress and potential for a new isotopic tracer. Org. Geochem. 2017, 113, 262–282. [Google Scholar] [CrossRef] [Scilit]
- Wang, X.; Chen, B.; Nai, H.; Liu, C.-Q.; Dong, G.; Zhang, N.; Li, S.-L.; Gropp, J.; McIntosh, J.; Ellam, R.; et al. Clumped isotopes constrain thermogenic and secondary microbial methane origins in coal bed methane. Earth Planet. Sci. Lett. 2024, 647, 119023. [Google Scholar] [CrossRef] [Scilit]
- Whiticar, M.J.; Faber, E.; Schoell, M. Biogenic methane formation in marine and freshwater environments: CO2 reduction vs acetate fermentation—Isotope evidence. Geochim. Cosmochim. Acta 1986, 50, 693–709. [Google Scholar] [CrossRef] [Scilit]
- Wanner, P.; Parker, B.L.; Chapman, S.W.; Aravena, R.; Hunkeler, D. Quantification of degradation of chlorinated hydrocarbons in saturated low permeability sediments using compound-specific isotope analysis. Environ. Sci. Technol. 2016, 50, 5622–5630. [Google Scholar] [CrossRef] [Scilit] [PubMed]
- Strapoc, D.; Schimmelmann, A.; Mastalerz, M. Carbon isotopic fractionation of CH4 and CO2 during canister desorption of coal. Org. Geochem. 2006, 37, 152–164. [Google Scholar] [CrossRef] [Scilit]
- Niemann, M.; Whiticar, M.J. Stable isotope systematics of coalbed gas during desorption and production. Geosciences 2017, 7, 43. [Google Scholar] [CrossRef] [Scilit]
- Kinnon, E.C.P.; Golding, S.D.; Boreham, C.J.; Baublys, K.A.; Esterle, J.S. Stable isotope and water quality analysis of coal bed methane production waters and gases from the Bowen Basin, Australia. Int. J. Coal Geol. 2010, 82, 219–231. [Google Scholar] [CrossRef] [Scilit]
- Golding, S.D.; Boreham, C.J.; Esterle, J.S. Stable isotope geochemistry of coal bed and shale gas and related production waters; A review. Int. J. Coal Geol. 2013, 120, 24–40. [Google Scholar] [CrossRef] [Scilit]
- Shi, W.; Tang, S.; Zhang, S. Microbiome of high-rank coal reservoirs in the high-production areas of the southern Qinshui Basin. Microorganisms 2023, 11, 497. [Google Scholar] [CrossRef] [Scilit] [PubMed]
- Chawla, M.; Lavania, M.; Sahu, N.; Shekhar, S.; Singh, N.; More, A.; Iyer, M.; Kumar, S.; Singh, K.; Lal, B. Culture-independent assessment of the indigenous microbial diversity of Raniganj coal bed methane block, Durgapur. Front. Microbiol. 2023, 14, 1233605. [Google Scholar] [CrossRef] [Scilit] [PubMed]
- Weniger, P.; Francu, J.; Krooss, B.M.; Buzek, F.; Hemza, P.; Littke, R. Geochemical and stable carbon isotopic composition of coal-related gases from the SW Upper Silesian coal basin, Czech Republic. Org. Geochem. 2012, 53, 153–165. [Google Scholar] [CrossRef] [Scilit]
- Strapoc, D.; Picardal, F.W.; Turich, C.; Schaperdoth, I.; Macalady, J.L.; Lipp, J.S.; Lin, Y.-S.; Ertefai, T.F.; Schubotz, F.; Hinrichs, K.-U.; et al. Methane-producing microbial community in a coal bed of the Illinois Basin. Appl. Environ. Microbiol. 2008, 74, 2424–2432. [Google Scholar] [CrossRef] [Scilit] [PubMed]
- Golding, S.D.; Baublys, K.A.; Glikson, M.; Uysal, I.T.; Boreham, C.J. Source and timing of coal seam gas generation in Bowen Basin coals. In Coalbed Methane: Scientific, Environmental and Economic Evaluation; Mastalerz, M., Glikson, M., Golding, S.D., Eds.; Kluwer Academic Publishers: Dordrecht, The Netherlands, 1999; pp. 257–269. ISBN 0792356981. [Google Scholar]
- Ginty, E.M. Carbon Isotopic Evidence That Coal Derived Methane Is Altering the Chemistry of the Global Atmosphere. Bachelor’s Thesis, The University of New South Wales, Sydney, Australia, 2016; 63p. [Google Scholar]
- Li, Z.; Chen, S.; Tang, D.; Zhi, Y. Genesis and accumulation modes of coalbed methane at the eastern margin of Ordos Basin, China: Evidence from its geochemistry. ACS Omega 2024, 9, 45421–45436. [Google Scholar] [CrossRef] [Scilit] [PubMed]
- Guo, H.; Liu, R.; Yu, Z.; Zhang, H.; Yun, J.; Li, Y.; Liu, X.; Pan, J. Pyrosequencing reveals the dominance of methylotrophic methanogenesis in a coal bed methane reservoir associated with eastern Ordos Basin, China. Int. J. Coal Geol. 2012, 93, 56–61. [Google Scholar] [CrossRef] [Scilit]
- Xue, K.; Sun, B.; Liu, C. Geological controls on distribution of carbon isotope of CBM in Zhengzhuang Block, Qinshui Basin, China. Geoenergy Sci. Eng. 2024, 242, 213276. [Google Scholar] [CrossRef] [Scilit]
- Wei, M.; Yu, Z.; Zhang, H. Molecular characterization of microbial communities bioaerosols of a coal mine by 454 pyrosequencing and real-time PCR. J. Environ. Sci. 2015, 30, 241–251. [Google Scholar] [CrossRef] [Scilit] [PubMed]
- Tong, L.; Ju, Y.W.; Yang, M.; Hou, Q.L.; Zhang, W.J.; Fang, L.Z.; Yan, Z.F. Geochemical evidence of secondary biogenic and generation approach in Luling Coal Mine of Huaibei coalfield. J. China Coal Soc. 2013, 38, 288–293. Available online: https://www.researchgate.net/publication/263108528 (accessed on 27 October 2025).
- Wei, Q.; Chen, S.; Yi, W.; Gui, H.; Jiang, W.; Li, F.; Li, S. Gas content, geochemical characteristics and implications of coalbed methane from the deep area of Qi’Nan coalmine in Huaibei coalfield. Sci. Rep. 2024, 14, 28334. [Google Scholar] [CrossRef] [Scilit] [PubMed]
- Wang, A.; Wang, Q.; Shao, P.; Fu, T.; Cao, M. Simulation of biogenic coalbed gas from anthracite in the south of Qinshui Basin, China. Arab. J. Geosci. 2022, 15, 427. [Google Scholar] [CrossRef] [Scilit]
- Karacan, C.Ö.; Ruiz, F.A.; Cote, M.; Phipps, S. Coal mine methane: A review of capture and utilization practices with benefits to mining safety and to greenhouse gas reduction. Int. J. Coal Geol. 2011, 86, 121–156. [Google Scholar] [CrossRef] [Scilit]
- Karacan, C.Ö. Analysis of gob gas venthole production performances for strata gas control in longwall mining. Int. J. Rock Mech. Min. Sci. Technol. 2015, 79, 9–18. [Google Scholar] [CrossRef] [Scilit] [PubMed]
- IEA. World Energy Outlook 2019; International Energy Agency: Paris, France, 2019; Available online: https://www.iea.org/reports/world-energy-outlook-2019 (accessed on 27 October 2025).
- Tao, S.; Chen, S.; Pan, Z. Current status, challenges, and policy suggestions for coalbed methane industry development in China: A review. Energy Sci. Eng. 2019, 7, 1059–1074. [Google Scholar] [CrossRef] [Scilit]
- Yuan, L. Control of coal and gas outburst in Huainan mines in China: A review. J. Rock Mech. Geotech. Eng. 2016, 8, 559–567. [Google Scholar] [CrossRef] [Scilit]
- Ning, J.; Wang, J.; Tan, Y.; Zhang, L.; Bu, T. In situ investigations into mining-induced overburden failures in close multiple-seam longwall mining: A case study. Geomech. Eng. 2017, 12, 657–673. [Google Scholar] [CrossRef] [Scilit]
- Wei, Z.; Yin, Y.; Li, B.; Li, S.; Lin, H.; Xiao, P.; Ding, Y. Study on the fracture evolution characteristics of overlying strata in a fully mechanized mining face with a large mining height based on a three-dimensional large-scale Physical simulation experimental system. Processes 2024, 12, 2087. [Google Scholar] [CrossRef] [Scilit]
- Vigil, D.A.; Johnson, R.L., Jr.; Tauchnitz, J. Improved estimation methods for surface coal mine methane emissions for reporting, beneficial use, and emission reduction purposes and relative to Australia’s safeguard mechanisms. J. Environ. Manag. 2025, 376, 124366. [Google Scholar] [CrossRef] [Scilit] [PubMed]
- IEA. Key Findings—Global Methane Tracker 2024—Analysis; International Energy Agency: Paris, France, 2024; Available online: https://www.iea.org/reports/global-methane-tracker-2024/key-findings (accessed on 27 October 2025).
- Chauhan, A.; Raval, S. Satellite-derived approaches for coal mine methane estimation: A review. Remote Sens. 2025, 17, 3652. [Google Scholar] [CrossRef] [Scilit]
- Loksa, G. Variations in microclimate modified by open-cast mining: Case studies from Hungary. Geogr. Fis. Dianm. Quart. 2007, 40, 215–218. [Google Scholar]
- Borchardt, J.; Harris, S.J.; Hacker, J.M.; Lunt, M.; Krautwurst, S.; Bai, M.; Bösch, H.; Bovensmann, H.; Burrows, J.P.; Shakti Chakravarty, S.; et al. Insights into elevated methane emissions from an Australian open-cut coal mine using two independent airborne techniques. Environ. Sci. Tech. Lett. 2025, 12, 397–404. [Google Scholar] [CrossRef] [Scilit]
- SLR Consulting Australia. Hail Creek Mine EA Amendment, Groundwater Impact Assessment, Glencore Coal Assets Australia; Project No.: 626.30128.00000; SLR Consulting Australia: Brisbane, Australia, 2024; 109p. [Google Scholar]
- Yan, J.; Feng, X.; Guo, Y.; Jia, T.; Tan, Z. Discussion on the main control effect of geological structures on coal and gas outburst. ACS Omega 2022, 8, 835–845. [Google Scholar] [CrossRef] [Scilit] [PubMed]
- Liu, A.; Liu, S.; Wang, G.; Elsworth, D. Predicting fugitive gas emissions from gob-to-face in longwall coal mines: Coupled analytical and numerical modeling. Int. J. Heat Mass Trans. 2020, 150, 119392. [Google Scholar] [CrossRef] [Scilit]
- Wang, F.; Ren, T.X.; Hungerford, F.; Tu, S.; Aziz, N. Advanced directional drilling technology for gas drainage and exploration in Australian coal mines. Procedia Eng. 2011, 26, 25–36. [Google Scholar] [CrossRef] [Scilit]
- Liu, Q.; Cheng, Y.; Yuan, L.; Fang, Y.; Shi, D.; Kong, S. A new effective method and new materials for high sealing performance of cross-measure CMM drainage boreholes. J. Nat. Gas Sci. Eng. 2014, 21, 805–813. [Google Scholar] [CrossRef] [Scilit]
- Leśniak, G.; Brunner, D.J.; Topór, T.; Stota-Valim, M.; Cicha-Szot, R.; Jura, B.; Skiba, J.; Przystolik, A.; Lyddall, B.; Plonka, G. Application of long-reach directional drilling boreholes for gas drainage of adjacent seams in coal mines with severe geological conditions. Int. J. Coal Sci. Technol. 2022, 9, 88. [Google Scholar] [CrossRef] [Scilit]
- Kholod, N.; Evans, M.; Pilcher, R.; Roshchanka, V.; Ruiz, F.; Coté, M.; Collings, R. Global methane emissions from coal mining to continue growing even with declining coal production. J. Clean. Prod. 2020, 256, 120489. [Google Scholar] [CrossRef] [Scilit] [PubMed]
- Shi, J.-Q.; Rubio, R.M.; Durucan, S. An improved void-resistance model for abandoned coal mine gas reservoirs. Int. J. Coal Geol. 2016, 165, 257–264. [Google Scholar] [CrossRef] [Scilit]
- Coté, M.M. Abandoned Coal Mine Emissions Estimation Methodology. In Proceedings of the Second International Methane Mitigation Conference, Novosibirsk, Russia, 18–23 June 2000. [Google Scholar]
- Peng, Y.; Guo, J.; Gao, J.; Zhang, B.; Yan, K. China’s coal mine closures from 2011 to 2019: Unintended water benefits. Ener. Nexus 2025, 18, 100412. [Google Scholar] [CrossRef] [Scilit]
- Pearce, J.K.; Hofmann, H. Potential methane emissions from aquifer and coal seam gas groundwater extraction: Effect of open and closed sampling methods and new emission factors. J. Hydrol. 2025, 658, 133228. [Google Scholar] [CrossRef] [Scilit]
- National Academies Sciences and Engineering. Management and effects of coalbed methane produced water in the western United States. In Chapter 2, Coalbed Methane Produced Water in Western U.S. Basins: Hydrological and Geochemical Foundations; National Academies Press: Washington, DC, USA, 2010; pp. 19–55. Available online: https://www.nationalacademies.org/publications/12915 (accessed on 27 October 2025).
- Kulongoski, J.T.; McMahon, P.B. Methane emissions from groundwater pumping in the USA. npj Clim. Atmos. Sci. 2019, 2, 11. [Google Scholar] [CrossRef] [Scilit]
- Powder River Basin, Resource Council. Powder River Welcomes EPA’s Methane Rule; PRB Resource Council: Manila, Philippines, 2020; Available online: https://powderriverbasin.org/2023/12/04/powder-river-welcomes-epas-methane-rule/ (accessed on 27 October 2025).
- Neininger, B.G.; Kelly, B.F.J.; Hacker, J.M.; Lu, X.; Schwietzke, S. Coal seam gas industry methane emissions in the Surat Basin, Australia: Comparing airborne measurements with inventories. Philos. Trans. R. Soc. A Math. Phys. Eng. Sci. 2021, 379, 2020045. [Google Scholar] [CrossRef] [Scilit] [PubMed]
- Meng, Y.; Tang, D.; Xu, H.; Li, Y.; Gao, L. Coalbed methane produced water in China: Status and environmental issues. Environ. Sci. Pollut. Res. Int. 2014, 21, 6964–6974. [Google Scholar] [CrossRef] [Scilit] [PubMed]
- OGIA. Underground Water Impact Report for the Surat Cumulative Management Area; Department of Local Government, Water and Volunteers, Queensland Government, Office of Groundwater Impact Assessment: Brisbane, Australia, 2025; 234p. [Google Scholar]
- Pashin, J.C.; McIntyre-Redden, M.R.; Mann, S.D.; Kopaska Merkel, D.C. Water Management Strategies for Improved Coalbed Methane Production in the Black Warrior Basin; United States Department of Energy and National Energy Technology Laboratory Final Report; DOE Award No. DE-FE0000888; Geological Survey of Alabama: Tuscaloosa, AL, USA, 2011; 159p.
- Day, S.; Ong, C.; Rodger, A.; Etheridge, D.; Hibberd, M.; van Gorsel Spencer, D.; Krummel, P.; Zegelin, S.; Fry, R.; Dell’Amico, M.; et al. Characterisation of Regional Fluxes of Methane in the Surat Basin, Queensland: Phase 2: A Pilot Study of Methodology to Detect and Quantify Methane Sources; Report for the Gas Industry Social and Environmental Research Alliance (GISERA), Project No GAS1315 2015, EP 15369; CSIRO: Acton, Australia, 2015. Available online: https://gisera.csiro.au/wp-content/uploads/2018/03/GHG-1-Phase-2-Report.pdf (accessed on 27 October 2025).
- Heinze, B.M.; Schwab, V.F.; Kusel, K.; Schloemer, S.; Roskam, A.; Xu, X.; Trumbore, S. Microbial oxidation significantly reduces methane export from global groundwaters. Proc. Natl. Acad. Sci. USA 2025, 122, 12. [Google Scholar] [CrossRef] [Scilit] [PubMed]
- Li, H.; Carlson, K. Distribution and origin of groundwater methane in the Wattenberg oil and gas field of northern Colorado. Environ. Sci. Technol. 2014, 48, 1484–1491. [Google Scholar] [CrossRef] [Scilit] [PubMed]
- Stanish, L.F.; Sherwood, O.A.; Lackey, G.; Osborn, S.; Robertson, C.E.; Harris, J.K.; Pace, N.; Ryan, J.N. Microbial and biogeochemical indicators of methane in groundwater aquifers of the Denver Basin, Colorado. Environ. Sci. Technol. 2021, 55, 292–303. [Google Scholar] [CrossRef] [Scilit] [PubMed]
- Lattanzio, R.K. Methane and other air pollution issues in natural gas systems. Cong. Res. Serv. 2020, 26, R42986. Available online: https://www.congress.gov/crs-product/R42986 (accessed on 27 October 2025).
- USEPA. Overview of Greenhouse Gases; United States Environmental Protection Agency: Washington, DC, USA, 2015. Available online: https://www.epa.gov/ghgemissions/overview-greenhouse-gases (accessed on 27 October 2025).
- Navarro, A.B.; Rona, A.R.; McGill, J.; Newton, J.; Branston, C.J.; Capilla-Lasheras, P.; Silveira, L.F.; Dominoni, D.M. Urbanisation is associated with changes in stable isotopes across multiple trophic levels. Isot. Environ. Health Stud. 2025, 17, 1–18. [Google Scholar] [CrossRef] [Scilit] [PubMed]
- Kang, M.; Christian, S.; Celia, M.A.; Mauzerall, D.L.; Bill, M.; Miller, A.R.; Chen, Y.; Conrad, M.E.; Darrah, T.H.; Jackson, R.B. Identification and characterization of high methane-emitting abandoned oil and gas wells. Proc. Natl. Acad. Sci. USA 2016, 113, 13636–13641. [Google Scholar] [CrossRef] [Scilit] [PubMed]
- Riddick, S.N.; Mauzerall, D.L.; Celia, M.A.; Kang, M.; Bressler, K.; Chu, C.; Gum, C.D. Measuring methane emissions from abandoned and active oil and gas wells in West Virginia. Sci. Total. Environ. 2019, 651, 1849–1856. [Google Scholar] [CrossRef] [Scilit] [PubMed]
- Lebel, E.D.; Lu, H.S.; Vielstädte, L.; Kang, M.; Banner, P.; Fischer, M.L.; Jackson, R.B. Methane Emissions from Abandoned Oil and Gas Wells in California. Environ. Sci. Technol. 2020, 54, 14617–14626. [Google Scholar] [CrossRef] [Scilit] [PubMed]
- Saint-Vincent, P.M.; Sams, J.I.; Reeder, M.D.; Mundia-Howe, M.; Veloski, G.A.; Pekney, N.J. Historic and modern approaches for discovery of abandoned wells for methane emissions mitigation in Oil Creek State Park, Pennsylvania. J. Environ. Manag. 2021, 280, 111856. [Google Scholar] [CrossRef] [Scilit] [PubMed]
- Townsend-Small, A.; Hoschouer, J. Direct measurements from shut-in and other abandoned wells in the Permian Basin of Texas indicate some wells are a major source of methane emissions and produced water. Environ. Res. Lett. 2021, 16, 054081. [Google Scholar] [CrossRef] [Scilit]
- Williams, J.P.; Regehr, A.; Kang, M. Methane Emissions from Abandoned Oil and Gas Wells in Canada and the United States. Environ. Sci. Technol. 2020, 55, 563–570. [Google Scholar] [CrossRef] [Scilit] [PubMed]
- Hoerning, S.; Hayes, P. Measurement of fugitive methane emissions from an abandoned coal exploration hole in Queensland, Australia using a Quantum Gas LiDAR. Sci. Total Environ. 2025, 992, 179925. [Google Scholar] [CrossRef] [Scilit] [PubMed]
- USEPA. Methane Supper Emitter Program; United States Environmental Protection Agency: Washington, DC, USA, 2025. Available online: https://www.epa.gov/compliance/methane-super-emitter-program (accessed on 27 October 2025).
- UNECE. Best Practice Guidance for Effective Methane Recovery and Use from Abandoned Coal Mines; ECE Energy Series No. 64; United Nations Economic Commission for Europe: Geneva, Switzerland, 2019; ISBN 978-92-1-117216.
- Liu, Y.; Gao, H.; Yu, Z.; Li, C.; Ren, H.; Zhao, Y.; Huang, F.; Guo, Y.; Wan, M.; Tian, J.; et al. Managing methane emissions in abandoned coal mines: Comparison of different recovery technologies by integrating techno-economic analysis and life-cycle assessment. Environ. Sci. Technol. 2022, 56, 13900–13908. [Google Scholar] [PubMed]
- Kang, Y.; Tian, P.; Li, J.; Wang, H.; Feng, K. Methane mitigation potentials and related costs of China’s coal mines. Fundam. Res. 2023, 4, 688–1695. [Google Scholar] [CrossRef] [Scilit] [PubMed]
- Mei, D.; Lerman, S. The Hidden Threat: Abandoned Coal Mine Methane Emissions in EU; Global Energy Monitor (GEM): San Francisco, CA, USA, 2024; Available online: https://globalenergymonitor.org/research/hidden-threat-abandoned-coal-mine-methane-emissions-eu (accessed on 27 October 2025).
- Imgrund, T.; Orzol, R. Gutachten zur Grubengasgewinnung in Nordrhein-Westfalen; PFG-Nr. 352019; Ministerium für Wirtschaft, Innovation, Digitalisierung und Energie des Landes Nordrhein-Westfalen (MWIDE): Düsseldorf, Germany, 2020; 51p, Available online: https://www.wirtschaft.nrw/sites/default/files/documents/2020-06-0029877.pdf (accessed on 27 October 2025).
- Möllerherm, S.; Melchers, C. The influence of mine water rebound on methane degassing in abandoned coal mines. In Mine Water Management for Future Generations; Stanley, P., Wolkersdorfer, C., Wolkersdorfer, K., Eds.; IMWA: Wendelstein, Germany, 2021; pp. 359–364. [Google Scholar]
- Krüger, M.; Beckmann, S.; Engelen, B.; Thielemann, T.; Cramer, B.; Schippers, A.; Cypionka, H. Microbial methane formation from hard coal and timber in an abandoned coal mine. Geomicrobiol. J. 2008, 25, 315–321. [Google Scholar] [CrossRef] [Scilit]
- USEPA. Abandoned Coal Mine Methane Opportunities Database; EPA 430-R21-0908; U.S. Environmental Protection Agency: Washington, DC, USA, 2017; 24p. Available online: https://www.epa.gov/sites/default/files/2016-03/documents/amm_opportunities_database.pdf (accessed on 27 October 2025).
- Kuloyo, O.; Ruff, S.E.; Cahill, A.; Connors, L.; Zorz, J.K.; Hrabe de Angelis, I.; Nightingale, M.; Mayer, B.; Strous, M. Methane oxidation and methylotroph population dynamics in groundwater mesocosms. Environ. Microbiol. 2020, 22, 1222–1237. [Google Scholar] [CrossRef] [Scilit] [PubMed]
- Susilawati, R.; Golding, S.D.; Baublys, K.A.; Esterle, J.S.; Hamilton, S.K. Carbon and hydrogen isotope fractionation during methanogenesis: A laboratory study using coal and formation water. Int. J. Coal Geol. 2016, 162, 108–122. [Google Scholar] [CrossRef] [Scilit]
- Chen, R.; Bao, Y.; Zhang, Y. A Review of biogenic coalbed methane experimental studies in China. Microorganisms 2023, 11, 304. [Google Scholar] [CrossRef] [Scilit] [PubMed]
- Vigneron, A.; Bishop, A.; Alsop, E.B.; Hull, K.; Rhodes, I.; Hendricks, R.; Head, I.M.; Tsesmetzis, N. Microbial and isotopic evidence for methane cycling in hydrocarbon-containing groundwater from the Pennsylvania region. Front. Microbiol. 2017, 8, 593. [Google Scholar] [CrossRef] [Scilit] [PubMed]
- Maglaya, R.C.; Sadat-Noori, M.; Andersen, M.S. Groundwater discharge: A major driver of global methane emissions from aquatic environments. Earth Sys. Environ. 2025, 10, 2693–2705. [Google Scholar] [CrossRef] [Scilit]
- Guerrero-Cruz, S.; Vaksmaa, A.; Horn, M.A.; Niemann, H.; Pijuan, M.; Ho, A. Methanotrophs: Discoveries, environmental relevance, and a perspective on current and future applications. Front. Microbiol. 2021, 12, 678057. [Google Scholar] [CrossRef] [Scilit] [PubMed]
- Amils, R. Methanotroph. In Encyclopedia of Astrobiology, 3rd ed.; Gargaud, M., Irvine, W.M., Amils, R., Claeys, P., Cleaves, H.J., Gerin, M., Rouan, D., Spohn, T., Tirard, S., Viso, M., Eds.; Springer: Berlin/Heidelberg, Germany, 2023. [Google Scholar] [CrossRef] [Scilit]
- Yao, X.; Wang, J.; Hu, B. How methanotrophs respond to pH: A review of ecophysiology. Front. Microbiol. 2023, 13, 1034164. [Google Scholar] [CrossRef] [Scilit] [PubMed]
- Hall, K.R.; Weber, T.S.; Stock, M.P.; Buursink, M.L.; Piao, H.; Zhu, M.; Walter Anthony, K.M.; Petrenko, V.V. New measurements indicate that natural geologic methane emissions from microseepage in the Michigan Basin are likely negligible. Elem. Sci. Anthr. 2026, 14, 00058. [Google Scholar] [CrossRef] [Scilit]
- USEPA. Inventory of U.S. Greenhouse Gas Emissions and Sinks 1990–2019: Updates from Produced Water Emissions; U.S. Environmental Protection Agency: Washington, DC, USA, 2021; 9p. Available online: https://www.epa.gov/sites/default/files/2021-04/documents/2021_ghgi_update_-_water.pdf (accessed on 27 October 2025).
- Summers, P.; Brogan, M. Powder River Basin Coal Review: 2017 PRB Groundwater Model, Addendum to the 2014 Coal Review Task 1B Report: Current Water Resources Conditions. Bureau of Land Management; High Plains District Office and Wyoming State Office: Casper, WY, USA, 2017.
- Guerra, K.; Daqhm, K.; Dundorf, S. Oil and Gas Produced Water Management and Beneficial Use in the Western United States; Science and Technology Program Report No. 157; U.S. Department of Interior Bureau of Reclamation: Washington, DC, USA, 2011; 113p.
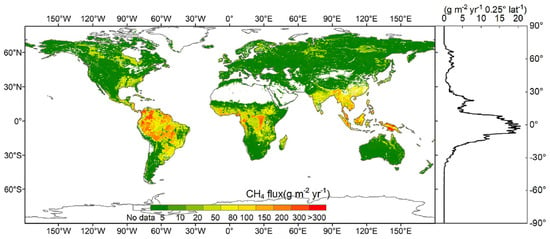
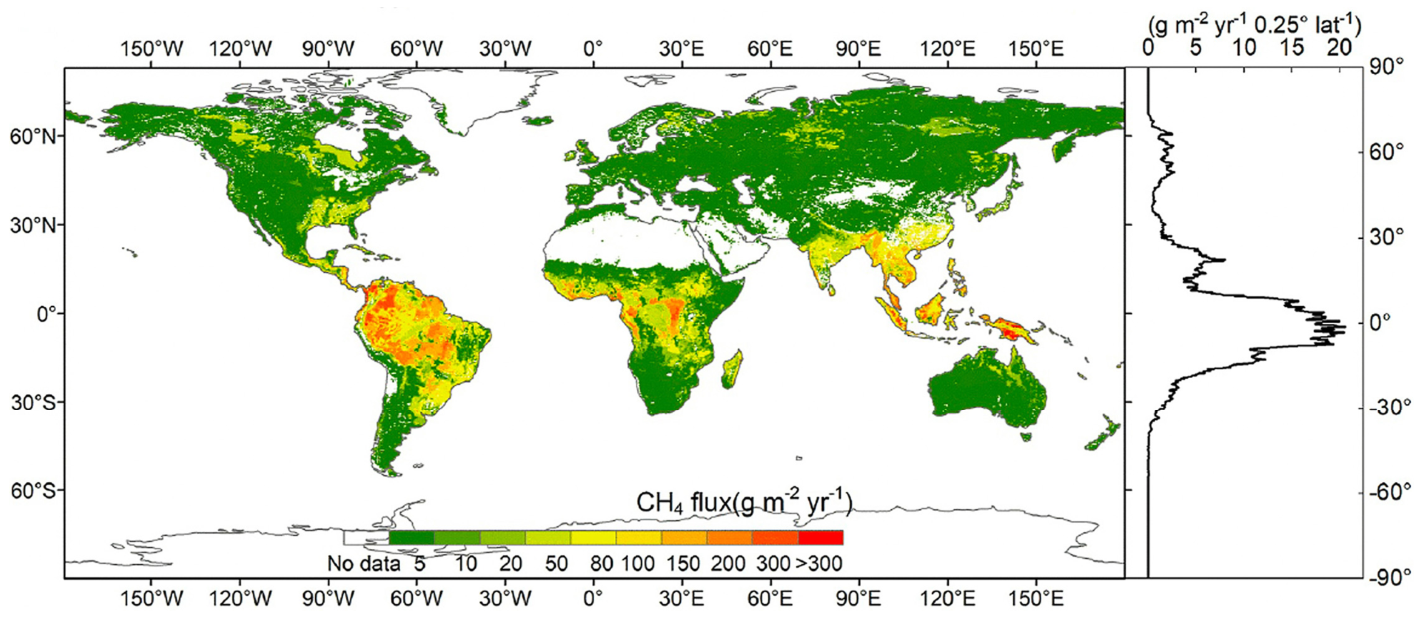
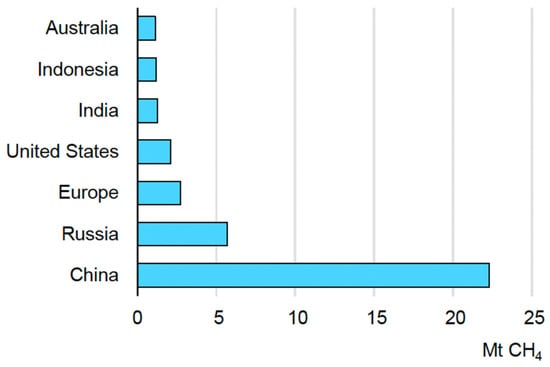
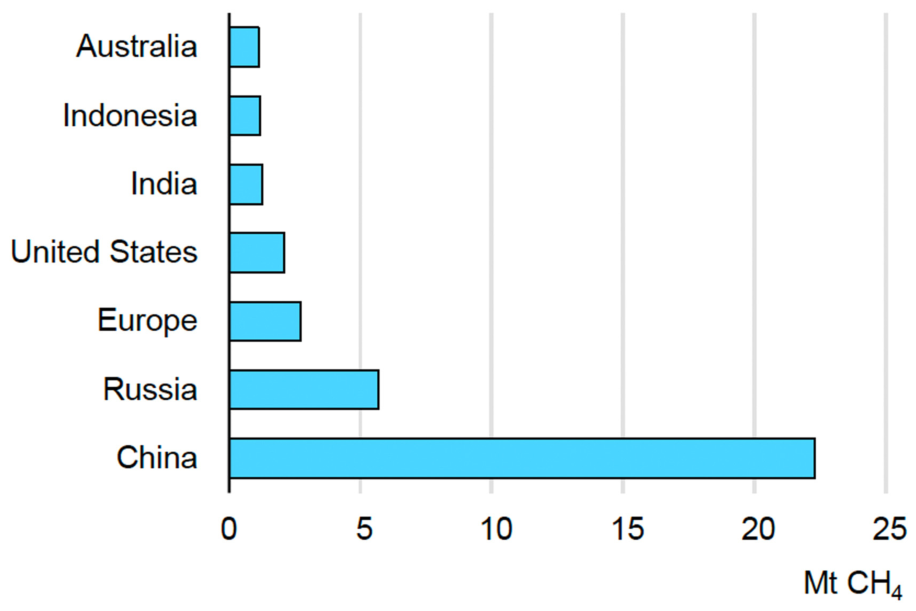
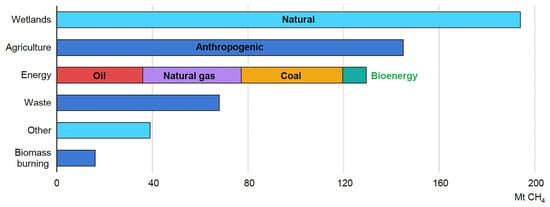
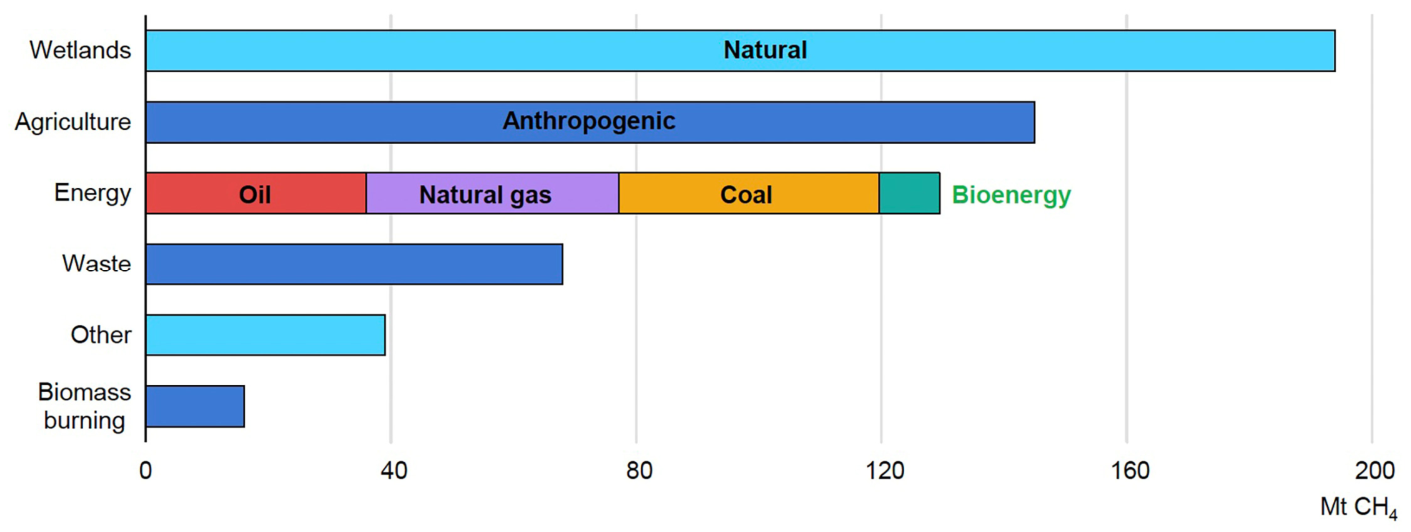
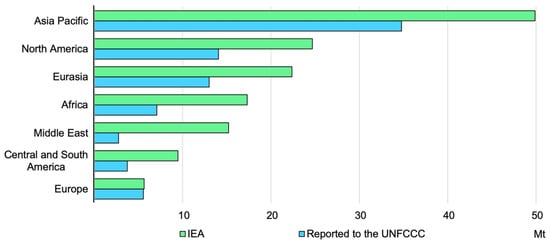
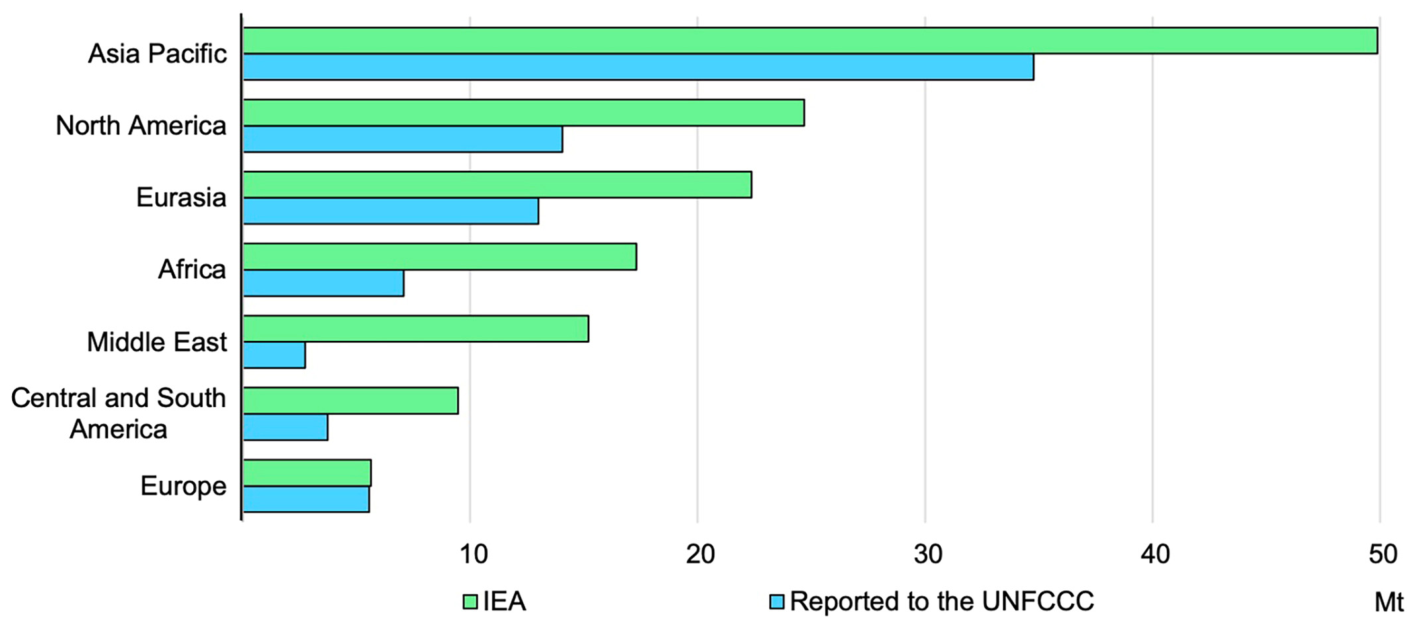
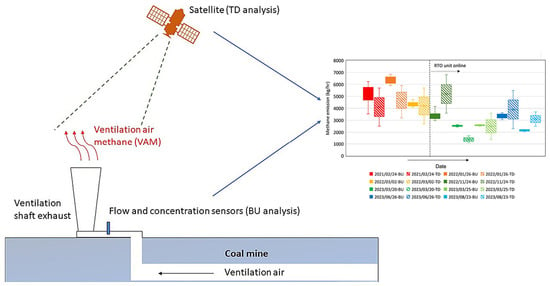
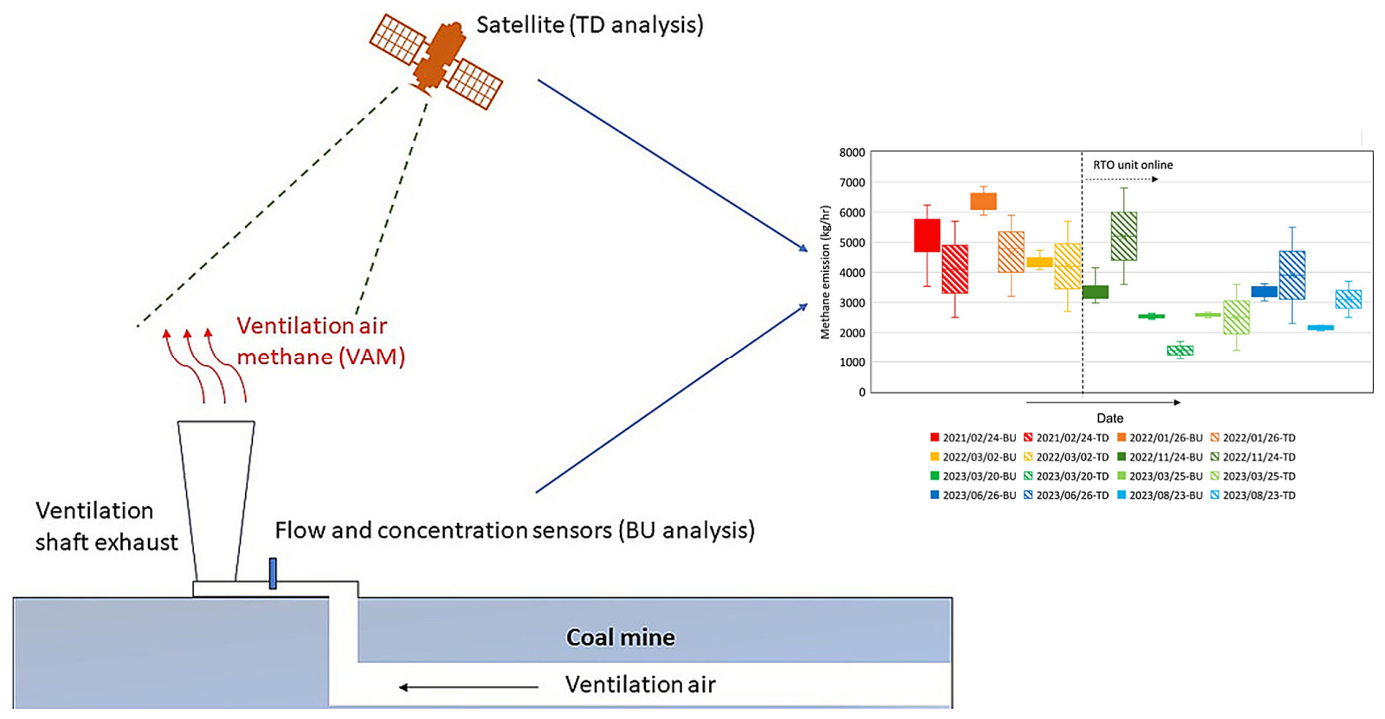
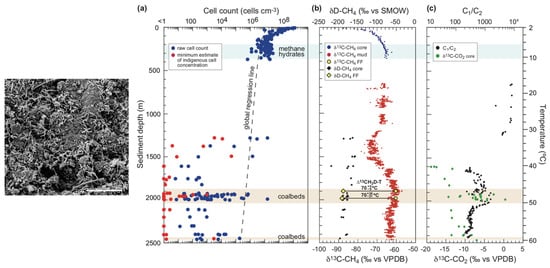
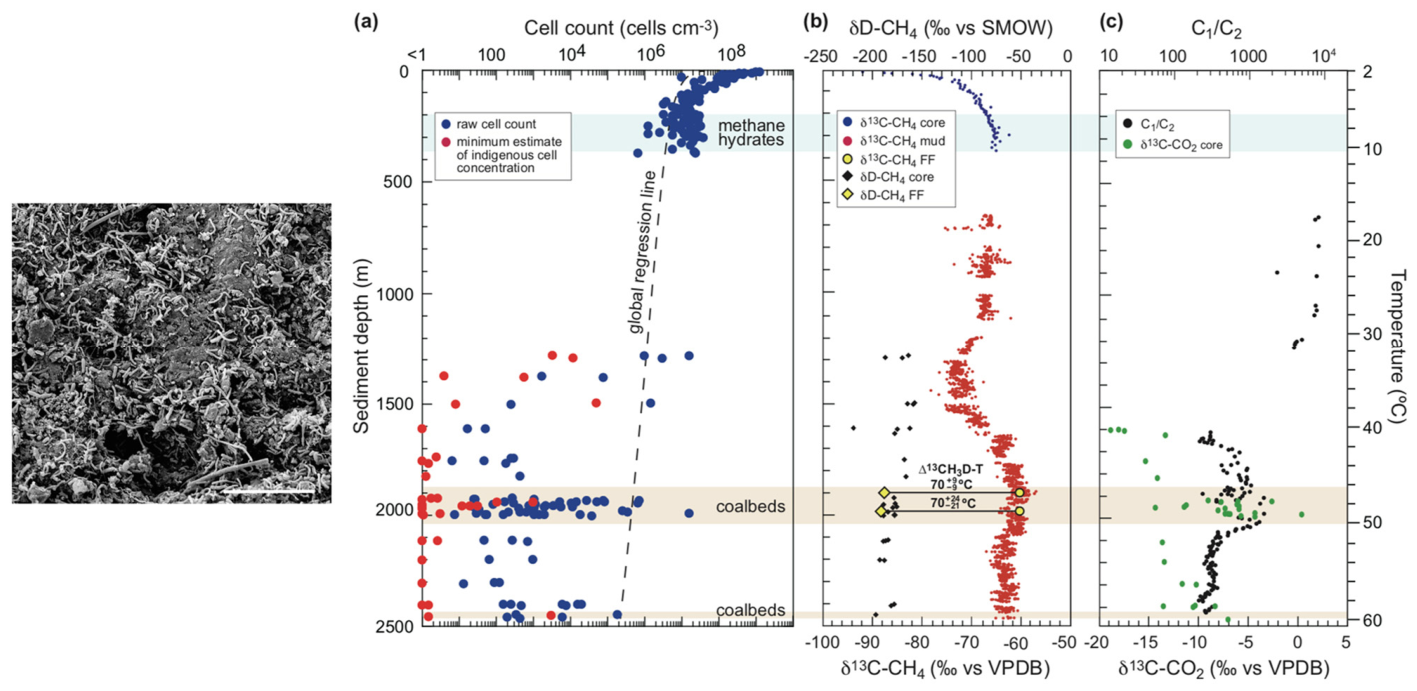
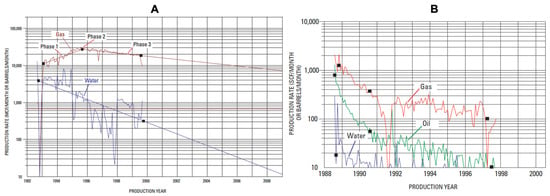
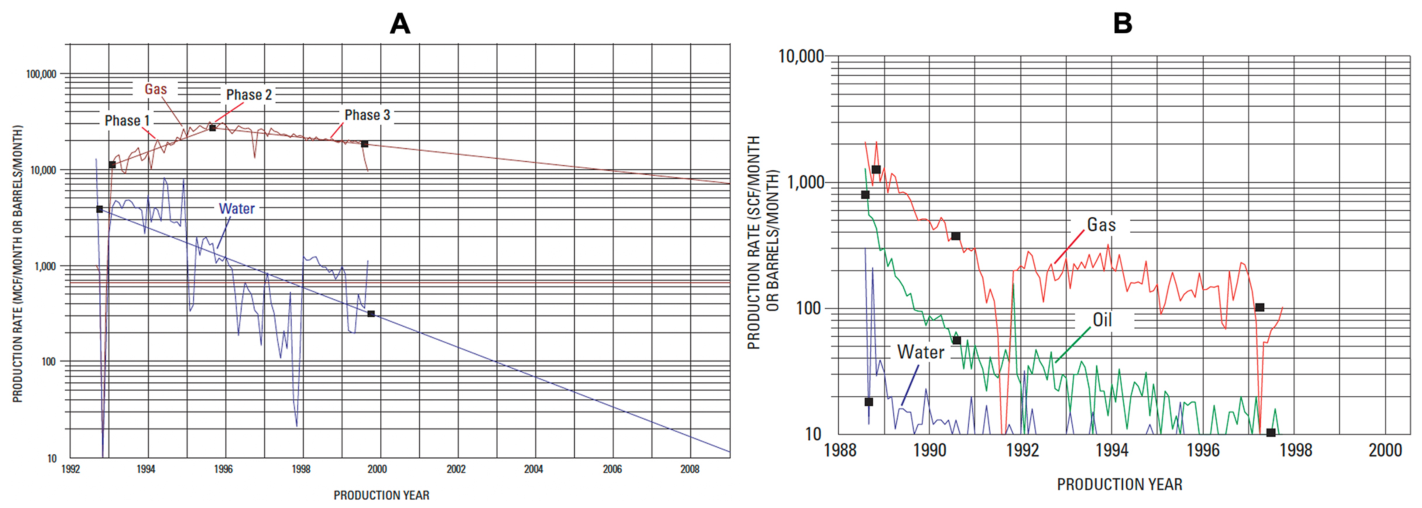
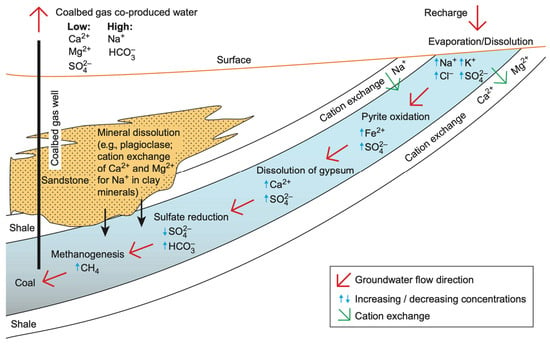
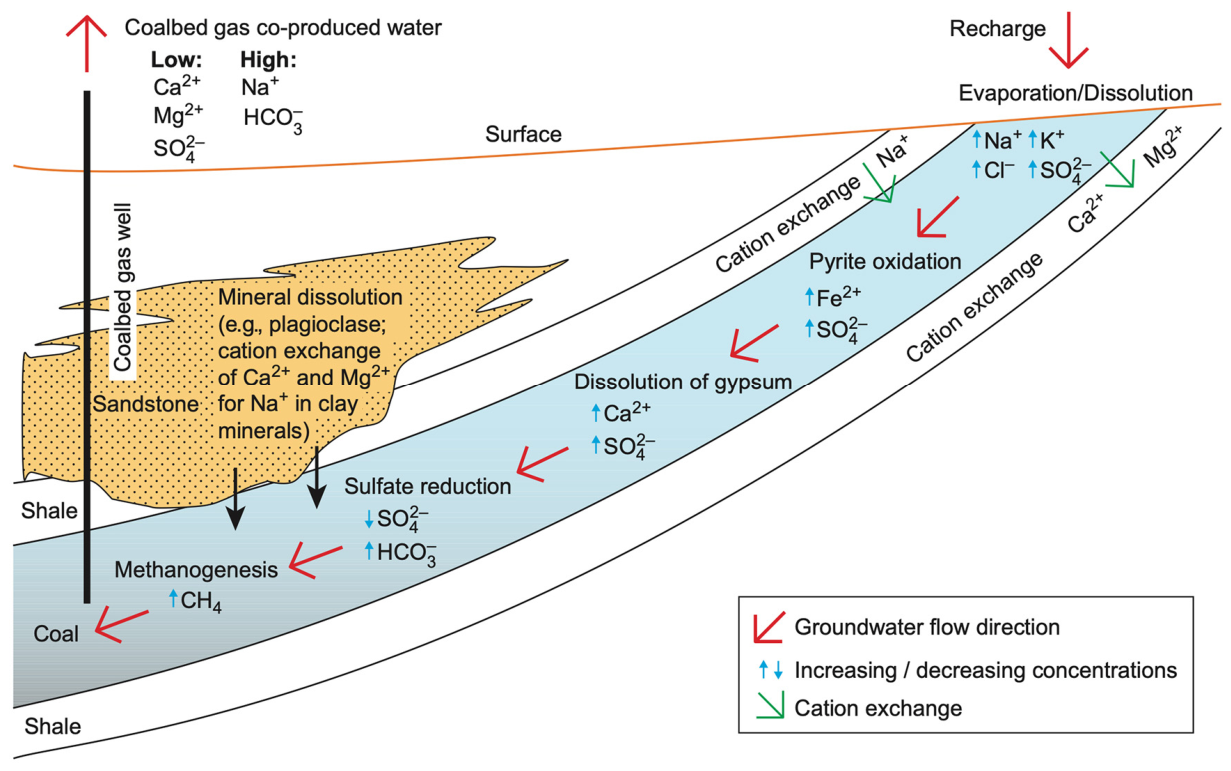
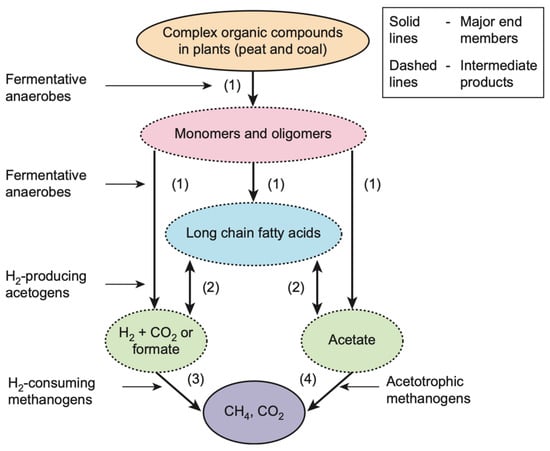
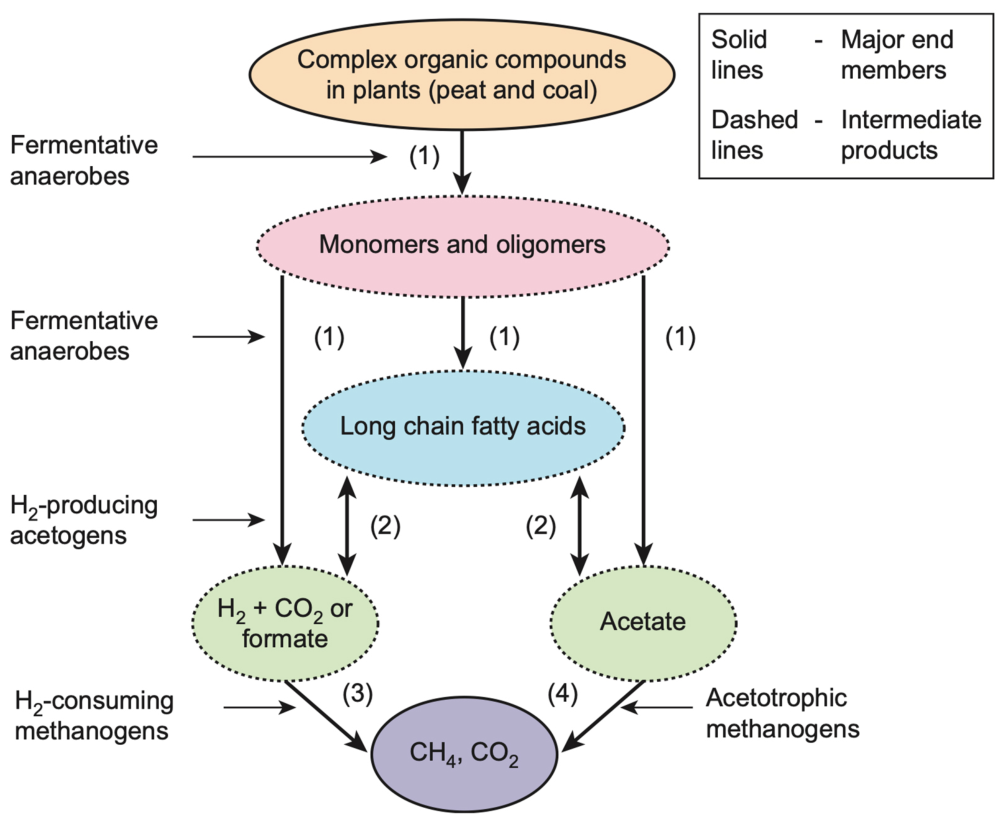
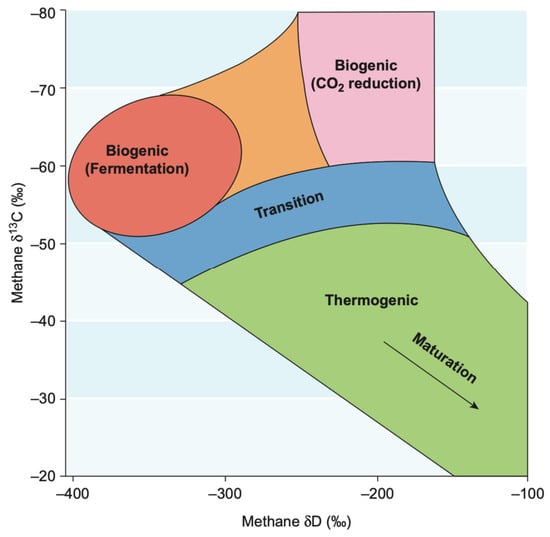
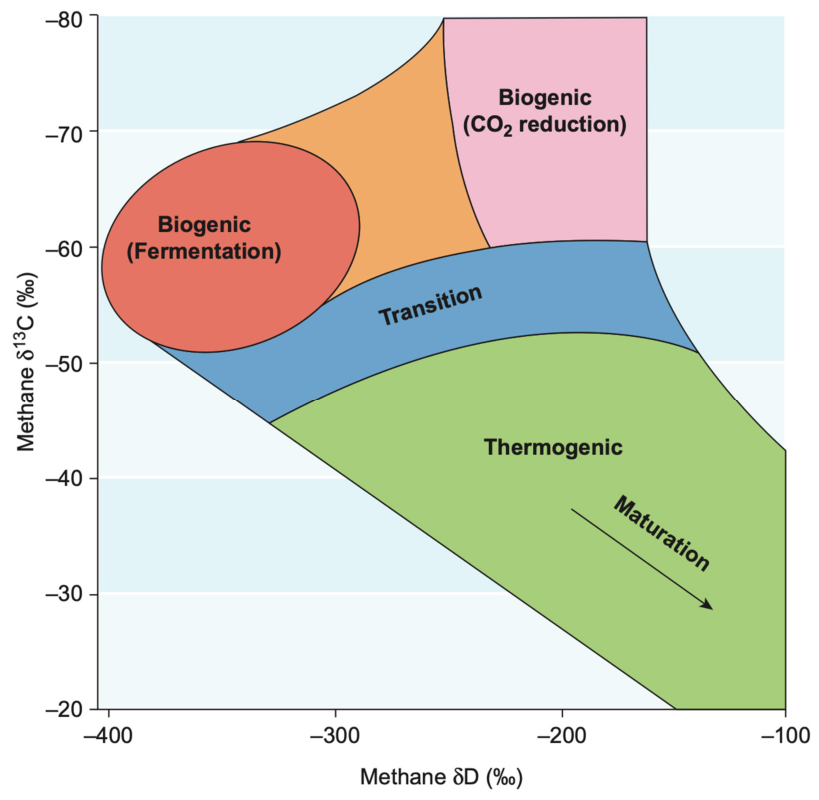
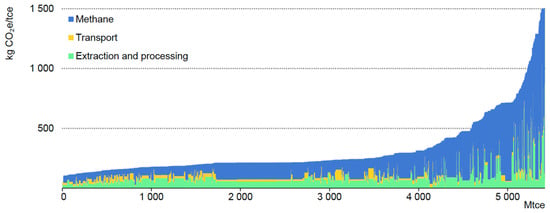
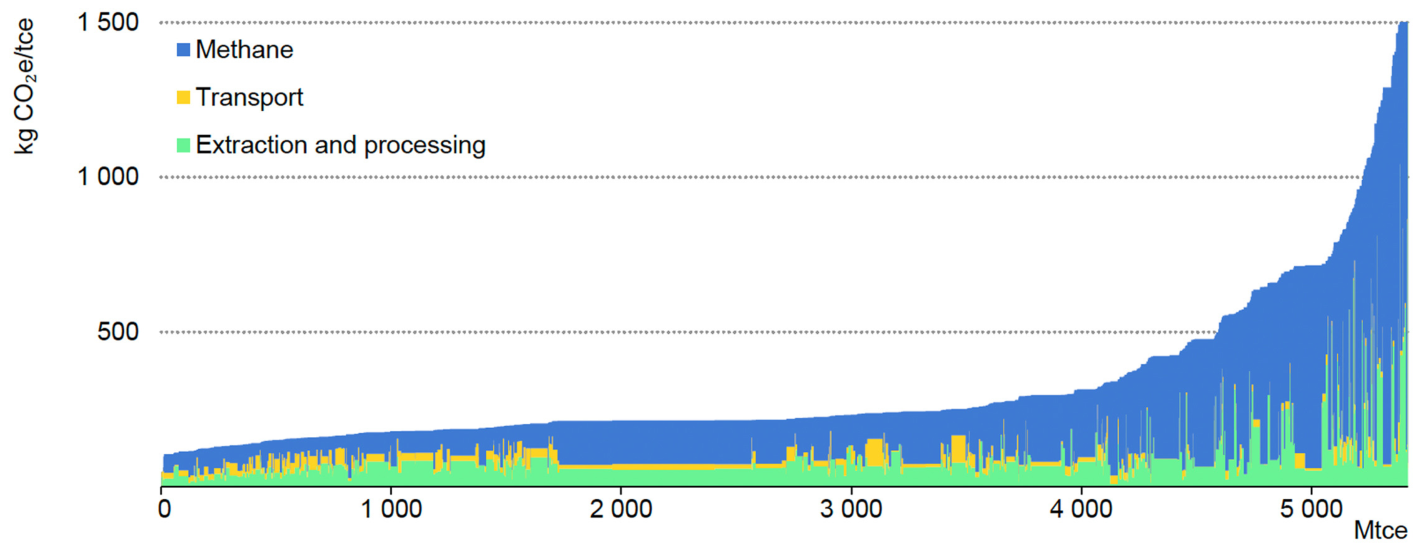
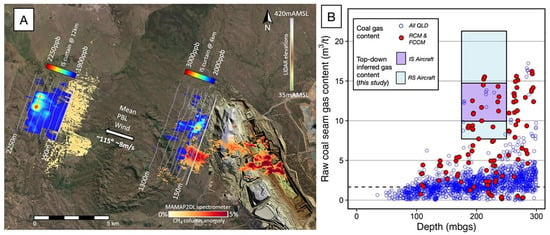
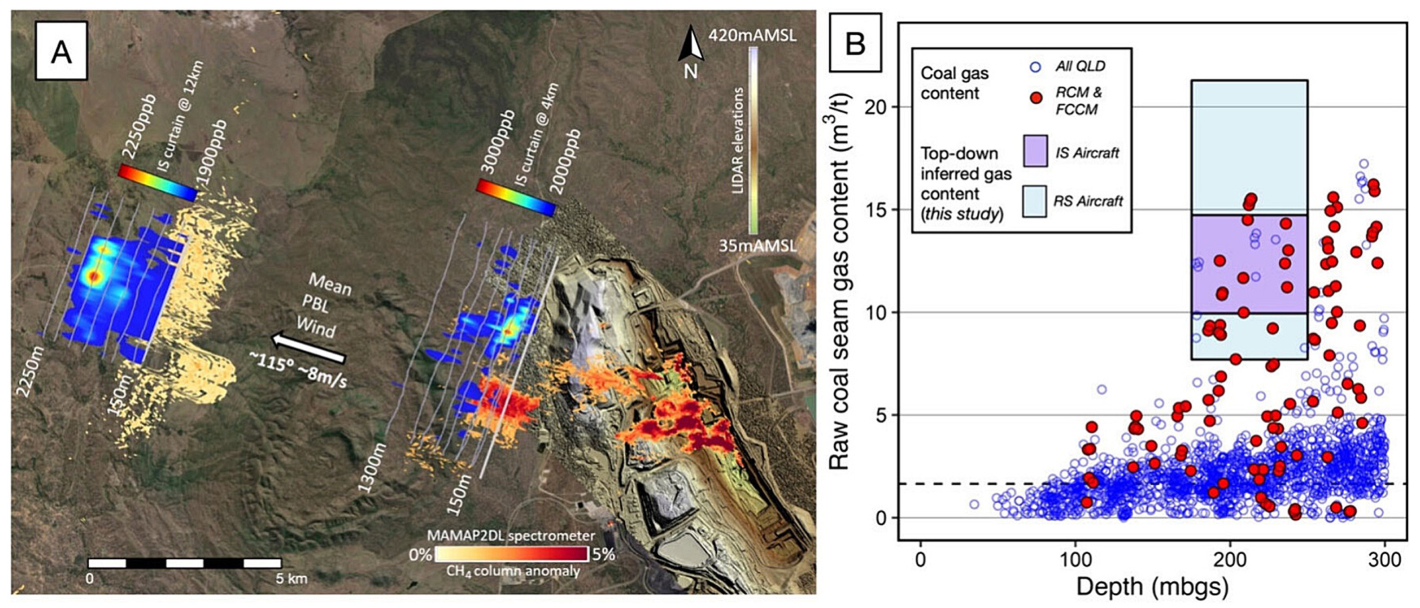
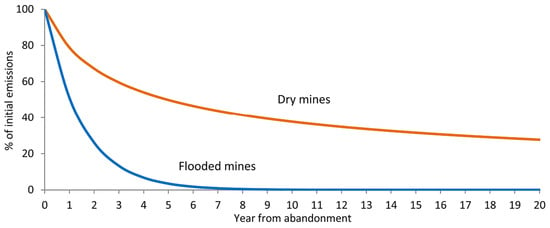
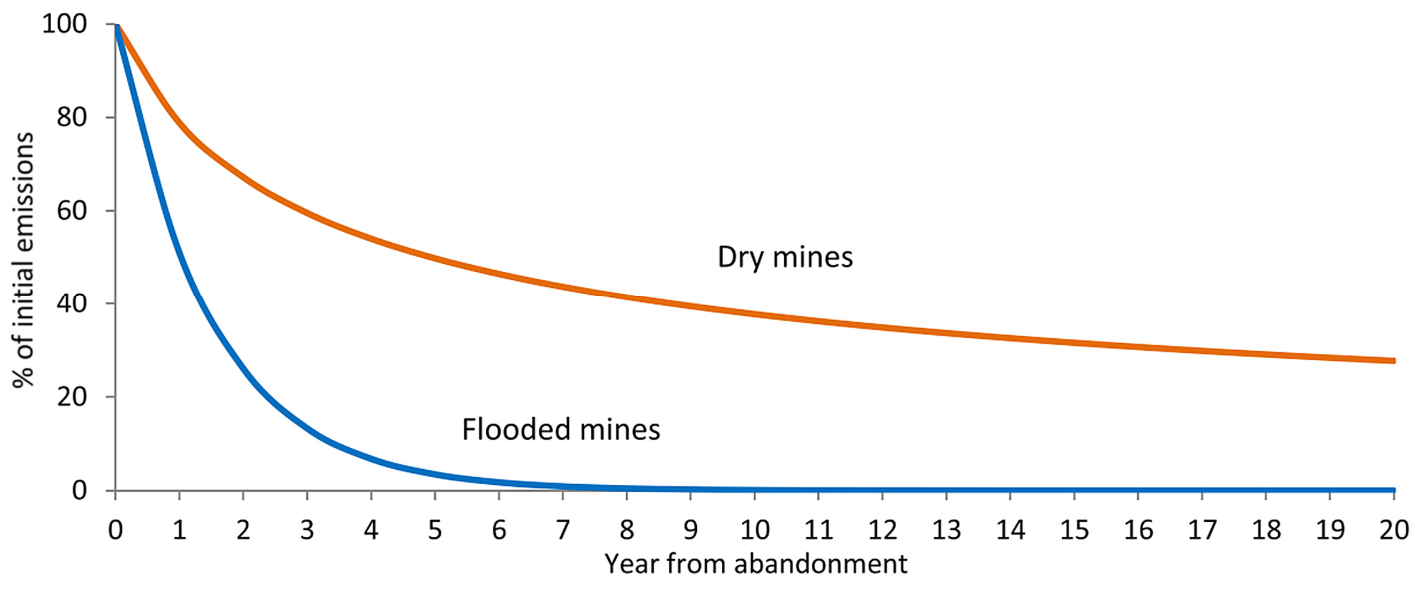
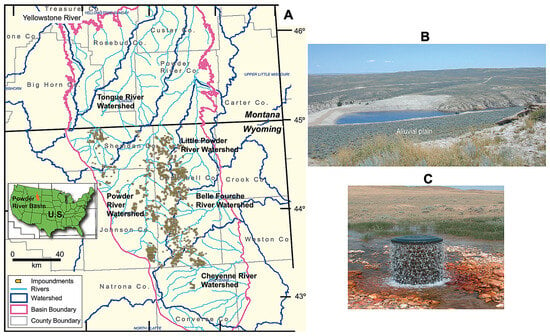
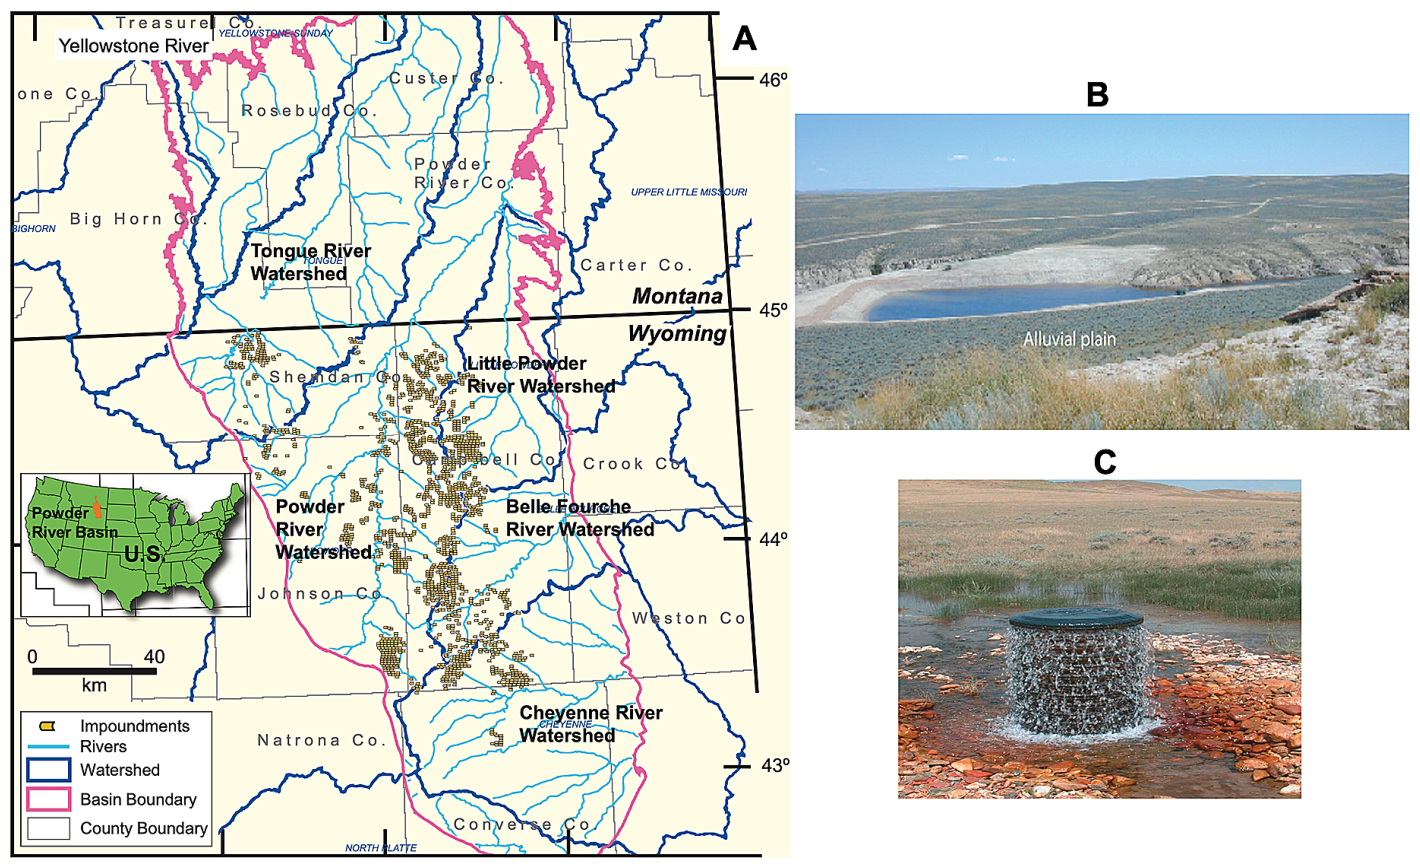
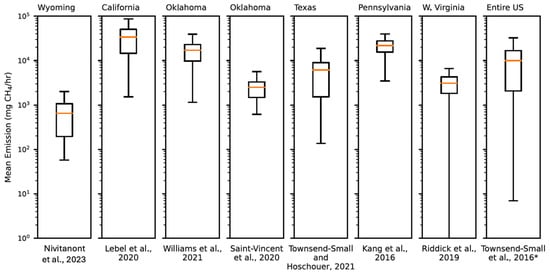
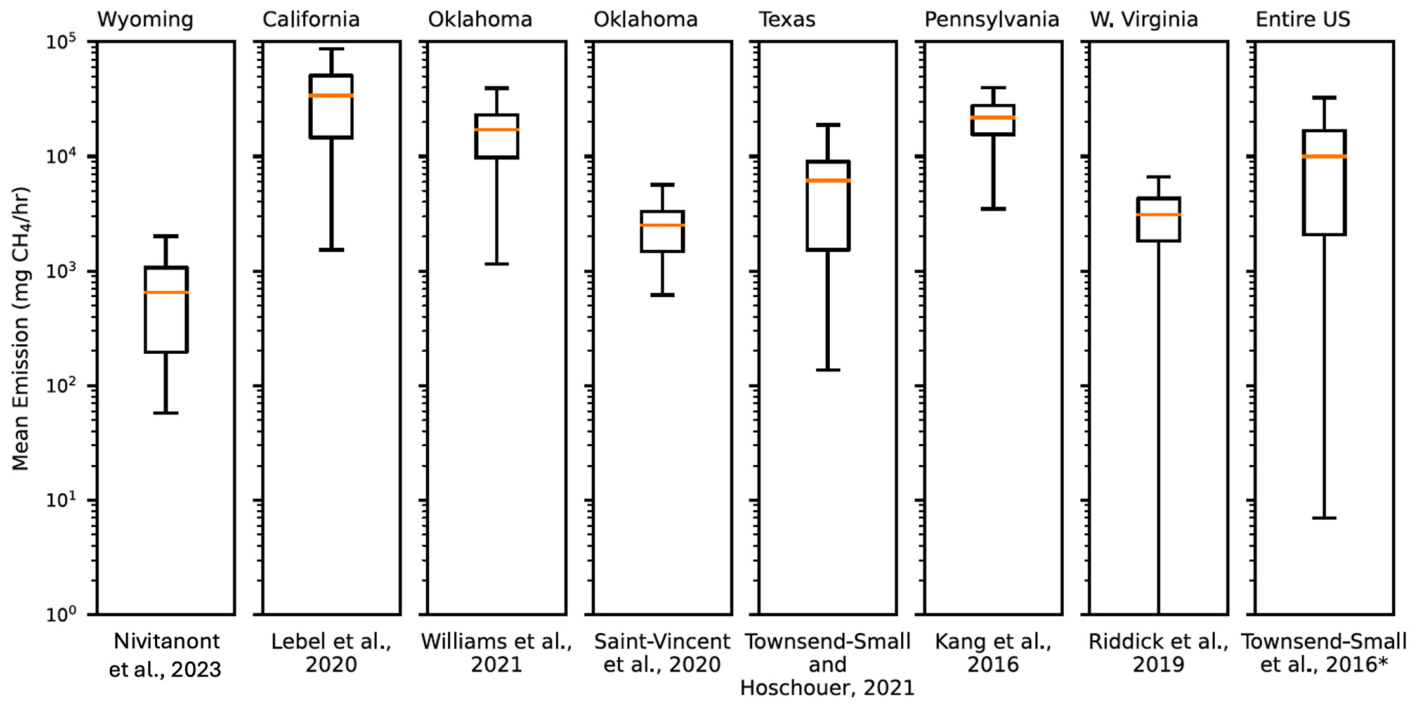
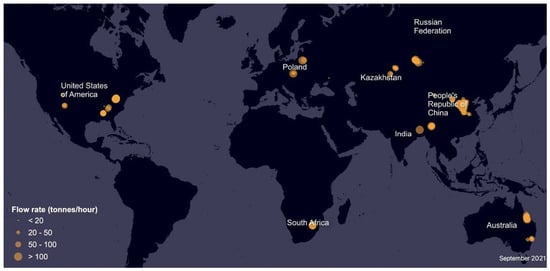
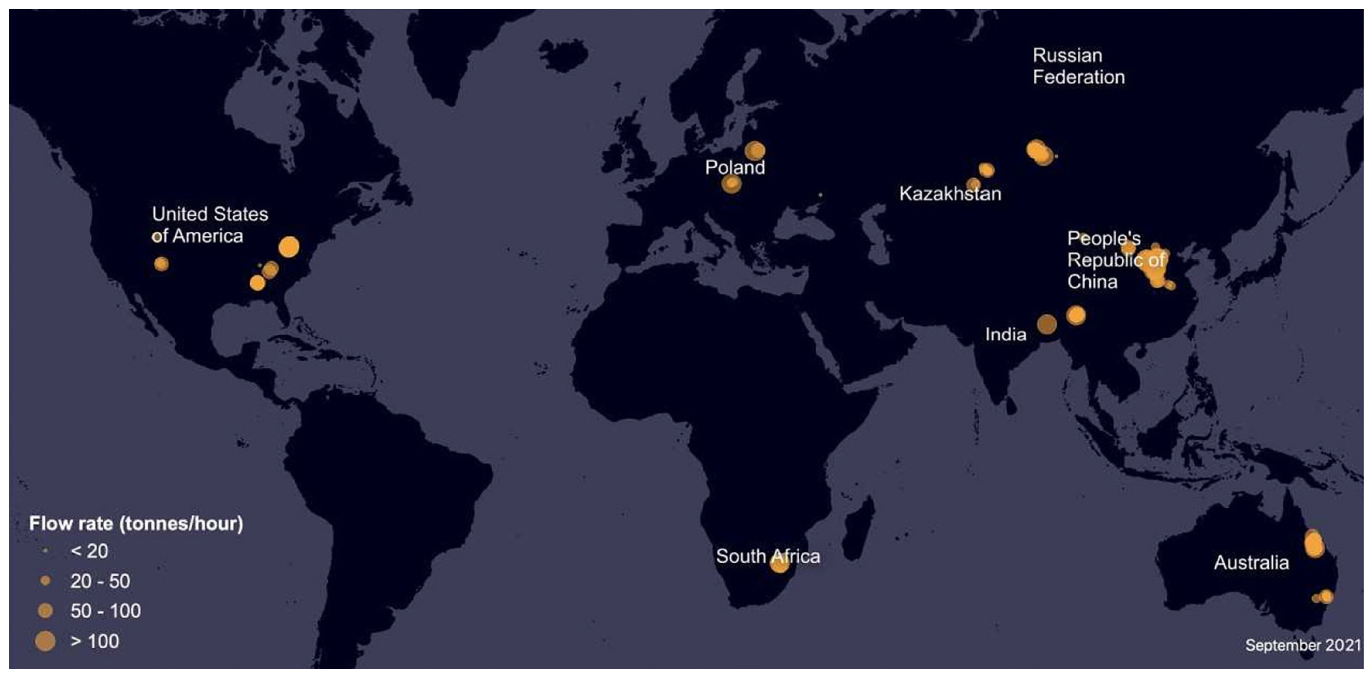
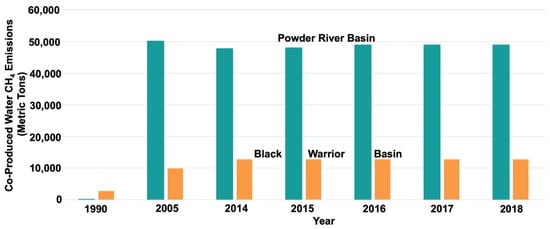
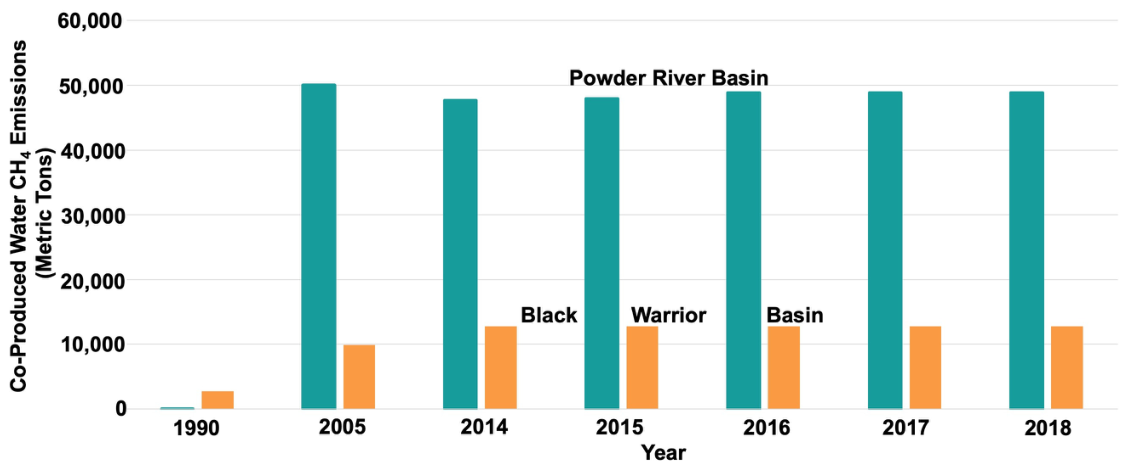
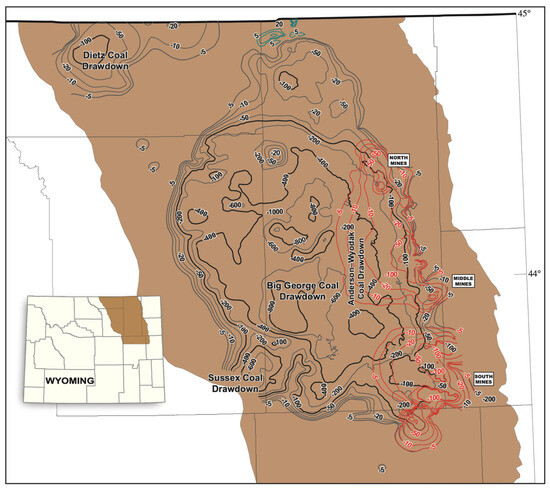
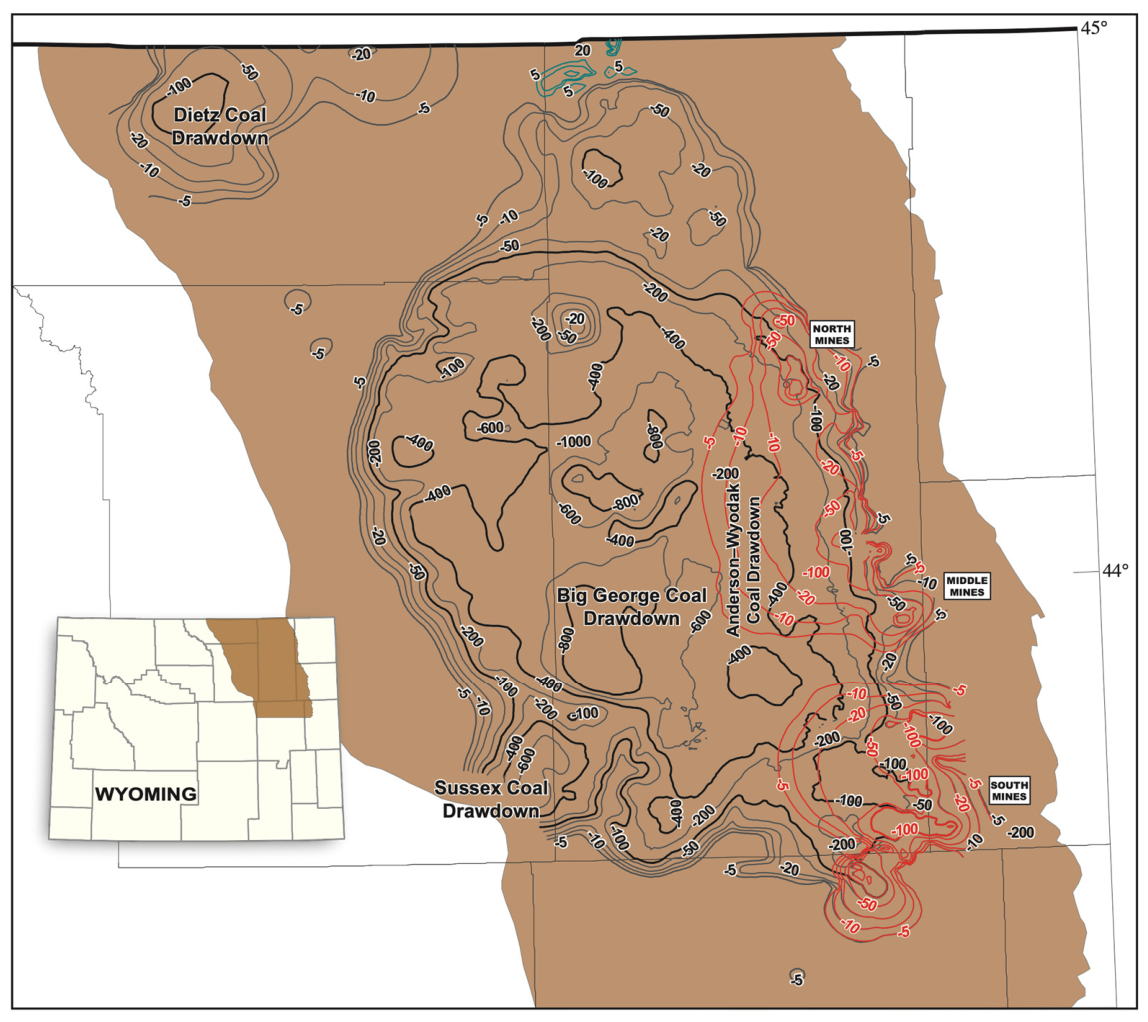

Disclaimer/Publisher’s Note: The statements, opinions and data contained in all publications are solely those of the individual author(s) and contributor(s) and not of MDPI and/or the editor(s). MDPI and/or the editor(s) disclaim responsibility for any injury to people or property resulting from any ideas, methods, instructions or products referred to in the content. |
© 2026 by the author. Licensee MDPI, Basel, Switzerland. This article is an open access article distributed under the terms and conditions of the Creative Commons Attribution (CC BY) license.