Article

Dynamics of Soil CH4 and CO2 Fluxes from Cattle Urine with and Without a Nitrification Inhibitor, and Dung Deposited onto a UK Grassland Soil


by
Jerry Celumusa Dlamini
1,*,
David Chadwick
2 and
Laura Maritza Cardenas
3
1
Unit for Environmental Sciences and Management, North-West University, Potchefstroom 2520, South Africa
2
School of Natural Sciences, Bangor University, Bangor LL57 2DG, UK
3
Net Zero & Resilient Farming, Rothamsted Research, North Wyke, Okehampton EX20 2SB, UK
*
Author to whom correspondence should be addressed.
Submission received: 26 June 2025 / Revised: 4 December 2025 / Accepted: 10 December 2025 / Published: 19 January 2026

Abstract

Food production systems associated with livestock management are significant sources of greenhouse gases (GHGs). Livestock excreta are one of the primary sources of GHG emissions from grazing livestock. Against this context, a field experiment was established in a UK grassland to establish the extent of soil methane (CH4), carbon dioxide (CO2), andN2O fluxes upon the deposition of (i) cattle urine (U), (ii) urine + dicyandiamide (DCD) (U + DCD), (iii) artificial urine (AU), and dung (D), and compared with a (iv) control, where neither urine nor dung was applied. Excreta applications were made at three experimental periods during the grazing season: early-, mid-, and late-season. Soil N2O emissions data have been published already by co-authors; hence, this paper summarizes the emissions of soil-borne CH4 and CO2 emissions, and explores in particular, the effects of the addition of DCD, a nitrification inhibitor used to reduce direct and indirect N2O emissions from urine patches, on these (carbon) C-GHGs. Soil moisture (p = 0.47), soil temperature (p = 0.51), and nitrate (NO3) (p = 0.049) and ammonium (NH4+) (p = 0.66) availability, and C (p = 0.54) addition were key controls of both soil CH4 and CO2 emissions. The dung treatment stimulated the production and subsequent emissions of soil CH4 and CO2, a significantly high net CH4 and CO2-based global warming potential (GWP). The findings of the current study lay a foundation for an in-depth understanding of the magnitude and dynamics of soil-borne CH4 and CO2 upon urine and dung deposition during three different seasons. This study implies that the use of DCD may have the potential to reduce carbon-based GHGs from the urine and dung of grazing animals.

1. Introduction

Food production systems associated with livestock management are significant sources of greenhouse gases (GHGs), contributing to about 12% of the annual global anthropogenic emissions [1]. Urine and dung deposition by grazing livestock on pasture soils, manure management, and ruminant enteric fermentation are the primary sources of the GHGs: methane (CH4), carbon dioxide (CO2), and nitrous oxide (N2O) [2,3,4,5]. In grazed pastures, livestock excreta create patches of nutrient-rich soil, stimulating microbial activities and enhancing GHG emissions [6,7].
The deposition of urine and fresh dung by grazing livestock in intensively grazed pastures may increase soil moisture and subsequently increase anaerobic microsites, for N2O-producing processes, i.e., denitrification [8,9,10]. The decomposition and mineralization of deposited dung and the locally added organic carbon (C) may also result in CH4 and CO2 production and emission “hotspots” in intensively grazed pastures [11].
Globally, methane from livestock systems comprises 46% of all agricultural GHG emissions [3,12] and has a global warming potential (GWP) ~27 times that of CO2 over a 100-year horizon [13]. Carbon dioxide is one of the globally important greenhouse gases contributing to the greenhouse effect, and its atmospheric concentrations reached 419.3 ppm in 2022, which is 51% above the pre-industrial levels (278 around 1750) [14]. Increases in atmospheric CH4 and CO2 have significant effects on global climate change. On the other hand, research on the dynamics of these C-GHGs has received far less attention than the N2O emissions from these sources [15] and especially following the application of urine and dung, as well as the use of a nitrification inhibitor. Also, nitrification inhibitors (NIs), including dicyandiamide (DCD), have been well-documented in their role in reducing nitrate (NO3) leaching and N2O emissions from urine deposition [7,16,17]. However, the role of DCD has seldom been explored regarding its influence on the dynamics of C-GHGs upon urine and dung deposition. This is despite the evidence that DCD controls soil N2O by delaying nitrification, retaining nitrogen (N) in the more immobile ammonium (NH4+) in the soil, and reducing NO3 concentrations [18], consequently reducing denitrification rates and N2O emissions [19]. On the other hand, soil NH4+ is known to inhibit CH4 oxidation [20,21,22] often resulting in a net increase in CH4 emitted from soil [23].
Thus, it is imperative to understand the dynamics of these GHGs in livestock-grazed pastures in order to better quantify their potential contribution to total GHGs, and to understand the effects of using DCD, an NI, on the dynamics and extent of soil-borne CH4 and CO2 fluxes. Therefore, this paper aims to (i) clarify the soil and environmental controls of soil CH4 and CO2 fluxes from cattle urine with and without the nitrification inhibitor, DCD, and dung deposited onto grassland soil.

2. Results

2.1. Rainfall and Temperature

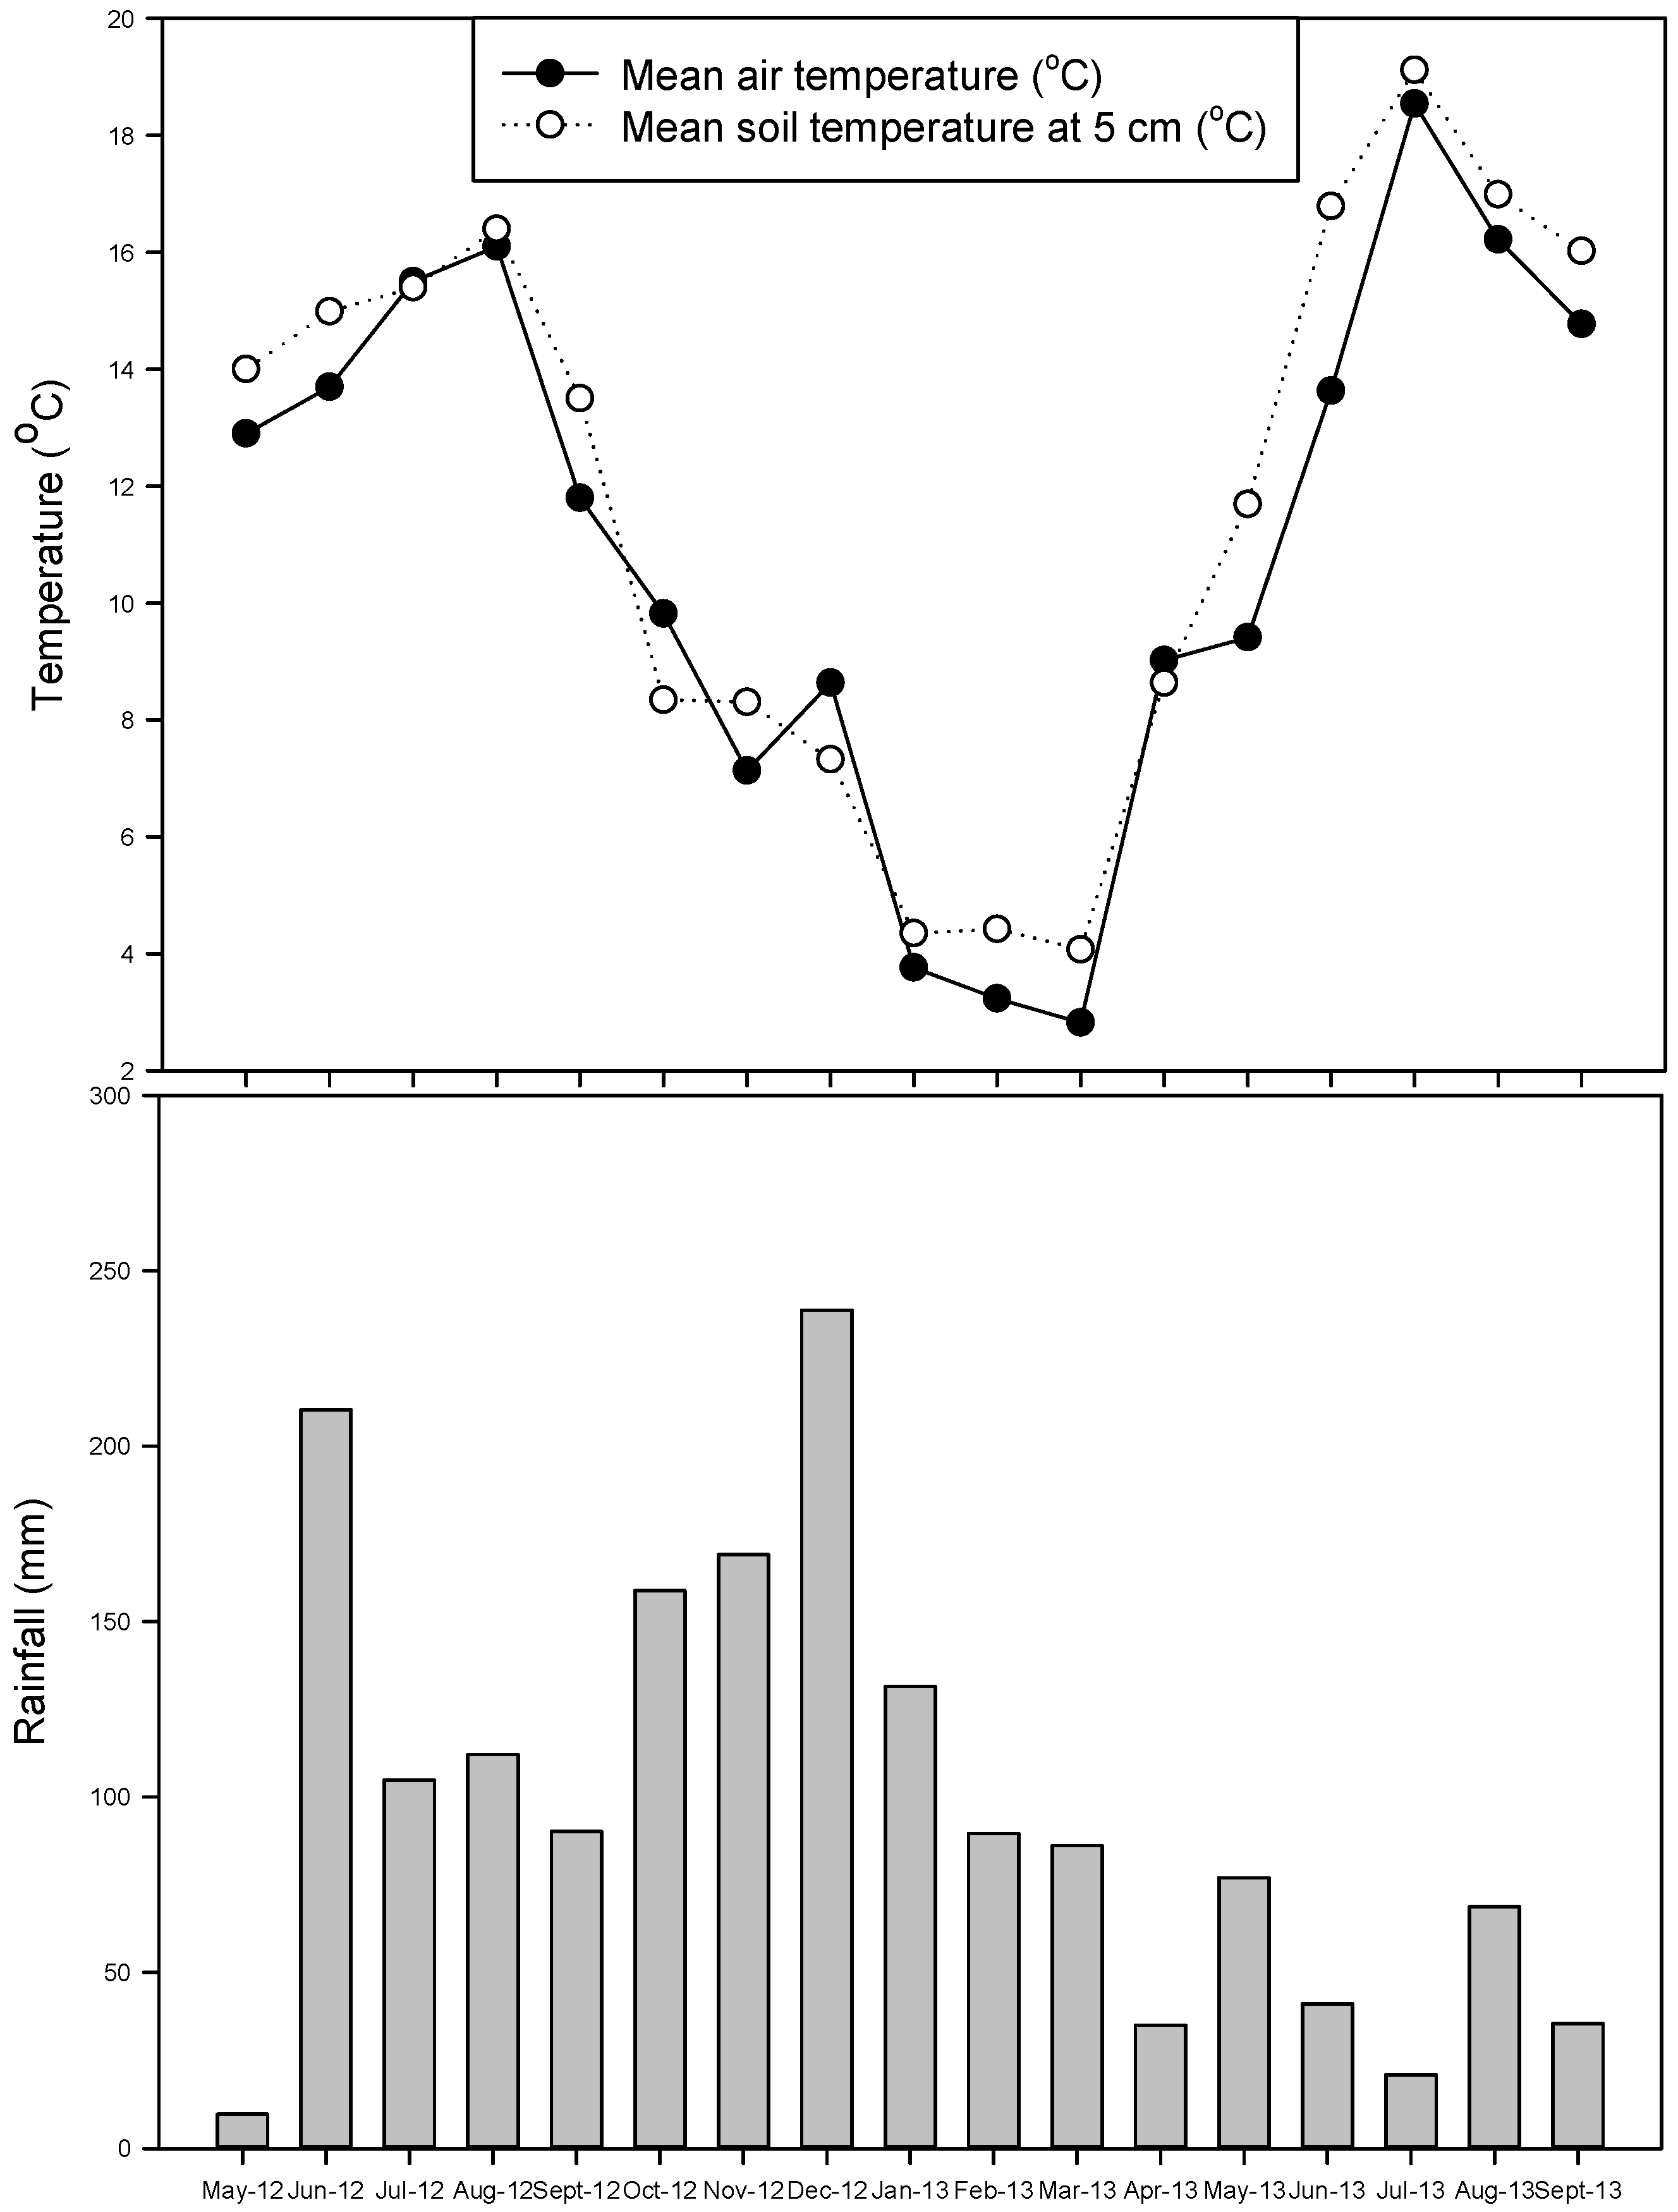
During the three experiments, the most significant rainfall (up to 238 mm) fell in December 2012, which was preceded by the wet months of October and November, having recorded 158.8 and 169.1 mm, respectively. The second largest amount of rainfall (210.4 mm) was received in June 2012 (Figure 1). The months of May 2012, April, June, and July 2013 proved to be the driest, having received rainfall not exceeding 50 mm. Mean air temperature and soil temperature at 5 cm showed a similar pattern during the three experiments. The largest mean air and soil temperatures, up to 18.5 and 19.1 °C, respectively, were recorded in July 2013. The lowest mean air and soil temperature (2.8 and 4.1 °C, respectively) were recorded in March 2013.

2.2. Soil Moisture Dynamics

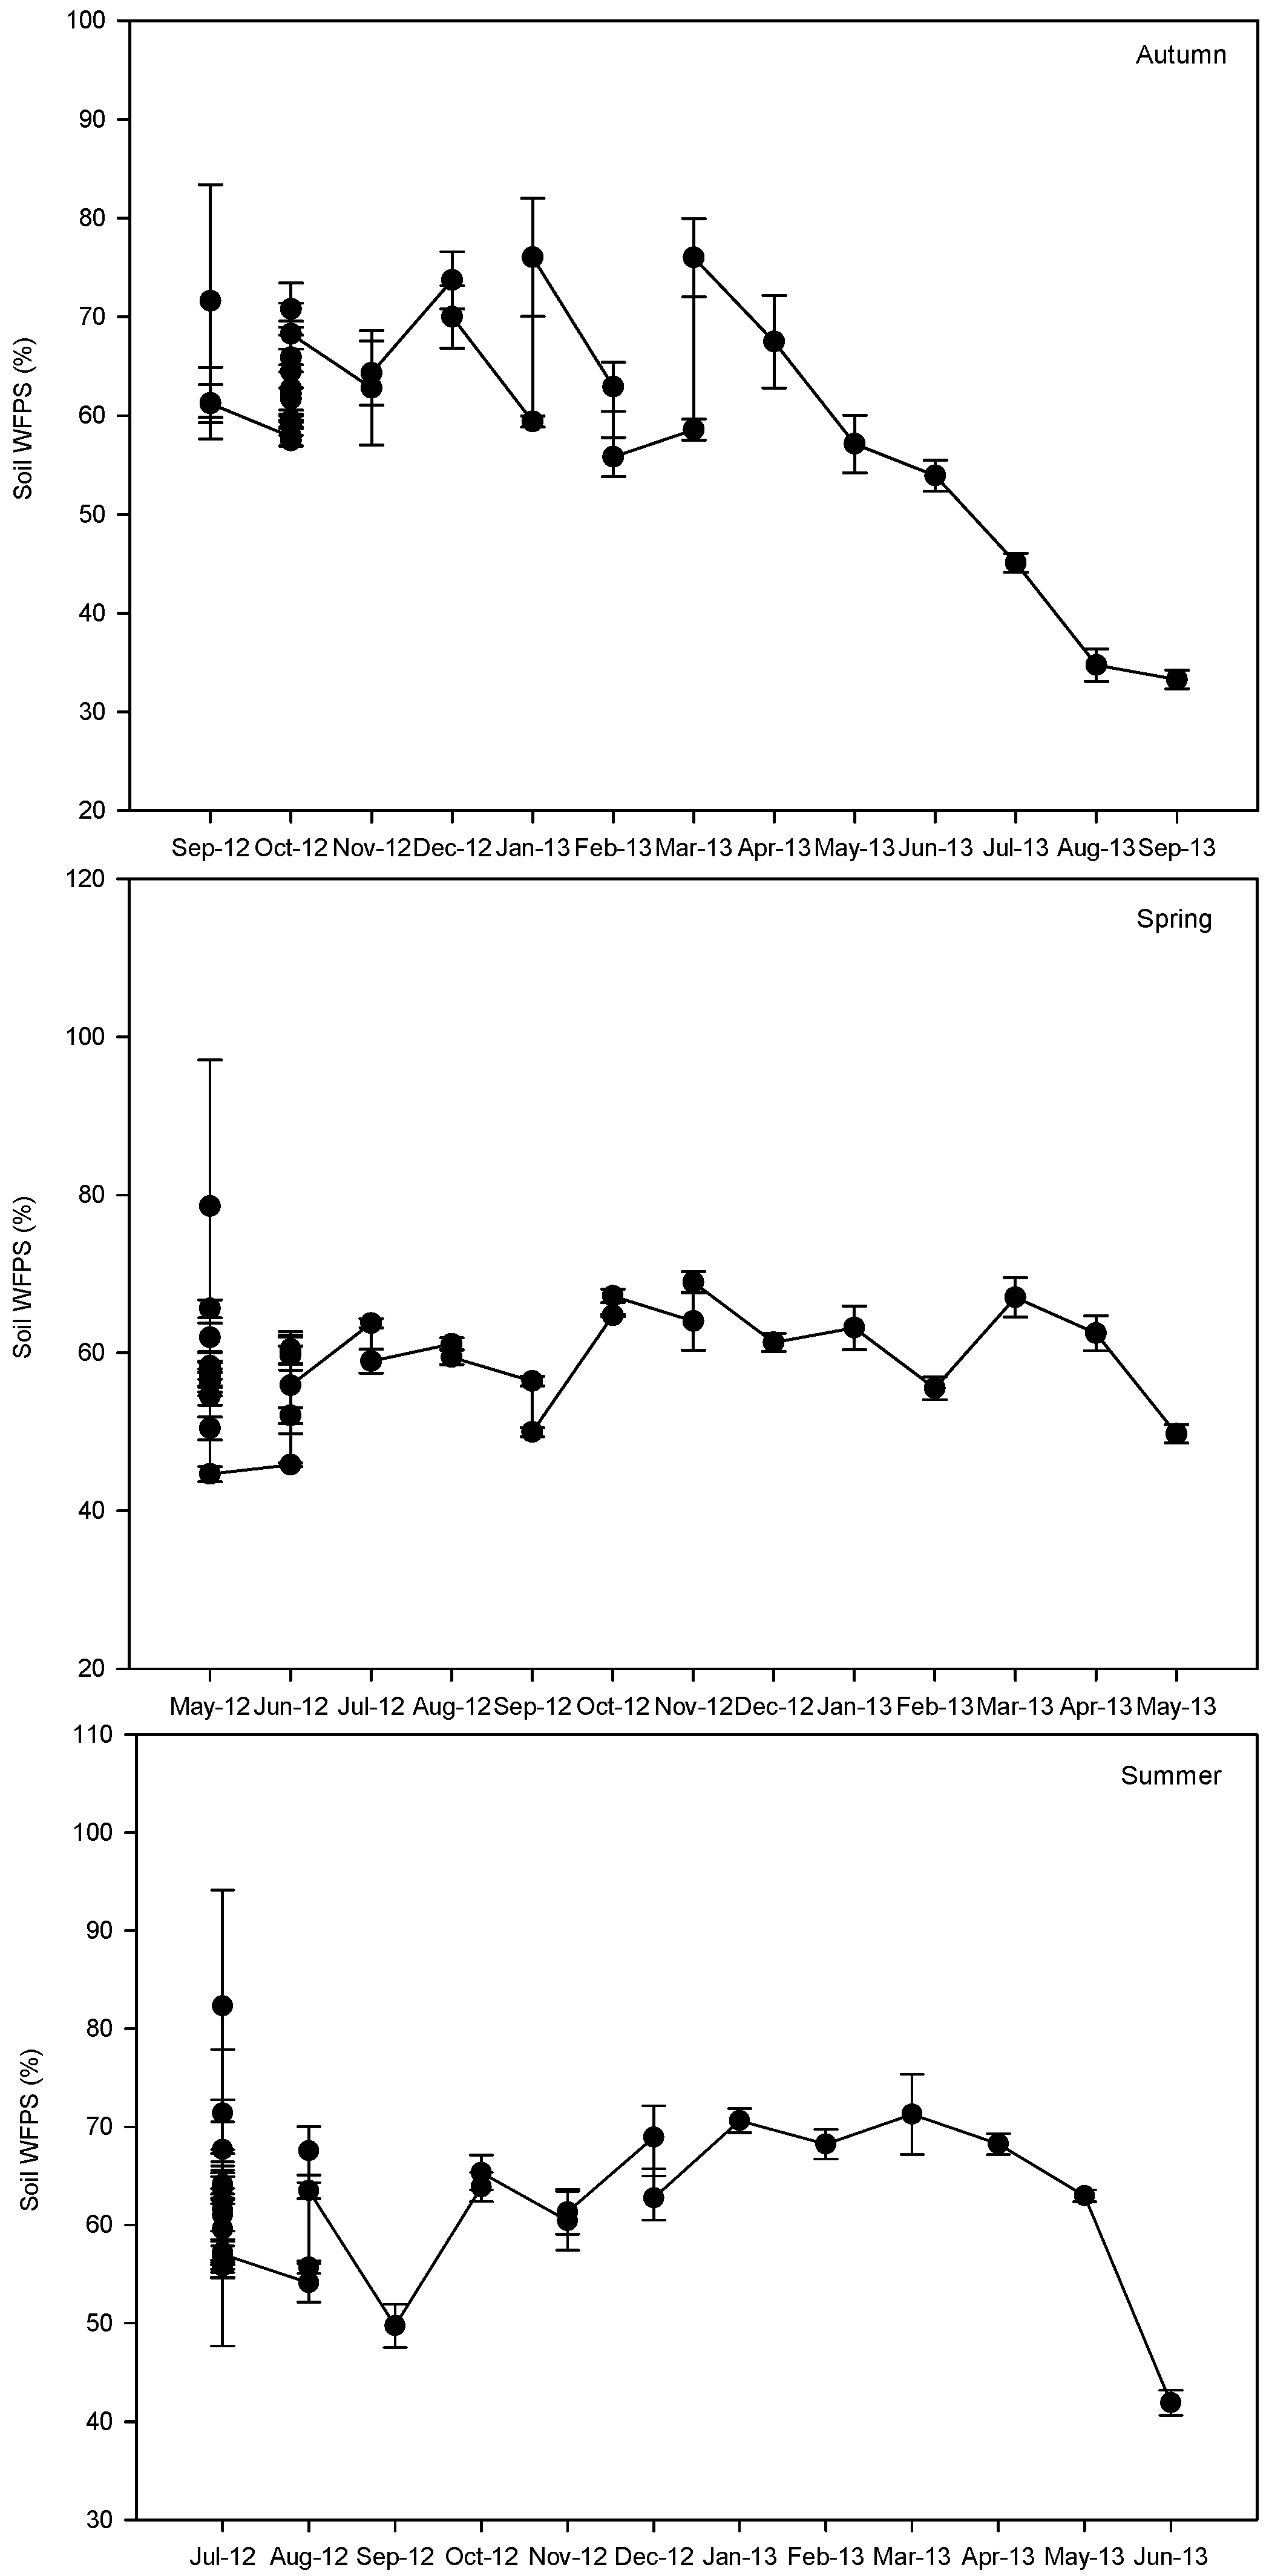
In the autumn experiment, soil percent water-filled pore spaces (%WFPS) ranged from 33.3 ± 0.8 to 76.0%. During this experimental period, the largest soil %WFPS (76.0%) was recorded in January and March 2013, while the soil was the driest in September 2013 (33.3 ± 0.8%). On the other hand, during the spring experimental period, soil %WFPS ranged from 44.6 ± 0.95 to 69.1 ± 1.3%, with the driest period recorded in May 2012 and the wettest period recorded in November 2012. Soil % WFPS ranged from 51.8 ± 1.6 to 101.8%, with the driest period recorded during November 2013, whilst the wet period was recorded at the beginning of July 2012 (Figure 2).

2.3. Gas Fluxes

2.3.1. Soil CH4 Fluxes

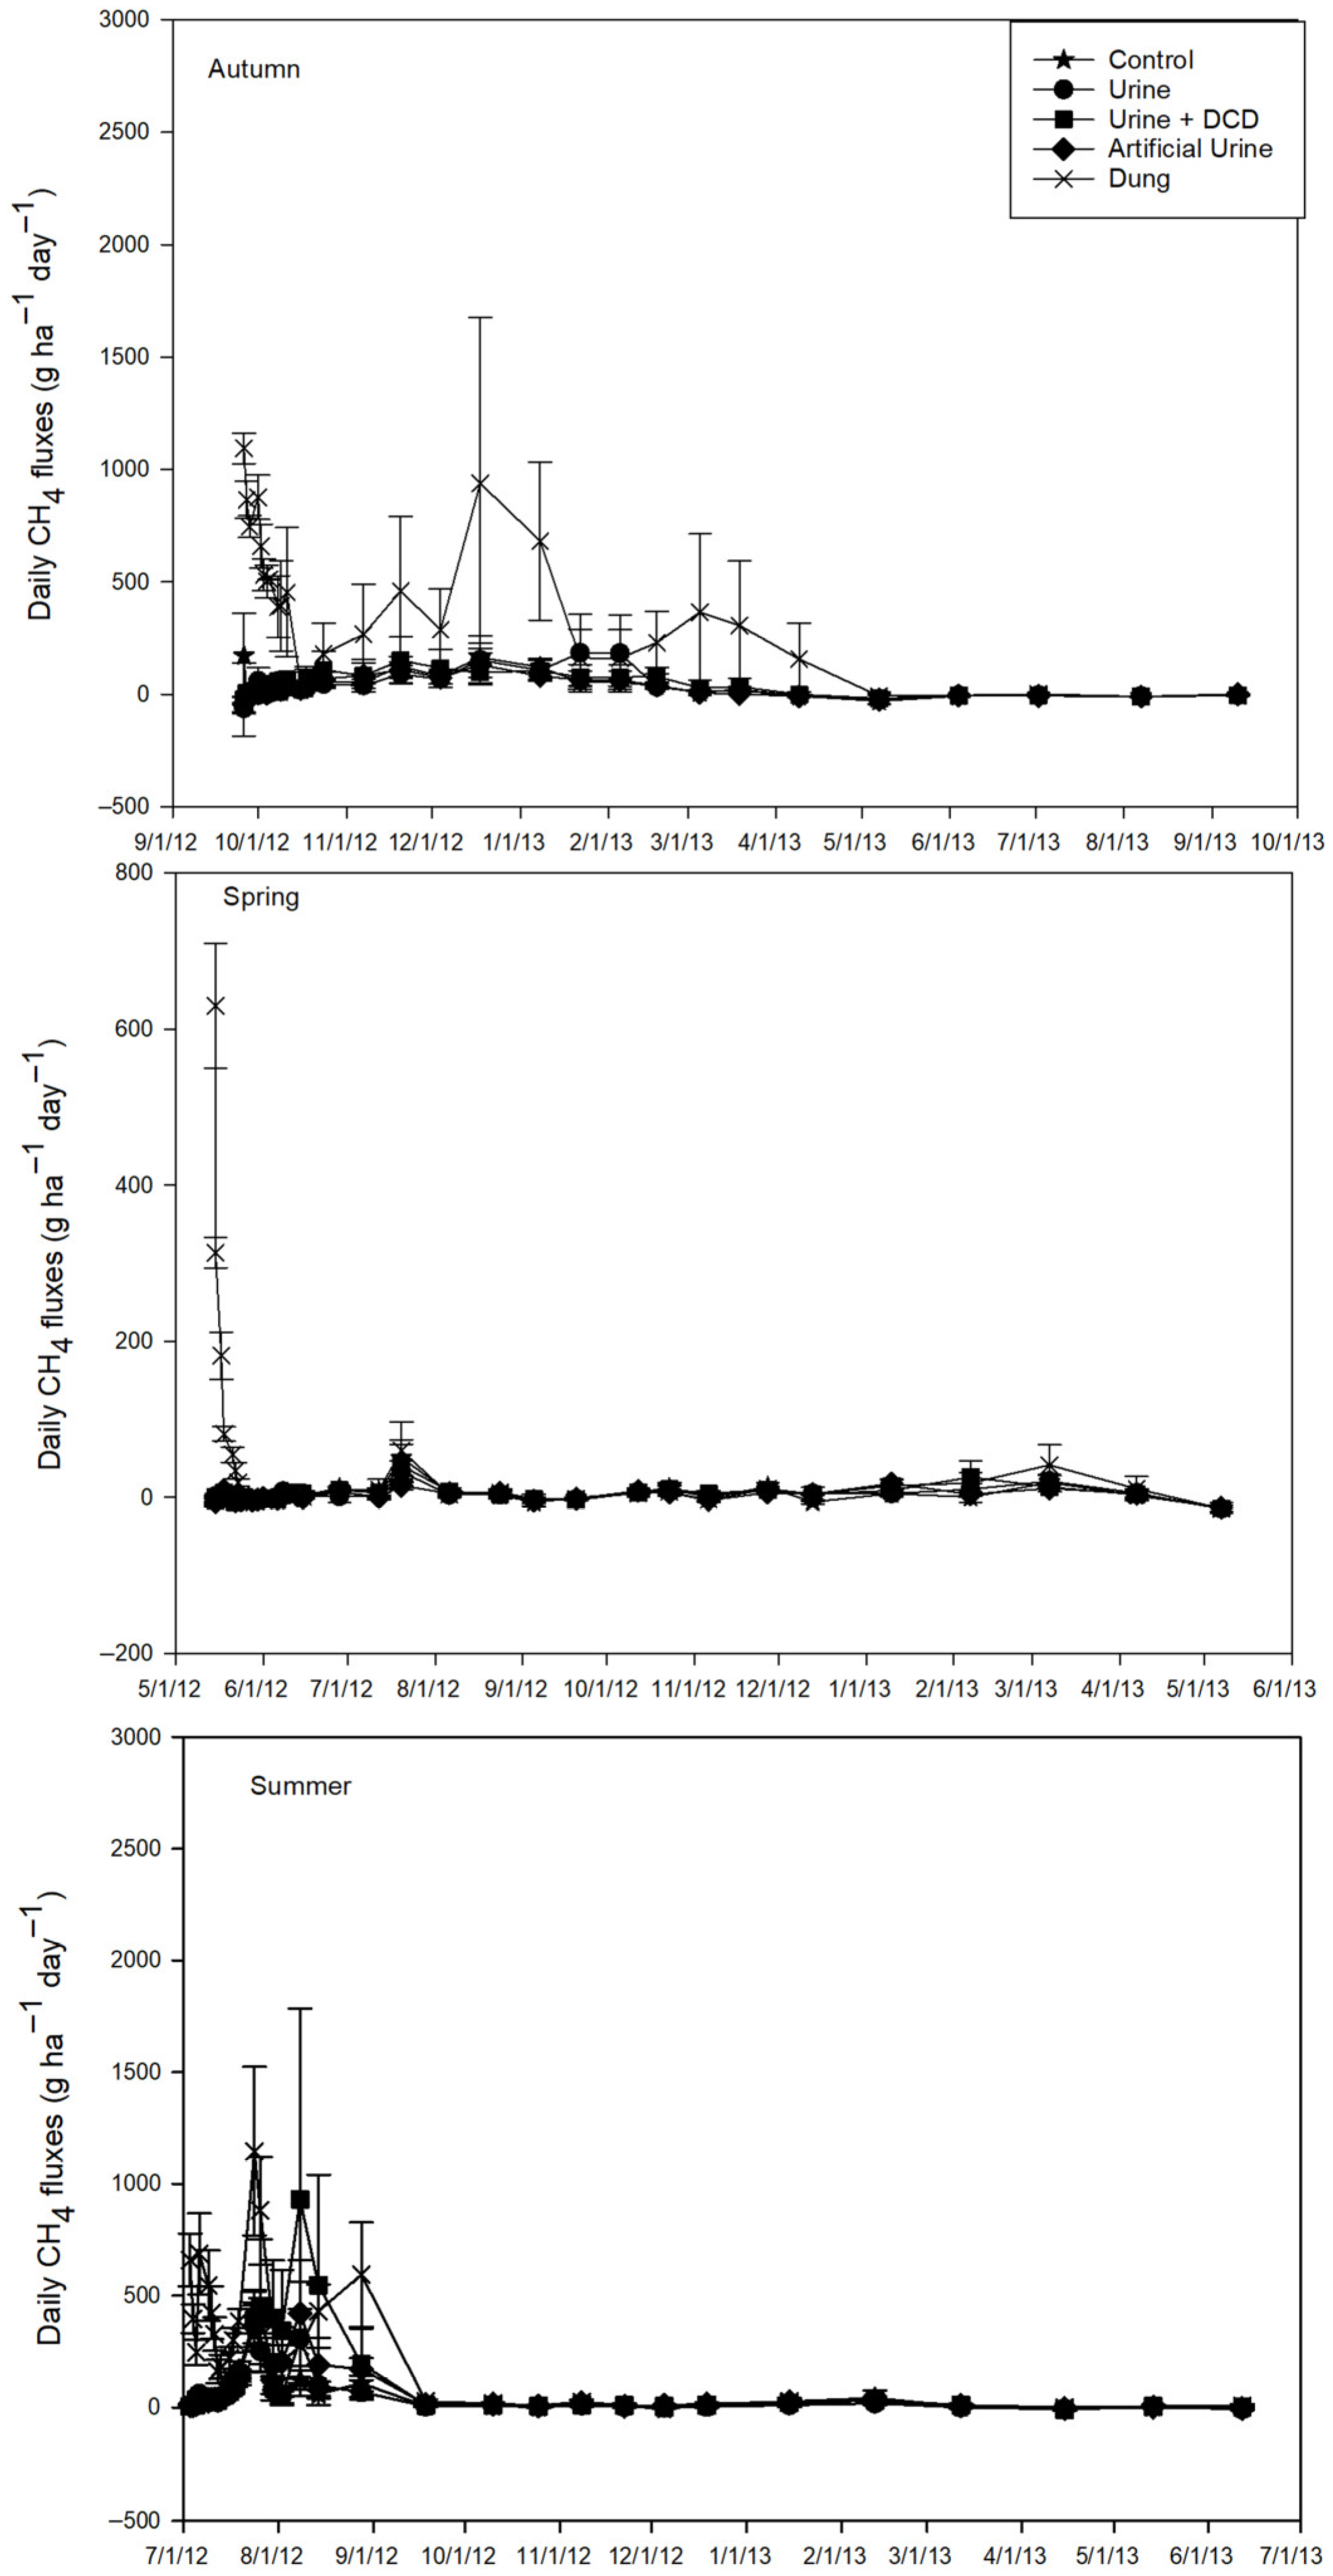
The D treatment (1094 ± 67.6 g ha−1 day−1) showed the largest CH4 fluxes immediately after the treatment application in the autumn experiment, whilst other treatments exhibited fluxes < 200 g ha−1 day−1 during this sampling event. The extensive soil CH4 fluxes observed in the D treatment immediately after treatment application lasted until April 2013. Thereafter, all treatments had low (below 3 g ha−1 day−1) soil CH4 fluxes until the end of the experiment. Also, in the spring experiment, the D treatment emerged with the largest flux of 629.8 ± 79.9 g ha−1 day−1, whilst the remainder had fluxes below 1.5 g ha−1 day−1. However, immediately after this peak, soil CH4 fluxes in the D treatments dropped to below 10 g ha−1 day−1 and remained low like the rest of the treatments until the end. Similar to the autumn and spring experiments, in the summer experiment, the D treatment (658.8 ± 118.4 g ha−1 day−1) had high CH4 fluxes, while the remainder of the treatments had soil CH4 fluxes < 10 g ha−1 day−1. From the D treatment (1144.8 ± 377.8 g ha−1 day−1), the largest soil CH4 emerged again in mid-July 2012, while the remainder of the treatments had fluxes of <450 g ha−1 day−1. After the second peak, the CH4 fluxes declined to around ~20 g ha−1 day−1 and remained low until the end of the experiment (Figure 3).

2.3.2. Soil CO2 Fluxes

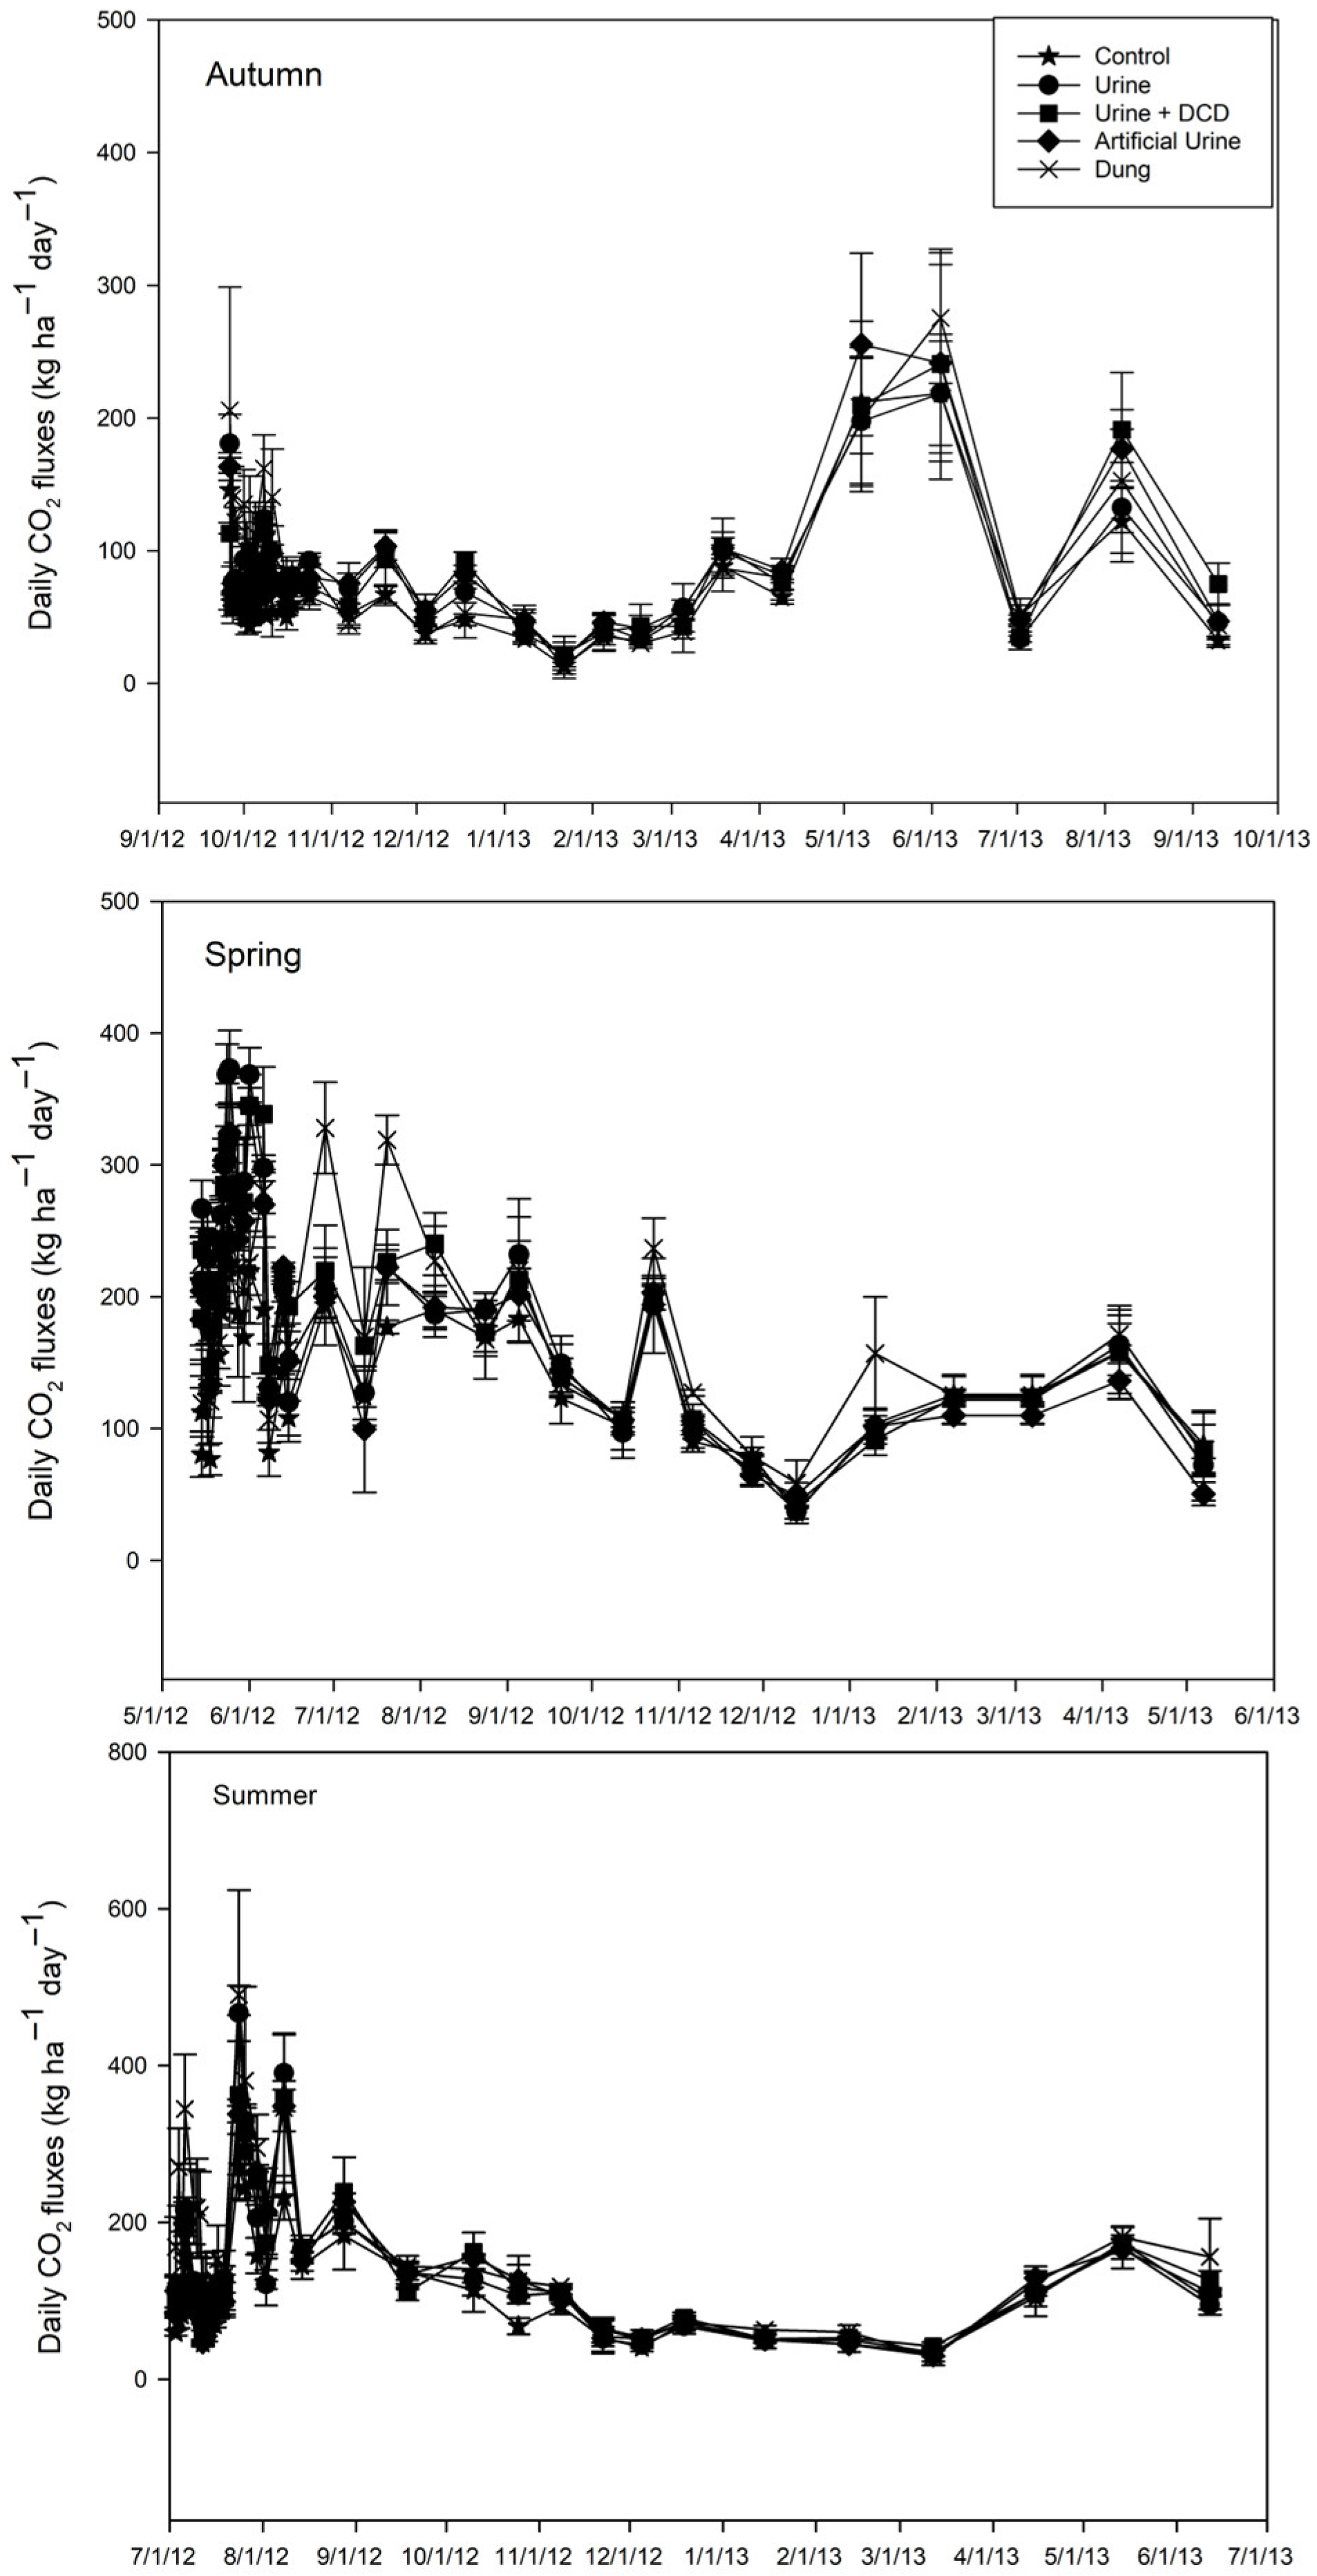
At the commencement of the autumn experiment, the D treatment displayed large CO2 fluxes (205.8 ± 92.8 kg ha−1 day−1) immediately after treatment application. The large CO2 fluxes observed in the D treatment immediately after treatment application were followed closely by the U treatment with 180.8 ± 22.2 kg ha−1 day−1, while the remainder of the treatments had fluxes < 165 kg ha−1 day−1. After this peak, fluxes in all treatments remained at ~100 kg ha−1 day−1 until a second peak was captured at the beginning of May 2013. During this peak, the AU treatment emerged with the CO2 flux of 255.5 ± 68.7 kg ha−1 day−1 but was overtaken by the D treatment on the succeeding sampling event with a flux of 275.3 ± 49.2 kg ha−1 day−1.
The soil CO2 fluxes peaked at a high of 266.1 ± 21.7 in the U treatment within the first two weeks after amendment application in the summer experiment. Immediately after this peak, CO2 fluxes took a downward spiral, with the D treatment often predominantly having more significant fluxes until the end of the investigation. Immediately after the amendment application in the summer experiment, the D treatment recorded a CO2 flux of up to 168.6 ± 38.2 kg ha−1 day−1, when the other treatments had fluxes of <115 kg ha−1 day−1. The same treatment emerged with significant CO2 of 490.3 ± 133.6 kg ha−1 day−1 within three weeks after amendment application, followed by the U treatment with 466.7 ± 35.4 kg ha−1 day−1 (Figure 4). After these peaks, CO2 fluxes remained at ~200 kg ha−1 day−1 in all the treatments until the end of the experiment.

2.4. Cumulative CH4 and CO2 Emissions

2.4.1. CH4 Emissions

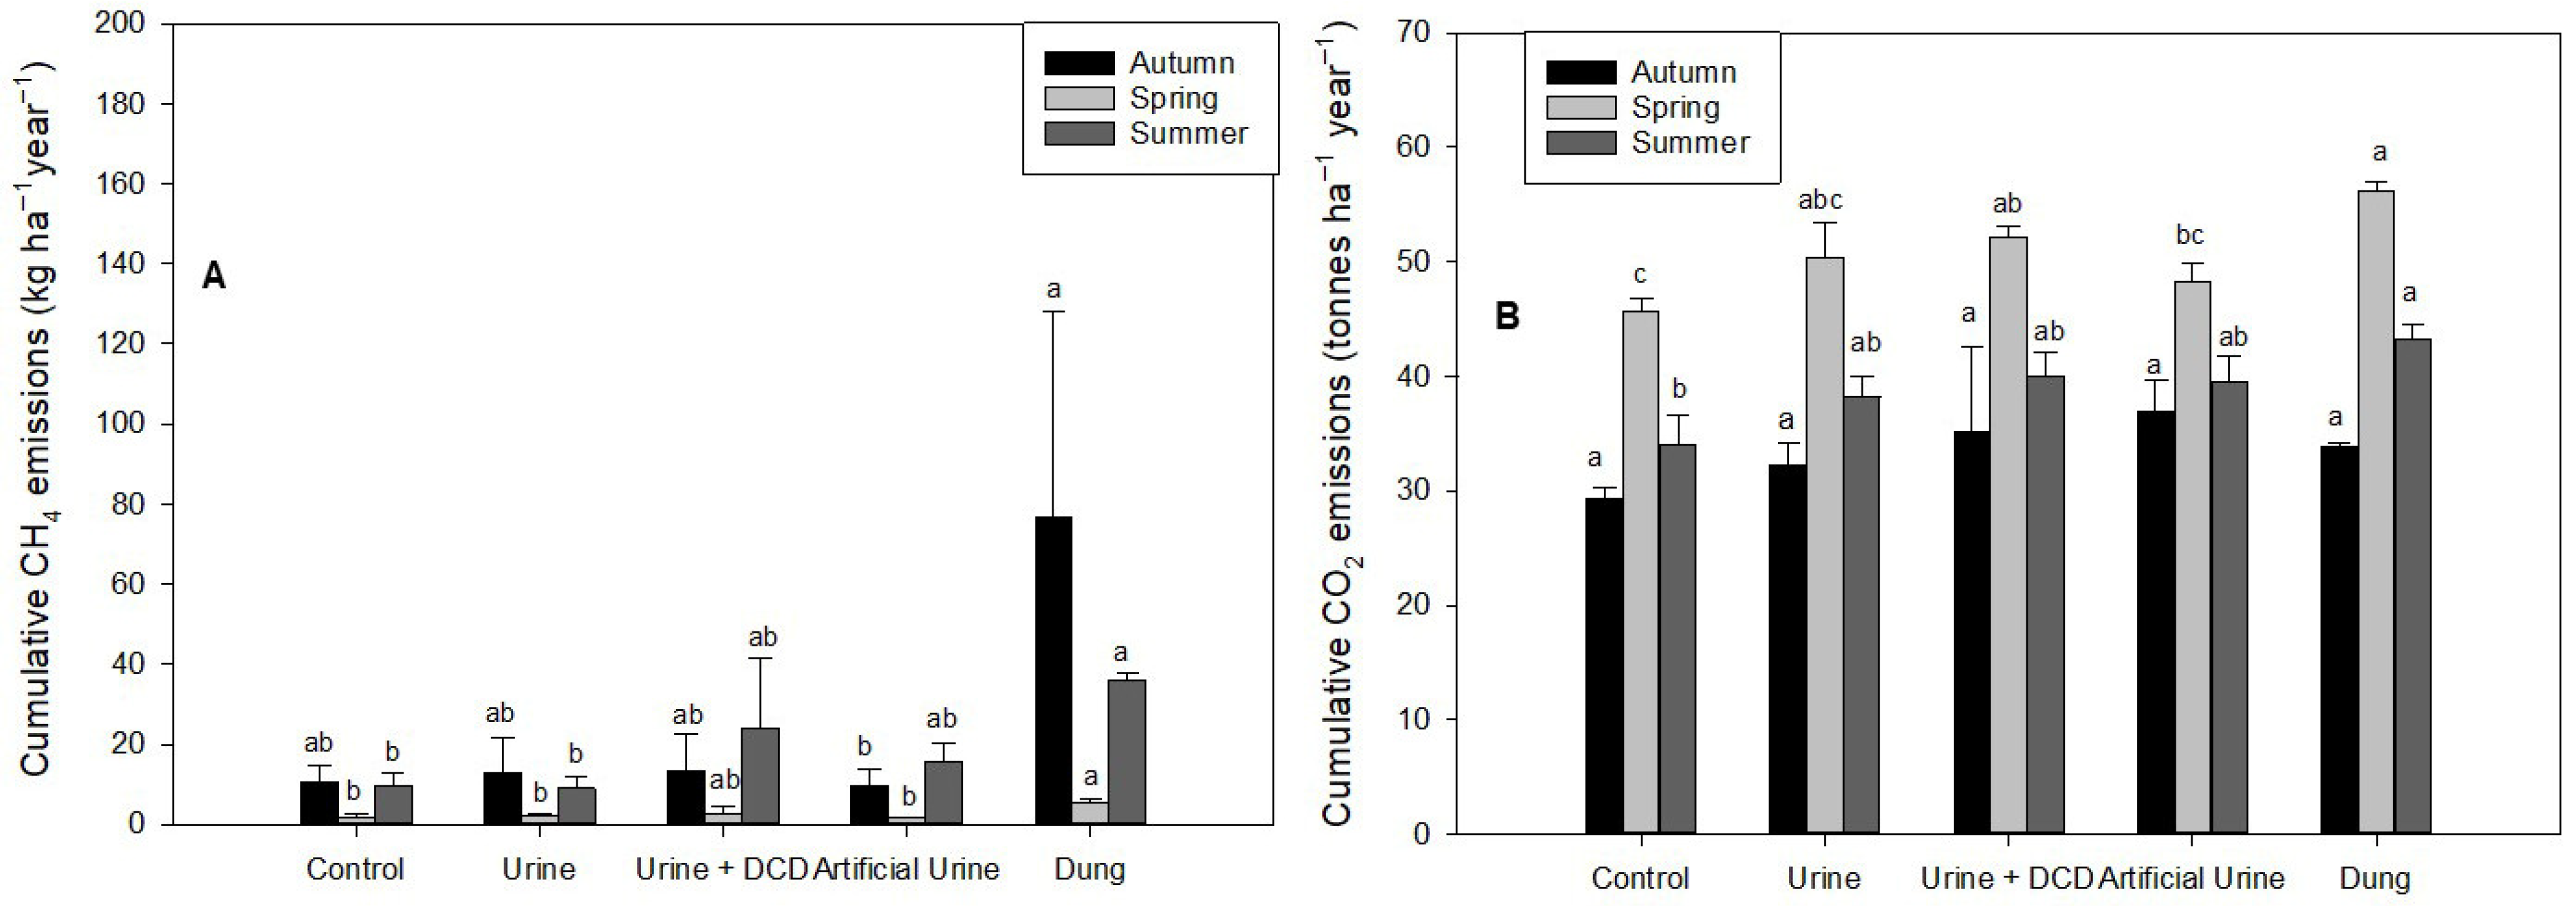
The largest cumulative soil CH4 fluxes were reported in the D treatment (up 76.8 ± 51.1 kg ha−1 year−1) in the autumn experiment, which was not significantly larger than in other treatments, except for the AU treatment. Again, in the spring experiment, the D (up to 5.32 ± 0.9 kg ha−1 year−1) maintained the largest CH4 cumulative fluxes, significantly larger than all other treatments except for the U + DCD treatment. Similarly, to the autumn and spring experiments, in the summer experiment, the D treatment had significantly larger cumulative CH4 fluxes, which were, however, not significantly different from the other treatments, except for the U treatment (Figure 5).
The results from the correlations between parameters showed that in the spring experiment, there were significant relationships between soil CH4 and NO3 (p = 0.049; r = −0.997) in the C treatment and yield (p = 0.036; r = 0.998) in the D treatment in the spring experiment.

2.4.2. CO2 Emissions

In the autumn experiment, cumulative soil CO2 emissions showed no significant difference within treatments, despite the largest CO2 observed in the AU treatment (36.9 ± 2.9-ton ha−1 year−1). On the other hand, in the spring experiment, the D treatment (56.1 ± 0.92-ton ha−1 year−1) showed significantly greater cumulative soil CO2, which was, however, not significantly higher than the U treatment (50.5 ± 2.9 tons ha−1 year−1) and the U + DCD treatment (52.2 ± 0.97-ton ha−1 year−1), but to the remainder of the treatments. The D treatment (43.8 ± 1.3-ton ha−1 year−1) again emerged with the largest cumulative soil CO2, which was, however, only significantly different from the C treatment (Figure 5). We found a significant relationship between cumulative soil CO2 and N-offtake (p = 0.041; r = 0.998) in AU, and herbage yield (p = 0.044; r = 0.998) in D treatment during the autumn experiment.

2.5. Net Global Warming Potential (GWP)

We estimated the net GWP from the treatments using the total CO2 and CH4 fluxes in this analysis and the cumulative N2O fluxes from [24] corrected by their GWP (1, 27, and 273 for CO2, CH4, and N2O, respectively). The results showed that net global warming potential was significantly greater in the D treatment compared to the remainder of the treatments (Table 1). Notably, the U, U + DCD, and AU treatments were not significantly different from each other, but they were compared to the C treatment.

3. Discussion

3.1. Soil and Environmental Controls of Gas Flux Dynamics

3.1.1. Soil CH4 Fluxes

The larger soil CH4 fluxes immediately after application in the D treatment, compared to other treatments in the current experiment (Figure 3), are similar to values reported in other studies, particularly [25]. This previous study reported CH4 fluxes up to 161 µg m−2 h−1 on the first day after dung application. The increase in CH4 fluxes immediately after dung application could presumably be dissolved CH4 in the dung [26]. Ref. [27] reported that the decline after the peak CH4 in the dung could be due to drying and aerobic conditions, as the dung was continually exposed to the air. The decline in CH4 fluxes could be linked to methanogenesis inhibition, as the process is known to be extremely sensitive to oxygen concentrations, and hence oxygen diffusion into the dung may have inhibited it [27]. The high soil CH4 fluxes immediately after dung application in the autumn experiment could have been produced and released from the dung as it was deposited, similar to other authors, particularly [28,29]. The previous authors observed that short-term CH4 pulses immediately after dung deposition were partly due to CH4 production in fresh dung, as fresh dung is a vital host for the methanogenic population in an anaerobic environment supplied with labile C and the release of CH4 of enteric origin embedded in the dung. It could also have been partly due to the high soil moisture stimulating the production of soil CH4, similar to [30]. The previous authors reported that wetter soils in wet seasons had greater CH4 fluxes because of low gas diffusivity.
Interestingly, at the beginning of the autumn and spring experiments, there was a large soil CH4 flux in all treatments coinciding with higher soil NH4+ and NO3 (please see [24] and Figure 3), in line with findings by other authors, particularly [31] with fluxes of up to 84.2 and 108 µg CH4 m−2 h−1, respectively. The previous authors observed that high soil mineral N inhibits the capability of CH4 to be oxidized into CO2, thus reducing the soil’s ability to be a CH4 sink. Further, the low soil CH4, coinciding with low NH4+ and NO3 until the end of the experiment in all treatments, further reiterates the findings of the previous authors that NH4+ plays an inhibitory role in the oxidation of CH4. The role of mineral N in inhibiting CH4 oxidation is attributed to the fact that CH4 monooxygenase of methanotrophs can oxidize various substrates besides soil CH4 [32,33]. The inhibition is also considered a general salt effect [34] with a competition between ammonia (NH3) and CH4 for monooxygenase enzymes [35].

3.1.2. Soil CO2 Fluxes

The large CO2 fluxes observed immediately after treatment application in all treatments in the three different experiments were similar to findings by other authors, particularly [36] who observed high cumulative soil CO2 immediately after urine and manure/dung deposition. These studies credited the high fluxes immediately after urine or dung deposition to urea hydrolysis to CO2 or labile C compounds introduced by the dung, stimulating microbial respiration. Also, larger soil CO2 fluxes in all treatments and seasons of the current study coincided with higher soil temperatures (Figure 1 and Figure 4), similar to findings by [37]. These studies showed increasing soil CO2 fluxes with higher soil temperature. They credited this to high soil temperatures having a beneficial effect on soil respiration and bacterial respiration in urine and dung. The higher soil moisture at the beginning of all the experiments could also have stimulated soil CO2 production, similar to other authors, particularly [5,38]. The previous authors reported a rapid CO2 pulse from dung and urine patches coinciding with high water-filled pore space. Also, ref. [39] reported a peak of CO2 fluxes immediately after a rainfall event.

3.2. Seasonal Effects on Gas Emissions

3.2.1. Soil Cumulative CH4 Fluxes

In all three experiments, the D treatment in autumn and summer application also resulted in larger CH4 cumulative fluxes compared to the remainder of the treatments in all the other seasons, similar to [32]. The previous authors reported predominantly large cumulative CH4 fluxes between 13 and 30 mg m−2 in dung patches, which were significantly more than the values (<5 mg m−2) obtained in urine patches of the same studies. The large CH4 flux in the D treatment occurred despite the fact that this treatment sometimes had lower soil mineral N (autumn and spring), known to inhibit soil CH4 oxidation into CO2 [32,40] compared to the remainder of the treatments, except for the C treatment. This could signify that in the current study, other drivers of soil CH4 significantly influenced the uptake inhibition by mineral N, but we did not test this in the present study. Reference [41] reported that since non-inundated soils are known CH4 sinks, deposited dung creates localized CH4 production hotspots due to high C content soil moisture, and the methanogen population in the material. This then explains the larger CH4 emissions in the dung of the current treatment compared to the other treatments used in all three experiments.

3.2.2. Soil Cumulative CO2 Fluxes

“Priming effect” is the stimulation of accelerated organic matter (OM) mineralization upon the addition of fresh C substrates (i.e., labile C) [42,43], which produces CO2. Thus, in our study herein, the large cumulative CO2 from the dung in the spring and summer experiments could have been a result of the “priming effect”. This is because the dung may have introduced a labile C source, which then stimulated C grassland OM mineralization, thus producing soil CO2. The “priming effect” is known to be high in instances where the soil has high NH4+ coupled with high C content [44]. However, some treatments with high soil NH4+ (i.e., U + DCD) had lower soil CO2 compared to the D treatment. These results highlight the interactive role of soil NH4+ and soil C in promoting OM mineralization via the “priming effect” since the other treatments did not introduce fresh C, except for the dung.

3.3. Net Global Warming Potential

The significantly large net GWP from the D treatment implies that dung deposited from grazing cattle may pose an atmospheric GHG risk. This was a result of the high CH4 being released from the dung upon deposition as well as the release of the CH4 of enteric origin embedded in the dung [30,31]. The high net GWP in the dung could also be a result of high soil CO2 immediately after deposition as a result of labile C compounds introduced by the dung stimulating microbial respiration [41].

4. Materials and Methods

4.1. Experimental Site

The three experiments (i) spring, (ii)summer, and (iii) autumn applications of different treatments were conducted on a permanent grassland site in Rothamsted Research North Wyke farm, Devon, UK (50°45′ N, 3°50′ W), between March 2012 and September 2013. For three years leading up to the commencement of the current experiment, the site was used for silage production with no livestock grazing. The climate record of North Wyke between 1982 and 2012 shows that the site has a 30-year mean annual precipitation of 1055 mm and a mean annual air temperature of 9.6 °C. The site has poorly drained silty clay loam soils of the Halstow series [45].

4.2. Initial Soil Analysis

At the commencement of the current experiment, soil analysis was carried out to determine pH (1:2.5 soil:water), phosphorus P (Olsen P) [25], and available P, available potassium (K), and available magnesium (Mg) were measured using ICP-AES (model 9800, Shimadzu, Tokyo, Japan) after ammonium lactate and acetic acid extraction. Total N was analyzed by a thermal conductivity detector (Elementar Rapid MAX N Exceed, Elementar, Berlin, Germany) after sample combustion, and total organic carbon © by modified Walkley and Black [46] and loss on ignition (LOI) methods, where the oven dry sample was placed in a furnace at 450 °C for 11 h [47]. Particle size distribution (PSD) (sand, silt, and clay) was analyzed using a laser diffraction particle sizer and bulk density by using the core-cutter method [48]. Key soil characteristics are summarized in Table 2.

4.3. Treatments Applied, Experimental Design, and Plot-Layout

4.3.1. Treatments Applied

Treatments were applied on 15th May, 3rd July, and 26th September 2012, for the spring, summer, and autumn experiments, respectively. The aim of these timings was to reflect deposition at different stages of the grazing season (early, mid, and late [24]. And, also for each application timing, new plots were established. The applied treatments were as follows: (i) control (nothing applied), (ii) natural urine (NU), (iii) natural urine + DCD (NU +DCD), (iv) artificial urine (AU), and (v) dung (D) (Table 3). The natural urine and dung were collected from 6-year-old Holstein dairy cows at Reading University, UK, which were mostly fed on grass and maize silage. The urine and dung were collected from randomly selected cows in the herd of 24 cows, which coincidentally happened to urinate and defecate during the collection of experimental materials. Fresh urine and dung were collected during each of the experiments and characterized for N-loading before application to the field (Table 3). The collected urine was stored in sealed vials at <4 °C and remained unfrozen until application. The urine and dung were stored for up to 2 days and were removed from the cold room the night before application to allow them to attain ambient temperature before application [24].
The artificial urine was prepared using a recipe suggested by [49] and detailed in [24]. The artificial and natural urine, as well as the dung were analyzed for pH (ratio urine/dung to water 1:6), dry matter (DM) (drying at 105 °C ± 5 for at least 12 h), total N and C (by sample combustion followed by separation by a GC column and analyzed using TCD detector), and readily available N, i.e., ammonium (NH4+) and nitrate (NO3)] by the formation of a diazo compound between nitrite and sulphanilamide, which is then coupled with N-1-Napthyle-thyleneddiamine dihydrochloride to give a red azo dye (color measured at 540 nm) [50]. Total organic carbon (modified Walkley-Black) was analyzed by acidification followed by carbon oxidation, and further analysis was carried out using a Leco Combustion analyzer (TruSpec MicroCHN/CHNS/O, Lakeview, Michigan, USA).
Subsamples of the bulked artificial and natural urine were prepared and applied as detailed in [24]. In the field, urine and dung were applied at rates of 5 L m−2 and 20 kg m−2, which are rates adapted from ranges of real-life deposition during grazing [51,52]. DCD (99% purity) (Sigma–Aldrich, Merck Life Science, Gillingham, UK) was mixed with urine before application and was applied at a commercially recommended rate of 10 kg ha−1; equivalent to 6.5 kg N ha−1 [16] (Table 2).

4.3.2. Experimental Design

Each experiment (spring, summer, and autumn) was set up as a randomized block design, with three replicates per treatment. Plot dimensions were 6 m × 3 m, with areas for measurements of GHG emissions, soil mineral N and moisture, grass DM production, and plant N uptake, for example [53]. On each plot, there were five urine patches and five dung patches, each measuring 60 cm × 60 cm. Each urine patch received 1.8 L of urine (a typical volume for a cattle urination event [54], which was applied using a watering can that was fitted with a perforated spray head. The application area was bordered by a frame to prevent the urine from running off the area during application. The frame was removed once the urine had soaked into the soil. Each dung patch received 4 kg of fresh dung, spread to an even thickness across the 60 × 60 cm2 area. On each plot, an additional 2 m × 2 m area was treated with dung or urine. This area was used for soil mineral N and grass DM production and N uptake measurements. For the NU + DCD treatment, the inhibitor was mixed with the urine prior to application to give a DCD application rate of 10 kg ha−1. DCD was mixed with the urine to maximize the uniformity of distribution of the very small amount of product over the treatment area and would simulate the effect of adding DCD to feed [55].

4.4. Measurements and Sampling Strategies

4.4.1. Soil CH4 and CO2 Fluxes

Soil CH4 and CO2 fluxes were measured using the static chamber technique [56,57]. In order to account for spatial variability, five of the polyvinyl chloride (PVC) chambers (40 cm width × 40 cm length × 25 cm height) were installed in each of the replicate plots using a steel base to a soil depth of 5 cm. Gas sampling was performed periodically for a whole year, between 10:00 and 13:00, using 60 mL syringes and pre-evacuated 22 mL vials fitted with a rubber septa. Sampling was performed more frequently immediately after treatment application, i.e., five times per week during the first two weeks, which was then reduced to twice per week up to week 24 and then to monthly, totaling 30 occasions for the year. During each gas sampling occasion, ten ambient air samples were taken as a surrogate for the chamber air sample (T0), and a gas sample was taken from each chamber at 40 min (T40) after closure [56]. Both CH4 and CO2 were analyzed using a Perkin Elmer Clarus 500 gas chromatograph (GC Model 107, Perkin Elmer, Buckinghamshire, UK) fitted with a flame ionization detector (FID). Gas separation was achieved employing a Perkin Elmer Elite-PLOT megabore capillary column, 30 cm long and 0.53 mm i.d., maintained at 35 °C, and N2 was used as a carrier gas. Cumulative gas emissions for each treatment and block were computed from the daily means and estimated using the trapezoidal integration method [58]. When measurements were stopped only for a few days short of a full year from the day of application, the last measured value was assumed to apply also for the last day of the year [24]. The global warming potential (GWP) of CH4 and N2O is, respectively, 27 and 273 times that of CO2 in a 100-year horizon [13]. Therefore, GWP was estimated by multiplying annual CO2, CH4, and N2O fluxes by 1, 27, and 273, respectively, and summing the results to obtain the net GWP [38]. N2O data used in the calculations were sourced from [24].

4.4.2. Soil and Meteorological Measurements

During each gas measurement event, a bulk soil sample (up to 10 cm) was collected from each block to determine soil moisture content using the gravimetric method. During fourteen predetermined events, soil samples were colometrically analyzed for NH4+ and NO3 from 2 M KCl soil extracts using a Skalar SANPLUS Analyzer (Skalar Analytical B.V., Breda, The Netherlands). Daily rainfall, soil (up to a 5 cm depth), and air (min. and max.) temperature were monitored for a whole year after treatment application. In order to adjust gas concentrations to standard temperature for flux calculations, soil temperature was measured at every gas sampling occasion using a digital thermometer (Thermo Fisher Scientific, Birmingham, UK).

4.4.3. Statistical Analysis

Genstat (version 21, VSN International, Hemel Hempstead, UK) was used for statistical analysis. Prior to statistical tests, the data were checked for normal distribution using the Shapiro–Wilk test [59,60], and the homogeneity of variance was satisfied using Levene’s test [61]. Analysis of variance (ANOVA) at p < 0.05 was performed according to the General Linear Model (GLM) procedure in the Statistical Analysis System (Version 9.4, Cary, NC, USA) when the Shapiro–Wilk test was significant (p > 0.05), and the data were confirmed to be normal. This was carried out to assess treatment differences in cumulative gas emissions of each gas, as well as differences in the measured soil characteristics between treatments. All our data were normally distributed according to the Shapiro–Wilk test. All tests were performed at the 5% probability level, and all graphs were made using SigmaPlot (Systat Software Inc., San Jose, CA, USA).

5. Conclusions

Daily soil CH4 and CO2 fluxes were controlled by soil moisture content, temperature, mineral N availability, and the addition of fresh C. The cumulative fluxes reported herein showed that dung produces high soil CH4 and CO2 under the temperate conditions of the current study. The results further highlight that dung deposition in grasslands may result in the emissions of environmentally harmful gases, including CH4 and CO2, and may predominantly result in high net GWP. Hence, exploring mitigation measures is necessary to reduce the intensities of these gases as a result of dung deposition in grazing systems.

Author Contributions

L.M.C. and D.C. conceived and designed the study. L.M.C. and D.C. conducted data gathering. J.C.D. performed statistical analyses. L.M.C., D.C. and J.C.D. wrote the article. All authors have read and agreed to the published version of the manuscript.

Funding

The authors are grateful to the UK Department for Environment, Food and Rural Affairs (DEFRA) and the Devolved Administrations for financial support via the InveN2Ory project (AC0116) and the UK GHG Platform. Rothamsted Research receives strategic funding from the Biotechnology and Biological Sciences Research Council (grant number BBS/E/C/000I0320), UK.

Data Availability Statement

All data used in this study may be available from corresponding author upon reasonable request.

Conflicts of Interest

The co-authors declare no conflict of interest.

References

  1. Havlík, P.; Valin, H.; Herrero, M.; Obersteiner, M.; Schmid, E.; Rufino, M.C.; Mosnier, A.; Thornton, P.K.; Böttcher, H.; Conant, R.T.; et al. Climate Change Mitigation through Livestock System Transitions. Proc. Natl. Acad. Sci. USA 2014, 111, 3709–3714. [Google Scholar] [CrossRef]
  2. Tubiello, F.N.; Salvatore, M.; Condor Golec, R.D.; Ferrara, A.; Rossi, S.; Biancalani, R.; Federici, S.; Jacobs, H.; Flammini, A. Agriculture, Forestry and Other Landuse Emissions by Sources and Removalsby Sinks; Food and Agricultural Organisation: Rome, Italy, 2014. [Google Scholar]
  3. Herrero, M.; Havlík, P.; Valin, H.; Notenbaert, A.; Rufino, M.C.; Thornton, P.K.; Blümmel, M.; Weiss, F.; Grace, D.; Obersteiner, M. Biomass Use, Production, Feed Efficiencies, and Greenhouse Gas Emissions from Global Livestock Systems. Proc. Natl. Acad. Sci. USA 2013, 110, 20888–20893. [Google Scholar] [CrossRef]
  4. Tully, K.L.; Abwanda, S.; Thiong’o, M.; Mutuo, P.M.; Rosenstock, T.S. Nitrous Oxide and Methane Fluxes from Urine and Dung Deposited on Kenyan Pastures. J. Environ. Qual. 2017, 46, 921–929. [Google Scholar] [CrossRef]
  5. Zhu, Y.; Merbold, L.; Leitner, S.; Xia, L.; Pelster, D.E.; Diaz-Pines, E.; Abwanda, S.; Mutuo, P.M.; Butterbach-Bahl, K. Influence of Soil Properties on N2O and CO2 Emissions from Excreta Deposited on Tropical Pastures in Kenya. Soil Biol. Biochem. 2020, 140, 107636. [Google Scholar] [CrossRef]
  6. Charteris, A.F.; Harris, P.; Marsden, K.A.; Harris, I.M.; Guo, Z.; Beaumont, D.A.; Taylor, H.; Sanfratello, G.; Jones, D.L.; Johnson, S.C.M.; et al. Within-Field Spatial Variability of Greenhouse Gas Fluxes from an Extensive and Intensive Sheep-Grazed Pasture. Agric. Ecosyst. Environ. 2021, 312, 107355. [Google Scholar] [CrossRef]
  7. López-Aizpún, M.; Horrocks, C.A.; Charteris, A.F.; Marsden, K.A.; Ciganda, V.S.; Evans, J.R.; Chadwick, D.R.; Cárdenas, L.M. Meta-analysis of Global Livestock Urine-derived Nitrous Oxide Emissions from Agricultural Soils. Glob. Change Biol. 2020, 26, 2002–2013. [Google Scholar] [CrossRef]
  8. Cardoso, A.D.S.; Oliveira, S.C.; Janusckiewicz, E.R.; Brito, L.F.; Morgado, E.D.S.; Reis, R.A.; Ruggieri, A.C. Seasonal Effects on Ammonia, Nitrous Oxide, and Methane Emissions for Beef Cattle Excreta and Urea Fertilizer Applied to a Tropical Pasture. Soil Tillage Res. 2019, 194, 104341. [Google Scholar] [CrossRef]
  9. Marsden, K.A.; Jones, D.L.; Chadwick, D.R. The Urine Patch Diffusional Area: An Important N2O Source? Soil Biol. Biochem. 2016, 92, 161–170. [Google Scholar] [CrossRef]
  10. Wen, Y.; Freeman, B.; Hunt, D.; Musarika, S.; Zang, H.; Marsden, K.A.; Evans, C.D.; Chadwick, D.R.; Jones, D.L. Livestock-Induced N2O Emissions May Limit the Benefits of Converting Cropland to Grazed Grassland as a Greenhouse Gas Mitigation Strategy for Agricultural Peatlands. Resour. Conserv. Recycl. 2021, 174, 105764. [Google Scholar] [CrossRef]
  11. Clemens, J.; Ahldrimm, H.-J. Greenhouse Gases from Animal Husbandry: Mitigation Options. Nutr. Cycl. Agroecosyst. 2001, 60, 287–300. [Google Scholar] [CrossRef]
  12. Saggar, S.; Bolan, N.S.; Bhandral, R.; Hedley, C.B.; Luo, J. A Review of Emissions of Methane, Ammonia, and Nitrous Oxide from Animal Excreta Deposition and Farm Effluent Application in Grazed Pastures. N. Z. J. Agric. Res. 2004, 47, 513–544. [Google Scholar] [CrossRef]
  13. Intergovernmental Panel on Climate Change (IPCC). Climate Change 2021. In The Physical Science Basis: Working Group I Contribution to the Sixth Assessment Report of the Intergovernmental Panel on Climate Change, 1st ed.; Cambridge University Press: Cambridge, UK, 2023; ISBN 978-1-009-15789-6. [Google Scholar]
  14. Friedlingstein, P.; O’Sullivan, M.; Jones, M.W.; Andrew, R.M.; Bakker, D.C.E.; Hauck, J.; Landschützer, P.; Le Quéré, C.; Luijkx, I.T.; Peters, G.P.; et al. Global Carbon Budget 2023. Earth Syst. Sci. Data 2023, 15, 5301–5369. [Google Scholar] [CrossRef]
  15. Rivera, J.E.; Chará, J. CH4 and N2O Emissions From Cattle Excreta: A Review of Main Drivers and Mitigation Strategies in Grazing Systems. Front. Sustain. Food Syst. 2021, 5, 657936. [Google Scholar] [CrossRef]
  16. Moir, J.; Cameron, K.; Di, H. Potential Pasture Nitrogen Concentrations and Uptake from Autumn or Spring Applied Cow Urine and DCD under Field Conditions. Plants 2016, 5, 26. [Google Scholar] [CrossRef]
  17. Monaghan, R.M.; Smith, L.C.; Ledgard, S.F. The Effectiveness of a Granular Formulation of Dicyandiamide (DCD) in Limiting Nitrate Leaching from a Grazed Dairy Pasture. N. Z. J. Agric. Res. 2009, 52, 145–159. [Google Scholar] [CrossRef]
  18. Amberger, A. Research on Dicyandiamide as a Nitrification Inhibitor and Future Outlook. Commun. Soil Sci. Plant Anal. 1989, 20, 19–20. [Google Scholar] [CrossRef]
  19. Luo, J.; Ledgard, S.; Wise, B.; Lindsey, S. Effect of Dicyandiamide (DCD) on Nitrous Oxide Emissions from Cow Urine Deposited on a Pasture Soil, as Influenced by DCD Application Method and Rate. Anim. Prod. Sci. 2016, 56, 350. [Google Scholar] [CrossRef]
  20. Hutsch, B.W. Methane Oxidation in Arable Soil as Inhibited by Ammonium, Nitrite, and Organic Manure with Respect to Soil pH. Biol. Fertil. Soils 1998, 28, 27–35. [Google Scholar] [CrossRef]
  21. Kravchenko, I.; Boeckx, P.; Galchenko, V.; Van Cleemput, O. Short- and Medium-Term Effects of NH4+ on CH4 and N2O Fluxes in Arable Soils with a Different Texture. Soil Biol. Biochem. 2002, 34, 669–678. [Google Scholar] [CrossRef]
  22. Tlustos, P.; Willison, T.W.; Baker, J.C.; Murphy, D.V.; Pavlikova, D.; Goulding, K.W.T.; Powlson, D.S. Short-Term Effects of Nitrogen on Methane Oxidation in Soils. Biol. Fertil. Soils 1998, 28, 64–70. [Google Scholar] [CrossRef]
  23. Bronson, K.F.; Mosier, A.R. Suppression of Methane Oxidation in Aerobic Soil by Nitrogen Fertilizers, Nitrification Inhibitors, and Urease Inhibitors. Biol. Fertil. Soils 1994, 17, 263–268. [Google Scholar] [CrossRef]
  24. Cardenas, L.M.; Misselbrook, T.M.; Hodgson, C.; Donovan, N.; Gilhespy, S.; Smith, K.A.; Dhanoa, M.S.; Chadwick, D. Effect of the Application of Cattle Urine with or without the Nitrification Inhibitor DCD, and Dung on Greenhouse Gas Emissions from a UK Grassland Soil. Agric. Ecosyst. Environ. 2016, 235, 229–241. [Google Scholar] [CrossRef] [PubMed]
  25. Olsen, S.R.; Sommers, L.E. Phosphorus. In Methods of Soil Analysis: Part 2. Chemical and Microbiological Properties, 2nd ed.; Agron. Mongr. 9; ASA and SSSA: Madison, WI, USA, 1982. [Google Scholar]
  26. Jiang, Y.; Tang, S.; Wang, C.; Zhou, P.; Tenuta, M.; Han, G.; Huang, D. Contribution of Urine and Dung Patches from Grazing Sheep to Methane and Carbon Dioxide Fluxes in an Inner Mongolian Desert Grassland. Asian Australas. J. Anim. Sci 2011, 25, 207–212. [Google Scholar] [CrossRef][Green Version]
  27. Chadwick, D.R.; Pains, B.F.; Brookman, S.K.E. Nitrous Oxide and Methane Emissions Following Application of Animal Manures to Grassland. J. Environ. Qual. 2000, 29, 277–287. [Google Scholar] [CrossRef]
  28. Maljanen, M.E.; Virkajärvi, P.; Martikainen, P.J. Dairy Cow Excreta Patches Change the Boreal Grass Swards from Sink to Source of Methane. Agric. Food Sci. 2012, 21, 91–99. [Google Scholar] [CrossRef]
  29. Nichols, K.L.; Del Grosso, S.; Derner, J.D.; Follet, R.F.; Archibeque, S.L.; Stewart, C.E.; Paustin, K.H. Nitrous Oxide and Methane Fluxes from Cattle Excrement on C3 Pasture and C4-Dominated Shortgrass Steppe. Agric. Ecosyst. Environ. 2016, 225, 104–115. [Google Scholar] [CrossRef]
  30. Castaldi, S.; Fierro, A. Soil-Atmosphere Methane Exchange in Undisturbed and Burned Mediterranean Shrubland of Southern Italy. Ecosystems 2005, 8, 182–190. [Google Scholar] [CrossRef]
  31. Wang, Y.; Dong, H.; Zhu, Z.; Liu, C.; Xin, H. Comparison of Air Emissions from Raw Liquid Pig Manure and Biogas Digester Effluent Storages. Trans. ASABE 2014, 57, 635–645. [Google Scholar] [CrossRef]
  32. Bian, R.; Niu, Y.; Du, X.; Gao, C.; Zhang, T.; Zhu, R.; Sun, Y.; Wang, Y. New Insights into the Effect of H2S Stress on CH4 Oxidation in Landfill Cover Soils from the CH4-Derived Carbon Allocation and Its Microbial Mechanism. Process Saf. Environ. Prot. 2025, 200, 107363. [Google Scholar] [CrossRef]
  33. Wang, Z.; Shi, L.-D.; Lai, C.-L.; Zhao, H.-P. Methane Oxidation Coupled to Vanadate Reduction in a Membrane Biofilm Batch Reactor under Hypoxic Condition. Biodegradation 2019, 30, 457–466. [Google Scholar] [CrossRef]
  34. Gulledge, J.; Schimel, J.P. Moisture Control over Atmospheric CH4 Consumption and CO2 Production in Diverse Alaskan Soils. Soil Biol. Biochem. 1998, 30, 1127–1132. [Google Scholar] [CrossRef]
  35. Bedard, C.; Knowles, R. Physiology, Biochemistry, and Specific Inhibitors of CH4, NH4+, and CO Oxidation by Methanotrophs and Nitrifiers. Microbiol. Rev. 1989, 53, 68–84. [Google Scholar] [CrossRef] [PubMed]
  36. Bol, R.; Ostle, N.J.; Chenu, C.C.; Petzke, K.-J.; Werner, R.A.; Balesdent, J. Long Term Changes in the Distribution and δ15N Values of Individual Soil Amino Acids in the Absence of Plant and Fertiliser Inputs. Isot. Environ. Health Stud. 2006, 40, 243–256. [Google Scholar] [CrossRef] [PubMed]
  37. Maier, M.; Schack-Kirchner, H.; Hildebrand, E.E.; Schindler, D. Soil CO2 Efflux vs. Soil Respiration: Implications for Flux Models. Agric. For. Meteorol. 2011, 151, 1723–1730. [Google Scholar] [CrossRef]
  38. Del Grosso, S.; Ogle, S.; Wirth, J.; Skiles, S. U.S. Agriculture and Forestry Greenhouse Gas Inventory: 1990–2005; USDA Technical Bulletin; USDA: Washington, DC, USA, 2008. [Google Scholar]
  39. Sainju, U.M.; Stevens, W.B.; Caesar-TonThat, T.; Jabro, J.D. Land Use and Management Practices Impact on Plant Biomass Carbon and Soil Carbon Dioxide Emission. Soil Sci. Soc. Am. J. 2010, 74, 1613–1622. [Google Scholar] [CrossRef]
  40. Wang, Y.; Cheng, S.; Fang, H.; Yu, G.; Xu, M.; Dang, X.; Li, L.; Wang, L. Simulated Nitrogen Deposition Reduces CH4 Uptake and Increases N2O Emission from a Subtropical Plantation Forest Soil in Southern China. PLoS ONE 2014, 9, e93571. [Google Scholar] [CrossRef]
  41. Chadwick, D.R.; Pain, B.F. Methane Fluxes Following Slurry Applications to Grassland Soils: Laboratory Experiments. Agric. Ecosyst. Environ. 1997, 63, 51–60. [Google Scholar] [CrossRef]
  42. Pascual, J.A.; Hernandez, T.; Garcia, C.; Ayuso, M. Enzymatic Activities in an Arid Soil Amended with Urban Organic Wastes: Laboratory Experiment. Bioresour. Technol. 1998, 64, 131–138. [Google Scholar] [CrossRef]
  43. Kuzyakov, Y.; Friedel, J.K.; Stahr, K. Review of Mechanisms and Quantification of Priming Effects. Soil Biol. Biochem. 2000, 32, 1485–1498. [Google Scholar] [CrossRef]
  44. Bramble, D.E.; Gouvela, G.A.; Ramnarine, R.; Farrell, R.E. Short-Term Effects of Aglime on Inorganic- and Organic-Derived CO2 Emissions from Two Acid Soils Amended with an Ammonium-Based Fertiliser. J. Soils Sediments 2019, 20, 52–65. [Google Scholar] [CrossRef]
  45. Harrod, T.R.; Hogan, D.V. The Soils of North Wyke and Rowden. 2008, pp. 1–54. Available online: https://repository.rothamsted.ac.uk/id/eprint/27276/ (accessed on 4 December 2025).
  46. Walkley, A.; Black, I.A. An Examination of the Degtjareff Method for Determining Soil Organic Matter, and a Proposed Modification of the Chromic Acid Titration Method. Soil Sci. 1934, 37, 29–38. [Google Scholar] [CrossRef]
  47. Nelson, D.W.; Sommers, L.E. Total Carbon, Organic Carbon, and Organic Matter. In Methods of Soil Analysis: Part 2 Chemical and Microbiological Properties; Wiley: Hoboken, NJ, USA, 1982; Volume 9, pp. 539–579. [Google Scholar]
  48. Amirinejad, A.A.; Kamble, K.; Aggarwal, P.; Chakraborty, D. Assessment and Mapping of Spatial Variation of Soil Physical Health in a Farm. Geoderma 2011, 160, 292–303. [Google Scholar] [CrossRef]
  49. Kool, D.M.; Hoffland, E.; Abrahamse, S.P.A.; Van Groningen, J.W. What Artificial Urine Composition Is Adequate for Simulating Soil N2O Fluxes and Mineral N Dynamics? Soil Biol. Biochem. 2006, 38, 1757–1763. [Google Scholar] [CrossRef]
  50. American Public Health Association. Standard Methods for the Examination of Water and Wastewater; American Public Health Association: Washington, DC, USA, 1999. [Google Scholar]
  51. Sugimoto, Y.; Ball, P.R. Nitrogen Losses from Cattle Dung. In Proceedings of the XVI International Grassland Congress, Nice, France, 4–11 October 1998; Volume 1. [Google Scholar]
  52. De Klein, C.A.; Shepherd, M.A.; Van Der Weerden, T.J. Nitrous Oxide Emissions from Grazed Grasslands: Interactions between the N Cycle and Climate Change—A New Zealand Case Study. Curr. Opin. Environ. Sustain. 2014, 9–10, 131–139. [Google Scholar] [CrossRef]
  53. Bell, M.J.; Rees, R.M.; Cloy, J.M.; Topp, C.F.E.; Bagnall, A.; Chadwick, D.R. Nitrous Oxide Emissions from Cattle Excreta Applied to a Scottish Grassland: Effects of Soil and Climatic Conditions and a Nitrification Inhibitor. Sci. Total Environ. 2015, 508, 343–353. [Google Scholar] [CrossRef] [PubMed]
  54. Misselbrook, T.; Fleming, H.; Camp, V.; Umstatter, C.; Duthie, C.-A.; Nicoll, L.; Waterhouse, T. Automated Monitoring of Urination Events from Grazing Cattle. Agric. Ecosyst. Environ. 2016, 230, 191–198. [Google Scholar] [CrossRef]
  55. Minet, E.P.; Ledgard, S.F.; Lanigan, G.J.; Murphy, J.B.; Grant, J.; Hennessy, D.; Lewis, E.; Forrestal, P.; Richards, K.G. Mixing Dicyandiamide (DCD) with Supplementary Feeds for Cattle: An Effective Method to Deliver a Nitrification Inhibitor in Urine Patches. Agric. Ecosyst. Environ. 2016, 231, 114–121. [Google Scholar] [CrossRef]
  56. Chadwick, D.R.; Cardenas, L.; Misselbrook, T.H.; Smith, K.A.; Rees, R.M.; Watson, C.J.; McGeough, K.L.; Williams, J.R.; Cloy, J.M.; Thorman, R.E.; et al. Optimizing Chamber Methods for Measuring Nitrous Oxide Emissions from Plot-based Agricultural Experiments. Eur. J Soil Sci. 2014, 65, 295–307. [Google Scholar] [CrossRef]
  57. De Klein, C.; Harvey, M. Nitrous Oxide Chamber Methodology Guidelines, Global Research Alliance on Agricultural Greenhouse Gases; Ministry of Primary Industries: Wellington, New Zealand, 2013. [Google Scholar]
  58. Cardenas, L.M.; Thorman, R.; Ashlee, N.; Butler, M.; Chadwick, D.; Chambers, B.; Cuttle, S.; Donovan, N.; Kingston, H.; Lane, S.; et al. Quantifying Annual N2O Emission Fluxes from Grazed Grassland under a Range of Inorganic Fertiliser Nitrogen Inputs. Agric. Ecosyst. Environ. 2010, 136, 218–226. [Google Scholar] [CrossRef]
  59. D’Agostino, R. Goodness-of-Fit-Techniques; Routledge: London, UK, 2017. [Google Scholar]
  60. Welham, S.J.; Gezan, S.A.; Clark, S.J.; Mead, A. Statistical Methods in Biology: Design and Analysis of Experiments and Regression; CRC Press: Boca Raton, FL, USA, 2014. [Google Scholar]
  61. O’Neill, M.E.; Mathews, K. Theory & Methods: A Weighted Least Squares Approach to Levene’s Test of Homogeneity of Variance. Aust. N. Z. J. Stat. 2000, 42, 81–100. [Google Scholar] [CrossRef]
Figure 1. Monthly average rainfall, air temperature, and soil temperature at 5 cm soil surface in the experimental site during the experiment.
Methane 05 00004 g001
Figure 2. Soil %WFPS variability between autumn, spring, and summer.
Methane 05 00004 g002
Figure 3. Soil CH4 fluxes as influenced by the different treatments in autumn, spring, and summer (N = 3). Note, different y-axis scales.
Methane 05 00004 g003
Figure 4. Soil CO2 dynamics as influenced by the different treatments in the autumn, spring, and summer (N = 3). Note, different y-axis scales.
Methane 05 00004 g004
Figure 5. Cumulative (A) CH4 and (B) CO2 emissions as influenced by the different treatments in autumn, spring, and summer. Vertical lines are standard errors of the mean (N = 3). Treatments with the same letter are not significantly different to each other.
Methane 05 00004 g005
Table 1. Cumulative CH4, CO2, and net GWP emissions (CO2e) for the different treatments.
TreatmentCH4CO2Net GWP
(kg CO2e ha−1 yr−1)(kg CO2e ha−1 yr−1)(kg CO2-eq. ha−1 yr−1)
Control278.8 ± 60.5 c,¥363.4 ± 10.3 c110,513.8 ± 5072.2 c
Urine287.1 ± 131.5 c403.1 ± 20.6 b127,039.8 ± 7359.2 b
Urine + DCD569.8 ± 295.0 b424.5 ± 16.1 b131,864.9 ± 12,266.2 b
Artificial Urine377.8 ± 100.1 b415.5 ± 20.1 b130,616.0 ± 7537.5 b
Dung1390.8 ± 491.1 a444.2 ± 1.1 a139,463.4 ± 4345.2 a
¥ All values are mean ± standard error. Values within a column for each treatment followed by the same letter are not significantly different at the α = 0.05 probability level.
Table 2. Soil characteristics at the commencement of the experiment at the Beacon Field, North Wyke.
Soil VariableMean ± Standard Error
Soil textureSilty clay loam
Sand (0.063–2.0 mm)13.6 ± 5.6
Silt (0.002–0.063)43.2 ± 3.0
Clay (<0.002 mm)43.2 ± 6.4
pH5.73
Available P (mg kg−1 dry soil)28.3
Available K (mg kg−1 dry soil)197.3
Available Mg (mg kg−1 dry soil)102.7
Organic C (%)5.37
Total N (%w/w)0.52
Bulk Density (g cm−3)0.62 ± 0.01
Table 3. Description of the three experiments in the current study.
SpringSummerAutumn
Start date15 May 20123 July 201226 September 2012
End date9 May 201311 June 201310 September 2013
Natural urine N loading (kg N ha−1)405429435
Artificial urine N loading (kg N ha−1)440481423
Dung N loading (kg N ha−1)911625771
NU + DCD loading (kg N ha−1)395436454
Grass harvest dates1st: 19 June 2012
2nd: 28 August 2012
1st: 9 August 2012
2nd: 25 May 2013
25 May 2013
NB: For the NU + DCD, the N in the DCD was considered in the total N applied.
Disclaimer/Publisher’s Note: The statements, opinions and data contained in all publications are solely those of the individual author(s) and contributor(s) and not of MDPI and/or the editor(s). MDPI and/or the editor(s) disclaim responsibility for any injury to people or property resulting from any ideas, methods, instructions or products referred to in the content.