Article

Exploring the Transition from Petroleum to Natural Gas in Tanzania’s Road Transport Sector: A Perspective on Energy, Economy, and Environmental Assessment

by
Gerutu Bosinge Gerutu
1,
Esebi Alois Nyari
1,
Frank Lujaji
1,
Mathew Khilamile
2,3,
Kenedy Aliila Greyson
4,
Oscar Andrew Zongo
3 and
Pius Victor Chombo
3,*
1
Section of Energy, Department of Mechanical Engineering, Dar es Salaam Institute of Technology, Bibi Titi—Morogoro Road Junction, Ilala, P.O. Box 2958, Dar es Salaam 11104, Tanzania
2
Tanzania Electric Supply Company (TANESCO), P.O. Box 31438, Plot No. 32, Msese Road, Kinondoni, Dar es Salaam 16103, Tanzania
3
Section of Energy, Department of Electrical Engineering, Dar es Salaam Institute of Technology, Bibi Titi—Morogoro Road Junction, Ilala, P.O. Box 2958, Dar es Salaam 11104, Tanzania
4
Department of Electronics and Telecommunication Engineering, Dar es Salaam Institute of Technology, Bibi Titi—Morogoro Road Junction, Ilala, P.O. Box 2958, Dar es Salaam 11104, Tanzania
*
Author to whom correspondence should be addressed.
Methane 2025, 4(2), 12; https://doi.org/10.3390/methane4020012
Submission received: 15 October 2024 / Revised: 10 November 2024 / Accepted: 21 November 2024 / Published: 26 May 2025
(This article belongs to the Special Issue CNG and LNG for Sustainable Transportation Systems)

Abstract

:
This study assesses the energy, economic, and environmental implications of switching Tanzania’s road transport sector to natural gas, which is slowly transitioning. In energy, the main goal is to identify the energy demand for petroleum fuel (diesel and petrol) and natural gas during the transition, while in the economy, the government revenue in the form of taxes for shifted and unshifted vehicles, as well as the loss in government revenue from petroleum fuel revenue post-transition, is assessed. In the environment, carbon emission in terms of carbon dioxide equivalent (CO2e), carbon tax revenues, and carbon credit revenues post-transition is estimated. The shift involved 10, 20, and 30% of the road vehicle population. The 10, 20, and 30% shift targeted about 142,247, 183,893, and 225,540 vehicles, which in turn dropped diesel and petrol demand by 7 and 3.68%, 7 and 3.8%, and 15 and 7.5%, respectively. In natural gas, the demand started at 0.0916 billion kg and grew exponentially by 200% and later by 300%. The transition has consequences in government revenue, which takes the form of taxes on petroleum products. The shift from 10 to 30% could lead to foregone taxes amounting to Tanzania shilling TZS 0.09, 0.31, and 0.54 trillion (US$ 33,358,680, US$ 11,490,212, and US$ 20,015,208), indicating a tax loss of about 3, 9, and 15%. Contrary, the government may benefit from these losses by lowering the amount of foreign currency necessary for oil importation. In environmental benefits, the 10, 20, and 30% shift could offset approximately 8,959,198.92119, 8,438,863.65528, and 7,918,528.38937 tCO2e, equivalent to 5.4, 10.97, and 16.47% of the road emissions. The post-transition road emissions might result in a carbon tax revenue of about US$ 71,673,591.37, 67,510,909.24, and 63,348,227.11 per year. The post-transition carbon credit revenue of about US$ 20,813,410.64, 41,626,821.27, and 62,440,231.91 is expected annually. The findings are critical for policy design and promoting a transition in the road transport sector.

1. Introduction

As global energy consumption rises [1] and environmental laws tighten [2], the need for greener fuels grows rapidly [3]. Following crude oil, natural gas has emerged as one of the world’s most essential energy sources [4,5,6]. As of 2022, there were an estimated 210.06 trillion standard cubic meters (TCM) of total global proven natural gas reserve, globally [7], led by Russia (47.759 trillion standard cubic meters -TCM), Iran (33.988), Qatar (23.831), and others [8]. About half of African countries have proven natural gas reserves, totaling roughly 17.5 TCM, which is around 9% of the global total gas reserves. They are especially prevalent in northern Africa (45% of African reserves) and western Africa (32%) [9]. The continent’s vast natural gas reserves can play an important role in its energy transformation.
In Eastern Africa, Tanzania has recently discovered a natural gas potential of about 57.4 TCF as of 2016 [10,11] of natural gas. In Tanzania, the transport sector is a major consumer of energy, especially petroleum fuels such as petrol and diesel, accounting to 56% of the primary energy demand (2024), with an increment of 17% from the previous year [11]. The sector is mainly dominated by road transport, which accounts for about 90% of passenger and 75% of freight traffic [12]. According to the International Energy Agency (IEA), Tanzania’s transport sector consumed about 3.8 million tons of oil equivalent (Mtoe) in 2018, representing 28% of the total final consumption in Tanzania [12]. Consequently, this made CO2 emissions from the transport sector in Tanzania to increase from 3.2 million tons to 5.4 million tons, representing a growth rate of 9.1% per year [12]. Tanzania’s road transport industry was spiked by imported vehicles in 2023, reaching 8,847,000 units (including motorcycles, rickshaws, light-duty vehicles, medium-duty passenger vehicles, heavy-duty passenger vehicles, heavy-duty vehicles, trailers, agricultural trailers, construction equipment, and others), while imported oil totaled 57,439,968.46 L and 27,130,316.54 L for diesel and petrol, respectively [13]. This resulted in roughly TZS 1,432,780,080,765 for the fiscal year 2023 [14]. The majority of countries, like Tanzania, rely heavily on taxation, particularly oil taxes, as a key source of government income, providing governments with the finances necessary to invest in development, combat poverty, and provide public services. However, the sluggish policy transformation has kept Tanzania reliant on petroleum earnings and delayed its shift to natural gas utilization. This, in turn, has created significant uncertainty regarding the choice to invest in a liquefied natural gas facility, the entire volume of petroleum reserves, and future petroleum prices.
In India, after the order from Supreme Court in July 1998 to adopt the compressed natural gas (CNG) as “unadulterable gaseous fuel”, the government (in Delhi city) provided incentives only for three-wheelers and taxi owners, a loan package with 4% interest subsidy, VAT subsidy to phase out 15-years old diesel light commercial vehicles, CNG fuel for automotive use fully exempted from sales tax, and introduce an Ambience fee fund with a contribution of TZS 8 per liter of diesel sales (started in 2008) [15]. Furthermore, the country prepared the national roadmap (2009–2014) targeting potential vehicles, households, and cities of about 3,708,965, 14,871,385, and 298, respectively. The country expected to expand its pipeline network to 15,000 km to link around 150 to 200 cities by 2014 [15], and at present the country has around 17,000 km in service [16]. In 1984, the Brazilian government engaged in activities to replace diesel with CNG in public transportation. In 1987, the Ministry of Mines and Energy announced the National Plan of Natural Gas to replace or move diesel use and support states to comply to this policy [17]. In its implementation, four diesel buses were experimented, light-duty cabs were incentivized, and motor vehicle property tax in some states were reduced from 4% to 1% of the current value of the vehicle to steer to growth of natural gas vehicles. In 2017, Nigeria put in force a natural gas policy to replace the 2008 Nigeria Gas Masterplan with the goal of transitioning Nigeria from a crude oil export-based economy to a gas-based industrial economy [18] to utilize its 200.14 TCF proven natural gas reserve (2018) [19]. In 2019, the Nigerian transport sector focused on five specific measures: renewing the urban bus fleet (5000 new buses), adopting CNG buses (25% of all buses to use CNG by 2030), introducing low-sulfur diesel and petrol, eliminating high-polluting vehicles, and reducing road vehicle journeys. In 2020, Nigeria initiated the National Gas Expansion Programme (NGEP), with the goal of converting 1 million vehicles to use CNG by 2021 [20]. The findings from the literature have shown different measures taken by countries to support the use of CNG as cleaner fuel including the introduction of carbon tax and credit.
The transport industry is a huge and typical energy-dependent sector, resulting in excessive resource consumption and increased environmental degradation. Under energy and environmental constraints, improving low-carbon transport while maintaining stable economic growth presents a significant challenge for the transport sector [21]. Several measures, such as a carbon tax, credit, quota, and energy tax [21,22,23,24], have been implemented decades ago to reduce reliance on fossil fuels and carbon emissions, especially in the transport sector. The carbon tax is regarded as an important tool to reduce energy demand and carbon emissions in transport sectors. In countries such as the United Kingdom, Denmark, Sweden, Norway, Finland, France, Germany, and Japan, carbon tax has been claimed to provide a practical and efficient measure to reduce carbon emissions [21]. Davis and Kilian [25] studied the effect of increasing the gasoline tax and found that a 10-cent tax increase would reduce carbon emissions from the transportation sector by about 1.5% in the United States. In India, the carbon tax became operational in 2010. Gupta [26] and Chatterjee et al. [27] suggested that annual emission reduction costs for Andhra Pradesh and Himachal Pradesh could reach Rs 7190 and Rs 6624, respectively, for a Euro III passenger car. Gupta [26] found that implementing a carbon tax in the transportation sector reduced CO2 emissions by around 40% compared to the no-carbon tax scenario. Furthermore, they recommended that to be effective, a carbon tax should be designed to be revenue neutral.
Another measure for emission reduction is carbon credit. Carbon credits, which characterize the avoidance, decrease, or elimination of GHGs to compensate for emissions made somewhere else, provide a carbon reduction measure that can play an important role in a more sustainable and nature-positive future. This measure is currently implemented in cities like Milan, Lisbon, Stockholm, and others, and it has exhibited promising outcomes [28]. Gupta and Rakshit [29] assessed decarbonization in difficult-to-abate industries in India using credible carbon credits, revealing an annual carbon credit demand of around 487 MtCO2e under the India benchmark scenario. Tangvitoontham and Chaiwat [30] estimated the carbon dioxide equivalent emission of shifting the truck freight to the railway from Lat Krabang, Bangkok to Laem Chabang Port, Chonburi. Their findings revealed a reduction of approximately 201,256.60 tCO2e per year and a carbon credit revenue of about 90.84 million baht per year. Yu, Ding, and Jian [31] proposed a credit-based reservation scheme to encourage a switch from private car usage to public transit to reduce carbon emissions and traffic congestion.
Tanzania’s government faces hurdles in transitioning to natural gas [32,33] despite having a large natural gas reservoir. One of the challenges is a lack of a roadmap for switching the road transport sector to natural gas, as well as a lack of awareness about the income lost. This has kept its transportation industry, a key oil user, and economy heavily reliant on foreign oil.
The objective of this study is to explore the transition of Tanzania’s road transport sector from using petroleum to natural gas. The contributions of this study are as follows:
  • The number of road vehicles and their related fuel consumption are evaluated. The main target is to quantify the annual fuel demand, which includes petroleum fuel (diesel and petrol) demand for road vehicles prior to transition, natural gas demand during transition, and reduction in petroleum fuel demand post-transition.
  • The government revenue from petroleum fuel usage in an annual basis is assessed. The foregone revenue is estimated at a 10, 20, and 30% shift of vehicles from petroleum to natural gas. The percent shift of vehicles is for both diesel and petrol vehicles. The foregone revenue is computed to assess the percentage loss in government revenue post-transition.
  • The environmental benefits of the transition to natural gas in road sector are assessed.

2. Materials and Methods

2.1. Overview of Tanzania’s Road Transport Sector

Transport in Tanzania includes roads, railways, aviation, and maritime networks. In Tanzania, like most nations in the region, roads are the most dominant mode of transport [34] for goods delivery and mobility. They carry approximately 90% of the passengers and more than 75% of the freight traffic flow in Tanzania [35]. The Tanzania’s road transport includes bicycles, motorcycles, tricycles, light-duty private cars (mostly SUVs and Sedan), medium buses, medium trucks, large trucks, and heavy-duty trucks. This share of transport is currently predominated by privately owned cars. For instance, the majority of city dwellers move around the city using public paratransit minibuses commonly known as daladala, with a lesser proportion of cycling and walking [32]. By contrast, the other popular means of public mobility commonly used for in-city distant trips in most urban and sub-urban areas include motorcycles and tricycles. Several years ago, the newly built Dar es Salaam bus rapid transit (also known as Mwendokasi) and conventional train that operates occasionally on some selected routes were operational in Dar es Salaam (only one city), which is the country’s largest metropolis, populous, prominent, and financial hub. Mwendokasi is a metro bus system and is a faster mode of transportation in Dar es Salaam city than minibuses due to its lower traffic volume. With the geometric population growth and uncontrolled urban sprawl, motorcycles and tricycles are preferred by most dwellers because they allow them to enter the city more quickly than minibuses, which confront heavy traffic during peak hours.

2.2. Trends in Vehicle Growth and Oil Imports

To date, motorcycles and tricycles have been employed to enhance the provision of access to public services. According to the Tanzania National Roads Agency [36], the motorization rate grew by 11% each year between 2013 and 2017, from 28 to 43 vehicles per 1000 inhabitants. The majority of vehicles plying on Tanzanian roads are imported from other countries. By 2021, the number of vehicles had surpassed over 8 million units. Figure 1 depicts the shares of the vehicles [13]. As illustrated in Figure 1, motorcycles are the largely road-based mode of transportation, which takes about 20% of all vehicle population, followed by minibuses and SUVs and Sedans. These above vehicles serve the large purposes of urban passenger mobility in cities and goods deliveries to sustain life living. The remaining vehicles, such as large buses, and medium and heavy trucks, are used for intracity mobility and product transportation and play an important part in intracity firms’ supply chain management.
Tanzania is a net importer of petroleum products, procured through a Bulk Procurement System (BPS). The imported petroleum products cover the following grades: Automotive Gas Oil (AGO), unleaded Motor Spirit Premium (MSP), Jet A-1, and Illuminating Kerosene (IK). These petroleum products are received via 22 oil-receiving terminals having total storage capacity of 1,288,101 cubic meters [13,37,38]. In 2022, Tanzania imported $5.19 billion in refined petroleum, mostly coming from India ($2.39 billion), the United Arab Emirates ($1.83 billion), Saudi Arabia ($336 million), Oman ($128 million), and South Korea ($113 million) [39].

3. Data Analysis

3.1. Estimation of Annual Fuel Demand

To estimate the annual fuel demand, the fuel consumption of each vehicle category needs to be estimated. It should be noted that the driving routines and typical activities are based in Tanzanian communities. For instance, the fuel consumption of motorcycles and tricycles was based on short trip distances, but minibuses (daladala) were based on typical operating routes in the most populous city of Dar es Salaam. The large buses, medium trucks, and heavy-duty trucks were considered as those used for regional commodity distribution. The fuel consumptions are expressed in liters per day.
For the proper estimation of annual fuel demand, government revenue, and environmental savings, the following assumptions are used:

Assumptions

  • In dual-fuel engine, the fuel is 70% natural gas and 30% diesel (70:30) proportion as adopted from several studies [33,40,41].
  • In bi-fuel engine, the fuel is 100% petrol or 100% natural gas.
  • Fuel prices: TZS 1550/kg of natural gas, TZS 3190/L of petrol, TZS 3112/L of diesel,
  • Natural gas is a non-taxed fuel.
  • Transition rates: 10, 20, and 30% of vehicle population considered in this study.
  • Fuel conversion factors: 10 kWh/1 L of diesel, 8.9 kWh/1 L of petrol, 13.6 kWh/1 kg of natural gas.
  • Government revenue from petroleum fuel sales is considered to be 30%.
  • The emission factors are 2.7 kgCO2e/L of diesel, 2.31 kgCO2e/L of petrol, and 2.25 kgCO2e/kg of natural gas [42].
  • The carbon tax is considered as 8.0 US$/tCO2e [32].
  • The carbon credit is taken as 40 US$/tCO2e computed in yearly basis [43,44].
  • The exchange rate regarded in the study is 2710 TZS/US$ as of August 2024 [45].
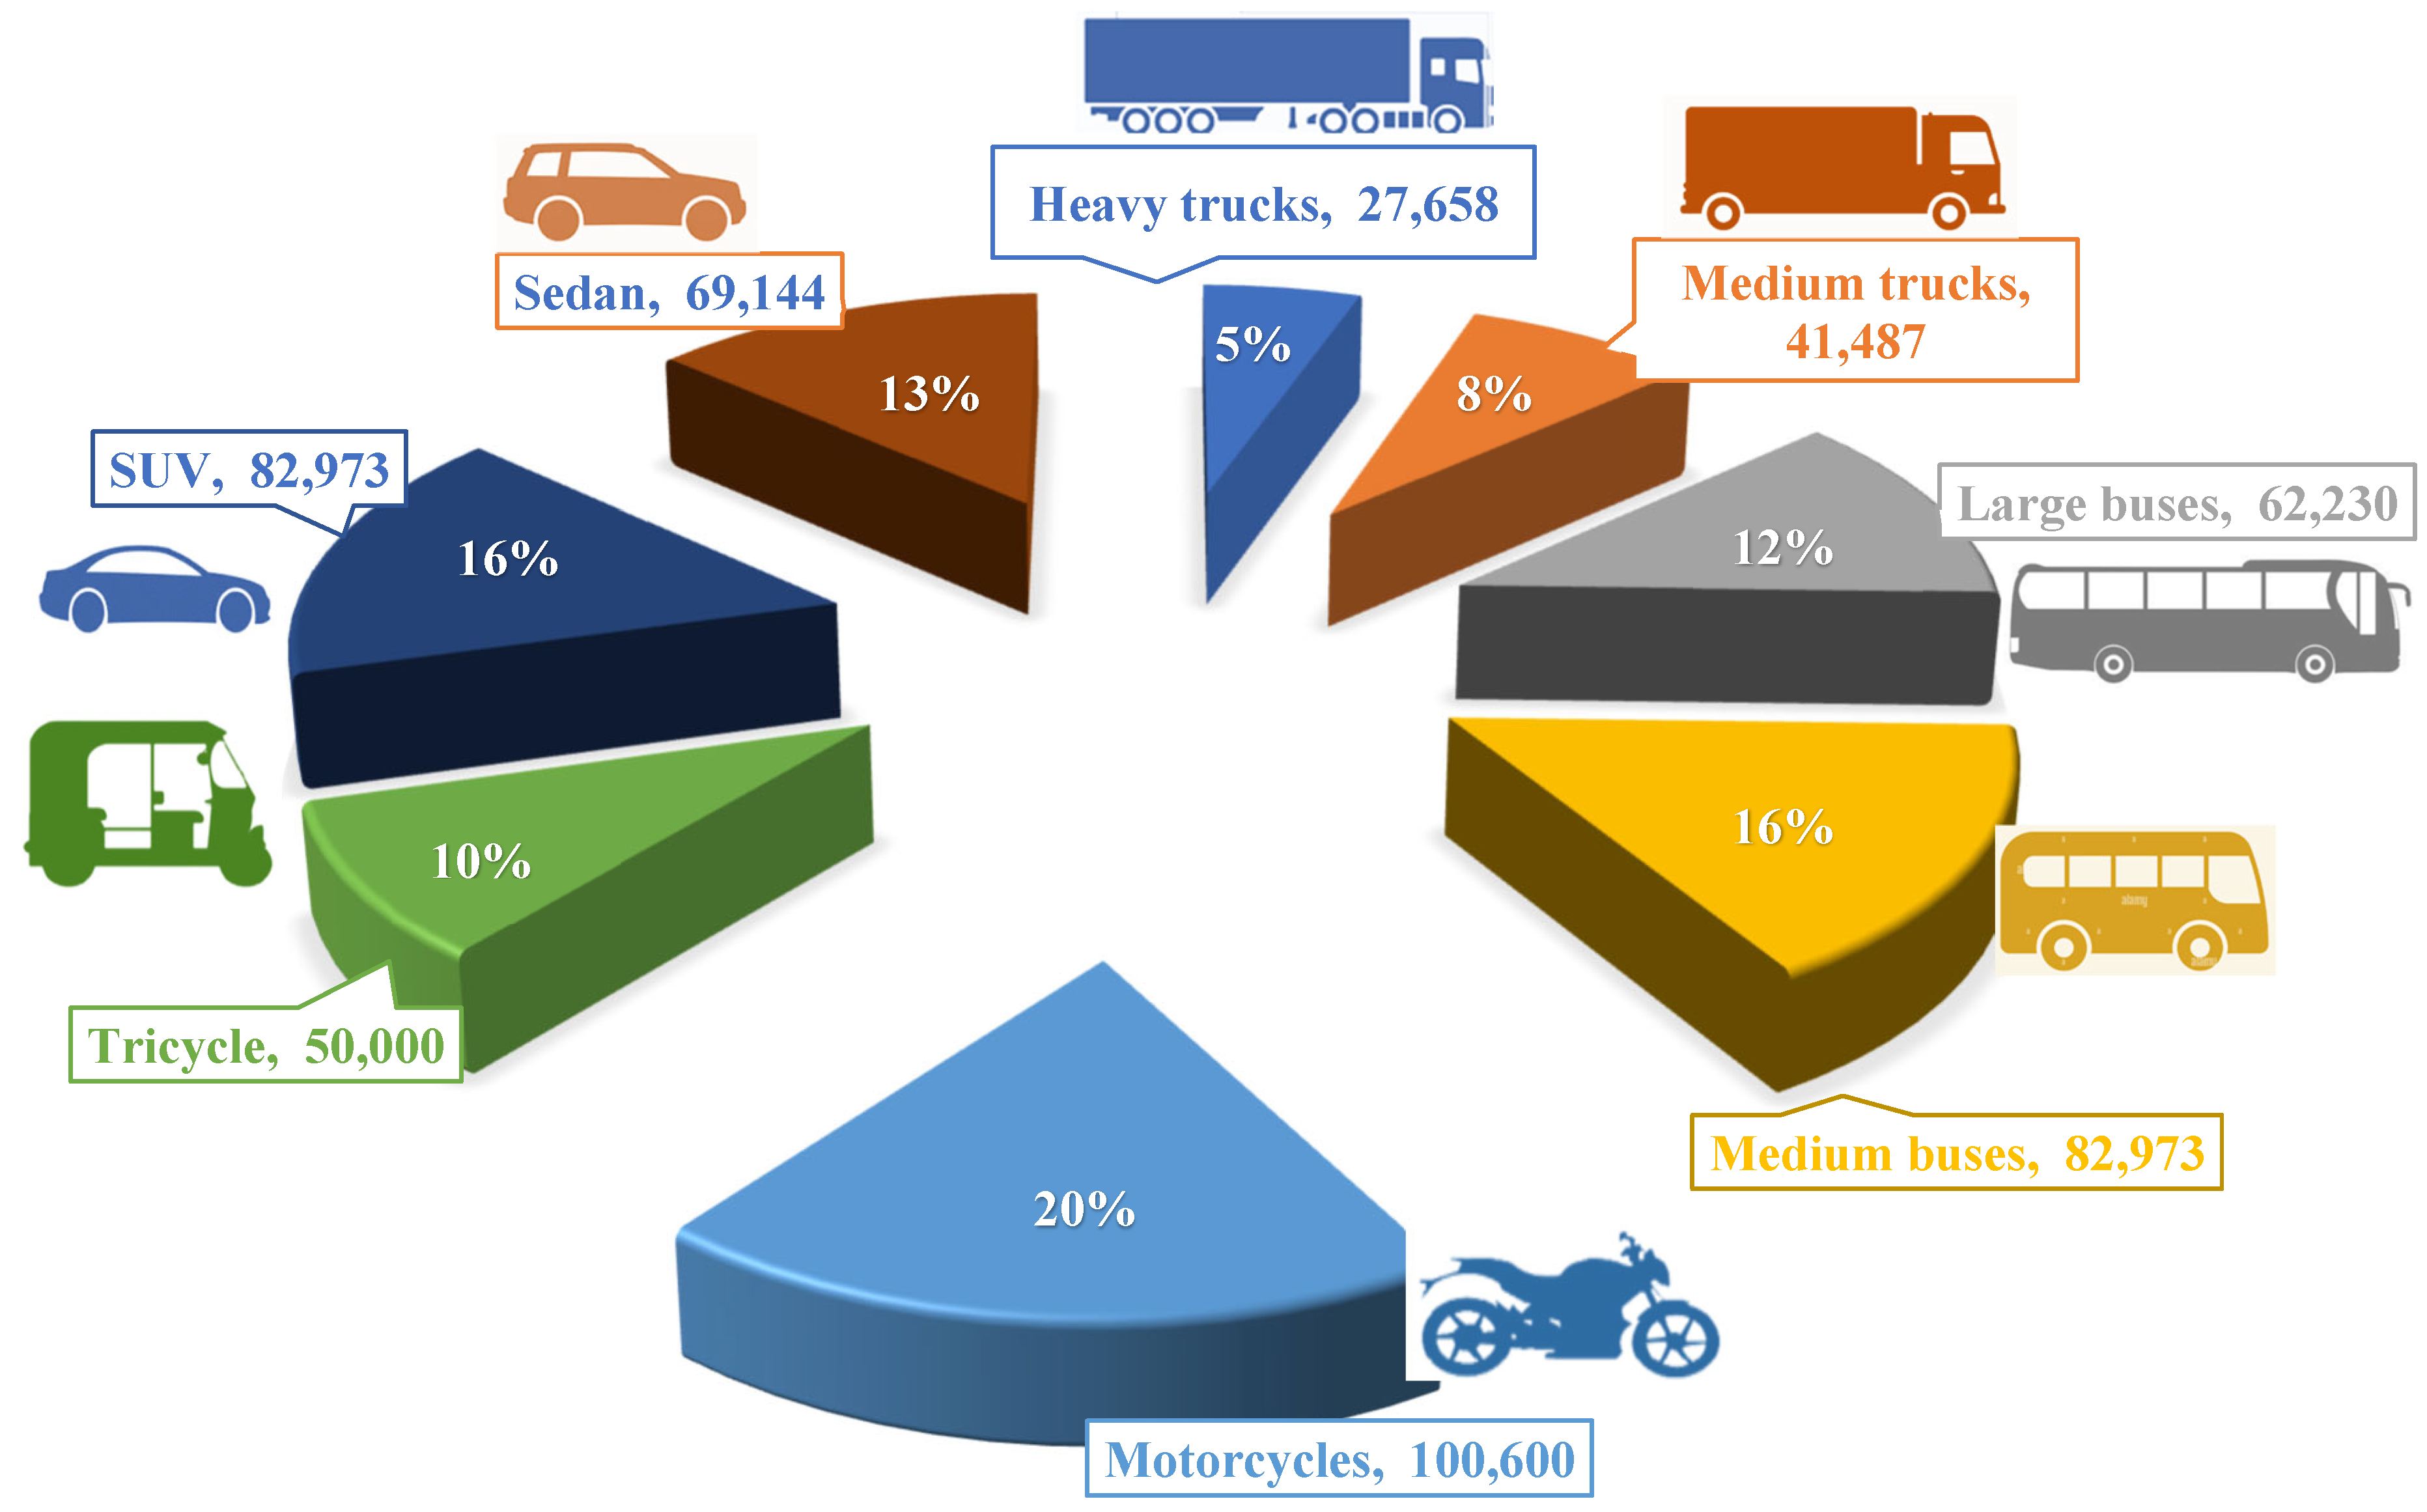
  • The percentages of active road vehicles for heavy trucks, medium trucks, large buses, medium buses, motorcycles, tricycles, SUVs, and sedans are 20, 20, 25, 40, 90, 80, 70, and 70% respectively.
  • It assumed that natural gas infrastructure is available at a sufficient level.
  • The investment and maintenance costs of natural gas infrastructure are not considered in the calculations.
Then, the annual quantities of diesel and petrol are estimated as the total fuel consumed for all vehicle categories in a year as shown in Equation (1). However, after shifting to natural gas, this study assumes zero consumption of petrol as petrol engines deploy a bi-fuel technology, but only 30% of diesel is used in dual-fuel engine [33]. This means, before the transition, this study considers 100% consumption in diesel and petrol, including motorcycles. Following the transition, 0% of petrol and 30% of diesel will be used to estimate the annual demand for petroleum oil.
f d , p = i N f c o n s × N D   for   diesel   and   petrol   before   shifting i N 30 × f c o n s × N D 100   for   diesel   only   after   shifting  
where fd,p is the annual petroleum demand for all categories of vehicles (L/year), fcons is the fuel consumed by a category i vehicles per day (L/day), ND is the number of days in a year (typically 365 days), N is the total number of category i vehicles.
After shifting, the quantity of natural gas is estimated for the amount consumed in diesel and petrol vehicles. As shown in Equation (2), the quantity of natural gas in dual-fuel engine is estimated in equivalence with 70% of the diesel fuel, whereas in bi-fuel engine is estimated equivalent to the mileage covered by the petrol fuel. The annual demand of natural gas is calculated for all categories of vehicles except motorcycles.
f d , N G = i N 70 × f c o n s × f d e 100 × f e k g i N f c o n s
where fd,NG is the annual natural gas demand for all categories of vehicles (kg/year), fd-e is the conversion factor for diesel volume to energy content (kWh/L), fe-kg is the conversion factor for natural gas weight to energy content (kWh/kg).

3.2. Estimation of Government Revenue

The total oil revenue (TFR) is computed based on the annual quantity of petroleum oil consumed in each category of vehicles. At first, prior to the transition, TFR was calculated based on annual petroleum oil consumed (see Equation (3)). With the obtained TFR, only 30% was regarded as the government revenue (grev) (Equation (4)). Later, TFR was re-calculated by considering the shift to natural gas (Equation (3)), and grev was obtained using Equation (4).
T F R = f d , p × c f   for   petrol   and   diesel   fuels   f d , NG × c f   for   natural   gas   fuels  
and
g r e v = 30 × T F R 100
where TFR is the total fuel revenue from petrol and diesel before (TZS), cf is the fuel cost (TZS/L or TZS/kg), grev is the government revenue (TZS).

3.3. Environmental Benefits

The environmental benefits are comprised by emission saving, carbon tax, and carbon credit. The usage of natural gas leads to the emission cutdown. Since tailpipe emissions are comprised by several harmful gases, this study focuses on carbon dioxide equivalent (CO2e). The estimation of CO2e for each category of vehicles is performed based on their related emission factors, see Equation (5). For natural gas, the estimation is given in Equation (6). From Equations (5) and (6), the saving in CO2e can be obtained as expressed in Equation (7). The emissions factors for each vehicle categories are given in Section 3.1.
e p , C O 2 e = i N f e × f d , p
e NG , C O 2 e = i N f e × f d , NG
e s , C O 2 e = e p , C O 2 e e NG , C O 2 e
where ep,CO2e is the annual CO2e from petrol and diesel for all categories of vehicles (kgCO2e/year), eNG,CO2 is the annual CO2e from natural gas for all categories of vehicles (kgCO2e/year), es,CO2 is the annual emission saving for transiting from petrol and diesel to natural gas for all categories of vehicles (kgCO2e/year).
The carbon tax is viewed as an essential policy tool to limit carbon emissions [46]. It aims to discourage the use of petroleum fuels and encourage a shift to less-polluting fuels, thereby limiting CO2 emissions [47]. A price on carbon helps shift the burden for the damage from greenhouse gas emissions back to those who are responsible for it and who can avoid it. Carbon taxes, imposed on petroleum products, and natural gas in proportion to their carbon content, can be collected from fuel suppliers. In Tanzania, a carbon tax price is yet to be introduced; however, this study will adopt the carbon tax imposed in the selected African country (8.0 US$/tCO2 from Nigeria). The annual carbon tax collection from diesel, petrol, and natural gas is given in Equation (8). Since carbon tax will in turn pass in the form of higher prices for petrol, diesel, and natural gas [47,48], this study will compute the excess in unit prices of fuels once the carbon taxes are enacted.
c t = c p × e p , C O 2 e   from   diesel   and   petrol   consumption c p × e NG , C O 2 e   from   natural   gas   consumption  
where ct is the annual carbon tax collection (TZS/year), cp is the market price of carbon tax (TZS/tCO2-year).
Another mechanism to reduce greenhouse gases is to adopt carbon credit. With a carbon credit mechanism, companies that support transition to less-polluting fuels receive a set number of credits. As a benefit, the company can sell any excess credits to other companies and receive a monetary incentive as measures to reduce the carbon emissions. The market value of 1 carbon credit will be adopted from Greyson et al. [32]. The annual carbon credit revenue, which was computed from emission saving, can be expressed as shown in Equation (9).
c c , C O 2 e = c c × e s , CO 2 e
where cc, CO2e is the annual carbon credit revenue to be collected after transition to natural gas (TZS/year), cc is the market price of carbon credit (TZS/tCO2-year).

4. Results and Discussions

4.1. Annual Fuel Demand Pre− and Post−Transition

Figure 2 depicts the annual fuel demand pre- and post-transition to natural gas. The pre-transition to natural gas means before shifting to natural gas usage. In Figure 2, the x-axis indicates the percentage of shifting to natural gas, while the y-axis represents the fuel demand at each level of transition, expressed in billions of units. The percentage of shift represents the fraction of the vehicle population that has switched to natural gas use. As depicted in Figure 2, the blue, orange, and grey colors represent diesel, petrol, and natural gas (the types of fuel) required at each level of transition. In this case, natural gas is referred as compressed natural gas (CNG). The values on top of each bar represent the actual amount for a specific fuel. The units of quantification for diesel, petrol, and natural gas are liters and kg.
As depicted in Figure 2, before the transition, the demand for diesel, petrol, and natural gas amounted to 2.931, 0.951, and 0 billion units, respectively. Diesel has the highest demand due to its widespread use in heavy-duty vehicles traveling long distances, as opposed to petrol, which is primarily used in light-duty vehicles. Despite their large numbers, the majority of petrol-powered vehicles travel on short to medium-distance routes. Furthermore, they are powered by low-power engines that consume less than their counterparts. The fuel demands in this case are used to benchmark the change in fuel demands during the transition. After a 10% shift to natural gas, diesel and petrol demands were reduced to 2.725 and 0.916 billion liters, indicating a drop of 7 and 3.68% in their demand. On the other side, natural gas demand rise from 0 to 0.0916 billion of kg. This indicates that the drop in petroleum fuels has been compensated by the natural gas use. At a 20% shift, in comparison to a 10% shift, diesel and petrol demand further reduced to 2.519 and 0.881 billion liters, indicating a drop of 7.6 and 3.8% in their demand, while natural gas demand grew twice. Further shifting to 30%, in comparison to a 20% shift, diesel and petrol demand fell to 2.313 and 0.847 billion liters, equivalent to 8.2 and 3.9%, while natural gas demand grew more by 33%. When comparing from a 10 to a 30% shift, diesel and petrol demand showed a reduction of 0.412 and 0.069 billion liters, equivalent to 15.1 and 7.5%. By contrast, the natural gas grew substantially by approximately 300%. In Figure 3, the blue and orange trendlines represent the decline in diesel and petrol demand, respectively, while the grey trendline represents the growth in natural gas consumption. The findings give insight on the rates at which diesel and petrol deplete and natural gas rises when the road transport sector shifts at various rates. Furthermore, trendlines serve a significant role in projecting fuel demands at different transition rates, which is critical for policymakers and decision−makers looking to enhance the shift.

4.2. Analysis of Government Revenue

Figure 3 shows the annual government revenues, expressed in Tanzanian shilling (TZS). It should be noted that the government collects its revenue from oil income through taxes. For the purpose of this study, the taxes were taken as 30% in oil revenues and 0% in natural gas sales. In that case, in Figure 3, the x-axis represents the tax collected before and after the shift at various transition rates. The taxes illustrated in the x-axis can be described as follows: “tax before” represents the tax collected before transition; “tax for shifted” represents the tax collected due to the partial use of petroleum fuels in shifted vehicles, particularly for diesel vehicles; “tax unshifted” represents the tax collected for the remaining unshifted vehicles; and “total tax collected” represents the sum of tax collected from the shifted vehicles that partially use petroleum fuel and those remained unshifted that continue to use petroleum fuels.
As shown in Figure 3, the annual tax collected before any transition to natural gas reached approximately TZS 3.51 trillion (US$ 1,296,369,711). After shifting to 10, 20, and 30%, the shifted vehicles that partially use petroleum fuel contributed to annual taxes of about TZS 0.26, 0.39, and 0.51 trillion (US$ 96,027,386; US$ 144,041,079; and US$ 188,361,411), making a total annual tax of approximately TZS 3.42, 3.19, and 2.96 trillion (US$ 1,263,129,462, US$ 1,178,182,159, and US$ 1,093,234,856). Comparatively, the total taxes collected after 10, 20, and 30% seem to be lower than the tax before, indicating a tax loss. It is obvious that every shift to natural gas leads in foregone taxes, and the amount of loss increases with the percentage of transition. For instance, a shift to 10, 20, and 30%, led to foregone taxes amounting to TZS 0.09, 0.31, and 0.54 trillion (US$ 33,358,680, US$ 11,490,212, and US$ 20,015,208), indicating a tax loss of about 2.6, 8.8, and 15.4%. In other words, for a smaller transition rate, the proportion of tax loss is low, whereas at a greater transition rate, it is significant. Furthermore, for a certain transition, the proportion of tax loss is smaller than the transition percentage. These outcomes shed light on the proportion of tax loss that would result when transiting to natural gas. Moreover, the proportion of tax loss acts as a major metric in forecasting the government loss at different transition rates, which is crucial for policymakers and decision-makers trying to build up suitable subsidies and incentives to lower the loss while improving the shift.

4.3. Environmental Benefits

In this section, the environmental benefits such as emission reduction, carbon tax revenue, and carbon credit are discussed in detail. The emission levels pre- and post-transition to natural gas at 10, 20, and 30% are illustrated in Figure 4. It should be noted that the emission levels in Figure 4 were based on the total annual fuel consumption and emission factors, and they are expressed in kg. As illustrated in Figure 4a, the total annual road emission pre-transition to natural gas amounted to approximately 9,479,534,187.1 kgCO2e or 9479.53 million tCO2e (MtCO2e) with large contributions from trucks and buses. This was attributed by their significant fuel consumption and emission factor of diesel fuel. In the 10% shift (Figure 4b), a total of 142,247 vehicles were targeted. In comparison to Figure 4a, the total annual road emissions in Figure 4b were reduced to approximately 8959.19 MtCO2e. This indicates that a 10% shift might offset up to 5.4% of the total road emissions. A further 20 and 30% shift targeted 183,893 and 225,540 vehicles, reducing total annual road emissions to about 8438.86 and 7918.5 MtCO2e, respectively. The shifts might offset about 10.97 and 16.47% of the road emissions. In other words, for a certain transition, the proportion of CO2e offset almost is greater than the transition percentage. The proportion of CO2e offset serves as a key criterion for protecting Tanzanian populations’ health while enhancing the shift. Therefore, the knowledge of emissions levels helps to influence policy design.
The carbon tax mechanism allows the government to establish a price that polluters must account for each ton of greenhouse gases they release, delivering a clear indication that carbon-intensive goods are more expensive than low-carbon ones. By adopting a carbon tax of 8.0 US$/tCO2e, the transitions of 10, 20, and 30% might result in US$ 71,673,591.37, 67,510,909.24, and 63,348,227.11. Since the carbon tax increases, the diesel, petrol, and natural gas prices will increase by TZS 58, 51, and 48 per unit (as of August 2024 rate of 2710 TZS/US$). Due to its low unit price, this increment will still make natural gas more attractive than petroleum fuels. The higher the carbon tax price, the more appealing the natural gas will be, and it is prone that user commitment and proportion of emissions offset are expected to increase as well.
The carbon credit provides a way to reward or recompense users who have already offset carbon emissions, inviting new users to take some actions to offset even more carbon emissions. A carbon credit represents a ton of hydrocarbon fuel emissions. For transitions of 10, 20, and 30% and carbon credit of US$ 40/tCO2e, the revenue could reach about US$ 20,813,410.64, 41,626,821.27, and 62,440,231.91. Compensation from revenue could have a significant impact on company commitment levels and the number of CNG conversions. Furthermore, the revenue could be used to provide purchase subsidies to encourage investment and improve natural gas infrastructure.

5. Conclusions and Policy Implication

This study assesses the foregone revenue for switching from petroleum to natural in Tanzania’s road transport sector. The study aimed to analyze the foregone revenue in a 10, 20, and 30% transition from petroleum vehicles to natural gas vehicles. The findings of this study lead to the following conclusion:
In the pre-transition, demand for diesel, petrol, and natural gas amounted to 2.931, 0.951, and 0 billion units. The 10, 20, and 30% shift targeted about 142,247, 183,893, and 225,540 vehicles.
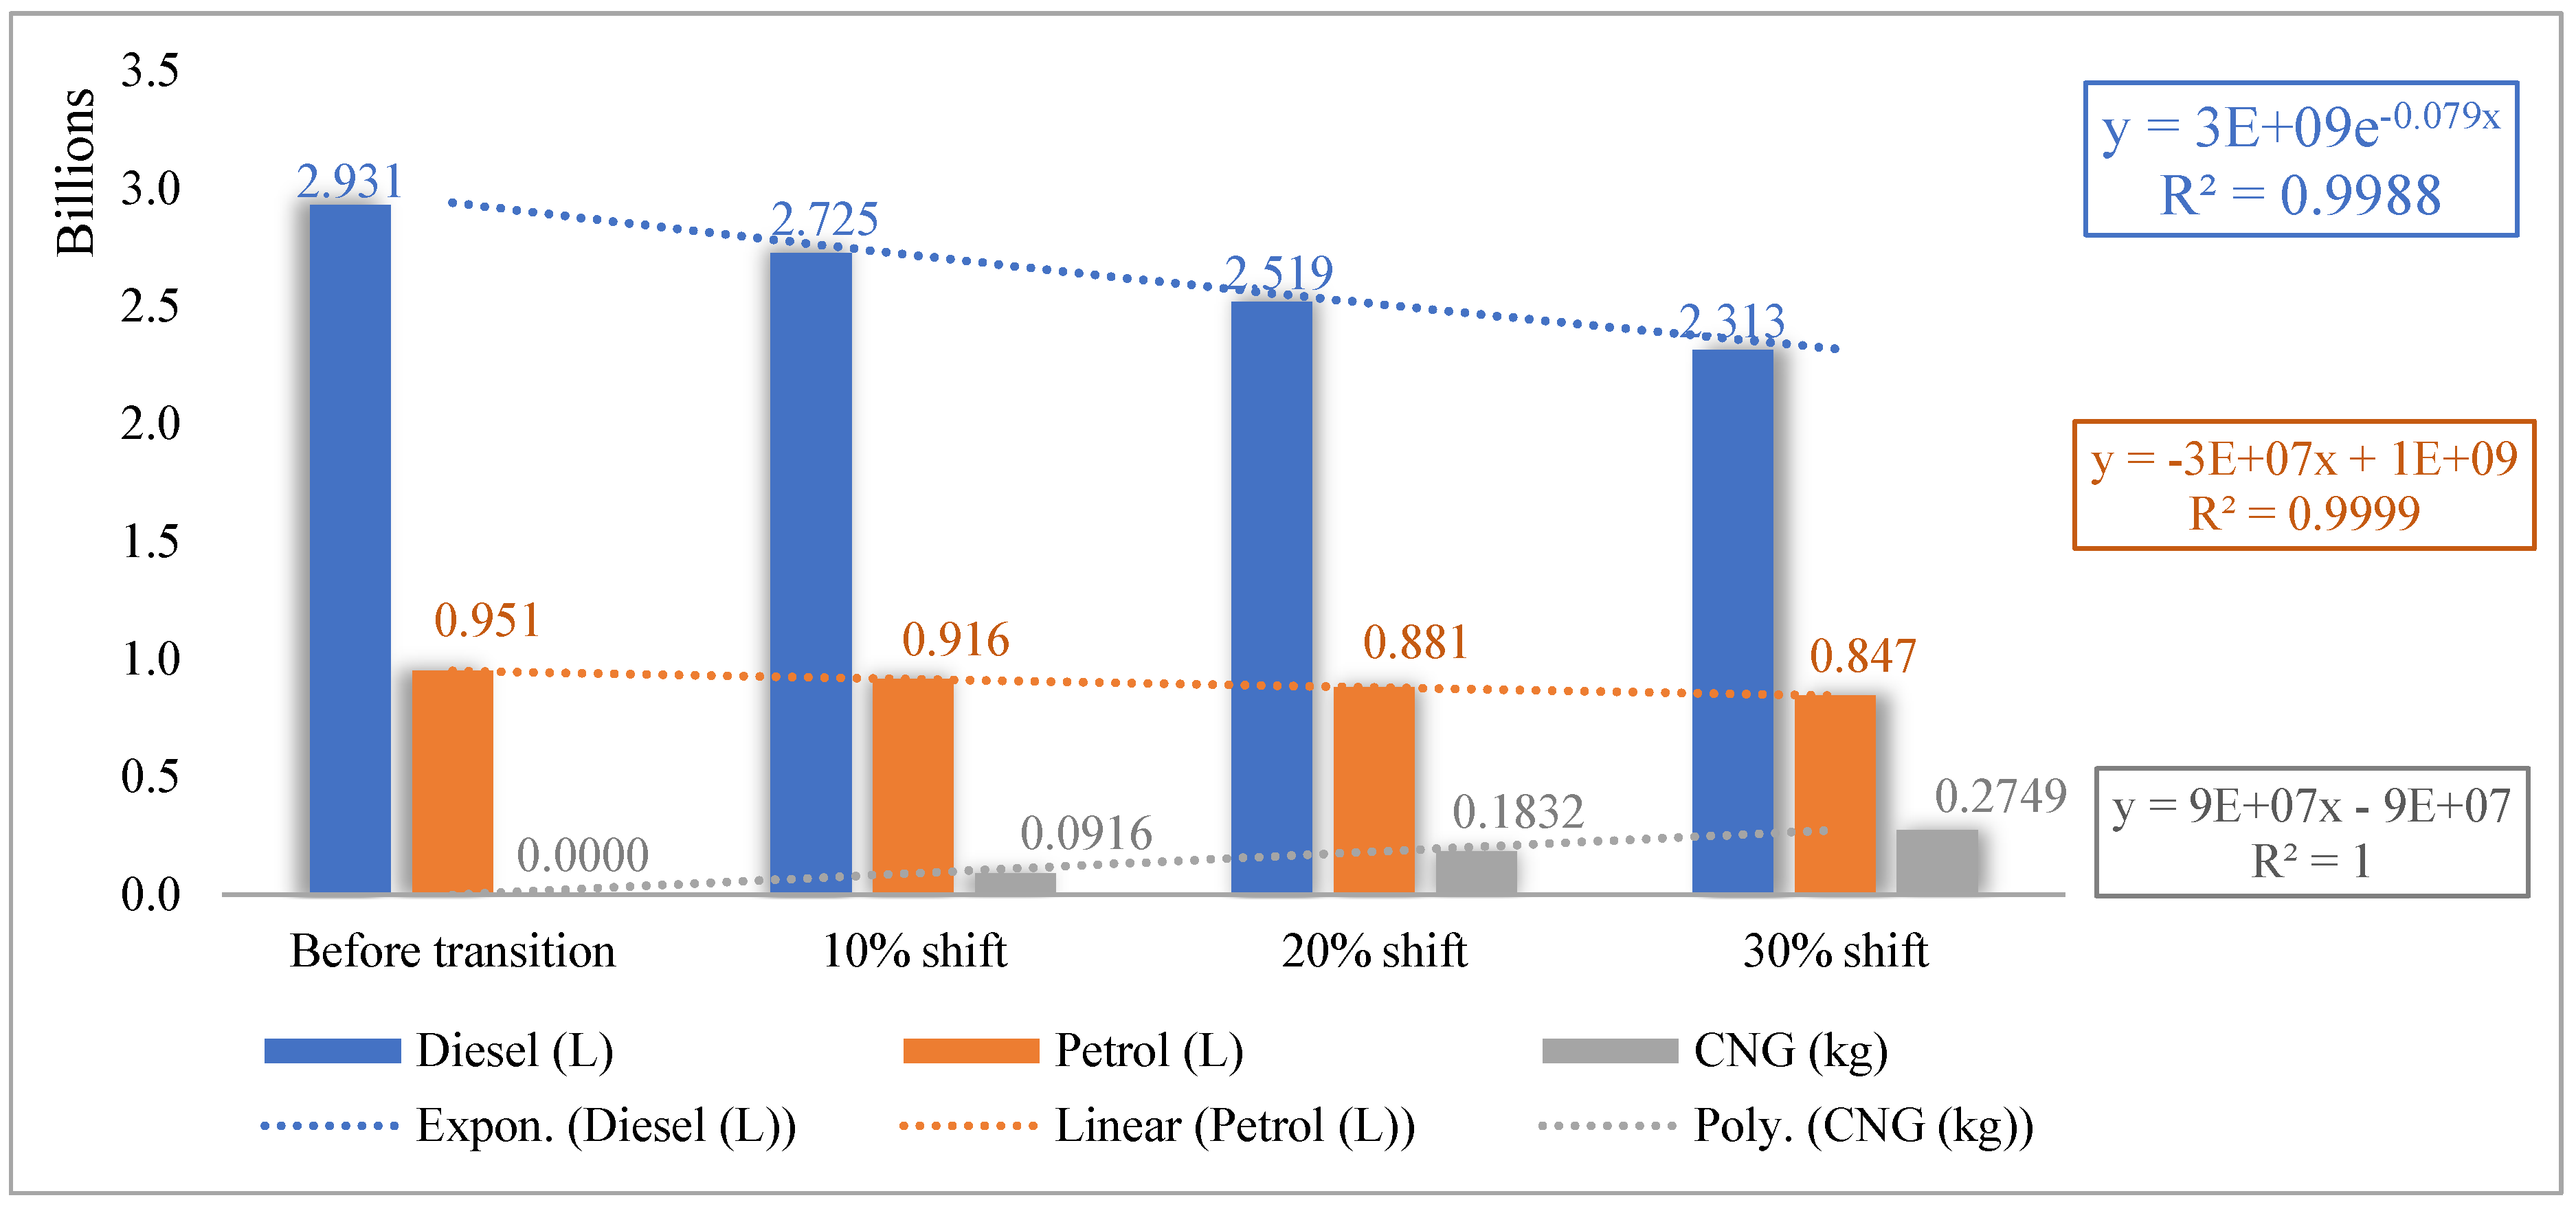
  • In the post-transition, a 10, 20, and 30% shift to natural gas dropped diesel and petrol demand by 7 and 3.68%, 7 and 3.8%, and 15 and 7.5%, respectively. In natural gas, the demand started at 0.0916 billion kg and grew substantially by 200% and later by 300%. This indicates that petroleum products will not largely be affected instead natural gas demand rises exponentially.
  • The transition has consequences in government revenue, which takes the form of taxes on petroleum products. The shift from 10 to 30% could lead to foregone taxes amounting to TZS 0.09, 0.31, and 0.54 trillion, indicating a tax loss of about 3, 9, and 15%. However, these losses could be advantageous to the government for reducing the forex required in oil importation.
  • The 10, 20, and 30% shift could offset approximately 8959.19, 8438.86, and 7918.53 MtCO2e, equivalent to 5.4, 10.97 and 16.47% of the road emissions.
  • The post-transition road emissions might result in a carbon tax revenue of about US$ 71,673,591.37, 67,510,909.24, and 63,348,227.11 per year. On the other side, the post-transition carbon credit revenue of about US$ 20,813,410.64, 41,626,821.27, and 62,440,231.91 is expected annually.
Future studies should focus on estimating the government revenue from the actual natural gas sales and assess the possible recovery of foregone taxes from petroleum products. The assessment of carbon tax for benefiting the government as a recovery tax from the foregone oil taxes, carbon quotas, and carbon credit in the natural gas business might be very beneficial. Alternative revenue sources might be secured, for example, by shifting from taxing fuel consumption to taxing vehicle use using road pricing. A deep analysis of barriers and enabling factors for natural gas adoption should be conducted. Different business models need to be evaluated to increase government revenue while transitioning to natural gas use. Government readiness toward transition to natural gas use should further be assessed. Further studies should be dedicated to the establishment of a sustainable transition roadmap for natural gas market development. Also, sensitivity analysis to evaluate the impact of changes in key parameters such as fuel prices, vehicle conversion rates, tax policies, etc. needs to be addressed.
As a policy implication, given the significant drop in government oil revenue once shifting to natural gas in the transport sector, it is apparent that policymakers and decision-makers should take concrete steps to rectify this loss at the embryonic stage of this transition. Tanzania’s government continues to heavily rely on oil taxes for the country’s development, yet it lacks transparency in its oil tax collections from the consumer side. Moreover, the lack of alternative government income sources to replace oil taxes poses a sluggish transition to clean fuels such as natural gas. As a measure toward clean fuels, the government should equip policymakers and decision-makers with sufficient knowledge regarding the cost-benefits of shifting to cleaner fuels, particularly natural gas. Furthermore, the government should develop a road map that integrates key strategic areas such as the targeted number of vehicles to use natural gas and other cleaner fuels; natural gas filling stations; incorporation of the private sector in the expansion of natural gas pipeline network; increasing natural gas system certifiers, natural gas vehicle conversion workshops, garages and technicians; expanding local markets of conversion kits and CNG cylinders; strengthening of local testing standards on equipment and vehicles; and introduction of zonal centers for providing public awareness on natural gas and natural gas vehicle utilization. Only 3.6% of the workforce possesses proficient abilities to work in the oil and gas industry [49]. In that case, the Tanzanian Petroleum Act and Natural Gas Policy should ensure that local content is pursued in the intended way and provides a long-term benefit to local residents, as far as the oligopolistic market structure is taken into account. Moreover, carbon taxation without additional policies [50] could dampen economic activities [51] and worsen income distribution [48]. To boost the number of natural gas vehicles and natural gas usage, the government should provide subsidies for the importation of natural gas vehicles, natural gas equipment and machinery, natural gas filling stations, CNG cylinders, and CNG conversion kits. On the other side, natural gas vehicles could be incentivized, for a specific period, by receiving no fee for municipal parking, tollways, ferries, and access to enter low-emission zones (city centers). To compensate for the government revenue lost due to missed oil taxes, the government might impose an appropriate carbon tax on natural gas sales to the end-consumers. The government should devote significant efforts to policy solutions and institutional designs to deal with possible negative repercussions of petroleum revenue. One common institutional design, which appears to be adopted by an increasing number of petroleum producers, is establishing a petroleum fund. A natural gas fund may be established too, and natural gas revenue transparency should be encouraged so that the collected gas revenue could be used to support the expansion of natural gas pipeline networks and natural gas filling infrastructure, health, and education. On the other hand, more studies should be conducted to increase knowledge of how future gas revenue will impact national growth.

Author Contributions

M.K., G.B.G., F.L., O.A.Z., P.V.C. and E.A.N.: conceptualization, methodology, data collection, data curation, investigation, writing—original draft; K.A.G.: review and funding. All authors have read and agreed to the published version of the manuscript.

Funding

This research received no external funding.

Data Availability Statement

The authors confirm that the data supporting the findings of this study are available within the article.

Acknowledgments

The authors would like to express their gratitude to the Sections of Energy (Electrical and Mechanical Departments), DIT-CNG Conversion Center, Dar es Salaam Institute of Technology for affording valuable technical supports throughout the research. The authors gratefully acknowledge the invaluable support from Rashal Energies for their assistance.

Conflicts of Interest

The authors declare that they have no known competing financial interests or personal relationships that could have appeared to influence the work reported in this paper.

References

  1. IEA. Oil Demand Growing at a Slower Pace as Post-Covid Rebound Runs Its Course. 2024. Available online: https://www.iea.org/commentaries/oil-demand-growing-at-a-slower-pace-as-post-covid-rebound-runs-its-course (accessed on 29 September 2024).
  2. Weber, S.; Hans, W. Environmental awareness: The case of climate change. Russ. J. Econ. 2018, 4, 328–345. [Google Scholar] [CrossRef]
  3. Othman, M.F.; Adam, A.; Najafi, G.; Mamat, R. Green fuel as alternative fuel for diesel engine: A review. Renew. Sustain. Energy Rev. 2017, 80, 694–709. [Google Scholar] [CrossRef]
  4. Bishoge, O.K.; Zhang, L.; Mushi, W.G. Challenges facing the implementation of the national natural gas policy in Tanzania. Int. J. Energy Sect. Manag. 2020, 13, 500–517. [Google Scholar] [CrossRef]
  5. Makala, D.; Zongmin, L. Natural Gas Consumption and Economic Growth in Tanzania. Eur. J. Sustain. Dev. Res. 2020, 4, em0113. [Google Scholar] [CrossRef]
  6. Gerald, J.K. Natural Gas Consumption in Power Generation and Economic Growth in Tanzania. Tengeru Comm. Dev. J. 2021, 8, 16–36. [Google Scholar]
  7. OPEC. Natural Gas Data-Annual Statistical Bulletin 2024. 2024. Available online: https://asb.opec.org/ASB_Charts.html?chapter=1572 (accessed on 29 September 2024).
  8. Statista. Leading Countries by Proved Natural Gas Reserves Worldwide in 1960 and 2022. 2024. Available online: https://www.statista.com/statistics/265329/countries-with-the-largest-natural-gas-reserves/ (accessed on 29 September 2024).
  9. Africa Energy Chamber. Natural Gas Is Key to Africa’s Industrialisation Process and to Ending the Region’s Massive Energy Poverty. 2023. Available online: https://energychamber.org/natural-gas-is-key-to-africas-industrialisation-process-and-to-ending-the-regions-massive-energy-poverty/#:~:text=Across%20the%20region%2C%20natural%20gas,(32%25)%2C%20in%20particular (accessed on 29 September 2024).
  10. Tanzania Investment Centre. Oil and Gas. 2024. Available online: https://www.tic.go.tz/pages/oil-and-gas (accessed on 29 September 2024).
  11. Energy and Water Utilities Authorities. General Information. 2024. Available online: https://www.ewura.go.tz/natural-gas/ (accessed on 29 September 2024).
  12. Ministry of Works and Transport. Transport and Meteorology Sector Statistics-2021. 2021. Available online: https://www.mow.go.tz/uploads/documents/sw-1633366677-TRANSPORT%20AND%20METEOROLOGY%20SECTOR%20STATISTICS%20-%202019.pdf (accessed on 29 September 2024).
  13. Tanzania Ports Authority. Internal Data Acquired from the Internal Import Department. 2024; Internal data. [Google Scholar]
  14. Ministry of Finance. Revenue Estimates: For the Year from 1st July, 2022 to 30th June 2023, pp. 20. 2024. Available online: https://www.mof.go.tz/uploads/documents/en-1658231440-Revenue_estimates_22_23%20(1).pdf (accessed on 10 August 2024).
  15. Roychowdhury, A. CNG Programme in India: The Future Challenges. Center for Science and Environment (CSE). 2010. Available online: http://www.indiaenvironmentportal.org.in/files/CNG%20programme%20in%20India.pdf (accessed on 10 August 2024).
  16. Ministry of Petroleum and Natural Gas. Natural gas Pipelines. 2024. Available online: https://mopng.gov.in/en/pdc/investible-projects/oil-amp-gas-infrastructure/natural-gas-pipelines (accessed on 10 August 2024).
  17. Zacharias, L.G.L.; de Andrade, A.C.A.C.; Guichet, X.; Mouette, D.; Peyerl, D. Natural gas as a vehicular fuel in Brazil: Barriers and lessons to learn. Energy Policy 2022, 167, 113056. [Google Scholar] [CrossRef]
  18. Aelex. A Quick Overview of the New National Gas Policy. 2024. Available online: https://www.aelex.com/a-quick-overview-of-the-new-national-gas-policy/ (accessed on 10 August 2024).
  19. Ani, G.O.; Ikiensikimama, S.S. Natural Gas Development Trend in Nigeria: The Investor’s Road Map. J. Energy Res. Rev. 2020, 5, 39–48. [Google Scholar] [CrossRef]
  20. Roychowdhury, A.; Chandola, P.; Chattopadhyaya, V. Opportunities for CNG-Based Transportation Programme in Nigeria: Policy Brief Report. 2022. Available online: https://www.cseindia.org/policy-brief-opportunities-for-cng-based-transportation-programme-in-nigeria-11681 (accessed on 10 August 2024).
  21. Zhou, Y.; Fang, W.; Li, M.; Liu, W. Exploring the impacts of a low-carbon policy instrument: A case of carbon tax on transportation in China. Resour. Conserv. Recycl. 2018, 139, 307–314. [Google Scholar] [CrossRef]
  22. Solaymani, S.; Kardooni, R.; Yusoff, S.B.; Kari, F. The impacts of climate change policies on the transportation sector. Energy 2015, 81, 719–728. [Google Scholar] [CrossRef]
  23. Kim, Y.D.; Han, H.O.; Moon, Y.S. The empirical effects of a gasoline tax on CO2 emissions reductions from transportation sector in Korea. Energy Policy 2011, 39, 981–989. [Google Scholar] [CrossRef]
  24. Zhang, Y.; Abbas, M.; Iqbal, W. Analyzing sentiments and attitudes toward carbon taxation in Europe, USA, South Africa, Canada and Australia. Sustain. Prod. Consum. 2021, 28, 241–253. [Google Scholar] [CrossRef]
  25. Davis, L.W.; Kilian, L. Estimating the Effect of a Gasoline Tax on Carbon Emissions; Working Paper; Department of Economics, University of Michigan: Ann Arbor, MI, USA, 2009. [Google Scholar]
  26. Gupta, M.; Bandyopadhyay, K.R.; Singh, S.K. Measuring effectiveness of carbon tax on Indian road passenger transport: A system dynamics approach. Energy Econ. 2019, 81, 341–354. [Google Scholar] [CrossRef]
  27. Chatterjee, S.; Dhavala, K.K.; Murty, M.N. Estimating cost of air pollution abatement for road transport in India: Case studies of Andhra Pradesh and Himachal Pradesh. Econ. Polit. Wky. 2007, 42, 3662–3668. [Google Scholar]
  28. Wu, Q.; Cheng, W.; Zheng, Z.; Zhang, G.; Xiao, H.; Wen, C. Research on the carbon credit exchange strategy for scrap vehicles based on evolutionary game theory. Int. J. Environ. Res. Public Health 2023, 20, 2686. [Google Scholar] [CrossRef]
  29. Gupta, H.; Rakshit, D. Assessing the demand for carbon credits from the most polluting and hard-to-abate sectors in India. J. Clean. Prod. 2023, 425, 138825. [Google Scholar] [CrossRef]
  30. Tangvitoontham, N.; Chaiwat, P. Carbon Credit Estimation: A Case Study of Shifting Freighting Mode to Railway from ICD Lat Krabang, Bangkok to Laem Chabang Port, Chonburi. J. Bus. Econ. 2015, 3, 145–149. [Google Scholar] [CrossRef]
  31. Yu, L.; Ding, Y.; Jian, S. Managing carbon emissions in urban mobility system: A credit-based reservation scheme. Transp. Res. D Transp. Environ. 2024, 130, 104197. [Google Scholar] [CrossRef]
  32. Greyson, K.A.; Gerutu, G.B.; Bobi, S.; Chombo, P.V. Exploring the potential of compressed natural gas as a sustainable fuel for rickshaw: A case study of Dar es Salaam. J. Nat. Gas Sci. Eng. 2021, 96, 104273. [Google Scholar] [CrossRef]
  33. Gerutu, G.B.; Greyson, K.A.; Chombo, P.V. Compressed Natural Gas as an Alternative Vehicular Fuel in Tanzania: Implementation, Barriers, and Prospects. Methane 2023, 2, 66–85. [Google Scholar] [CrossRef]
  34. National Transport Policy. 2011. Available online: http://www.tzonline.org/pdf/nationaltransportpolicy1.pdf (accessed on 10 August 2024).
  35. JICA Report. Comprehensive Transport and Trade System Development Master Plan in the United Republic of Tanzania. Volume 2 Chapter 6; 2021. Available online: https://openjicareport.jica.go.jp/pdf/12150512_02.pdf (accessed on 10 August 2024).
  36. TANROADs. Tanzania Transport Integration Project. 2023. Available online: https://www.tanroads.go.tz/common/uploads/tor/q2f9c4ae6973e6f04a2a73b1a4fe4583.pdf (accessed on 10 August 2024).
  37. Tanzania Invest. Tanzania Oil. 2024. Available online: https://www.tanzaniainvest.com/oil (accessed on 10 August 2024).
  38. Energy and Water Utilities Authorities. Petroleum Infrastructure. 2024. Available online: https://www.ewura.go.tz/pages/petroleum-infrastructure (accessed on 10 August 2024).
  39. OEC World. Refined petroleum in Tanzania. Available online: https://oec.world/en/profile/bilateral-product/refined-petroleum/reporter/tza (accessed on 10 August 2024).
  40. Nithyanandan, K.; Zhang, J.; Li, Y.; Meng, X.; Donahue, R.; Lee, C.F.; Dou, H. Diesel-like efficiency using compressed natural gas/diesel dual-fuel combustion. J. Energy Resour. Technol. 2016, 138, 052201. [Google Scholar] [CrossRef]
  41. Ismail, M.; Fawzi, M.; Zulkifli, F.; Osman, S. Effects of Fuel Ratio on Performance and Emission of Diesel-Compressed Natural Gas (CNG) Dual Fuel Engine. JSAEM 2021, 2, 157–165. [Google Scholar] [CrossRef]
  42. Aosaf, M.R.; Wang, Y.; Du, K. Comparison of the emission factors of air pollutants from gasoline, CNG, LPG and diesel fueled vehicles at idle speed. Environ. Pollut. 2022, 305, 119296. [Google Scholar] [CrossRef] [PubMed]
  43. Dao, I.; Roncalli, T.; Semet, R. An Introduction to Carbon Pricing: Carbon Tax, Cap & Trade, ETS and Internal Carbon Price. Cap & Trade, ETS and Internal Carbon Price (August 29, 2024). 2024. Available online: http://www.thierry-roncalli.com/download/Carbon_Pricing_Primer.pdf (accessed on 10 October 2024).
  44. Terrapass. Creating Carbon Credits: Is It Profitable? 2024. Available online: https://terrapass.com/blog/creating-carbon-credits-is-it-profitable/ (accessed on 10 August 2024).
  45. Bank of Tanzania. Exchange Rates. 2024. Available online: https://www.bot.go.tz/exchangerate/excrates (accessed on 10 August 2024).
  46. World Bank Blogs. What a Carbon Tax Can Do and Why It Cannot Do It All. 2022. Available online: https://blogs.worldbank.org/en/energy/what-carbon-tax-can-do-and-why-it-cannot-do-it-all#:~:text=A%20carbon%20tax%20reflecting%20the,discussions%20are%20ongoing%20in%20others (accessed on 10 August 2024).
  47. International Monetary Fund. What Is Carbon Taxation? 2019. Available online: https://www.imf.org/en/Publications/fandd/issues/2019/06/what-is-carbon-taxation-basics (accessed on 10 August 2024).
  48. De Bruin, K.; Yakut, A.M. The Impacts of Removing Fossil Fuel Subsidies and Increasing Carbon Taxation in Ireland. Environ. Resour. Econ. 2023, 85, 741–782. [Google Scholar] [CrossRef]
  49. Calignano, G.; Vaaland, T.I. Local content in Tanzania: Are local suppliers motivated to improve? Extr. Ind. Soc. 2018, 5, 104–113. [Google Scholar] [CrossRef]
  50. Li, J.; Du, Q.; Lu, C.; Huang, Y.; Wang, X. Simulations for double dividend of carbon tax and improved energy efficiency in the transportation industry. Environ. Sci. Pollut. Res. 2023, 30, 19083–19096. [Google Scholar] [CrossRef]
  51. Nong, D.; Simshauser, P.; Nguyen, D.B. Greenhouse gas emissions vs. CO2 emissions: Comparative analysis of a global carbon tax. Appl. Energy 2021, 298, 117223. [Google Scholar] [CrossRef]
Figure 1. The share of road vehicles in Tanzania (2021) [13].
Methane 04 00012 g001
Figure 2. The annual fuel demand pre− and post−transition to natural gas at 10, 20, and 30%.
Methane 04 00012 g002
Figure 3. The annual tax collected pre- and post-transition to natural gas at 10, 20, and 30%.
Methane 04 00012 g003
Figure 4. The emissions levels (a) pre−transition and post−transition to natural gas at (b) a 10%, (c) 20% and (d) 30%.
Methane 04 00012 g004
Disclaimer/Publisher’s Note: The statements, opinions and data contained in all publications are solely those of the individual author(s) and contributor(s) and not of MDPI and/or the editor(s). MDPI and/or the editor(s) disclaim responsibility for any injury to people or property resulting from any ideas, methods, instructions or products referred to in the content.

