Abstract
In this paper, a predictive combustion model is developed and implemented in GT-Power. The model consists of a detailed physically/chemically based ignition delay model, including a 1D spray model. The spray model results at the start of combustion are used to initialize the combustion model. The spray zone and the homogenous natural gas/air mixture are burned with different combustion models, to account for the effect of the inhomogeneous fuel distribution. NOx-emissions are modelled using a standard Extended Zeldovich Mechanism, and for the HC-emissions, two flame quenching models are included and extended with an empirical correlation. The models are calibrated with measurement data from a single cylinder engine, except for the ignition delay model which needs no calibration. The start of combustion and the combustion parameters are predicted well for a wide range of injection timings and operation conditions. Furthermore, considering unburned fuel, the engine operation parameters BSFC and IMEP are also predicted satisfactory. Due to the detailed description of the different combustion phases, the influence of the injection timing on the NOx-emission is captured satisfactorily, with the standard NOx-model. Finally, the knock limited MFB50 is also predicted within an acceptable range.
1. Introduction
Facing the global sulfur limitations in maritime fuels and the existing IMO Tier III legislation, the importance of liquified natural gas (LNG) as a fuel has increased in the past years. For medium speed engines, the dual-fuel (DF) combustion process is the state of the art in using LNG as fuel [,]. Therefore, the gaseous fuel is injected in the intake manifold, resulting in a homogeneous natural gas/air mixture which is ignited by a pilot injection of diesel fuel. The natural gas then burns in a lean burn Otto cycle. Due to the high energy content of the pilot fuel, a very lean but stable combustion process is achieved, which results in low NOx-emissions. Thus, the recent IMO Tier III legislation can be fulfilled by dual-fuel engines without exhaust aftertreatment [,]. Furthermore, due to the composition of LNG, which is mainly methane, the CO2-emissions are reduced by approximately 20% compared to diesel engines, resulting from the lower C/H ratio of methane [].
Besides the aforementioned positive effects of the lean-burn Otto cycle, this combustion process leads to different limitations. On the one hand DF-engines are limited by cycle-to-cycle variations and unburned hydrocarbons and on the other hand by the knock limit. Furthermore, the NOx-emissions are a limiting factor for the engine operation.
In the development process of large engines, 1D-simulation plays an important role [,]. To minimize the operation of large engines at the testbed accurate simulation models are necessary to simulate performance and emissions.
In the past decade, multiple authors published combustion models for pilot ignited dual-fuel engines. Something they all have in common is that every model consists of a spray model for the pilot injection and the ignition delay and a flame propagation model for the combustion of the natural gas/air mixture. For a brief overview, the combustion models may be categorized according to the spray model which is included. The majority is based on the package model of Hiroyasu, which discretizes the fuel spray in multiple packages in axial and radial direction []. The spray penetration is calculated with an empirical correlation which is based on experiments of diesel jets with relatively long injection durations. Each of the packages of the spray is treated as a thermodynamic zone, whose temperature results from the entrained cylinder charge and the evaporation of the liquid fuel. Thus, in each zone, an independent ignition delay calculation is applied.
Krishnan et al. [] use the Shell model [] to calculate the autoignition inside each package. After ignition the content of each package is burned, whereas diesel and natural gas are burned separately. For the combustion of the surrounding NG/air mixture a turbulent entrainment model is applied, which calculates the flame front are from the burned packages, but without consideration of any geometrical assumptions of the flame front.
Walther et al. [] implied a Livengood–Wu integral [] to each package in the spray model using an ignition delay correlation derived from reaction kinetics calculations. After ignition the spray model is terminated, and all the fuel is burned with a turbulent entrainment model. The flame front is assumed as cone shaped in the beginning of the combustion and the transitions to a hemispherical flame front, whereas the spray cone angle and the initial size of the flame front are derived from optical investigations. The model was validated against measurement data from a high-speed dual-fuel engine. A similar approach was presented in Ref. [] and validated against measurement data from a 1.95 L four-cylinder diesel engine, operated in dual-fuel mode with biogas as main fuel. In Ref. [], the same approach is applied in a real-time capable hardware in the loop application and validated with a heat release rate from a medium-speed dual-fuel engine.
Krenn et al. [] also calculated a Livengood–Wu integral in each package of the spray model. For the turbulent entrainment model a club shaped flame front is assumed, which is not limited by the cylinder walls. Every package that is ignited is transferred to the turbulent entrainment model and burned under consideration of the faster laminar flame speed resulting from the pilot fuel inside the package. The model is validated in Ref. [] for a high speed and a medium speed engine at medium and high load and in Ref. [] for a medium speed engine at low load.
In Ref. [], the ignition delay is calculated in each package using tabulated ignition delay times. Each ignited package is then burned within a reaction time, derived from reaction kinetics calculations. For the NG/air mixture a fractal model is implemented, including a new flame front model with one spherical flame front for each injector hole. The model is validated in Ref. [] against measurement data of a 2-L 4-cylinder diesel engine, equipped with NG port fuel injection and operated in dual-fuel mode.
The dual-fuel combustion model available in GT-Power is a combination of the three-zone diesel combustion model DIPulse, which also uses a steady-jet spray penetration correlation and the turbulent entrainment model SITurb. The model is described in detail in Ref. [] and applied for a low-speed two stroke dual-fuel engine equipped with a pre-chamber for the pilot fuel ignition. In Ref. [], the model is extended with a new ignition delay correlation derived from reaction kinetics calculations and the ignition delay calculation is validated for a medium speed dual-fuel engine.
Musculus and Kattke presented a 1D spray model in Ref. [], which can describe the end of injection transients resulting in significant higher mixing of the spray after the end of injection. This topic is especially relevant for dual-fuel engines, because the short injection of the pilot fuel is usually finished before the ignition takes place.
In Ref. [], the authors combine the 1D spray model with the ignition delay model from Ref. []. The ignition of the spray is assumed to occur in the spray tip, as this is the richest spot of the spray for longer ignition delays. The model is combined with a vibe burn rate to model the combustion of a 2-L 4-cylinder diesel engine converted to dual-fuel operation.
A similar approach, consisting of the 1D spray model and an ignition delay model is presented in Ref. [] and validated against measurement data from a medium speed engine operated in diesel and dual-fuel combustion mode. For ignition delays shorter than the injection duration, the ignition is assumed to take place at the spray tip, whereas for longer ignition delay periods the ignition is assumed to take place at the trailing edge of the spray.
In a previous work of the authors, an ignition delay model for medium speed dual-fuel engines was presented []. The model combines a 1D spray model with a mixing-controlled evaporation model and an approach for 2-stage autoignition, including the low temperature heat release. In the present work, the ignition delay model is used as base for a predictive combustion model which also accounts for incomplete combustion. The model is then implemented in GT-Power and coupled with a NOx-model and a knock model from literature. The models are calibrated with measurement data and validated against a huge variety of measurement data from a single cylinder medium speed dual-fuel engine, including a full engine map and extensive variation of injection timing and air-to-fuel ratio at selected operation points.
2. Ignition Delay
The ignition delay model was presented in detail in Ref. [] and is, therefore, only briefly described in the following. The spray model used to simulate the spray behavior of the pilot injection is the 1D transient spray model from Musculus and Kattke, which is described in detail in Ref. []. The 1D spray model models a 2-phase jet with liquid fuel, using a 1D Eulerian control volume approach, as illustrated in Figure 1.
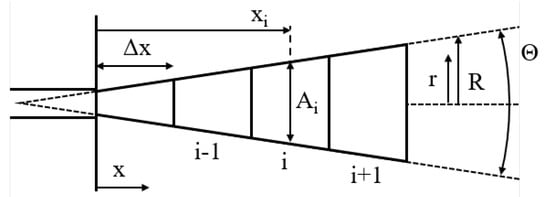
Figure 1.
Schematic view of the 1D spray model and the Eulerian control volume approach.
The spray angle is an input value of the spray model []. In the present work, the spray angle is calculated with the empirical correlation according to Siebers []:
In Equation (1) the spray angle depends on the liquid fuel density and the ambient gas density . For the factor , the value 0.26 is used, as suggested in Ref. []. In each control volume the radial fuel and velocity distribution are calculated with an Abramovich distribution as follows:
The liquid fuel concentration is related to the value at the centerline by the dimensionless radius . The exponent is 1.5 for a fully developed distribution. The velocity distribution is calculated analogous to Equation (2). The spray is then modelled by mass conservation of the liquid fuel in Equation (3) and momentum conservation in Equation (4):
In Equation (3), is the mass and is the density of the liquid fuel. The overbars on the liquid fuel fraction and the velocity denote that these values are cross-sectional averages. The value results from integrating the fuel and velocity distribution over the cross-section area []. The subscripts i and j denote the control volume (c.f. Figure 1) and the timestep, respectively, with the time-step size . In Equation (4) the momentum of the control volume is calculated using the mean density of the control volume .
With the aforementioned equations the axial fuel distribution inside the spray is calculated in every timestep. Due to the application of the radial Abramovich distribution from Equation (2), a pseudo-2D fuel distribution as shown in Figure 2 is calculated at every timestep. The spray model neglects the cylinder walls. However, the control volumes are defined for a length longer than the theoretical distance between the injector and the cylinder wall, to not lose any fuel in the mass balance, which could leave the last control volume. The control volumes outside the combustion chamber are then treated different during calculation of the ignition delay.

Figure 2.
Fuel distribution inside the spray.
The spray model neglects evaporation; therefore, a mixing-controlled evaporation model is implemented to derive a temperature distribution inside the spray. Following the work of Siebers, the time limiting process for an evaporating diesel jet is the mixing with the surrounding ambient gas []. Thus, the minimum possible air-to-fuel ratio which can fully evaporate only depends on the boundary conditions pressure and temperature and can therefore be calculated a priori. Using n-heptadecane as reference fuel, as suggested in Ref. [], a look-up table for the minimum possible fully evaporated air-to-fuel ratio is implemented.
Furthermore, an explicit solution for the mixing temperature of the fully evaporated part of the fuel was developed []. With this mixing temperature a temperature distribution inside the spray is calculated at every timestep. Thus, all relevant information for the calculation of the local reactivity is available.
To calculate the ignition of the pilot fuel, an ignition delay model is developed in Ref. [] based on homogeneous reactor calculations using the open-source software Cantera []. The extended n-heptane mechanism from the Lawrence Livermore National Laboratories [] is used with n-heptane as reference for the pilot fuel and methane as reference for the natural gas. Correlations for the low and high temperature ignition delay time, as well as the temperature increase due to low temperature heat release (LTHR), are fitted against the results of the reaction kinetics calculations. All correlations are published in Ref. [].
Figure 3a shows an exemplary fuel distribution inside a control volume plotted over the dimensionless radius r/R. The mixing temperature Tmix in Figure 3b results from the mixing and evaporation of the pilot fuel and is, therefore, the coldest at the richest spot. After the LTHR, the opposite is the case, as the higher fuel concentration leads to a higher temperature increase ΔT. Resulting from the temperature and fuel distribution two different profiles of the local reactivity occur, which are presented in Figure 3c by the local ignition delay time. Before the first stage of ignition has occurred, both the low and high temperature ignition delay times have their minimum value, which defines the most reactive mixture, in the leaner region. This minimum results from the contrary effects of the decreasing fuel concentration leading to lower reactivity and the increasing temperature leading to higher reactivity. Thus, after the LTHR has occurred, the most reactive mixture is at the centerline of the spray, because this is the hottest and richest spot.
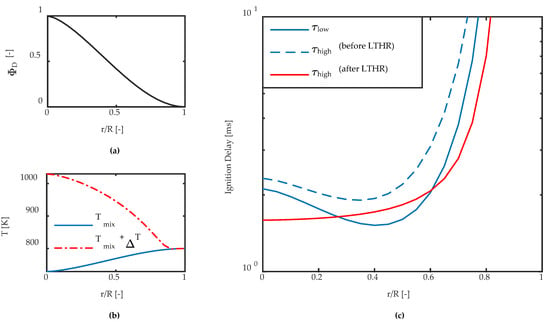
Figure 3.
Calculation of the local ignition delay times in a single control volume at the boundary conditions: = 800 K, p = 50 bar, = 0.5; (a) fuel distribution; (b) temperature distribution before and after LTHR; (c) ignition delay times for first and second stage of ignition.
To trace the reaction progress inside the spray, two progress variables, and are introduced for the first and second stage of ignition respectively. For both progress variables, the following transport equation is applied:
The subscripts i and j denote the control volume (c.f. Figure 1) and the timestep, respectively, with the time-step size . The reaction progress c is coupled to the mass of the pilot fuel and the respective mass flow . The term accounts for the chemical reactions inside the control volume by integrating the inverse of the ignition delay time over the timestep at the position of the most reactive mixture inside the control volume []. To account for wall contact of the spray, the reaction term is set to zero for all control volumes that are located outside the combustion chamber. The overmixing term accounts for the dilution of the spray during long ignition delay times. If the spray gets very lean before ignition, the dilution of the pre-reaction products leads to a prolongation of the ignition process. In this case, the overmixing term is calculated as follows:
The model parameter is set to unity in this project. If measurement data for non-igniting early injections is available, this can be used to calibrate the ignition limits.
Figure 4a shows an exemplary evolution of the axial fuel distribution of a pilot injection up to ignition and Figure 4b shows the respective reaction progress for the high temperature ignition. Ignition occurs if the progress variable reaches unity.
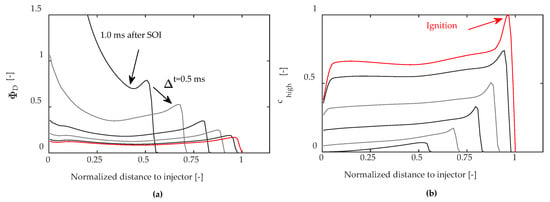
Figure 4.
Exemplary evolution of fuel distribution and reaction progress inside the spray for different timestamps starting at 1 ms after SOI; (a) axial distribution of the cross-sectional averaged inside the spray; (b) axial distribution of the reaction progress.
3. Combustion
After ignition, the spray model is terminated and the combustion models are initialized. To account for the inhomogeneous fuel distribution inside the combustion chamber, the spray zones, which are richer than the homogenous NG/air mixture, are burned separately. Based on the fuel distribution inside the spray (c.f. Figure 2) the complete spray is burned with a model for premixed combustion, if at least 95% of the spray is fully premixed (c.f. Section 3.2). Otherwise, if a relevant part of the spray is not yet fully premixed, this part of the spray is burned as mixing-controlled combustion (c.f. Section 3.1). The homogeneous NG/air mixture is burned with a turbulent entrainment approach (c.f. Section 3.3) and the transition between the premixed combustion stages is explained in Section 3.4.
3.1. Mixing-Controlled Combustion
For the mixing-controlled combustion, the approach from Magnussen [] is slightly modified and the burn rate is calculated according to Equation (7):
In Equation (7) the mixing-controlled burn rate depends on the available mass , the turbulent kinetic energy and the integral length scale . The parameter is used for model calibration.
3.2. Premixed Combustion of the Pilot Spray
For the fully premixed part of the spray, a turbulent flame propagation is assumed, which is calculated as follows:
According to Equation (8), the flame front with the flame front area propagates with the turbulent flame speed throughout the unburned mixture with the density . The transition term transitions between the two phases of the combustion and the parameter is used for calibration. The transition term, as well as the sub-models used for the turbulent flame speed and the flame front area, is further explained in the respective subsections.
3.3. Premixed Combustion of the Homogeneous NG/Air Mixture
For the homogeneous NG/air mixture, the combustion is modelled with a turbulent entrainment model which was originally published by Blizard and Keck [] and further developed for modelling SI engines by multiple authors. The combustion process is split in two steps. In the first step, the mass is entrained into the flame front:
The entrained mass flow results from the flame front , which propagates with the turbulent flame speed into the unburned premixed cylinder charge with the density . The parameter is used for calibration. The mass available for the combustion inside the flame front is calculated according to Equation (10), based on the total entrained mass inside the flame front, the already burned mass , and the quenched mass at the cylinder walls . The latter one is further described in Section 3.8.
In the second step of the combustion in the turbulent entrainment model, the available mass inside the flame front is burned during the burnup time :
Based on the recent findings from Ref. [], the burnup time is calculated from the integral length scale and the turbulent flame speed . The parameter is added for model calibration.
For the calculation of the turbulent flame speed for this case, a mixing temperature inside the flame front is used. With Equation (13) the temperature is calculated from the burned and unburned zone temperatures and respectively, which are weighted by the respective mass fractions inside the flame front.
3.4. Transition between Combustion Phases
As presented in the previous subsections, the submodels for the premixed combustion of the pilot spray and the homogeneous NG/air mixture both use the flame front area (c.f. Equations (8) and (9)). Thus, the transition factor is introduced to share the flame front area between the two submodels or the two phases of the combustion process respectively.
The transition factor depends on the combustion progress of the premixed pilot spray and the equivalence ratios of the homogeneous NG/air mixture and the pilot fuel respectively. Thus, the transition factor is related to the premixedness of the pilot spray. As one can see in Figure 5, this results in a good representation of the combustion behavior for shorter and longer ignition delays times.
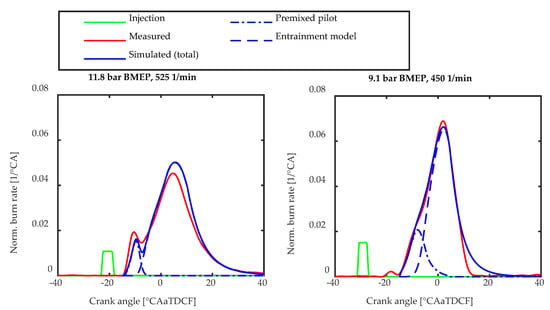
Figure 5.
Comparison of the burn rates for long and short ignition delay times.
3.5. Laminar and Turbulent Flame Speed
For the laminar flame speed of the NG/air mixture two models from literature are combined. The model published in Ref. [] predicts the laminar flame speed for methane-based fuels, including the components ethane, propane, butane, and hydrogen. A model for the laminar flame speed of methane was fitted against reaction kinetics calculations and the increase of the flame speed due to higher hydrocarbons and hydrogen is included by a pre factor. However, the model presented in Ref. [] is only valid up to an air-to-fuel ratio of λ = 2. Therefore, the influence of the higher hydrocarbons and hydrogen which is published in Ref. [] is combined with the laminar flame speed model for methane published in Ref. [], which is valid up to λ of 5.
For the pilot spray, it is also relevant to account for the pilot fuel. To take this into account, the laminar flame speed model for n-heptane from Ref. [] is included, which is also based on reaction kinetics calculations. As both fuels are mixed in the pilot spray zone, the laminar flame speeds are combined, using the approach presented in Ref. []. In Ref. [] it was shown by reaction kinetics calculations that a linear interpolation based on the mol-fractions of the respective fuels provides sufficient results for the relevant mixtures inside the pilot spray of a dual-fuel engine.
For the turbulent flame speed, the model of Peters [] is applied, which depends on the laminar flame speed, the laminar flame thickness, the mean turbulent velocity, and the turbulent length scale. The turbulence-related input parameters of the model are available from the turbulence model in GT-Power, whereas for the laminar flame thickness, the approach from Ref. [] is used.
3.6. Flame Front Model
Based on the results of the optical investigations from Ref. [] and different 3D CFD simulations published in Refs. [,,,], the following approach for the geometry of the flame front was derived:
- In the beginning, the flame front consists of multiple cones with spherical tip, whereas the number of cones equals the number of holes in the injector nozzle;
- Adjacent flames can merge to one flame front;
- The flames are extinguished at the cylinder walls due to flame quenching at the contact areas of the flame front and the cylinder walls.
As a 3D simulation of the flame front would be out of the scope for a 0D/1D simulation environment, some simplifications are made to reduce the complexity which are illustrated in Figure 6:
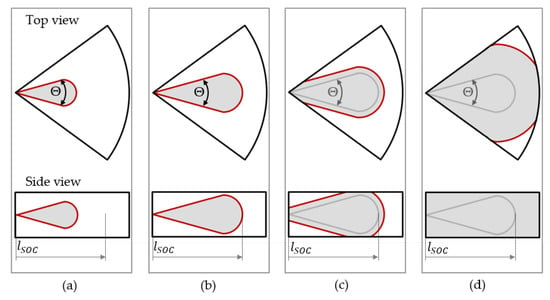
Figure 6.
Illustration of the flame front in the top view (upper row) and in the side view (bottom row). The different stages of the evolution of the flame front are illustrated: (a) cone shaped flame front at the beginning of the combustion process; (b) maximum size of the cone shaped flame front; (c) flames spread perpendicular to flame front in all directions; (d) close to end of combustion.
- The combustion chamber is modelled with a pancake geometry;
- The single flames are assumed to be symmetrical and the spray origin is located at the center of the combustion chamber. Thus, the combustion chamber is cut in symmetrical sections according to the number of injector nozzle holes, whereas only one section is modelled;
- In the first phase of the combustion (Figure 6a,b), the flame front is cone shaped with a spherical tip, until the length of the cone equals the spray penetration in the spray model at the start of combustion (lSOC);
- In the second phase of the combustion Figure 6c,d, the flame front spreads perpendicular to the flame surface. The adjacent flames merge and at the wall contact areas the flame front is distinguished.
For the actual calculation of the flame front, the section of the combustion chamber is cut in slices in axial direction of the spray and the flame surface is calculated using a numerical root-finding algorithm. A more detailed description of the flame front modeling approach can be found in Ref. [].
3.7. NOx Emissions
The NOx emissions are modelled using the Extended Zeldovich Mechanism, which is available as a built-in template in GT-Power. The version used in this work uses the same reaction rate parameters as published by Heywood []. For the calibration of the model a NOx multiplier can be adjusted in GT-Power, which is simply a multiplier for the simulated NOx emissions.
3.8. Unburned Hydrocarbons
For the unburned hydrocarbons, three different sources are considered: scavenging, and flame quenching in crevice volumes and on the combustion chamber walls. The fuel, which is scavenged during valve overlap, is directly modelled due to the gas exchange simulation in GT-Power. In addition to this, two models are implemented for the unburned hydrocarbons resulting from flame quenching on the combustion chamber walls and flame quenching inside crevice volumes.
The flame quenching at the combustion chamber walls is simulated with the model presented in Ref. [], which is based on the thermal approach for the quench layer thickness from Ref. []. At each wall, the quench layer thickness is calculated as follows:
In the numerator is the thermal conductivity, whereas and are the burned zone temperature and the wall temperature respectively. The index denotes the values inside the quench layers, whereas the index denotes the respective combustion chamber walls: head, piston and liner. In the denominator in Equation (15) and are the mass fraction of the natural gas and the respective lower heating value, is the laminar flame speed and the density of the unburned cylinder charge.
With the quench layer thickness and the respective areas where the flame is quenched at the cylinder walls, the quenched mass for the combustion chamber wall is calculated as follows:
The area of the respective cylinder walls is calculated by the flame front model. The factor is used to calibrate the model. The total mass of unburned mixtures due to flame quenching at the walls (c.f. Equation (10)) results as sum of the masses quenched at cylinder head, piston and liner.
In addition to the flame quenching at the cylinder walls, a crevice volume is added. Assuming that the crevice volume contains only the unburned homogeneous natural gas/air mixture, the mass inside the crevice volume is calculated with the density of the unburned zone.
3.9. Knock
Knocking combustion is one major limitation for dual-fuel engines. As knock occurs due to autoignition of unburned mixture, a common approach for knock model in 0D/1D simulation is the knock integral, which is based on the work of Livengood and Wu []:
The value of the knock integral KI is calculated by integrating the inverse of the ignition delay time, which can be interpreted as the reaction rate. Knock occurs if the value of KI reaches a certain threshold. In this work, the model of Urban et al. [] is used. In Ref. [], a detailed model for the ignition delay time of methane-based fuels is published, which includes higher hydrocarbons up to butane and hydrogen. As suggested in Ref. [], the value of KI is evaluated at the time with the highest unburned zone temperature. For calibration of the knock model only the threshold of KI for knocking combustion has to be selected, based on one operation point with 5% knock frequency.
4. Validation of the Combustion Model
4.1. Experimental Setup
The measurement data used for calibration and validation of the combustion model was recorded during the FVV-Project Propeller Operation with Four-stroke Dual-fuel Engines II at the Department of Marine Engineering at the Hamburg University of Technology []. The test engine used for the validation of the combustion model is a single cylinder dual-fuel engine. The base engine is an MAN 32/40 diesel engine which was converted to dual-fuel operation []. The main data of the engine can be found in Table 1. The full load is equivalent to a brake mean effective pressure (BMEP) of 18.5 bar.

Table 1.
Main data of the test engine.
4.2. Simulation Environment
The aforementioned models (except the NOx-model, which is already available) are programmed in Fortran and implemented in GT-Power as UserCode. The engine model, which is used for pressure trace analysis and forward simulations, is built in GT-Power v2020. Figure 7 gives an overview of the relevant components of the engine model. The pressure sensors at the intake and exhaust side of the test engine are located close to the cylinder. Thus, only short pipes are needed to connect the cylinder head with the end environments, where the measured crank angle resolved pressures are applied. The cylinder head consists of a flow split and two equally bent tubes which are created according to the technical drawings. On the intake side, a part of the volume of the cylinder head is added to the previous pipe, to ensure that the volume between the gas injector and the intake valves is analogous to the real engine. This allows estimation of the fuel mass, which is scavenged during the short period of valve overlap.
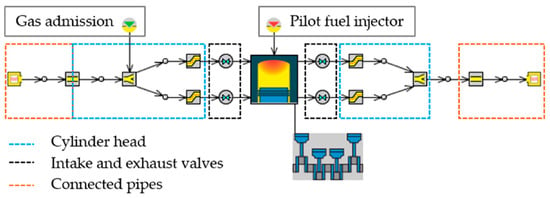
Figure 7.
Single cylinder engine model in GT-Power.
The wall temperatures of the combustion chamber are modelled with the finite element wall temperature solver which is available in GT-Power and the wall heat transfer coefficient is modelled with the function WoschniGT, which is an adopted version of the original approach by Woschni (c.f. Ref. []).
4.3. Ignition Delay
The ignition delay time is defined as the time between the start of combustion and the time when 2% fuel is burned, to enable an accurate automated evaluation of the measurement data. Figure 8 shows a comparison of the measured and simulated ignition delay times in crank angle and time, with a coefficient of determination (R2) of 0.953 and 0.959, respectively. The injection duration for 98% of the shown cases is approx. 1.6 ms. As the ignition delay time is a multiple of the injection duration in the majority of the cases, the spray is highly diluted at the time of ignition. In a previous publication [], the model was also validated against measurement data from a different dual-fuel engine with a regular pilot injector, showing similar good results.
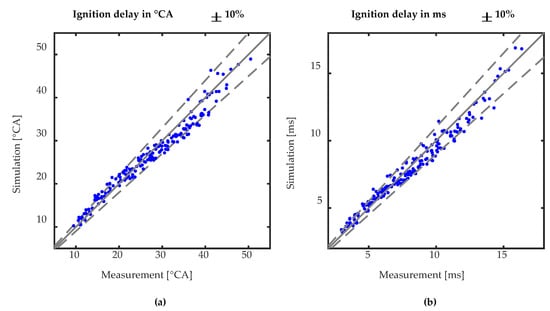
Figure 8.
Comparison of measured and simulated ignition delay times: (a) in crank angle and (b) in milliseconds.
The good prediction of the start of ignition without the necessity of calibration against measurement data proves the ability of the presented physical/chemical approach.
4.4. Combustion Modelling
For the calibration of the combustion model, ten operation points are used, which are evenly spread over the engine operation map. To cover the whole engine map with one set of parameters, the burnup time multiplier is replaced with a linear equation depending on the indicated mean effective pressure (IMEP), instead of a constant value.
The following Figure 9, Figure 10 and Figure 11 show burn rates for different air-to-fuel ratios of the homogeneous natural gas/air mixture () and different injection timings. For better comparison, all three plots have the same axis scaling. One can see that a wide range of is covered due to the implemented flame speed models. Furthermore, Figure 10 shows how the shape of the burn rates changes with later injection timings. Due to the shorter time for preparation of the pilot fuel, a burn rate with two peaks can be observed.
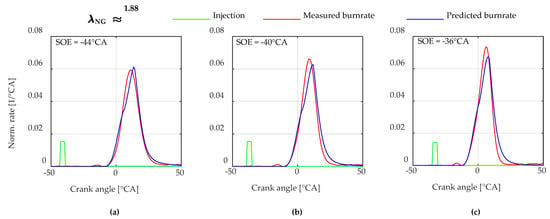
Figure 9.
Comparison of the measured and simulated normalized burn rates at 450 rpm, 9.1 bar BMEP, and an air-to-fuel ratio of the natural gas/air mixture ( of 1.88. Injection timing of the pilot fuel is varied by start of energizing (SOE): (a) −44 °CA; (b) −40 °CA; (c) −36 °CA.
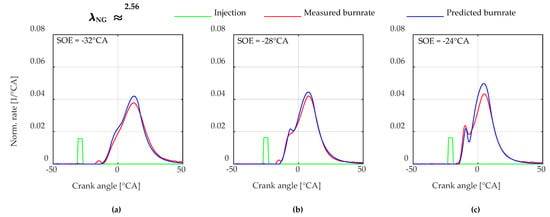
Figure 10.
Comparison of the measured and simulated normalized burn rates at 450 rpm, 9.1 bar BMEP, and an air-to-fuel ratio of the natural gas/air mixture ( of 2.56. Injection timing of the pilot fuel is varied by start of energizing (SOE): (a) −32 °CA; (b) −28 °CA; (c) −24 °CA.
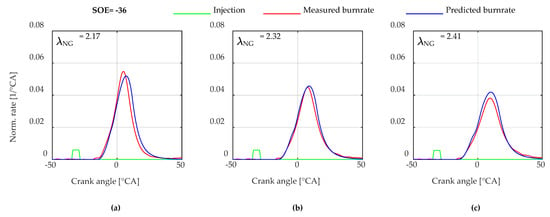
Figure 11.
Comparison of the measured and simulated normalized burn rates at 675 rpm, 18.4 bar BMEP, and a constant injection timing of the pilot fuel with SOE = −36 °CA. Charge air pressure is varied, resulting in different air-to-fuel ratios of the natural gas/air mixture (: (a) = 2.17; (b) = 2.32; (c) = 2.41.
Figure 12 shows a comparison of the measured and simulated combustion parameters start of combustion when 2% of the fuel is burned (MFB02), center of combustion when 50% of the fuel is burned (MFB50), and the burn duration 10–75%. For most of the operation points the simulated values are within the ±3 °CA band.
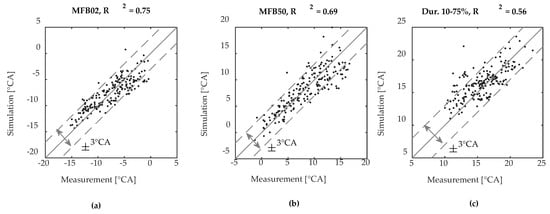
Figure 12.
Comparison of the measured and simulated combustion parameters: (a) start of combustion MFB02; (b) center of combustion MFB50; (c) Burn duration 10–75%.
4.5. Unburned Hydrocarbons
For the unburned hydrocarbons, two different models are included, the crevice volume and the wall quench model. The crevice volume is used as calibration parameter. Thus, for the unburned hydrocarbons two model parameters are adjusted, the crevice volume and a quench layer thickness multiplier. As one can see in Figure 13, the HC-emissions are increasing with higher load and speed, which is also partly related to higher cycle to cycle variabilities and shorter time for post oxidation. As these effects are not captured by the implemented models, the quench layer thickness multiplier is extended with an empirical correlation to include the effects, which are not explicitly modeled. Thus, instead of using a constant value for it was found during model calibration that the best results are obtained if is calculated as a function of IMEP and mean piston speed :
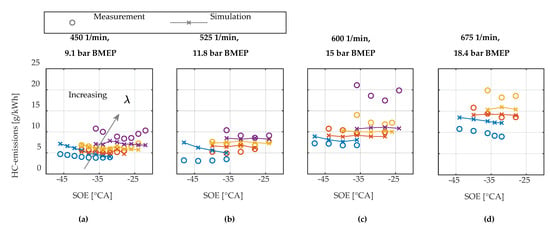
Figure 13.
Comparison of measured and simulated HC-emissions for the four operation points on the 120% propeller curve. The different colors indicate different charge air pressures. The variations are plotted over the injection timing, characterized by the start of energizing (SOE) of the pilot injector. Negative values indicate timings before top dead center. The operation points are: (a) 450 1/min and 9.1 bar BMEP; (b) 525 1/min and 11.8 bar BMEP; (c) 600 1/min and 15.0 bar BMEP; (d) 675 1/min and 18.4 bar BMEP.
For the calibration, measurement data from three different charge air pressures were taken from each of the four operation points on the 120% propeller curve. The crevice volume was only calibrated at the operation point with 450 1/min.
Figure 13 shows a comparison of the measured and simulated specific HC-emissions at the 120% propeller curve. The emissions include both incomplete combustion and scavenging. Except for the highest air-to-fuel ratio at 600 1/min, the trends are captured satisfactorily.
4.6. Engine Operation Parameters
Figure 14 gives an overview of the operation parameters indicated mean effective pressure (IMEP), maximum cylinder pressure and brake specific fuel consumption (BSFC) for 191 different measurement points, which cover the full engine map and the λ- and SOI-variations at the 120% propeller curve. The IMEP and the BSFC show an overall relatively small error. The error of the maximum cylinder pressure is a bit higher, but still the coefficient of determination (R2) is acceptably high. The results presented in Figure 14 show that the model is able to predict the engine behavior in a wide range of boundary conditions.
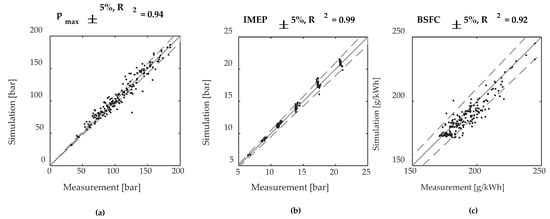
Figure 14.
Comparison of measured and simulated engine operation parameters: (a) Maximum cylinder pressure; (b) Indicated mean effective pressure; (c) Brake specific fuel consumption.
4.7. NOx-Emissions
For the calibration of the NOx-model, the same operation points were used as for the combustion model. The NOx multiplier was set to a value of 8.5138. Figure 15 shows the measured and simulated NOx-emissions for 191 different measurement points, which cover the full engine map and the λ- and SOI-variations at the 120% propeller curve. The highlighted measurement points have low air-to-fuel ratios of λ < 1.9, which cause high NOx-emissions. The overall trends are in good agreement with the model. In particular, the SOI variations, which result in strongly increasing NOx-emissions, are captured well.
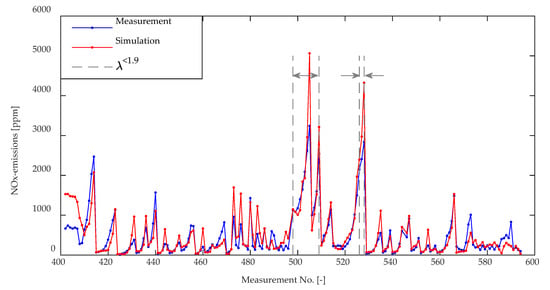
Figure 15.
Measured and simulated NOx-emissions for all measurement points.
4.8. Knock
The knock model was calibrated at one operating point at 600 rpm and 15 bar BMEP with a knock frequency of 5%. The resulting KI of 0.7153 is the threshold for knock simulation. Thus, a KI ≥ 0.7153 in the simulation refers to a knock frequency ≥ 5%. Figure 16a shows the knock frequency which was calculated from the measurement data for MFB50 variations at 450 rpm and 9.1 bar BMEP at different charge air pressures and charge air temperatures, which are listed in Table 2. Figure 16b shows the respective KI values from simulation using the combustion model. The absolute values of the measured and simulated knock limited MFB50 are listed in Table 2. The results are promising, as not only the trend is predicted correctly, but also the absolute error is comparably low for the variations 1, 2, and 4.
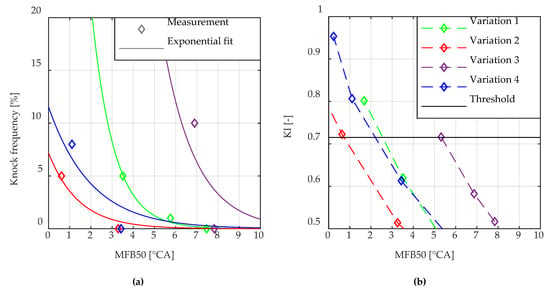
Figure 16.
Comparison of measured and simulated knock at different air-fuel ratios and charge air temperatures at an operation point with 450 1/min and 9.1 bar BMEP; (a): measured knock frequency and exponential fit; (b): simulated KI values.

Table 2.
Comparison of measured and simulated knock limited MFB50 at 450 1/min and 9.1 bar BMEP.
However, it should be noted that knocking combustion is a stochastic phenomenon, which is why MFB50 variations are usually captured out in a finer mesh and repeated multiple times.
In the measurement data presented in Figure 16, the injection timing was varied in steps of 2 °CA, whereas for each operation point 100 single working cycles were recorded. Therefore, the results shown in this section may only give an impression of the capability of the knock model.
5. Conclusions
In this paper, a predictive combustion model for medium speed dual-fuel engines was developed, implemented in GT-Power and validated for a wide range of boundary conditions.
The pilot injection is modelled with the 1D spray model from Musculus and Kattke. The model is extended with a mixing limited evaporation model and a new model to calculate the temperature distribution inside the spray. The ignition process is simulated with a detailed 2-stage ignition delay model, which was built based on extensive reaction kinetics calculations. The reaction progress inside the spray is tracked via a new transport equation, including the effect of overmixing. The ignition delay model is able to predict the start of combustion correctly for all relevant boundary conditions. In this work, no parameter of the ignition delay model was calibrated against measurement data, proving the capabilities of the chosen physical/chemical approach.
After ignition, the spray model is terminated and the mixture inside the spray is used to initialize the combustion model. To account for the different fuels in the combustion chamber, the unburned zone is divided in different pseudo sub-zones, which are burned with different combustion models using state of the art sub-models from literature. For the flame propagation, a new flame front model was developed which calculates the flame front in the first part of the combustion as cone shaped single flames which later merge into one flame front. The combustion model shows good prediction of the relevant combustion parameters over the engine map. To improve the results, one parameter of the entrainment model was extended with an empirical correlation.
For the NOx-emissions, the Extended Zeldovich Mechanism, available as a built-in template in GT-Power, showed good results.
As the test engine showed partially high HC-emissions, two models were implemented to estimate flame quenching in crevice volumes and on the combustion chamber walls, respectively. As the HC-emissions showed trends that are not only related to flame quenching, the latter one was extended by an empirical correlation which summarizes multiple other influences on the HC-emissions. This results in a satisfactory prediction of the unburned fuel and thus improves the prediction of BSFC. This empirical correlation can be seen as one shortcoming of the presented model which needs further investigation.
For knock prediction a model from literature was implemented. The knock-limited MFB50 is predicted with an accuracy of approx. ±2 °CA for different charge air temperatures and different air-fuel ratios at one operation point with 450 1/min and 9.1 bar BMEP.
Author Contributions
Conceptualization, J.F.; Investigation, J.F.; Methodology, J.F.; Project administration, J.F.; Supervision, P.E.; Validation, J.F.; Writing–original draft, J.F.; Writing–review and editing, P.E. All authors have read and agreed to the published version of the manuscript.
Funding
This research, as part of the FVV-project 1280, was founded by the FVV (Research Association for Combustion Engines eV).
Data Availability Statement
Data sharing not applicable.
Acknowledgments
The presented results are part of the PhD thesis, which was published in []. The research leading to this thesis was conducted in the scope of the FVV-project “Propeller Operation with Four-stroke Dual-fuel Engines II”. The research project (1280) was performed by Department of Marine Engineering (ASM) at Hamburg University of Technology under the direction of Friedrich Wirz and by Institute of Internal Combustion Engines (ivb) at Technische Universität Braunschweig under the direction of Peter Eilts. The project was self-financed by the FVV (Research Association for Combustion Engines eV) and conducted by an expert group under the direction of Philipp Henschen, (MAN Energy Solution SE). The authors gratefully acknowledge the support received from the FVV and from all those involved in the project.
Conflicts of Interest
The authors declare no conflict of interest.
References
- Menage, A.; Gruand, A.; Berg, P.; Golloch, R. The New Dual Fuel Engine 35/44 DF from MAN Diesel & Turbo SE. In Proceedings of the CIMAC Congress, Shanghai, China, 13–17 May 2013. [Google Scholar]
- Troberg, M.; Portin, K.; Jarvi, A. Update on Wärtsilä 4-stroke Gas Product Development. In Proceedings of the CIMAC Congress, Shanghai, China, 13–17 May 2013. [Google Scholar]
- Erdgas und Erneuerbares Methan für den Fahrzeugantrieb. 2015. Available online: https://doi.org/10.1007/978-3-658-07159-2 (accessed on 5 July 2022). [CrossRef]
- Auer, M.; Friedrich, C.; Waldenmaier, U.; Knafl, A.; Stiesch, G. Vorgehensweise in der Brennverfahrensentwicklung für Mittelschnelllaufende Gasmotoren bei MAN Diesel & Turbo. In Proceedings of the the 14. Tagung “DER ARBEITSPROZESS DES VERBRENNUNGSMOTORS”, Graz, Austria, 24–25 September 2013. [Google Scholar]
- Terbeck, S.; Werner, M.; Zhu, J.; Kunkel, C.; Gschwendtner, M.; Bartenschlager, G. The output-enhanced 51/60DF—Max-Imum Performance from the Modular System. In Proceedings of the 11th Dessau Gas Engine Conference, Dessau, Germany, 11–12 April 2019. [Google Scholar]
- Hiroyasu, H.; Kadota, T.; Arai, M. Development and Use of a Spray Combustion Modeling to Predict Diesel Engine Efficiency and Pollutant Emissions: Part 1 Combustion Modeling. Bull. JSME 1983, 26, 569–575. [Google Scholar] [CrossRef] [Green Version]
- Krishnan, S.R.; Srinivasan, K.K.; Midkiff, K.C. Phenomenological Modeling of Low-Temperature Advanced Low Pilot-Ignited Natural Gas Combustion. 2007. Available online: https://www.sae.org/publications/technical-papers/content/2007-01-0942/ (accessed on 5 July 2022).
- Halstead, M.; Kirsch, L.; Quinn, C. The autoignition of hydrocarbon fuels at high temperatures and pressures—Fitting of a mathematical model. Combust. Flame 1977, 30, 45–60. [Google Scholar] [CrossRef]
- Walther, H.-P.; Schlatter, M.M.E.S.; Wachtmeister, D.-I.G.; Boulouchos, S.T.K. Combustion Models for Lean-Burn Gas Engines with Pilot Injection. MTZ Worldw. 2012, 73, 56–63. [Google Scholar] [CrossRef]
- Livengood, J.; Wu, P. Correlation of autoignition phenomena in internal combustion engines and rapid compression machines. Symp. Combust. 1955, 5, 347–356. [Google Scholar] [CrossRef] [Green Version]
- Zirngibl, S.; Wachtmeister, G. Using a Phenomenological Simulation Approach for the Prediction of a Dual-Fuel Pilot Injection Combustion Process. 2020. Available online: https://www.sae.org/publications/technical-papers/content/2020-01-5013/ (accessed on 5 July 2022).
- Kraft, S.; Moser, M.; Büskens, C.; Echim, M. Real-Time Capable Combustion Simulation of a Dual-Fuel Engine for Hardware-in-the-Loop Application. In Heavy-Duty-, On- und Off-Highway-Motoren, Siebenpfeiffer, W., Ed.; Springer Fachmedien: Wiesbaden, Germany, 2019; pp. 191–206. [Google Scholar] [CrossRef]
- Krenn, M.; Redtenbacher, C.; Pirker, G.; Wimmer, A. A New Approach for Combustion Modeling of Large Dual-Fuel Engines. In Heavy-Duty-, On- und Off-Highway-Motoren; Siebenpfeiffer, W., Ed.; Springer Fachmedien: Wiesbaden, Germany, 2018; pp. 155–173. [Google Scholar] [CrossRef]
- Konrad, J.; Lauer, T.; Moser, M.; Lockner, E.; Zhu, J. Engine Efficiency Optimization under Consideration of NOX- and Knock-Limits for Medium Speed Dual Fuel Engines in Cylinder Cut-Out Operation. In Proceedings of the WCX World Congress Experience, Detroit, Wayne, 10–12 April 2018. [Google Scholar]
- Taritas, I.; Kozarac, D.; Sjeric, M.; Aznar, M.S.; Vuilleumier, D.; Tatschl, R. Development and Validation of a Quasi-Dimensional Dual Fuel (Diesel—Natural Gas) Combustion Model. SAE Int. J. Engines 2017, 10, 483–500. [Google Scholar] [CrossRef]
- Wenig, M.; Roggendorf, K.; Fogla, N. Towards Predictive Dual-Fuel Combustion and Prechamber Modeling for Large Two-Stroke Engines in the Scope of 0D/1D Simulation. In Proceedings of the 29th CIMAC World Congress, Vancouver, CA, USA, 10–14 June 2019. [Google Scholar]
- Millo, F.; Accurso, F.; Piano, A.; Caputo, G.; Cafari, A.; Hyvönen, J. Experimental and numerical investigation of the ignition process in a large bore dual fuel engine. Fuel 2021, 290, 120073. [Google Scholar] [CrossRef]
- Musculus, M.P.B.; Kattke, K. Entrainment Waves in Diesel Jets. SAE Int. J. Engines 2009, 2, 1170–1193. [Google Scholar] [CrossRef]
- Barro, C.; Nani, C.; Hutter, R.; Boulouchos, K. Spray Model Based Phenomenological Combustion Description and Experimental Validation for a Dual Fuel Engine. In Proceedings of the 13th International Conference on Engines & Vehicles, Capri, Italy, 10–14 September 2017. [Google Scholar]
- Barro, C.; Lucjan, A.; Li, Z.; Kyrtatos, P.; Pandurangi, S.; Wright, Y.M.; Boulouchos, K. Development and Experimental Validation of a Fast Spray Ignition Model for Diesel Engines Using Insights from CFD Spray Calculations. SAE Int. J. Fuels Lubr. 2017, 10, 304–317. [Google Scholar] [CrossRef]
- Park, H.; Boulouchos, K.; Kyrtatos, P.; Srna, A.; Yoon, W.; Lee, Y. Modeling of Micro-Pilot Ignition in Medium-Speed Dual-Fuel Engines. In Proceedings of the 11th Dessau Gas Engine Conference, Dessau, Germany, 11–12 April 2019. [Google Scholar]
- Frerichs, J.; Eilts, P. Development of a Physically/Chemically Based Approach for 2-Stage Ignition Delay Calculation in Medium Speed Dual-Fuel Engines. In Proceedings of the 14th International Conference on Engines & Vehicles, Capri, Italy, 15–19 September 2019. [Google Scholar] [CrossRef]
- Siebers, D.L. Scaling Liquid-Phase Fuel Penetration in Diesel Sprays Based on Mixing-Limited Vaporization. In Proceedings of the International Congress & Exposition, Detroit, Wayne, 1–4 March 1999. [Google Scholar] [CrossRef]
- Goodwin, D.G.; Moffat, H.K.; Speth, R.L. Cantera: An Object-Oriented Software Toolkit for Chemical Kinetics, Thermodynamics, and Transport Processes. Version 2.3.0. 2017. Available online: https://zenodo.org/record/170284#.YsZhx4RByUk (accessed on 5 July 2022).
- Mehl, M.; Pitz, W.J.; Westbrook, C.K.; Curran, H.J. Kinetic modeling of gasoline surrogate components and mixtures under engine conditions. Proc. Combust. Inst. 2011, 33, 193–200. [Google Scholar] [CrossRef] [Green Version]
- Magnussen, B.; Hjertager, B. On mathematical modeling of turbulent combustion with special emphasis on soot formation and combustion. Symp. Combust. 1977, 16, 719–729. [Google Scholar] [CrossRef]
- Blizard, N.C.; Keck, J.C. Experimental and Theoretical Investigation of Turbulent Burning Model for Internal Combustion Engines. 1974; p. 740191. Available online: https://www.jstor.org/stable/44721435 (accessed on 5 July 2022).
- Hann, S. A Quasi-Dimensional SI Burn Rate Model for Carbon-Neutral Fuels; Springer Fachmedien: Wiesbaden, Germany, 2021. [Google Scholar] [CrossRef]
- Hann, S.; Urban, L.; Grill, M.; Bargende, M. Influence of Binary CNG Substitute Composition on the Prediction of Burn Rate, Engine Knock and Cycle-to-Cycle Variations. SAE Int. J. Engines 2017, 10, 501–511. [Google Scholar] [CrossRef]
- D’Adamo, A.; Del Pecchia, M.; Breda, S.; Berni, F.; Fontanesi, S.; Prager, J. Chemistry-Based Laminar Flame Speed Correlations for a Wide Range of Engine Conditions for Iso-Octane, n-Heptane, Toluene and Gasoline Surrogate Fuels. In Proceedings of the International Powertrains, Fuels & Lubricants Meeting, Beijing, China, 16–19 October 2017. [Google Scholar]
- Eder, L.; Ban, M.; Pirker, G.; Vujanovic, M.; Priesching, P.; Wimmer, A. Development and Validation of 3D-CFD Injection and Combustion Models for Dual Fuel Combustion in Diesel Ignited Large Gas Engines. Energies 2018, 11, 643. [Google Scholar] [CrossRef] [Green Version]
- Peters, N. The turbulent burning velocity for large-scale and small-scale turbulence. J. Fluid Mech. 1999, 384, 107–132. [Google Scholar] [CrossRef]
- Decan, G.; Lucchini, T.; D’Errico, G.; Verhelst, S. A Coupled Tabulated Kinetics and Flame Propagation Model for the Simulation of Fumigated Medium Speed Dual-Fuel Engines. In Proceedings of the the 14th International Conference on Engines & Vehicles, Capri, Italy, 15–19 September 2019. [Google Scholar]
- Decan, G. Towards a Framework for Optimizing Dual-Fuel Engines: Computing In-Cylinder Heat Transfer and Modeling Dual-Fuel Combustion. Ph.D. Thesis, Universität Gent, Gent, Belgium, 2020. [Google Scholar]
- Henke, B.; Schleef, K.; Buchholz, B.; Andree, S.; Hassel, E.; Hoff, M.; Graumüller, R. Pilot Injection Strategies for Medium-Speed Dual Fuel Engines. In Heavy-Duty-, On- und Off-Highway-Motoren; Siebenpfeiffer, W., Ed.; Springer Fachmedien: Wiesbaden, Germany, 2018; pp. 115–135. [Google Scholar]
- Frerichs, J. Development of a Combustion Model for Medium Speed Dual-Fuel Engines. Ph.D. Thesis, Braunschweig, Germany, 2022. [Google Scholar]
- Heywood, J.B. Internal Combustion Engine Fundamentals; McGraw-Hill: New York, NY, USA, 1988. [Google Scholar]
- Ratzke, A. Modellierung der Flammenausbreitung und des Flammenlöschens im Gasmotor. Leibniz Universität, Hannover, Hannover, 2013. Available online: https://www.itv.uni-hannover.de/fileadmin/itv/publications/Dissertation_2013-3_Ratzke-Ansgar.pdf (accessed on 5 July 2022).
- Boust, B.; Sotton, J.; Labuda, S.; Bellenoue, M. A thermal formulation for single-wall quenching of transient laminar flames. Combust. Flame 2007, 149, 286–294. [Google Scholar] [CrossRef]
- Urban, L.; Grill, M.; Hann, S.; Bargende, M. Ansatz für die Klopfmodellierung methanbasierter Kraftstoffe auf Basis reak-tionskinetischer Untersuchungen. In Proceedings of the 16. Tagung Der Arbeitsprozess des Verbrennungsmotors, Graz, Austria, 28–29 September 2017. [Google Scholar]
- Schröder, M.; Frerichs, J. Propeller Operation with Four-stroke Dual-fuel Engines II. Final Report FVV-Project No. 1280. 2021. [Google Scholar]
- Panten, T. Propellerbetrieb mit Viertakt-Zweistoffmotoren. Final Report FVV-Project No. 1190. 2017. [Google Scholar]
Publisher’s Note: MDPI stays neutral with regard to jurisdictional claims in published maps and institutional affiliations. |
© 2022 by the authors. Licensee MDPI, Basel, Switzerland. This article is an open access article distributed under the terms and conditions of the Creative Commons Attribution (CC BY) license (https://creativecommons.org/licenses/by/4.0/).