1. Introduction
The global electric energy crisis has become a significant issue over the past decade. Many governments have been striving to incorporate sustainable energy sources like wind and solar power into their electrical grids [
1,
2]. In response to the energy crisis, countries worldwide have adopted policies and strategies to promote the use of renewable resources for energy production [
3,
4]. According to a recent study by the International Energy Agency (IEA), global renewable energy capacity is projected to increase by 50% in the next year and by 75% (2400 GigaWatts (GW)) over the next five years [
5]. The IEA highlights PV and wind energy as the most promising and rapidly growing sectors, driven by their competitive commercial costs [
6].
Figure 1 illustrates the historical development of wind turbine installations according to the Global Wind Energy Council (GWEC). The global wind energy market is projected to grow by 8.8% annually [
7].
GWEC’s market intelligence forecasts that new installations will surpass the previous record and reach 138 GW in 2025. A total of 982 GW of new capacity is expected to be added this year and in the next five years under current policies. This would result in an average of 164 GW of new installations annually until 2030. GWEC’s Market Outlook offers the industry’s perspective on expected installations of new capacity over the next five years.
Figure 2a illustrates the total onshore installations of wind turbines in GW. The GWEC reported that new wind power reached approximately 1052.3 GW in 2025, indicating significant global growth in renewable energy. In
Figure 2b, the total installations of offshore wind turbines are shown. According to the GWEC report, the total installations of offshore wind turbines reached around 83.2 GW.
Figure 2a showcases the increasing new installations of onshore wind turbine capacities in leading nations such as China, the USA, Germany, and India, followed by Brazil. China and the USA are highlighted for their impressive achievements in managing high levels of wind penetration based on onshore wind turbines.
Figure 2b depicts offshore installations of wind turbines. However, embarking on a wind energy generation project requires careful planning and a thorough assessment of meteorological data to analyze the potential for harnessing wind power in a specific region [
8].
Recently, there has a rising interest in the utilization of wind energy in Palestine as an option to decrease the importation of electricity and seek sustainability [
9]. Alsamamra et al. in [
10] conducted a study that assessed the wind power potential of East Jerusalem, presenting the opportunities for small-scale wind turbines in the area despite lower wind speeds.
These studies demonstrate the increasing interest in wind energy in Palestine and serve as the foundation for the current study that will assess the wind energy potential in six cities across the West Bank. By enhancing previous research and offering a more detailed and comparative analysis, this study contributes to the promotion of renewable energy integration into Palestine’s energy mix.
In ref. [
11], wind energy potential in Nablus, Ramallah, and Gaza was analyzed using daily wind speed data fitted to the Weibull distribution. The results showed significant annual energy production (927.1–1008 kWh/m
2), demonstrating the feasibility of wind energy in Palestine and supporting investment in renewable energy.
This research aims to explore the viability of implementing a small-scale wind turbine in the region. Wind forecasting entails conducting thorough surveys at potential wind farm sites, including installing measuring towers with anemometers to collect wind speed and direction data at various heights. These measurements are critical for assessing the power generation potential of a wind farm, considering factors such as turbine efficiency, electrical infrastructure, transmission capacity, and local energy demand.
In this study, the Probability Distribution Function (PDF) is used to analyze wind data, which will be used to assess wind energy production in Palestine. The volatile political and economic conditions in Palestine can result in an outdated energy sector with minimal growth. Long-term analysis of actual wind speed can provide valuable insights into wind power availability, economic viability, and technical design of wind turbine systems [
12,
13].
The shape (k) and scale (c) parameters of the Weibull PDF have been extensively studied in the literature in a variety of global locales [
14,
15]. Furthermore, a number of approaches have been successfully tested in this context [
16,
17], as has the applicability of each approach in relation to the distribution of sample wind data and the meteorological station’s location. The Empirical Method (EM), proposed by Justus et al. [
18], is a method for calculating the Weibull parameters by utilizing the data average and Standard Deviation (SD). The Maximum Likelihood Method (MLM), which uses numerical iterative methods to estimate the two Weibull parameters, was proposed in Ref. [
19]. The Graphical Method (GM) that uses linear least-squares regression to obtain the best estimated values of the Weibull parameters was provided in Ref. [
20]. A different approach, the Energy Pattern Factor Method (EPF), was suggested by Ref. [
21] to evaluate the research site’s possible wind power density while accounting for wind speed change. Moreover, a number of statistical analyses were used to compare the Weibull parameter estimation techniques. For instance, Ref. [
22] compared and contrasted the Modified Maximum Likelihood Method (MMLM), the Graphical Method, and the MLM for estimating the Weibull parameters using sample wind speed. According to [
23], in order to determine the best technique for estimating the Weibull parameters, the wind speed data from a Canadian study site were analyzed. Five approaches were compared: EM, GM, MLM, MMLM, and EPF. The graphical technique was shown to be the least effective; however, the EPF and EM were highly favorable. Similarly, SD, MLM, ML using a modified iterative approach, ML using an iterative method, EPF, and the equivalent energy method were the six methods for estimating the Weibull parameters that Shabana et al. in [
24] examined. Four statistical indicators were employed to evaluate the accuracy of the approach. The equivalent energy approach performs better than the others with the maximum estimation accuracy, according to the experimental results. Bingöl, as per Ref. [
25], compared various Weibull estimation techniques using wind speed data collected from a meteorological tower situated 101 m above sea level. The outcomes demonstrate that the MLM offers superior estimation, particularly when there is a lot of variation in wind speed. In order to ascertain which estimating technique performed the best in a study site situated in the Adana region of Turkey, Kaplan in Ref. [
26] evaluated the performance of six estimation approaches utilized to estimate the coefficients of the Weibull distribution function.
Prior research examined how well the probability distribution functions represent the statistical features of the observed wind speed by comparing measured wind speed values with statistical distributions [
27,
28]. The Weibull distribution function is the most often employed mathematical function that offers the best match for characterizing wind speed profiles [
29,
30,
31].
The histogram frequency of mean wind speed, diurnal variation, and wind power curves can summarize wind speed data for a specific site. Statistical characteristics of PDF, Cumulative Distribution Function (CDF), and diurnal variation in wind speed can lead to an efficient wind turbine system tailored to the actual wind speed data of the targeted site [
32,
33,
34].
Palestine relies entirely on neighboring countries for its fossil fuel needs and over two-thirds of its electricity consumption [
11]. Due to Palestine’s high population density and rapid industrial expansion, there is a significant demand for energy, leading to unjustifiable price controls on resources [
35]. The Palestinian government has recently launched numerous initiatives to invest in renewable energy, primarily solar and wind energy, and has adopted policies aimed at increasing the use of sustainable energy resources [
36]. These actions are part of a larger effort to reduce reliance on energy consumption from neighboring countries. Wind energy is one of the fastest-growing sustainable energy sources in terms of the percentage of annual increase in total installed capacity [
37,
38].
One of the key factors in wind power generation is wind speed, which is a random phenomenon [
17]. To ascertain the most accurate estimate of wind energy potential, it is essential to conduct a comprehensive analysis of wind speed data sourced from a meteorological station situated at the same geographic coordinates [
39]. However, factors such as the time of day, the elevation of the meteorological station, and the terrain type can lead to significant variations in wind speed estimates. Therefore, it is crucial to thoroughly review and analyze wind speed data [
40]. Only a small number of studies have been published in the literature on the assessment of wind resources in the Palestinian territory [
41]. For the wind energy industry to deploy small- to medium-sized wind energy conversion systems and provide energy-based solutions, precise and reliable assessments of wind resources are essential [
42,
43].
The Palestinian government is actively promoting investment in renewable energy projects. However, conducting analytical research and modeling of renewable energy resources, such as wind power, is crucial to ensure secure and profitable investments in renewable energy. The literature emphasizes the site-specific nature of wind assessment and modeling, despite the availability of similar studies globally. This suggests that estimating accurate Weibull parameters at one location may not be suitable for other locations [
44]. Furthermore, based on previous research, this study is considered to be the first analysis of long-term wind data in the West Bank. This research provides a solid foundation and a general overview of the wind conditions in the area for potential investors in wind energy.
While large-scale maps showing wind patterns at high altitudes are widely available, there is limited information on wind speed and patterns in low-altitude urban areas [
45,
46].
In the past two to three decades, there has been an energy shift towards renewable energy due to environmental issues, energy security, and economic sustainability. Despite these global trends, Palestine still faces challenges in exploiting renewable energy, hindered by geopolitical, economic, and infrastructural insecurities that interfere with energy independence [
47].
Additionally, the irregular topography and scattered climatic conditions within Palestine add another layer of variability regarding wind energy potential [
48]. Consequently, by conducting a comprehensive wind power potential analysis for six cities in Palestine using nine numerical techniques of Weibull parameter estimation, this study addresses a potential research gap. It aims to provide a comparative study of each method and insights into their accuracy and applicability in the local setting context. By establishing a methodological framework for wind resource assessment studies, the article seeks to facilitate the development of renewable energy projects in Palestine as a strategic step towards sustainable development of energy in the country.
The nine numerical methods were chosen based on their widespread adoption and proven effectiveness in the literature for estimating Weibull distribution parameters in wind energy studies. Recent comparative research demonstrates that these methods collectively represent the state-of-the-art for capturing the statistical variability of wind speed, especially in regions with complex or low wind profiles, such as Palestine. For example, studies have shown that the MLM and EPF methods consistently yield high accuracy across diverse climates, while the inclusion of Method of Moments (MM), EM, and Standard Deviation Method (STDM) ensures robust performance under varying data conditions. The addition of MMLM, Second Modified Maximum Likelihood Method (SMMLM), GM, and Least Mean Square Method (LSM) allows for a comprehensive evaluation of both classical and modern estimation techniques, as recommended by recent reviews and comparative analyses in wind resource assessment.
2. Enhancing the Grid Stability-Based Wind Power Integration
The intermittent and variable nature of wind power presents significant challenges to the security, reliability, and efficiency of power grids, particularly in regions with constrained energy infrastructure, like Palestine [
49]. The integration of wind energy brings technical issues such as voltage fluctuations, power system transients, reactive power imbalances, and harmonics, which are exacerbated by the low mean wind speeds (1.2–3.52 m/s) observed in the six Palestinian cities studied (Bethlehem, Jericho, Jenin, Nablus, Ramallah, and Tulkarm). These challenges are critical in Palestine, where the energy sector relies heavily on imported electricity from Israel, Jordan, and Egypt and faces political and economic constraints that hinder grid modernization [
50,
51].
Low-Voltage Ride-Through (LVRT) is essential for maintaining the stability of wind power plants and ensuring they stay connected to the grid during voltage dips to prevent outages [
52,
53,
54].
Figure 3a presents the LVRT voltage limit requirement curves, while
Figure 3b illustrates the reactive current injection during fault conditions. The figure places particular emphasis on the grid code established by German utility operators, commonly referred to as the E.ON code. [
55,
56].
It is essential for wind turbine generators to remain connected to the utility network during a grid dip when the line voltage remains above the specified limit shown in
Figure 3a. Apart from meeting the requirement of active power, Wind Energy Conversion System (WECS) must also inject reactive current, as indicated in
Figure 3b, while ensuring that it does not exceed the converter’s current limits.
This injection of reactive power assists the utility in stabilizing the grid voltage. The amount of reactive power to be injected depends on the extent of the grid voltage dip, the level of reactive current present before the dip, and the grid’s current rating. According to
Figure 3b, LVRT capability should be activated when a voltage sag is detected below.
90% of its nominal value. For a voltage sag between 50% and 90%, a reactive current of 2% should be provided for each 1% voltage dip. When a 50% drop in the grid voltage occurs, WECS will deliver a 100% reactive current [
57]. The WECS can significantly improve system stability, particularly for low and medium-voltage sags, making it a promising solution for reliable wind power integration [
54]. Under normal grid voltage conditions (≥90% of nominal voltage), the WECS operates in Maximum Power Point Tracking (MPPT) mode to extract maximum aerodynamic power from the wind [
58,
59,
60,
61].
The fluctuating nature of wind power, as evidenced by the Weibull shape factor (k) ranging from 1.27 to 1.96 across the studied cities, underscores the need for advanced control strategies.
In Palestine, the grid’s limited capacity to handle reactive power demands and frequent voltage dips at connection points can lead to feeder regulation disruptions and potential voltage collapse [
62]. This is particularly relevant for small-scale wind turbines, which are the focus of this study due to their suitability for the region’s low wind speed profile (e.g., 1.8 m/s mean wind speed). For instance, the high wind speed variability in Ramallah (scale factor c from 2.7 to 3.2 m/s) increases the risk of transient disturbances, which Master Power Control (MPC) can mitigate by optimizing reactive power control and voltage regulation. Ongoing research is essential to adapt MPC for small-scale systems, ensuring compatibility with Palestine’s constrained grid environment.
For instance, the West Bank’s fragmented grid and frequent power outages exacerbate voltage fluctuation risks, particularly in high-potential areas like Ramallah, where wind power density reaches 3077 W/m
2. To address these issues, strategic investments in grid infrastructure, such as reinforcing transmission lines and deploying battery storage, are critical [
63,
64].
To optimize wind power integration in Palestine, the following actions are proposed, tailored to the region’s context:
Evaluating Resource Variability: The statistical analysis in this study, using nine numerical methods to estimate Weibull parameters, provides a robust foundation for modeling wind speed variability. Accurate forecasting of wind production, particularly in Ramallah and Jenin, with higher wind energy potential, can inform grid management strategies to mitigate voltage fluctuations and transients [
65,
66].
Examining Flexibility: Enhancing grid flexibility through energy storage systems. For small-scale turbines, battery storage can buffer intermittent output, while MPC can optimize reactive power control, reducing the risk of voltage collapse during sudden wind speed changes [
35,
67].
Examining Transmission Line Improvements: Targeted upgrades to Palestine’s aging transmission infrastructure are necessary to accommodate new RES projects. Reinforcing lines in high-potential areas like Ramallah can facilitate the integration of small-scale wind farms, ensuring efficient power flow to local consumers [
68].
Recognizing Reliability Challenges: Scenario-driven analyses, incorporating this study’s wind speed data, can identify reliability issues associated with increased wind penetration [
69].
Scalability is a critical consideration for Palestine’s future energy strategy. While this study focuses on small-scale turbines, increasing wind penetration to meet growing demand (driven by population density and industrial expansion) will require scalable grid stability solutions.
The findings of this study highlight the potential for small-scale wind turbines to contribute to energy security, particularly in Ramallah and Jenin. By coupling these efforts with advanced grid stability solutions like MPC, strategic infrastructure upgrades, and hybrid system integration, Palestine can move toward a sustainable, resilient energy future [
70,
71].
3. Comprehensive Methodological Approach for Evaluating Wind Resources: Estimation of Weibull Parameters and Statistical Validation
Among the nine numerical methods evaluated, MLM and EPF consistently showed high accuracy across all cities. The varying performance of the methods may be linked to the unique wind speed distributions in each city, which affect the randomness of Weibull fitting. This evaluation clarifies the preferred methods for estimating wind energy in different regions of Palestine.
The study collected average wind speed data from six cities in the West Bank and used statistical analysis tools to assess efficiency, error percentage, and actual wind speed data.
3.1. Experimental Setup and Data Collection
Wind speed data used in this study was obtained from the Palestinian Meteorological Department.
Figure 4 illustrates the measurement setup, in which the wind speed monitor is typically installed at an approximate height of 10 m.
Figure 5 illustrates the data collection locations in the West Bank, Palestine, corresponding to No. 2 and covering the six targeted cities.
Table 1 presents the specific geographical coordinates (latitude and longitude) of each meteorological station used in this study.
Figure 6 illustrates that Ramallah consistently experiences the highest monthly average wind speeds, peaking at 3.37 m/s during June to August, while Jericho and Tulkarm have the lowest averages (1.1–1.46 m/s) throughout the year. Nablus and Jenin show moderate and relatively stable wind speeds (1.5–2 m/s), with Jenin peaking at 2.38 m/s. These trends indicate that Ramallah is the most promising site for wind energy, while Jericho and Tulkarm are less suitable due to persistently low wind speeds.
In
Figure 7, the highest wind speed was recorded in Ramallah city, followed by Jenin city. The maximum wind speed fluctuates from January to April and from September to December. The peak of the maximum wind speed occurred in March in both cities, with Ramallah city experiencing the highest peak wind speed.
Wind direction is a crucial factor in studying wind power production [
72,
73]. It aids in identifying the optimal location by assessing wind power potential. Wind speed direction is essential for maximizing wind power energy generation [
74]. By installing wind energy conversion systems aligned with the wind speed direction, the highest power output can be achieved [
75,
76,
77]. The frequency distribution of wind speed was examined to determine the duration of time the wind blows in a specific direction in the six cities.
Figure 8,
Figure 9,
Figure 10,
Figure 11,
Figure 12,
Figure 13,
Figure 14,
Figure 15,
Figure 16,
Figure 17,
Figure 18 and
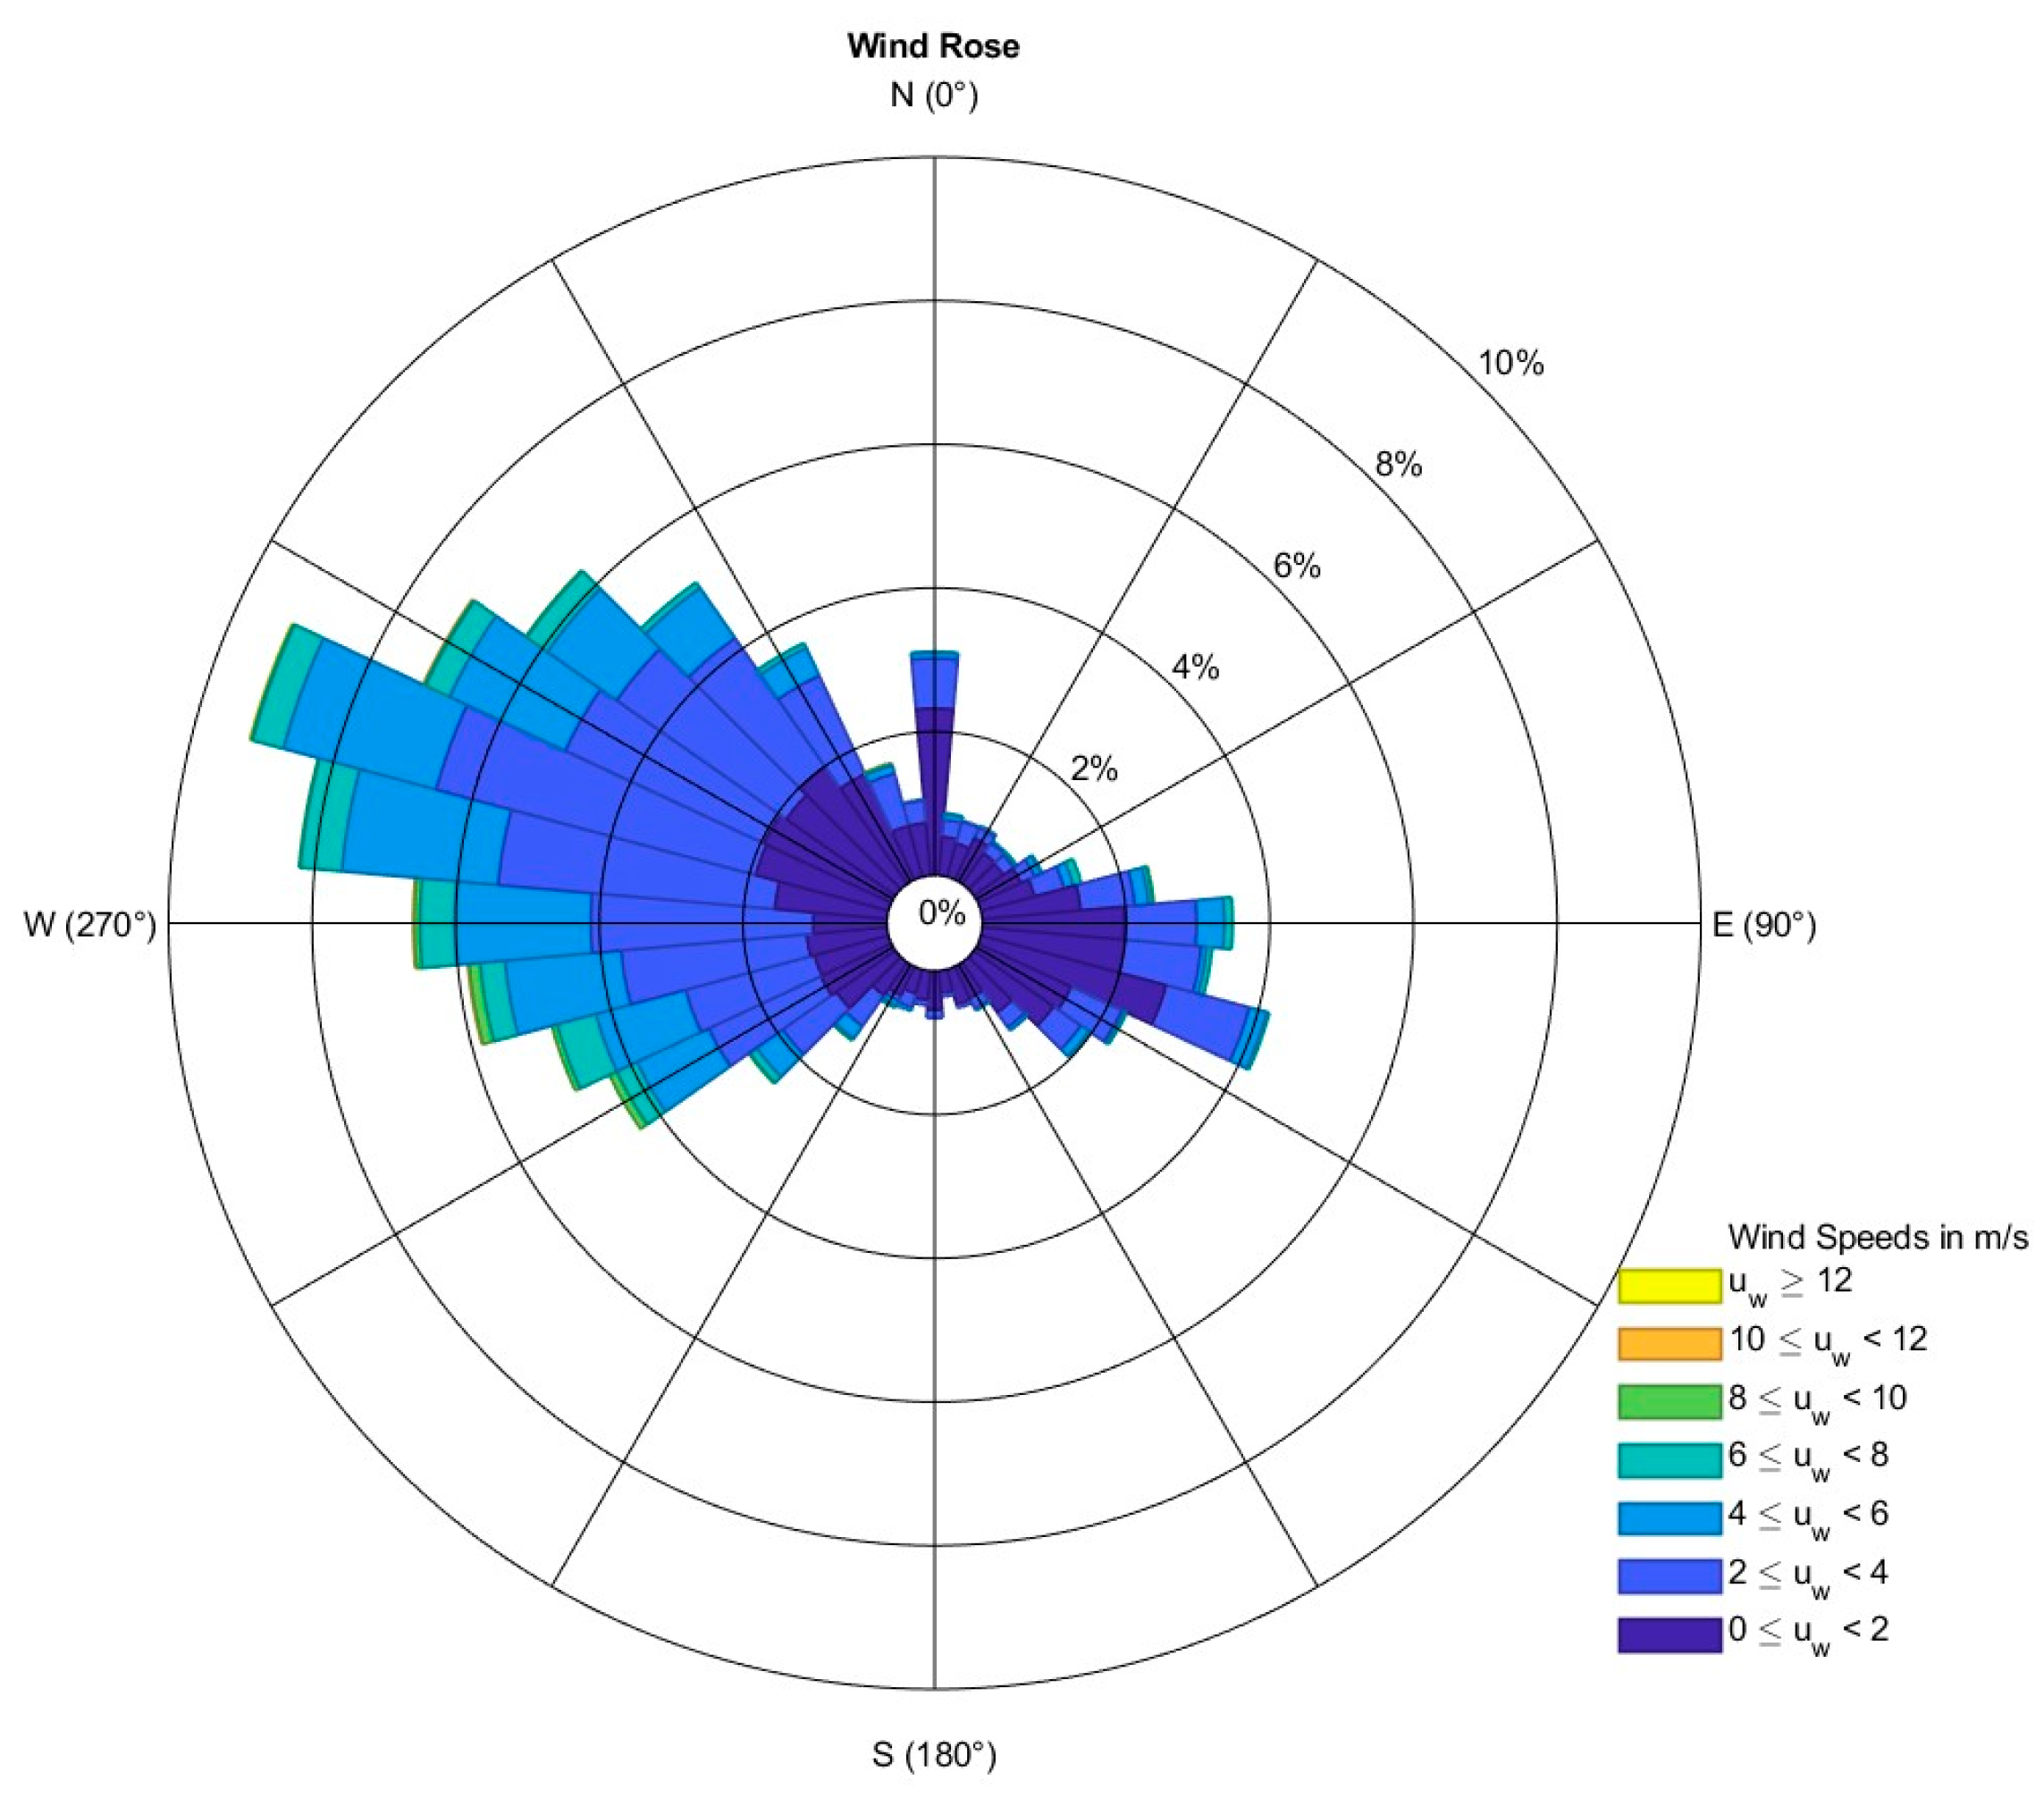
Figure 19 present the monthly wind rose diagrams over a seven-year period. The results indicate that during January, February, and March, the prevailing wind directions were predominantly from the west and northwest. From April to October, the highest frequency of wind occurrence consistently originated from the northwest across all seven years of recorded data. In November and December, the dominant wind directions in Ramallah city shifted mainly to the east and southeast, although winds from the west, southwest, and northwest were also observed.
Figure 20 illustrates the wind rose for Ramallah, representing the average wind speed distribution across different wind velocities. The wind rose shows wind occurrences from sixteen cardinal directions. The predominant wind directions in Ramallah were from the east, northeast, and southeast. Additionally, the figure highlights that winds originating from the west, southwest, and northwest constituted the primary flow patterns, accounting for 78.6% of the total wind occurrences.
3.2. Estimation of Wind Power Density
The assessment of wind speed information heavily relies on the wind power density metric. To estimate the potential wind energy that can be harnessed at a specific site, there are two primary methods available.
The first method involves utilizing the frequency distribution function, specifically the two-parameter Weibull method.
The second method involves calculating the available power based on the recorded mean wind speed from the meteorological station. This is considered a direct and efficient method to determine the output energy according to actual data [
78].
For this study, the evaluation of wind power exclusively employed the Weibull distribution. The Weibull PDF was selected to illustrate the distribution of wind speeds and compute wind power density.
The estimation process serves several purposes, including retroactively identifying historical conditions, forecasting future power generation at a specific site, and predicting power generation across a wind turbine grid [
79,
80].
3.3. Weibull Parameters Calculation
The wind potential in a specific area is characterized by a random variable known as the Weibull PDF. The shape factor (k) and scale factor (c) of the Weibull curve are determined based on two main parameters, which are commonly used in statistical analyses [
27,
28,
29]. To utilize them, time-series records of wind speed data need to be obtained. The Weibull PDF f(ν) and the CDF, F(ν) can be used to model wind speed data [
33,
81,
82,
83,
84]. The integral of the PDF is computed to obtain the CDF, which is ultimately calculated using the following equation [
85,
86,
87]:
The probability function derivation is denoted as follows:
where v is the mean wind speed (m/s). Parameter k represents the width of the wind speed probability distribution or the peak of the wind probability distribution for a specific region [
88]. On the other hand, parameter c represents the abscissa scale of the wind probability distribution, indicating the wind speed at a particular site [
82,
89,
90].
Statistical models have been favored and utilized to forecast the distribution of wind speed. These models provide in-depth details regarding the local possibilities that might exist at a specific location [
33]. Selecting an appropriate PDF is essential for sustaining long-term advantages of wind speed profiles.
Parameterizing the distribution of wind resources to discover the best fits can make the estimation process more challenging, especially when there is a lot of variation in the distribution of wind speeds [
91,
92]. To determine which statistical distribution most accurately represents the wind regime, a variety of probability functions were combined with the wind speed data. Researchers have concluded that the Weibull PDF can be used to characterize the wind variations in a certain wind regime since its accuracy level is adequate [
40,
93]. Additionally, it may offer a true representation of the wind frequency distribution at various altitudes above sea level [
77]. Therefore, studying the statistical characteristics of wind speed is essential for calculating energy output. The Weibull PDF is usually considered for the statistical distribution of the wind speed data analysis because of its high accuracy and ease of application [
94,
95]. The dimensionless shape parameter (k) and the scale parameter (c) in units of m/s are the two main variables that the Weibull PDF uses to fairly and accurately reflect the daily average wind speed [
95,
96]. These variables demonstrate an accurate and valid probabilistic model for wind speed at a particular geographical area [
40]. The following nine numerical techniques were analyzed to find the ideal values of k and c:
Method of Moments (MM): Utilizing the MM approach is a highly efficient strategy for obtaining the Weibull parameters. The 1st moment corresponds to the origin, whereas the 2nd moment is relevant to the mean. Moments serve as the basis for computing the parameters k and c. The MM is efficient and straightforward, making it suitable for quick estimations, though it may be less precise with skewed data.
Empirical Method (EM) or Standard Deviation Method (STDM): The empirical approach presents a direct and practical solution that merely requires knowledge of mean wind speed and standard deviation but can be sensitive to outliers.
Maximum Likelihood Method (MLM): Used in the research of finding information about the wind speed. The k and c parameters are obtained by an associated set of equations. It is highly accurate and robust, especially with large datasets and variable wind regimes, but it requires iterative computation.
Modified Maximum Likelihood Method (MMLM): MMLM can only be applied when the wind speed data is presented in the form of a frequency distribution. It involves multiple iterations to calculate the Weibull parameters.
Second Modified Maximum Likelihood Method (SMMLM): SMMLM eliminates the need for iterative estimation of the shape parameter and does not require any iteration or data sorting.
Both MMLM and SMMLM may be less effective with small sample sizes.
Graphical Method (GM) and Least Mean Square Method (LSM): The GM and LSM are visually intuitive and simple, but often yield lower accuracy, especially in complex wind regimes. It is necessary to initially classify the wind speed record into specific bins.
Energy Pattern Factor Method (EPF): The EPF is correlated with the average records of wind speed. It is particularly effective in sites with significant wind speed variability, but may be less reliable in uniform wind conditions.
The methods used are summarized in
Table 2 below:
3.4. Goodness of Fit (GOF)
An assessment was conducted to evaluate the effectiveness of five parameter estimation techniques for computing the Weibull PDF [
114,
115]. Multiple numerical and statistical methods were employed, along with five statistical indicators, to facilitate a comparative evaluation. The Index of Agreement (IA), Chi-square test (X
2), RMSE, Relative Root Mean Square Error (RRMSE), and Mean Absolute Percentage Error (MAPE) were utilized, along with other statistical tools [
116,
117].
The Root Mean Square Error (RMSE), a statistical metric, was used to evaluate the accuracy of the six different approaches. This study focused on the distribution of wind speed to identify the optimal values of k and c through Weibull methods. These approaches are effective in estimating wind speed for energy-related issues in six different Palestinian cities.
Table 3 summarizes the five statistical tools.
3.5. PDF and CDF Curves
The PDF and the CDF are essential tools for analyzing wind speed data, as they provide insights into the frequency and probability of different wind speeds, which are critical for evaluating wind energy potential. The PDF describes how the wind speed values are distributed over time, while the CDF represents the cumulative probability of wind speeds not exceeding a given value.
Figure 21,
Figure 22,
Figure 23,
Figure 24,
Figure 25,
Figure 26,
Figure 27,
Figure 28,
Figure 29,
Figure 30,
Figure 31 and
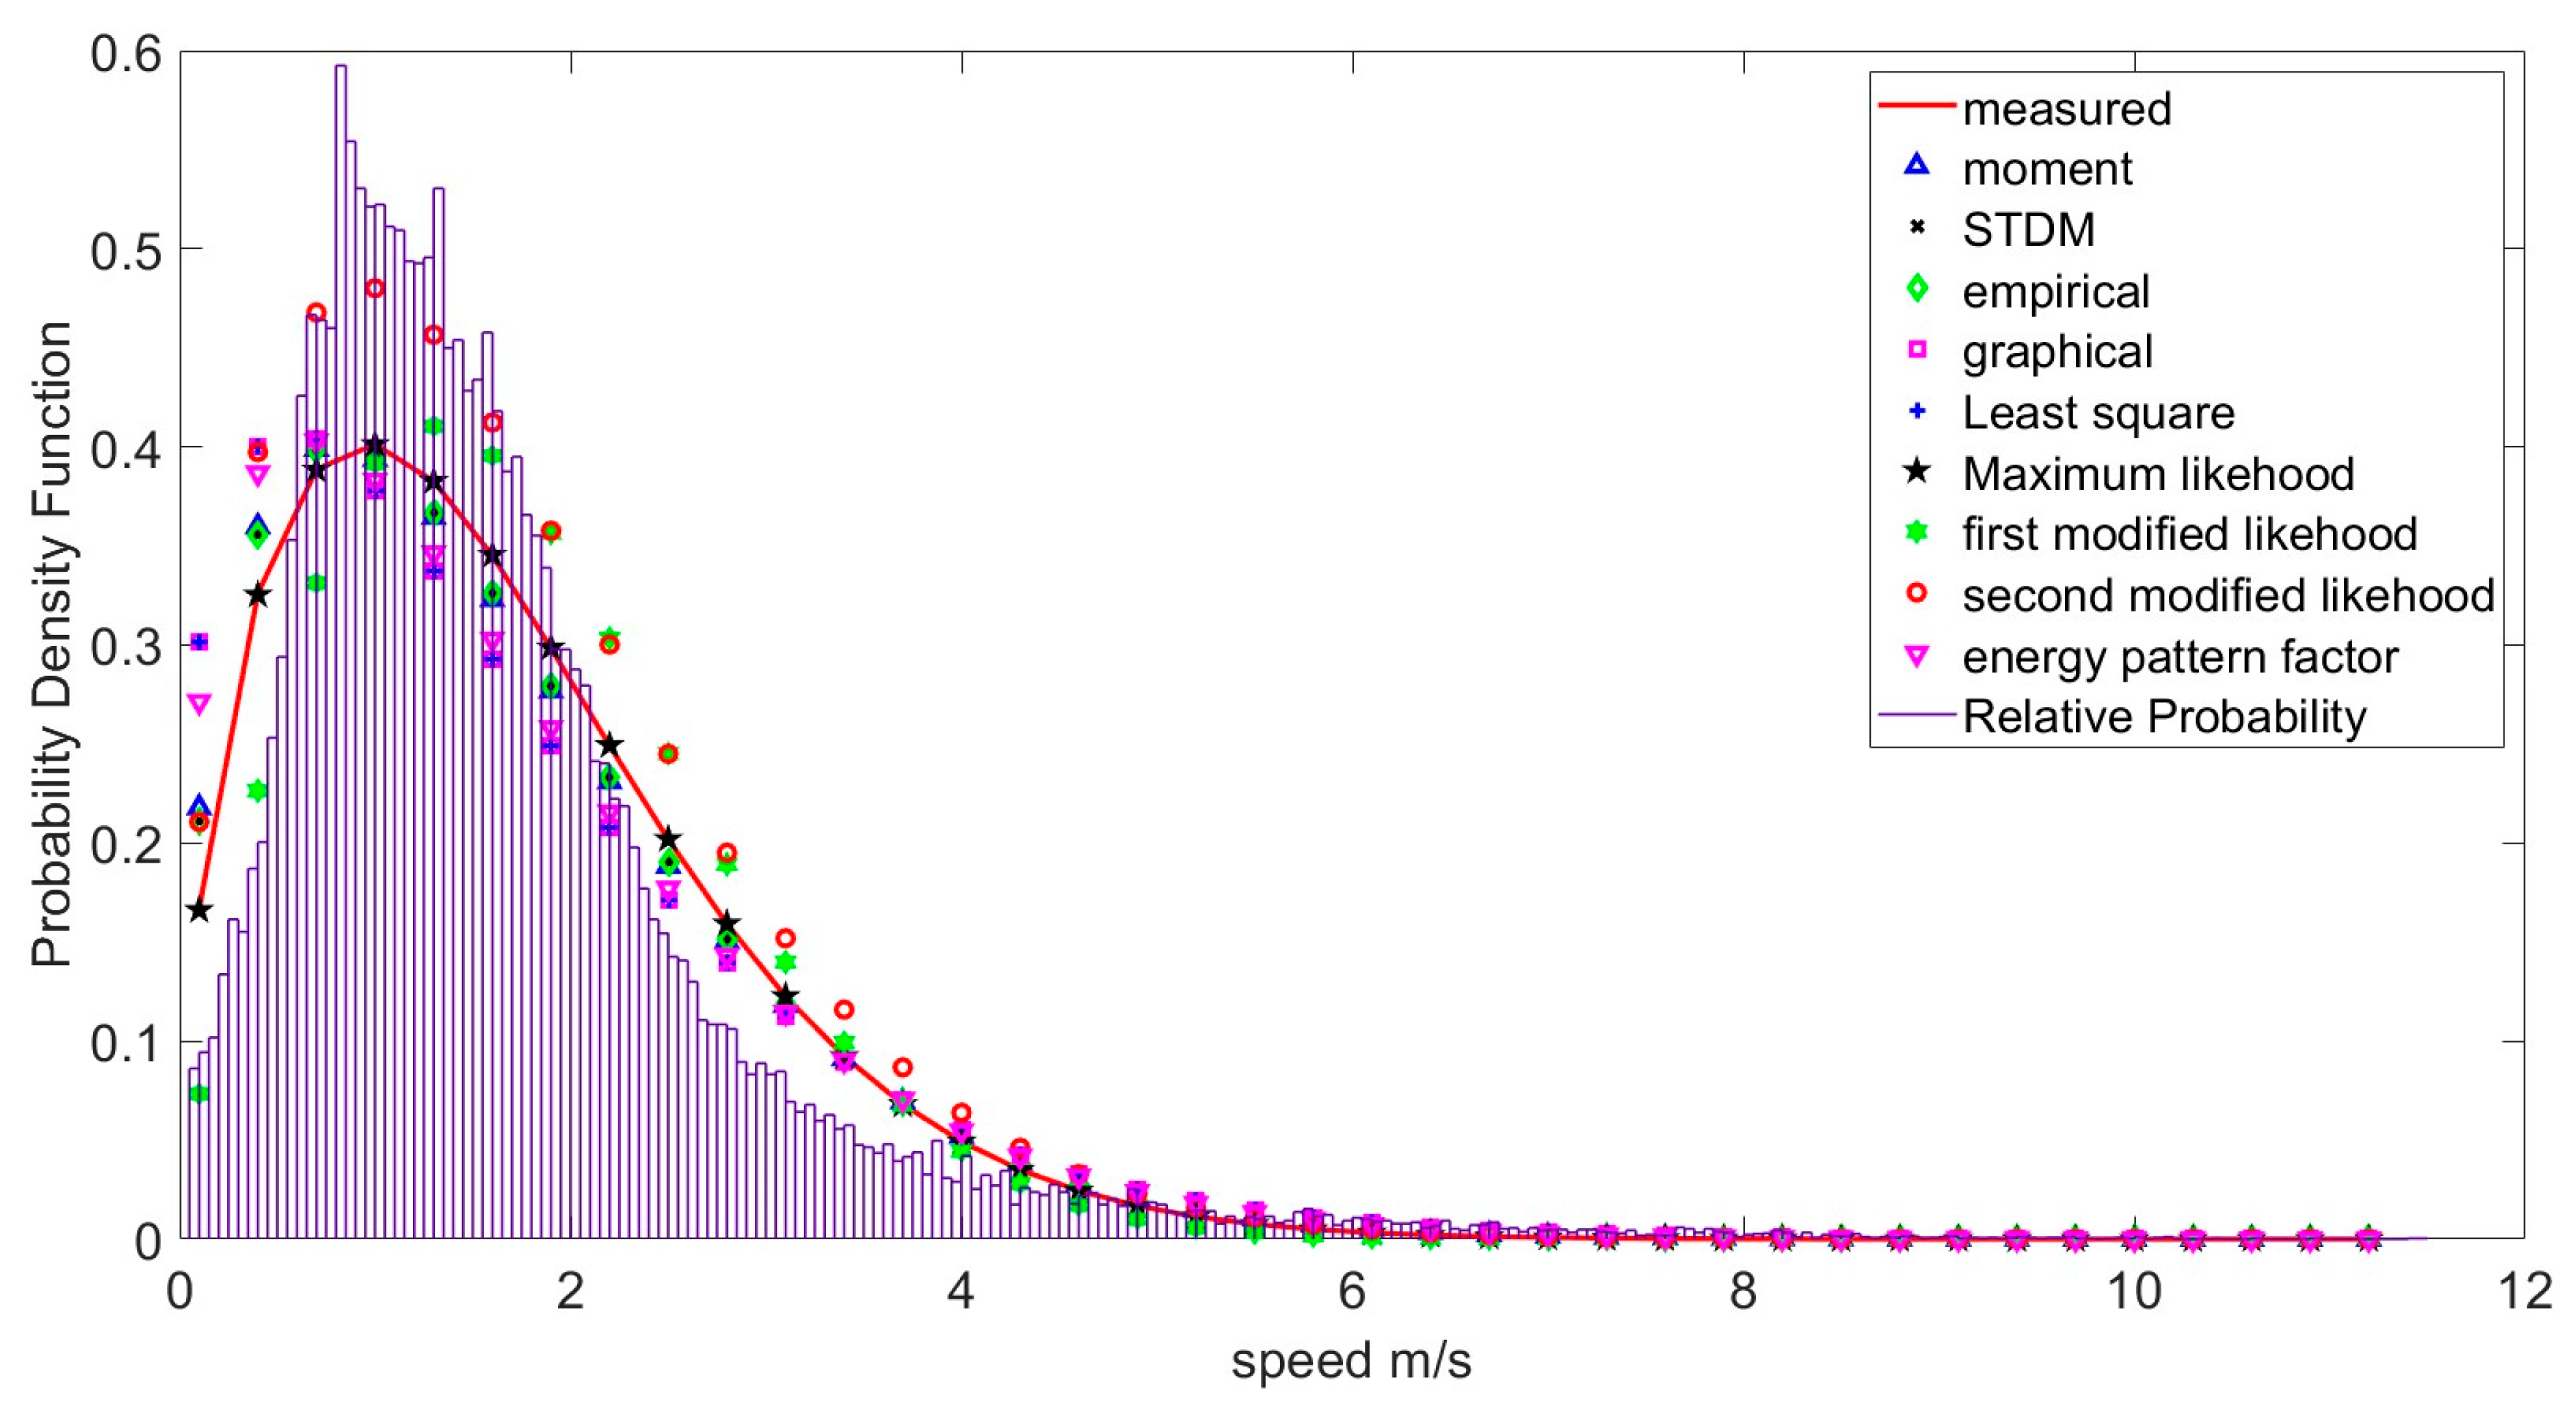
Figure 32 present the PDF and CDF for the six cities under study. The red solid line represents the Weibull distribution derived from the measured mean wind speed.
Figure 21,
Figure 23,
Figure 25,
Figure 27,
Figure 29 and
Figure 31 illustrate the Weibull distribution PDFs of the frequencies of mean wind speed, calculated on an hourly basis over all years considered in this study. Statistical analysis indicates that the mean wind speed ranges from 0.5 to 2.5 m/s for Tulkarm, Nablus, Jericho, Jenin, and Bethlehem, while Ramallah exhibits a wider range of 0.5 to 4 m/s. Over the seven-year period, Ramallah recorded the highest wind speeds among the six cities.
Figure 22,
Figure 24,
Figure 26,
Figure 28,
Figure 30 and
Figure 32 present the CDFs simulated for all six cities in the West Bank. The CDFs provide a clear understanding of the probability of wind speeds not exceeding a given value, which is particularly useful for assessing wind energy potential, designing wind turbines, and optimizing energy production.
Figure 21 and
Figure 31 show the best Weibull fitting curves for Tulkarm and Ramallah. In these figures, the measured Weibull curves closely align with EPF, MLM, FMLM, EM, STDM, and MM, which exhibit the highest fitting accuracy and overall efficiency, followed by SMMLH.
As shown in
Figure 25 and
Figure 27, the measured Weibull curves in Jenin and Jericho closely match MLM, EPF, MM, STDM, and EM, which are identified as the most efficient methods based on the wind data series for these cities. In contrast, FMLM exhibits lower efficiency compared to the other methods.
In Nablus, as illustrated in
Figure 23, the measured Weibull curve exhibits strong concordance with EPF, MLM, SMLM, MM, EM, and FMLM, indicating the most accurate representation of the wind speed data.
In Bethlehem, the measured Weibull curve coincides with MLM, indicating the highest efficiency, followed by EM and STDM. Meanwhile, the EPF curve exhibits lower efficiency compared to GM and FMLM, whereas SMLM demonstrates the lowest performance.
MM, STDM, EM, MLM, SMLM, FMLM, and EPF demonstrate the highest conformity with the CDFs for Ramallah, Nablus, and Tulkarm, as depicted in
Figure 22,
Figure 24 and
Figure 32.
In Jericho and Jenin (
Figure 26 and
Figure 28), MM, STDM, EM, MLM, SMLM, and EPF demonstrate the highest efficiency, followed by FMLM, while GM and LMS exhibit the lowest performance.
In Bethlehem (
Figure 30), GM, LSM, STDM, MM, EM, SMLM, and EPF exhibit similar CDF fits with high efficiency, followed by FMLM.
It is important to note that all curves represent the CDFs derived from the mean wind speed data for the six cities. Based on the CDF analysis, STDM, MM, EM, SMLM, and EPF demonstrate the highest efficiency, closely matching the measured CDFs, followed by FMLM. In contrast, GM and LMS exhibit the lowest efficiency in Ramallah, Nablus, Tulkarm, Jericho, and Jenin.
3.6. Weibull Parameters Values
The Weibull parameter values were estimated using nine numerical approaches for six cities based on the mean wind speed data. The scale factor values ranged from 1.16 to 2 m/s in all sites except for Ramallah city, where the scale factor range was 2.8 to 3.3 m/s.
Figure 33 displays the scale factor of the mean wind speed for six cities using nine numerical methods. The maximum scale factor was observed in Ramallah city, with a range of values from 2.7 m/s to 3.2 m/s. In Jenin city, the scale factor was approximately 2 m/s. Tulkarm, Bethlehem, and Nablus showed fluctuating scale factor values ranging from 1.8 m/s to 1.6 m/s. Jericho city had the lowest scale factor value, consistently less than 1.4 m/s for all months.
Figure 34 illustrates the shape factor values according to nine numerical approaches. It can be observed that the shape factor is around 1.96 for Ramallah and Nablus. In Jericho and Jenin, the shape factor value is about 1.5 based on the measured PDF, EM, EPF, MLM, SMLM, and MM, while it is less than 1.5 according to GM and LMS.
The shape factor value of Bethlehem fluctuated from 1.84 according to FMLM to a minimum value of 1.29 according to LMS and GM. Tulkarm city’s shape factor value was around 1.7 according to all numerical techniques except GM and LMS, which were less than 1.4. The numerical approaches indicate that the shape factor values were between 1.3 and 2, suggesting a Weibull curve, as shown in the figures above. In six cities in the West Bank, the scale factor and shape factor values were determined to be 3.21–1.16 m/s and 1.96–1.27, respectively.
Ramallah city exhibits the highest wind energy potential, followed by Jenin, based on the mean wind speed compared to the other cities. Tulkarm, Jericho, and Nablus show the lowest wind energy potential on a monthly basis, except for October. In conclusion, wind power density values were the highest in October and March, while they were lowest in August and September.
3.7. Validation Using Five Statistical Tools
The GOF test was used to calculate the percentage of errors in the numerical analysis.
Table 3 displays five statistical tools that were applied to assess the efficiency of the numerical analysis. MLM demonstrated the highest efficiency performance among the statistical tools, followed by MM, EPF, EM, and MLM. On the other hand, SMMLM and LSM exhibited the lowest efficiency performance. The numerical analysis was ranked based on the percentage of errors, as shown in
Table 4.
3.8. Wind Power Density Calculation in Ramallah City
For the evaluation of the methodology’s reliability, the wind power density in the West Bank region was analyzed to estimate the wind energy potential per square meter of a wind turbine. In this analysis, it was found that the wind speed in Ramallah city was higher than in other cities. Therefore, Ramallah city was chosen for the power density and energy calculation per unit area. The energy production from a wind generator is crucial for determining economic feasibility [
13,
127]. The power extracted from wind energy can be estimated using the following equations [
128,
129,
130]:
where
: power coefficient,
ρ: Air density,
: Swept area,
the mean wind speed,
λ: the tip speed ratio,
β: pitch angle of the wind turbine,
: radius of rotor blade.
The maximum value of the power coefficient is around 0.593 according to the Betz law, which is considered a theoretical value [
131,
132,
133].
In practical applications, the power coefficient typically ranges between 25% and 45% [
134].
Figure 35 illustrates the annual estimated wind energy (in kW) per unit area. According to the figure, Ramallah city has the highest estimated energy due to favorable wind speed characteristics. The energy estimated in Ramallah city ranges from 110 to 250 kWh/m
2 per square meter, which is considered feasible for wind power energy generation. In contrast, Jericho exhibits the lowest wind energy potential due to its relatively low wind speeds.
According to Equation (25), the mean wind speed is cubically proportional to the output power; thus, the mean wind speed is essential for wind power production. The figure shows that Ramallah city has the best fitting curve for wind energy production, followed by Jenin and Nablus, whereas the lowest energy estimation is in Tulkarm and Jericho due to the lower wind speed. The average annual wind energy production in the targeted cities is as follows: Ramallah—123 kWh/m2, Bethlehem—24.42 kWh/m2, Jenin—31.12 kWh/m2, Nablus—22 kWh/m2, Tulkarm—15.5 kWh/m2, and Jericho—10.36 kWh/m2.
Table 5 shows the wind speed ranges for Ramallah city. The mean wind speed (μ) was calculated for each range. The wind speed ranges were counted on an hourly basis using six years of wind speed data. The percentage of occurrence was estimated by dividing the number of hours in each range by the total number of hours of data collection. The power per unit area (i.e., incident power density) was calculated using Equation (23), with the air density in Ramallah estimated to be on average
ρ = 1.1 kg/m
3 and
A = 1 m
2. The weighted power density was calculated by multiplying the power by the occurrence percentage (%). The energy was calculated in kWh/m
2 by multiplying the output power by the total number of hours in each wind speed frequency on an annual basis. As per
Table 5, the wind power density per unit area on an annual basis is 3077 W/m
2. Theoretically, the amount of energy per unit area (Energy Density) on an annual basis is 269.55 kWh/m
2/year.
Figure 36 displays the monthly iteration of the mean wind speed for Ramallah city. It is evident that the frequency of the mean wind speed follows a Weibull distribution. The peak of the frequency curve is at 3 m/s.
Figure 37 illustrates the wind power density in Ramallah city over a six-year period, based on daily measurements. The power density was calculated by multiplying the percentage frequency of the mean wind speed by the corresponding wind power per unit area. The figure indicates that the highest wind power density occurred when the mean wind speed ranged from 5 to 6 m/s. Furthermore, a notable increase in wind potential is observed at wind speeds with higher frequency occurrences, highlighting optimal conditions for wind energy generation.
Figure 38 illustrates the output energy per square meter for Ramallah city. It can be observed that the energy reached its peak value at 68.93 kWh/m
2 at 5.1 m/s. Comparing
Figure 38 and
Figure 37, it is evident that the energy curve behavior follows the power density and the frequency of the mean wind speed due to the cubically proportional relationship between power and the mean wind speed.
5. Conclusions
This research estimates the wind energy potential in Palestine by analyzing daily wind speed data from 2015 to 2021 in six cities: Bethlehem, Jericho, Jenin, Nablus, Ramallah, and Tulkarm. Nine numerical methods, including the MLM and EPF, were used to determine the parameters of Weibull for low wind speeds (mean: 1.8 m/s), resulting in shape factors ranging from 1.27 to 1.96 and scale factors from 1.16 to 3.21 m/s.
The comparative study of numerical methods provides energy planners with the tools to select the most accurate and cost-effective methods for evaluating wind resources. In areas characterized by moderate wind potential, it is vital for policymakers to promote small-scale wind energy projects.
Five statistical tools, along with RMSE and X2, were used to validate the parameters of Weibull and to check the efficiency performance of the numerical technique. The wind energy potential was evaluated per unit area for each city. Ramallah emerged as the most promising location with an annual energy production potential of 123 kWh/m2 due to its higher mean wind speed (3.37 m/s) and prevailing wind directions (78.6% west, southwest, and northwest). On the other hand, Jericho showed the least promising potential (10.36 kWh/m2), highlighting the site-specific nature of wind resources in Palestine.
An economic feasibility study for Ramallah using a 5 kW horizontal-axis wind turbine indicated a payback period of approximately 11.67 years with minimal maintenance and no subsidies. The research emphasizes the viability of small-scale wind turbines, supported by the analysis of payback period. A simple one-at-a-time sensitivity analysis shows that the payback period can vary between 9.34 and 15.08 years for a ±20% variation in main variables.
The findings presented have significant implications for energy policymakers and stakeholders in Palestine. Recognizing cities with high wind potential, such as Ramallah, emphasizes the importance of prioritizing investments in renewable energy.




 ,
,