
The Impact of the Average Temperature, Humidity, Wind Speed, Altitude, and Population Density on Daily COVID-19 Infection Evolution †


Abstract
:1. Introduction
2. Materials and Methods
- Dependent variables: Daily temperature, Ti; Daily humidity, Hi; Daily wind speed, Wi.
- Independent variables: Altitude, average annual population density.
- ✓ Before the lockdown: Ptotal = Ps + P
- ✓ After the lockdown: Ptotal = Ps
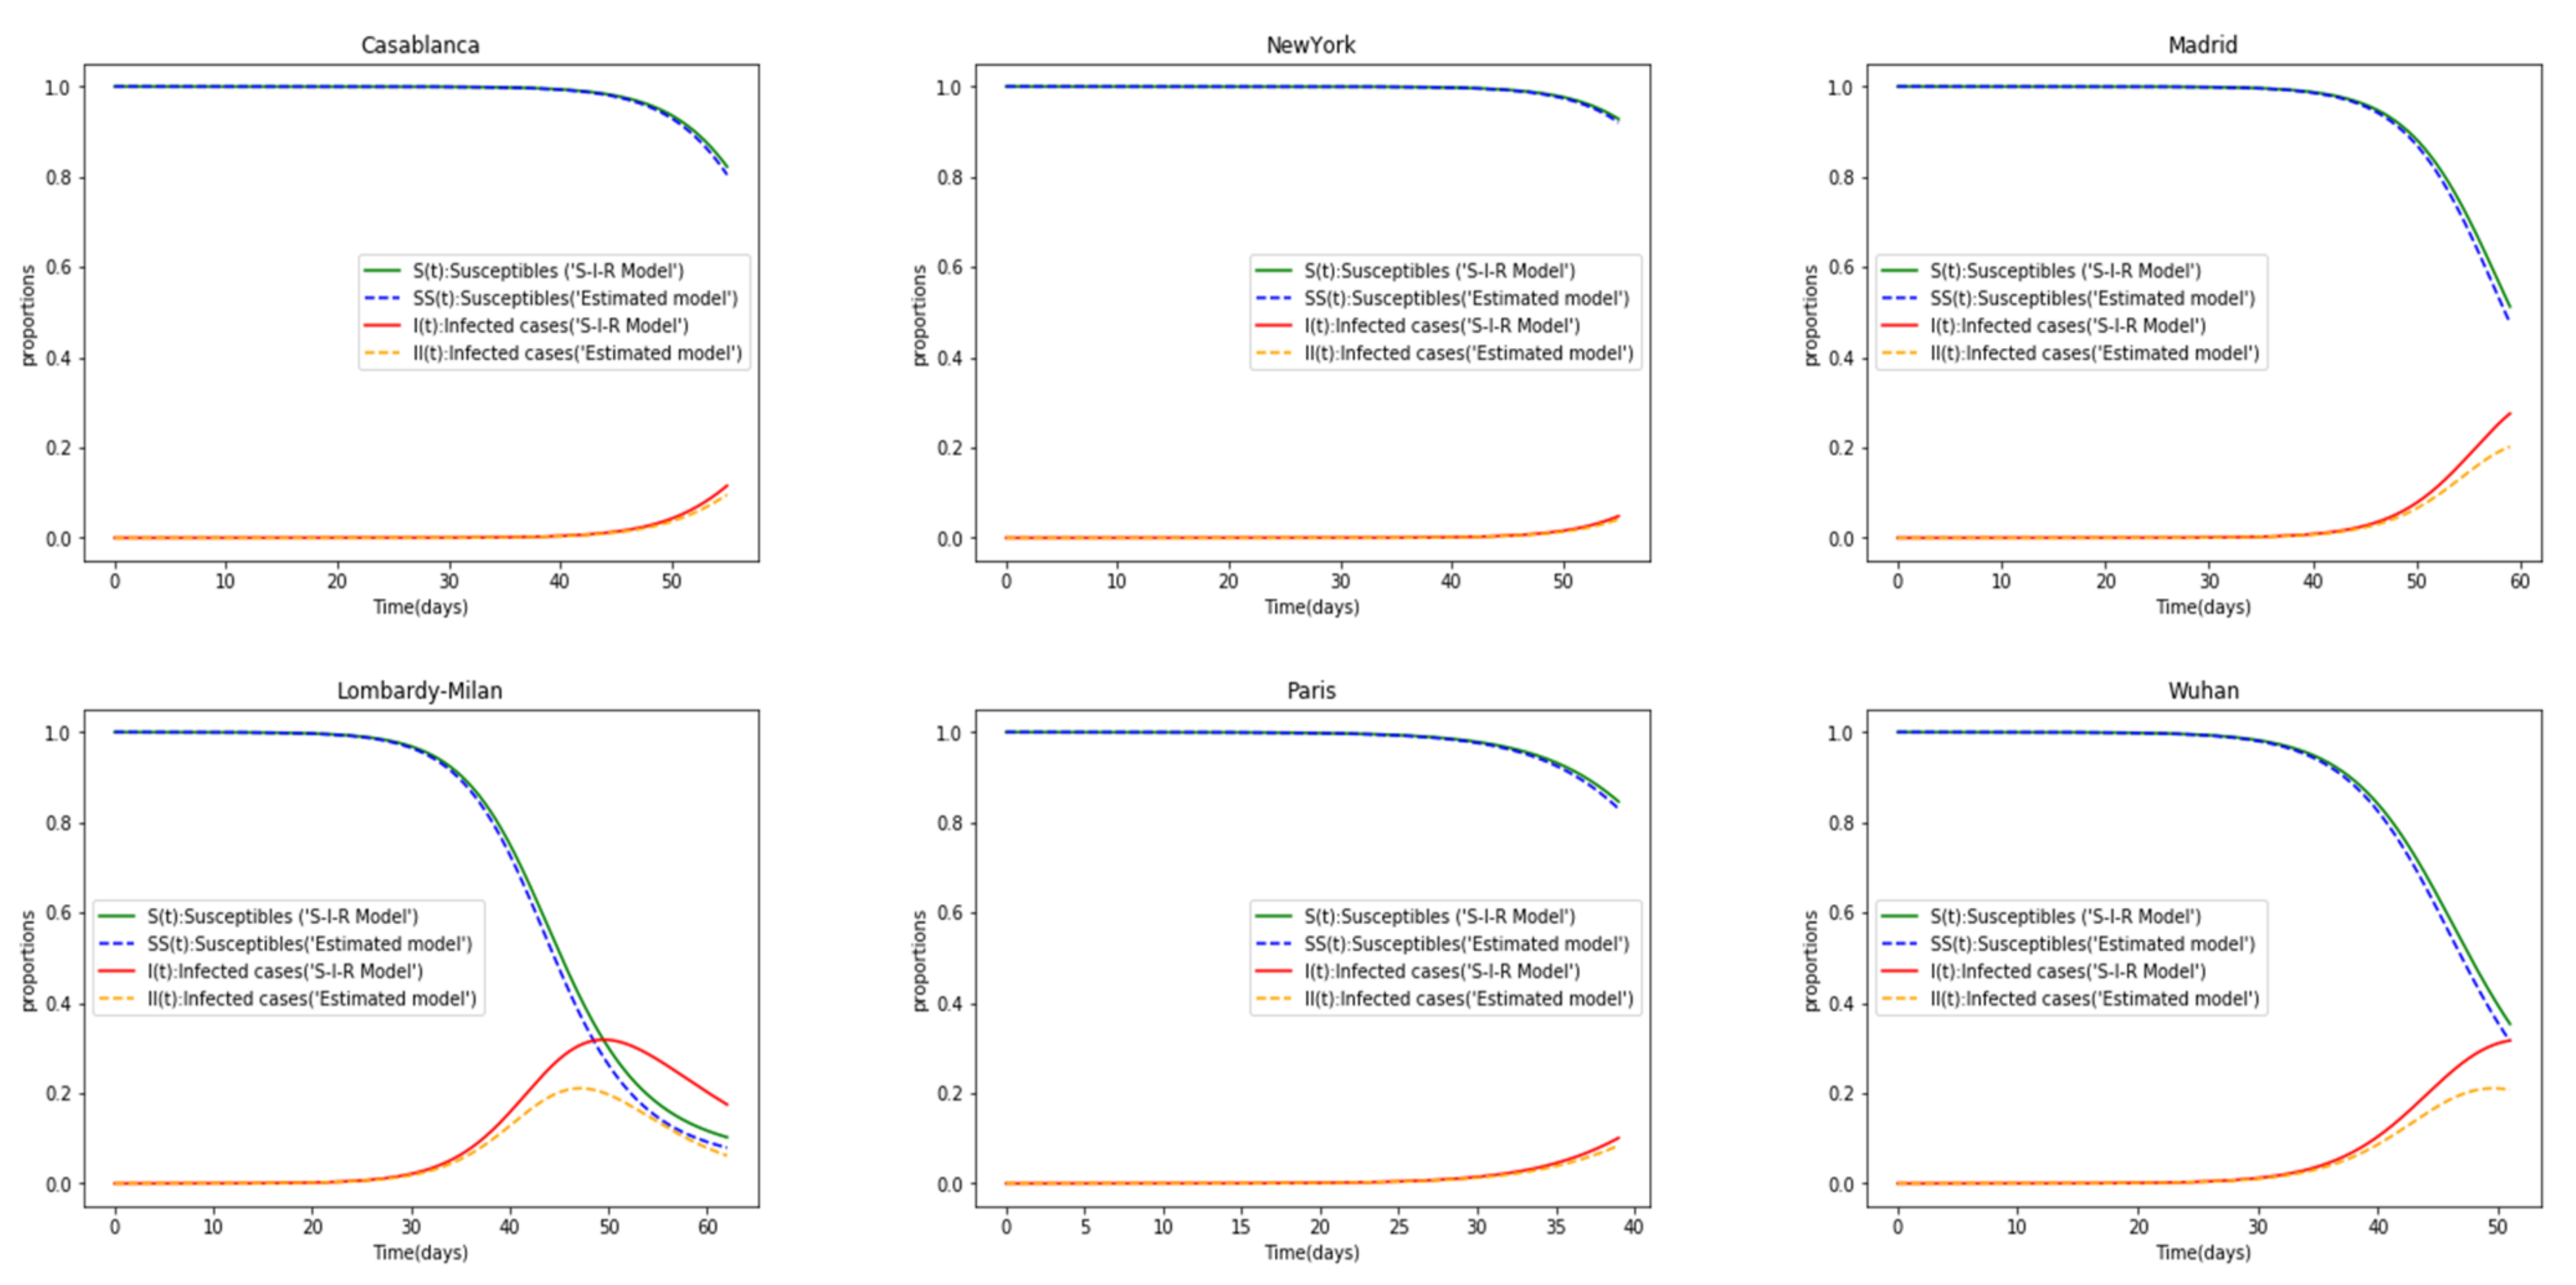
- S(t): Number of susceptibles on day (t).
- I(t): Number of infected cases on day (t).
- R(t): Number of recovered patients on day (t).
- a:
- Expected number of people an infected person infects per day (a ≈ 1/tip).
- b:
- The proportion of recovered patients per day (b = 1/D), while D is the approximate number of days when patient will recover (D = 14 days in our estimations).
- tip:
- The estimated average incubation period (equals 5.75 days in our study) in which an infected patient could infect other susceptible.
3. Results and Discussion
4. Conclusions
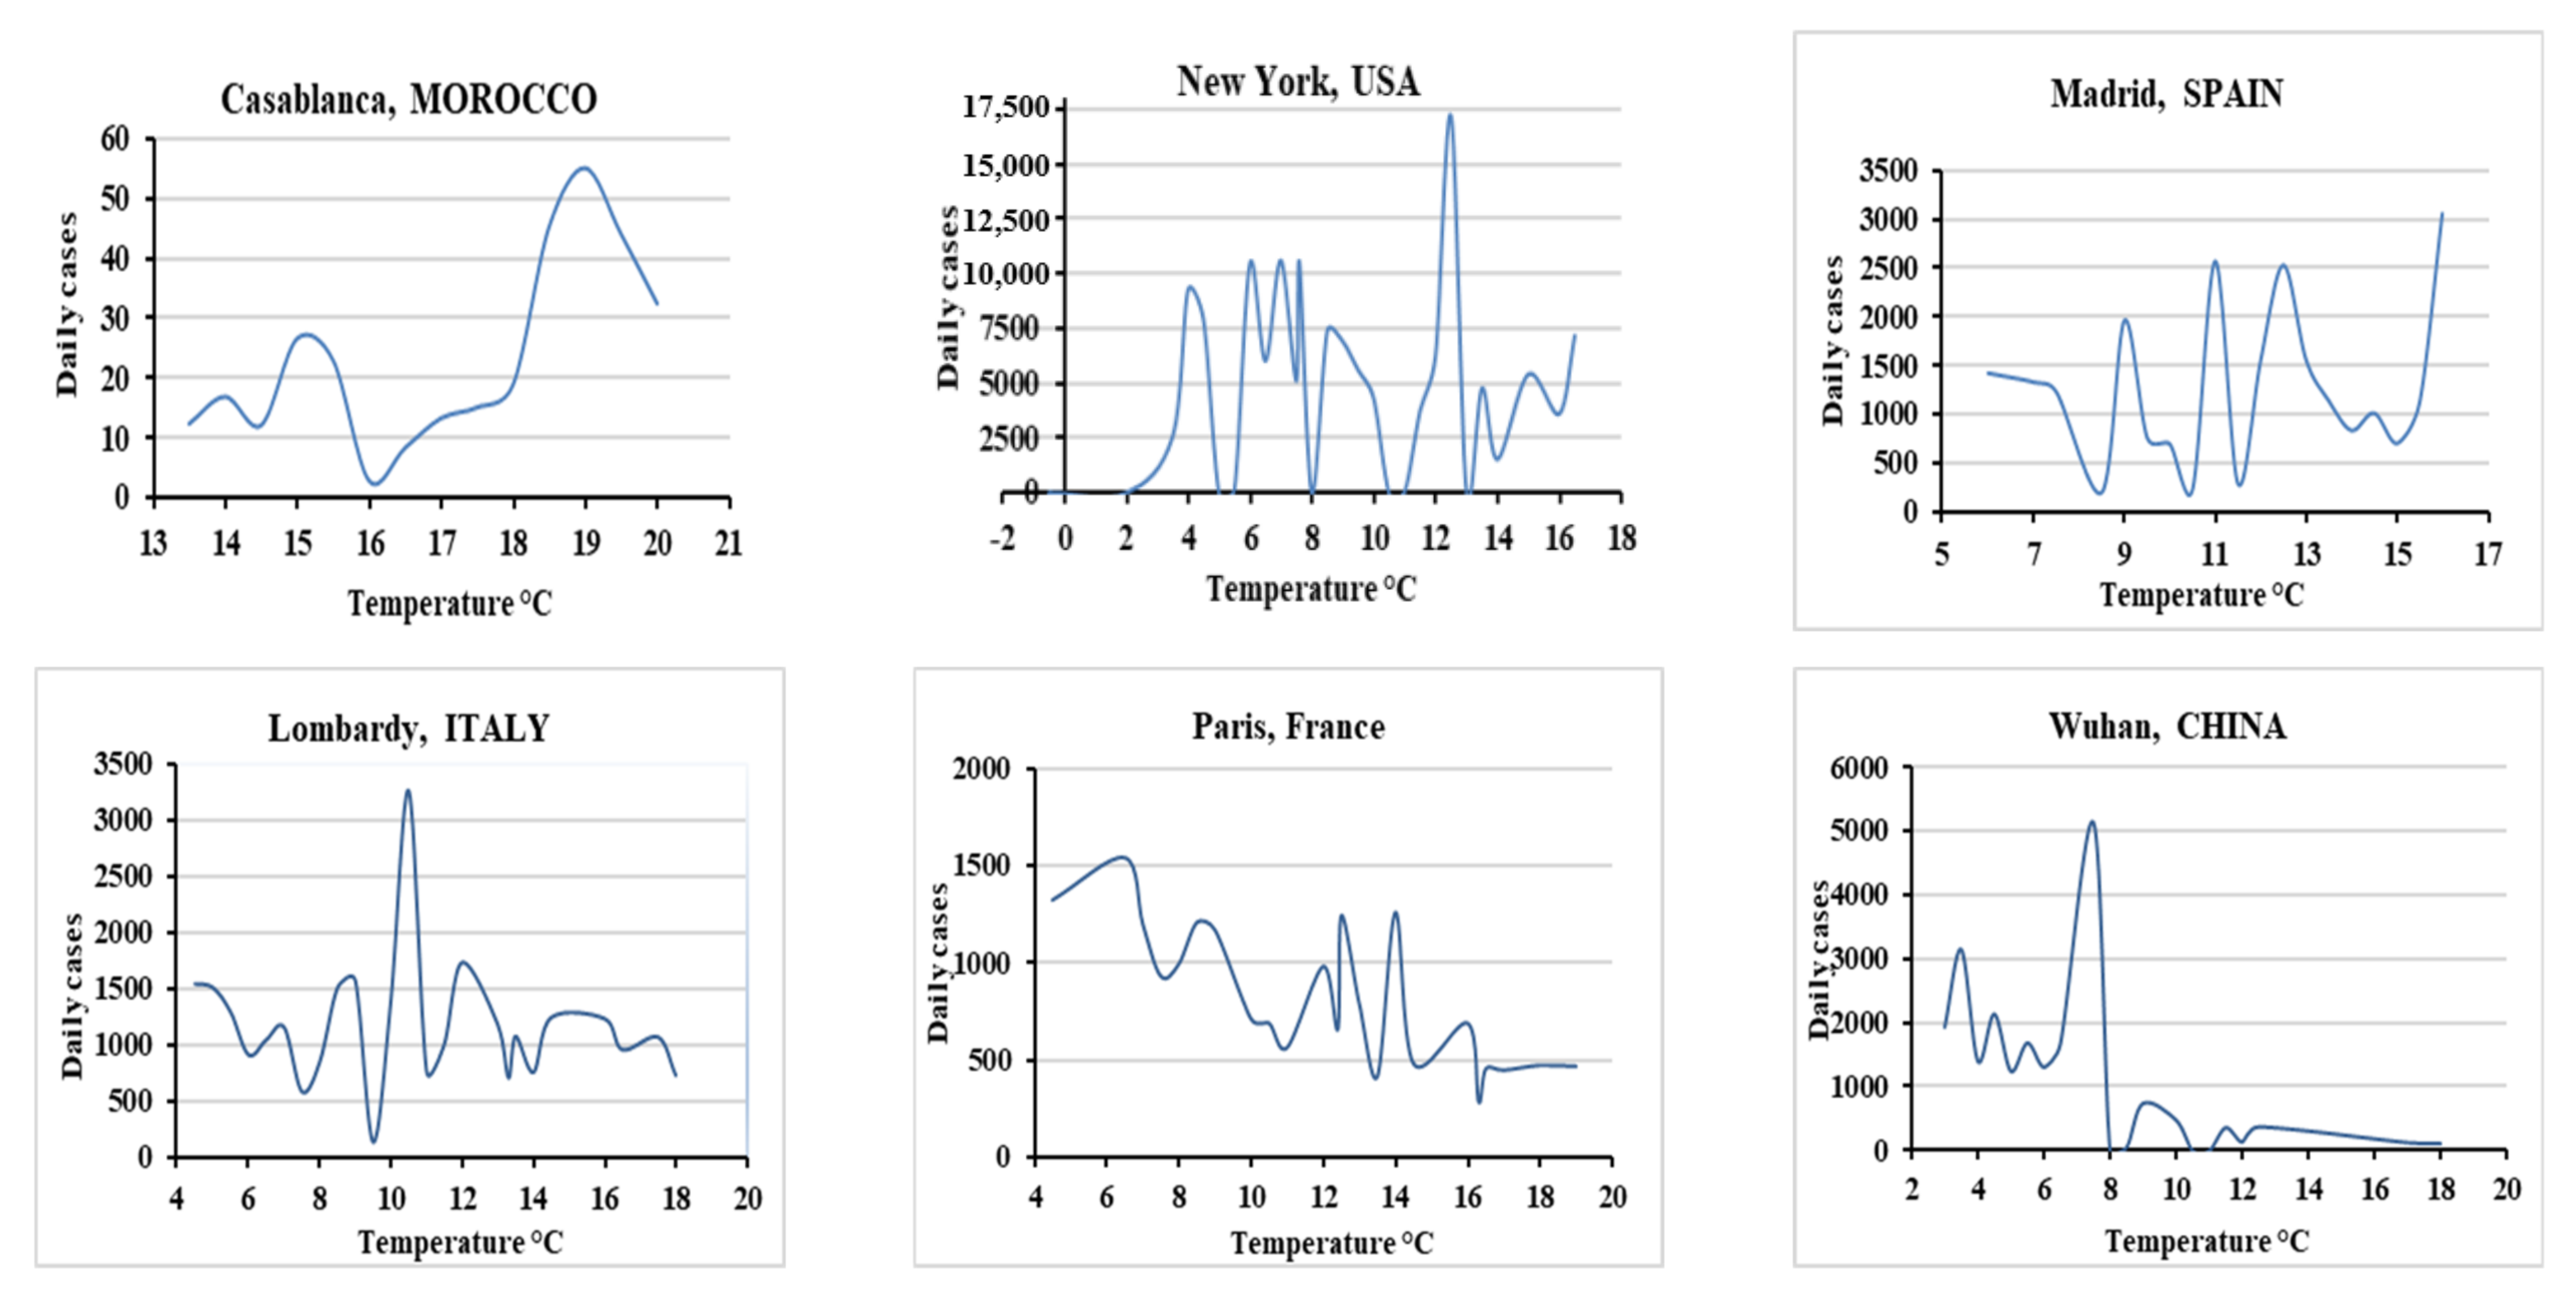
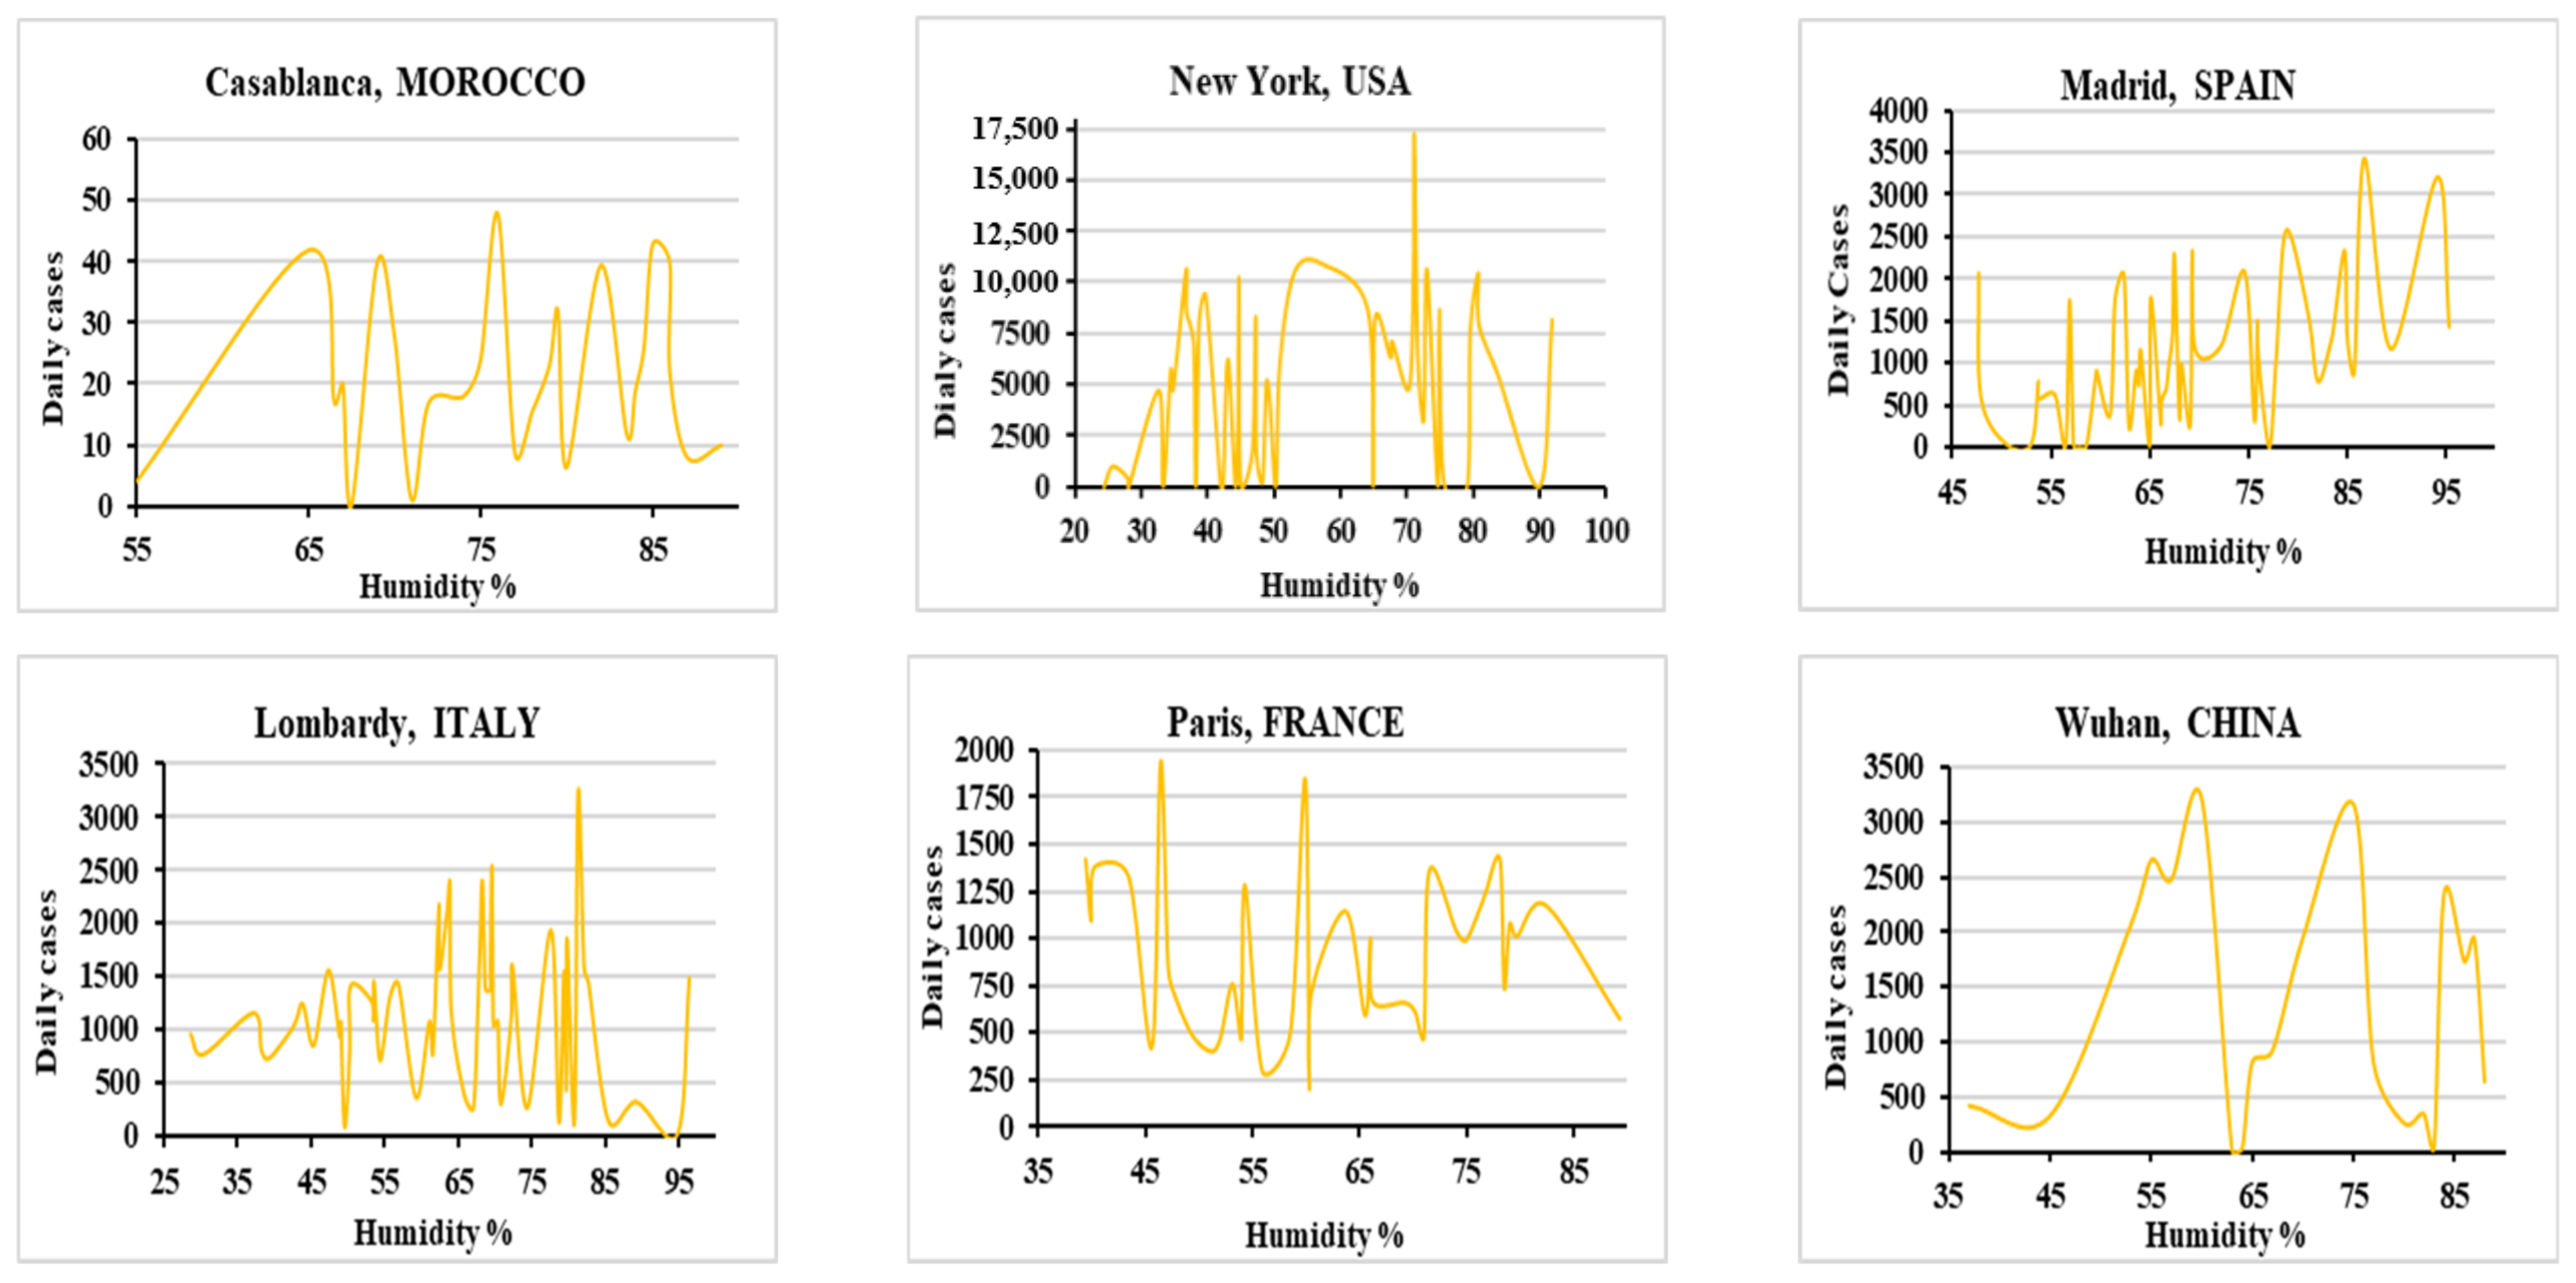
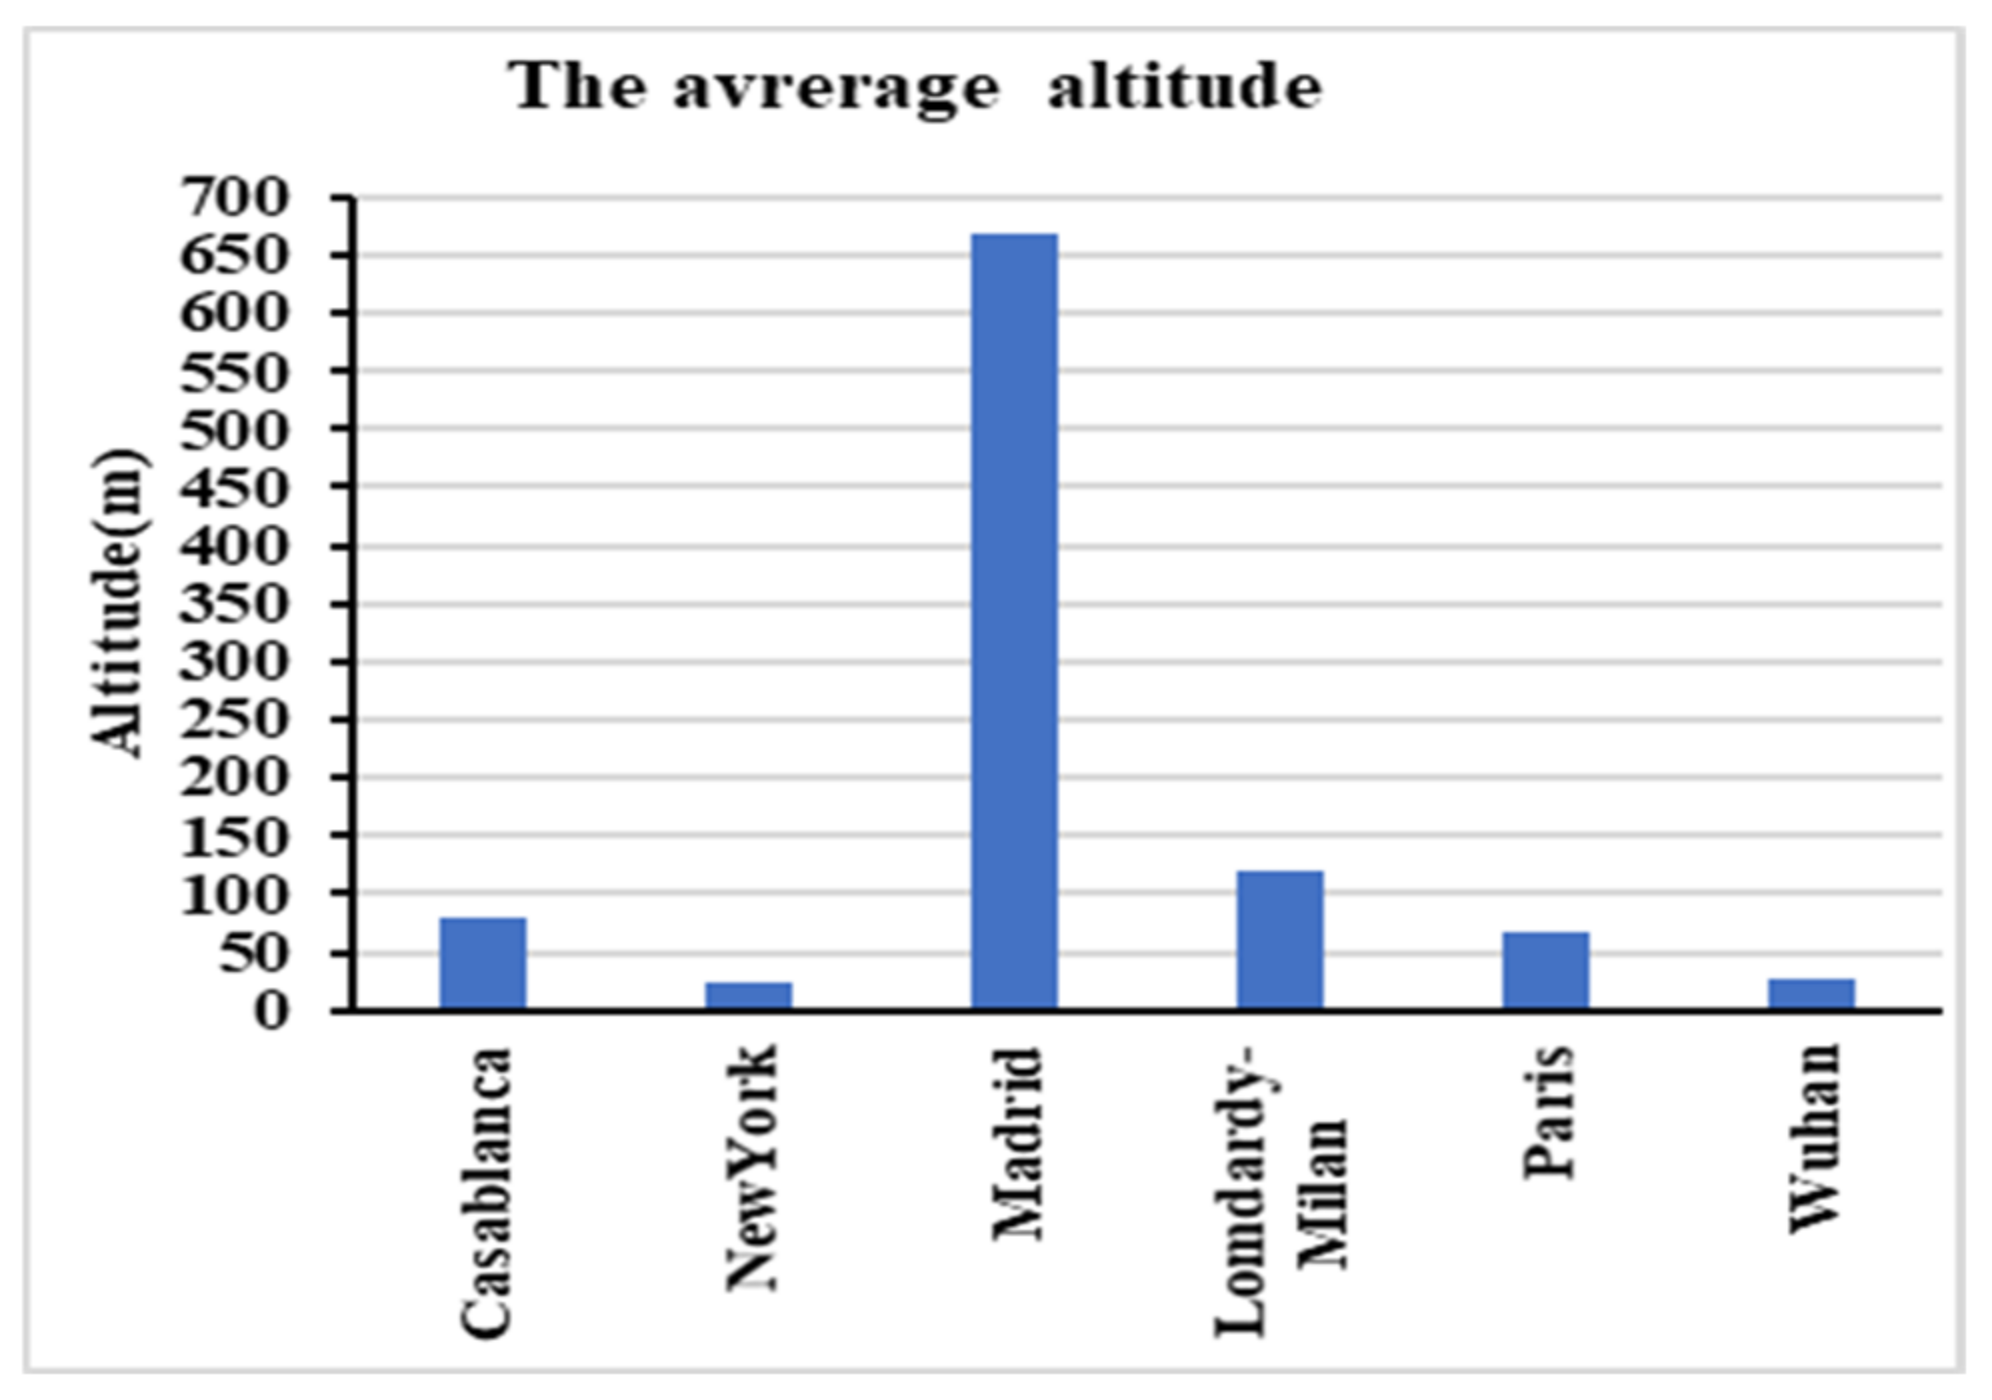
- The temperature, the humidity and the altitude parameters have no impact on daily COVID-19 infection evolution.
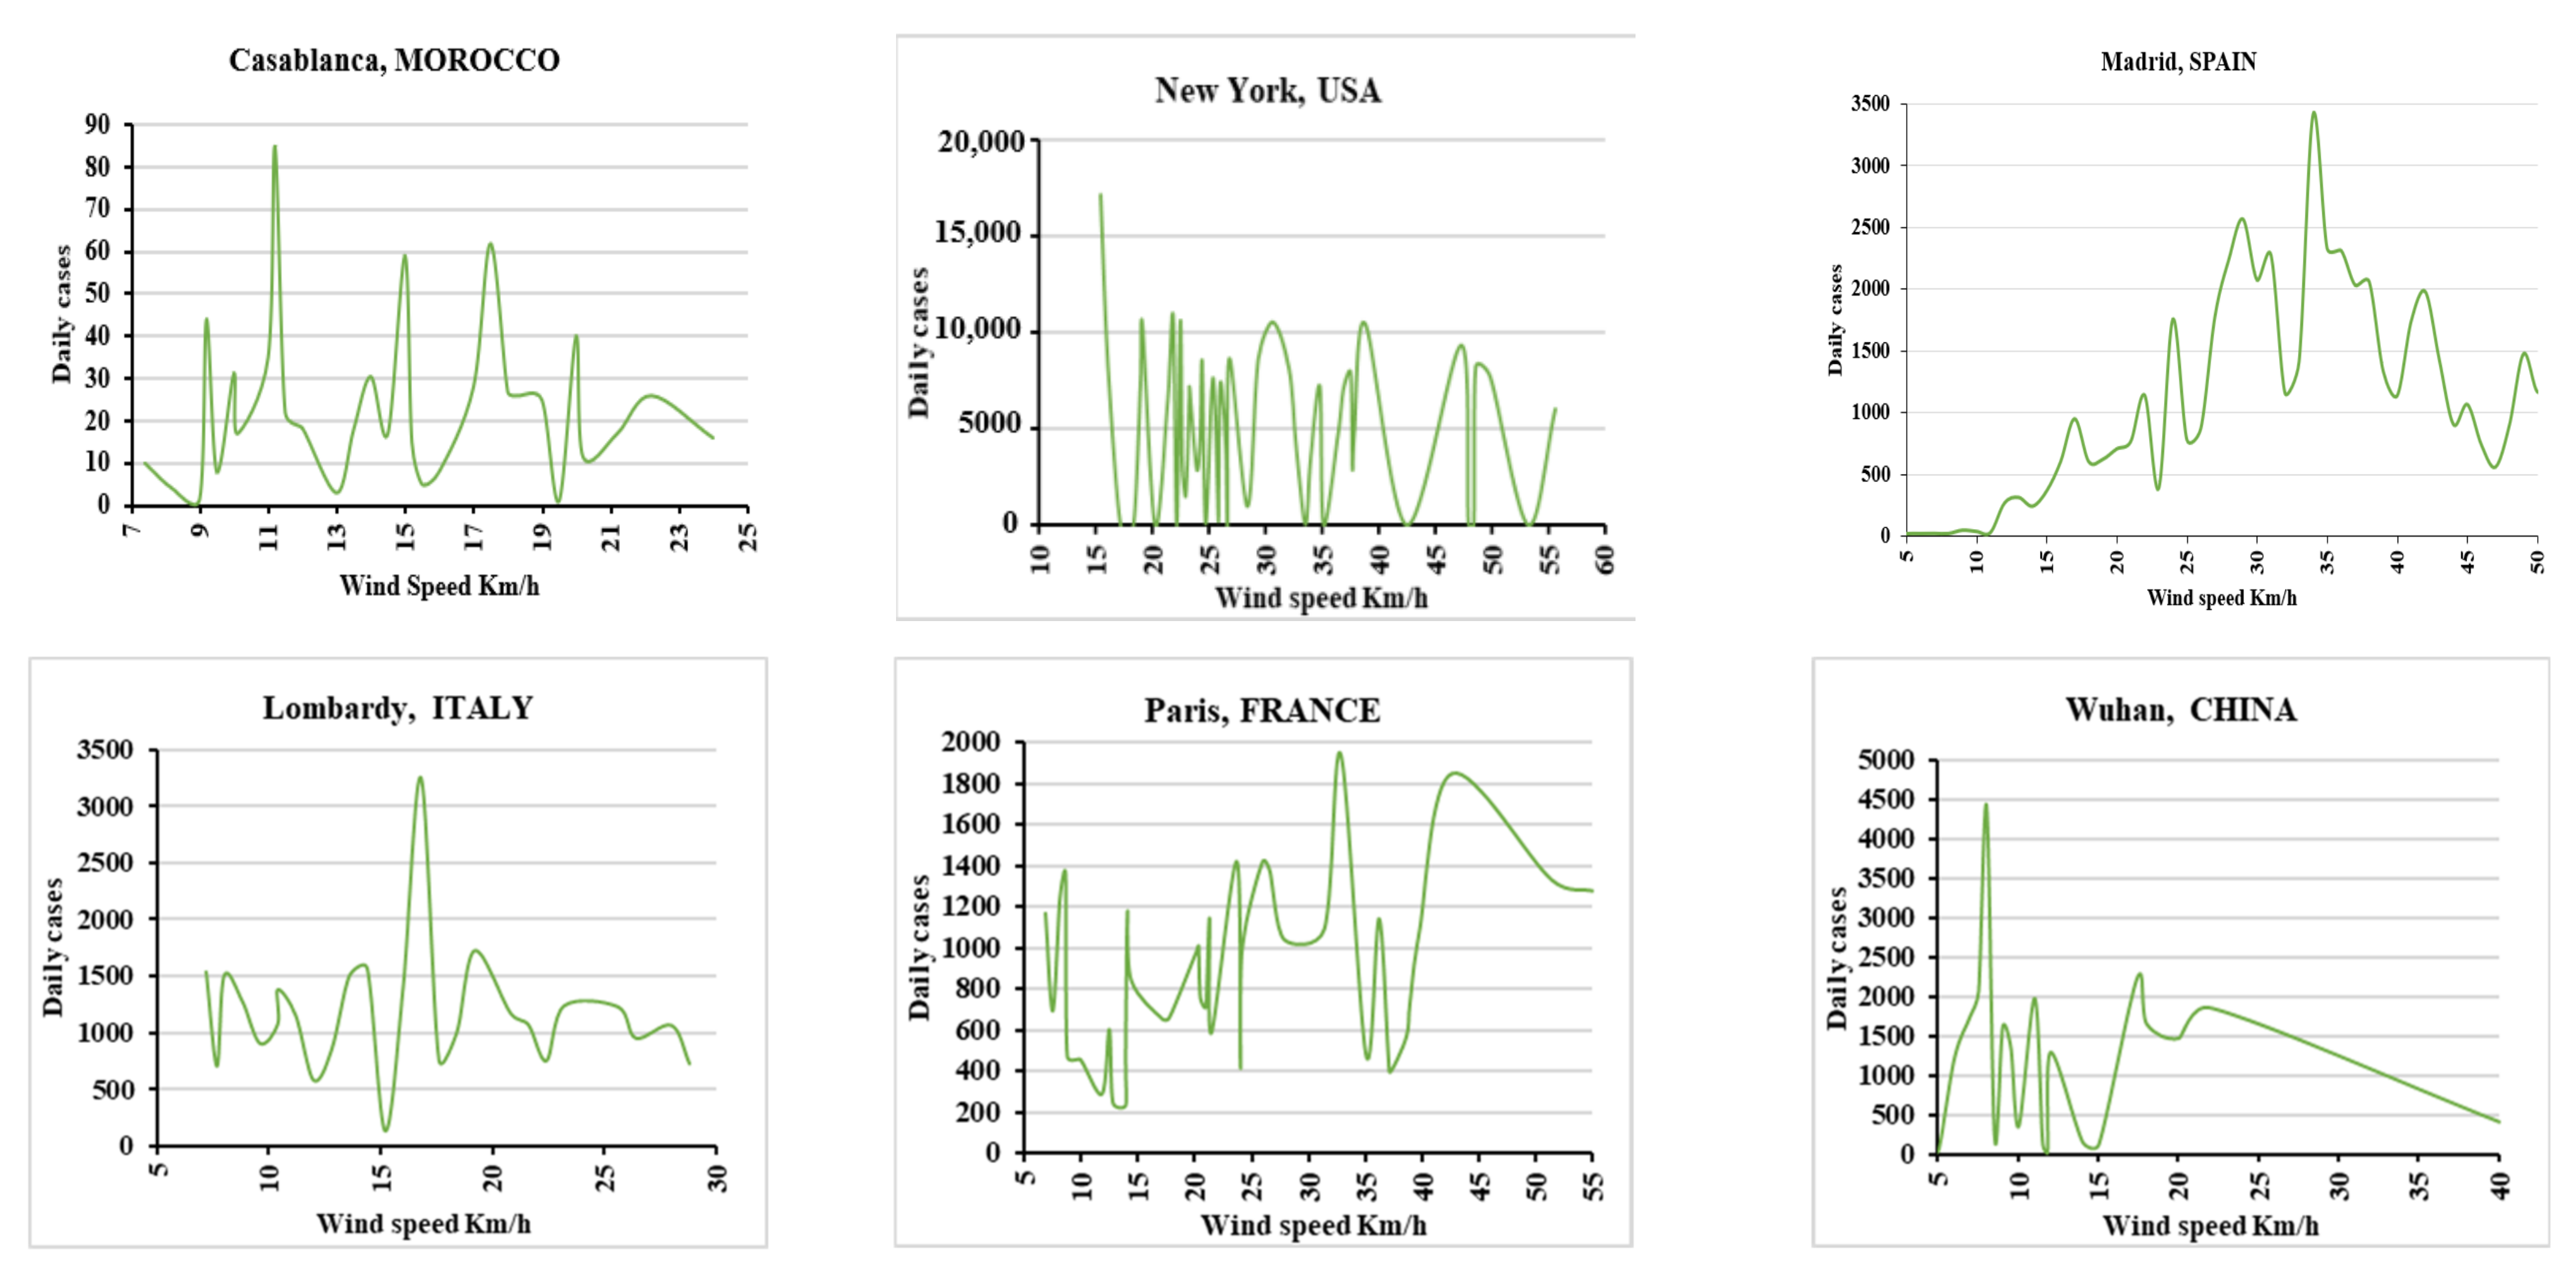
- For an average wind speed of greater than 25 km/h, the number of COVID-19 infections is slightly decreased, with an approximate rate of 10%.
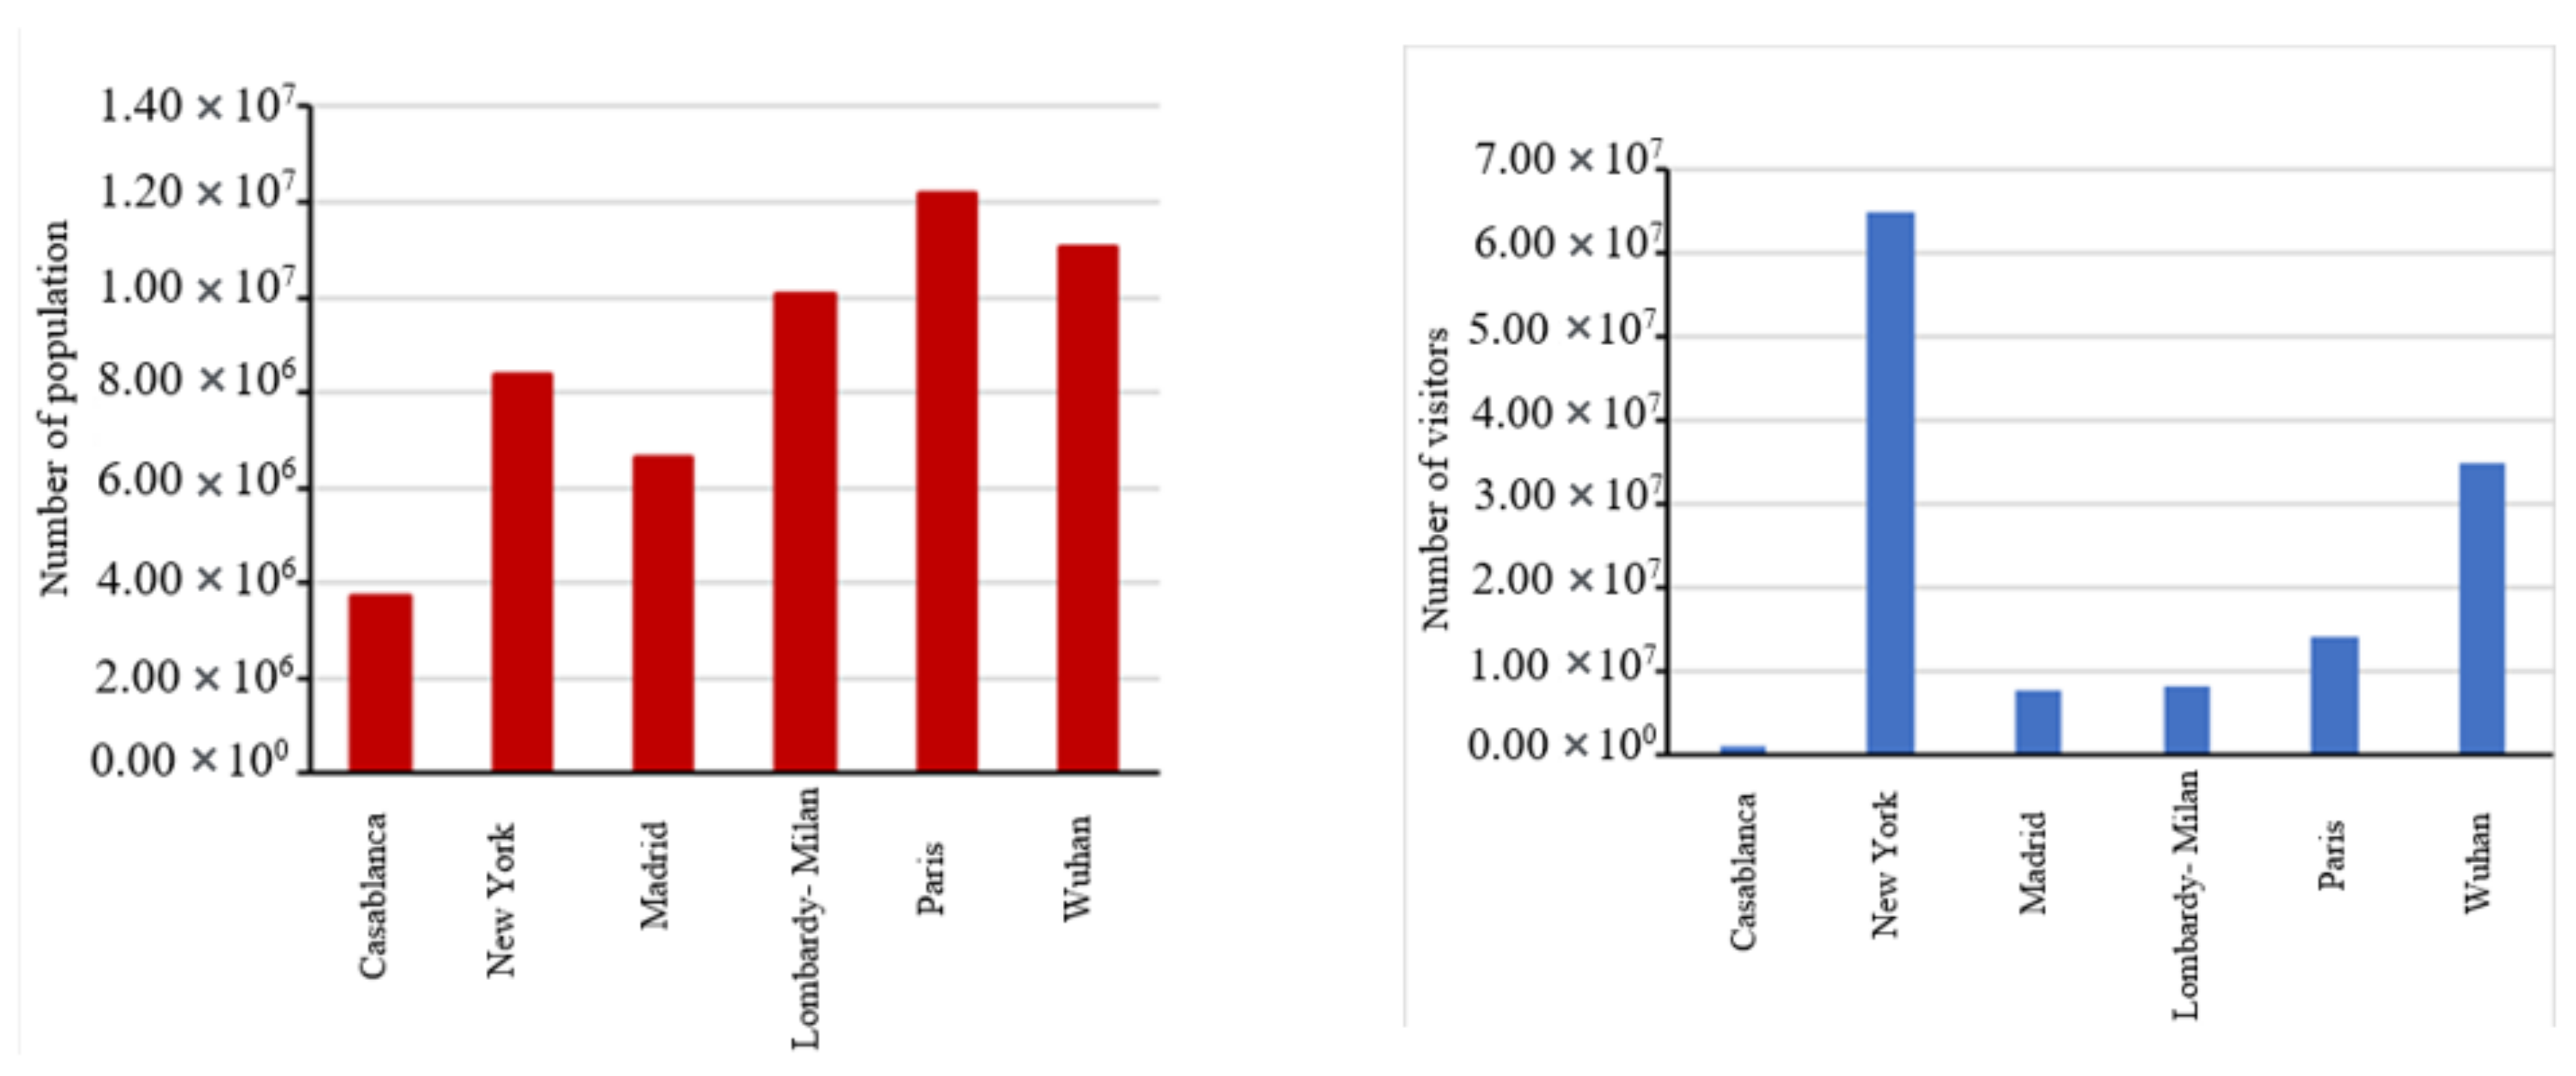
- Population density has a significant impact on the daily COVID-19 spread with a rate of 90%.
Author Contributions
Funding
Institutional Review Board Statement
Informed Consent Statement
Data Availability Statement
Acknowledgments
Conflicts of Interest
Appendix A


| Average Temperature | Average Humidity | Average Wind Speed | ||||
|---|---|---|---|---|---|---|
| Minimal | Maximal | Minimal | Maximal | Minimal | Maximal | |
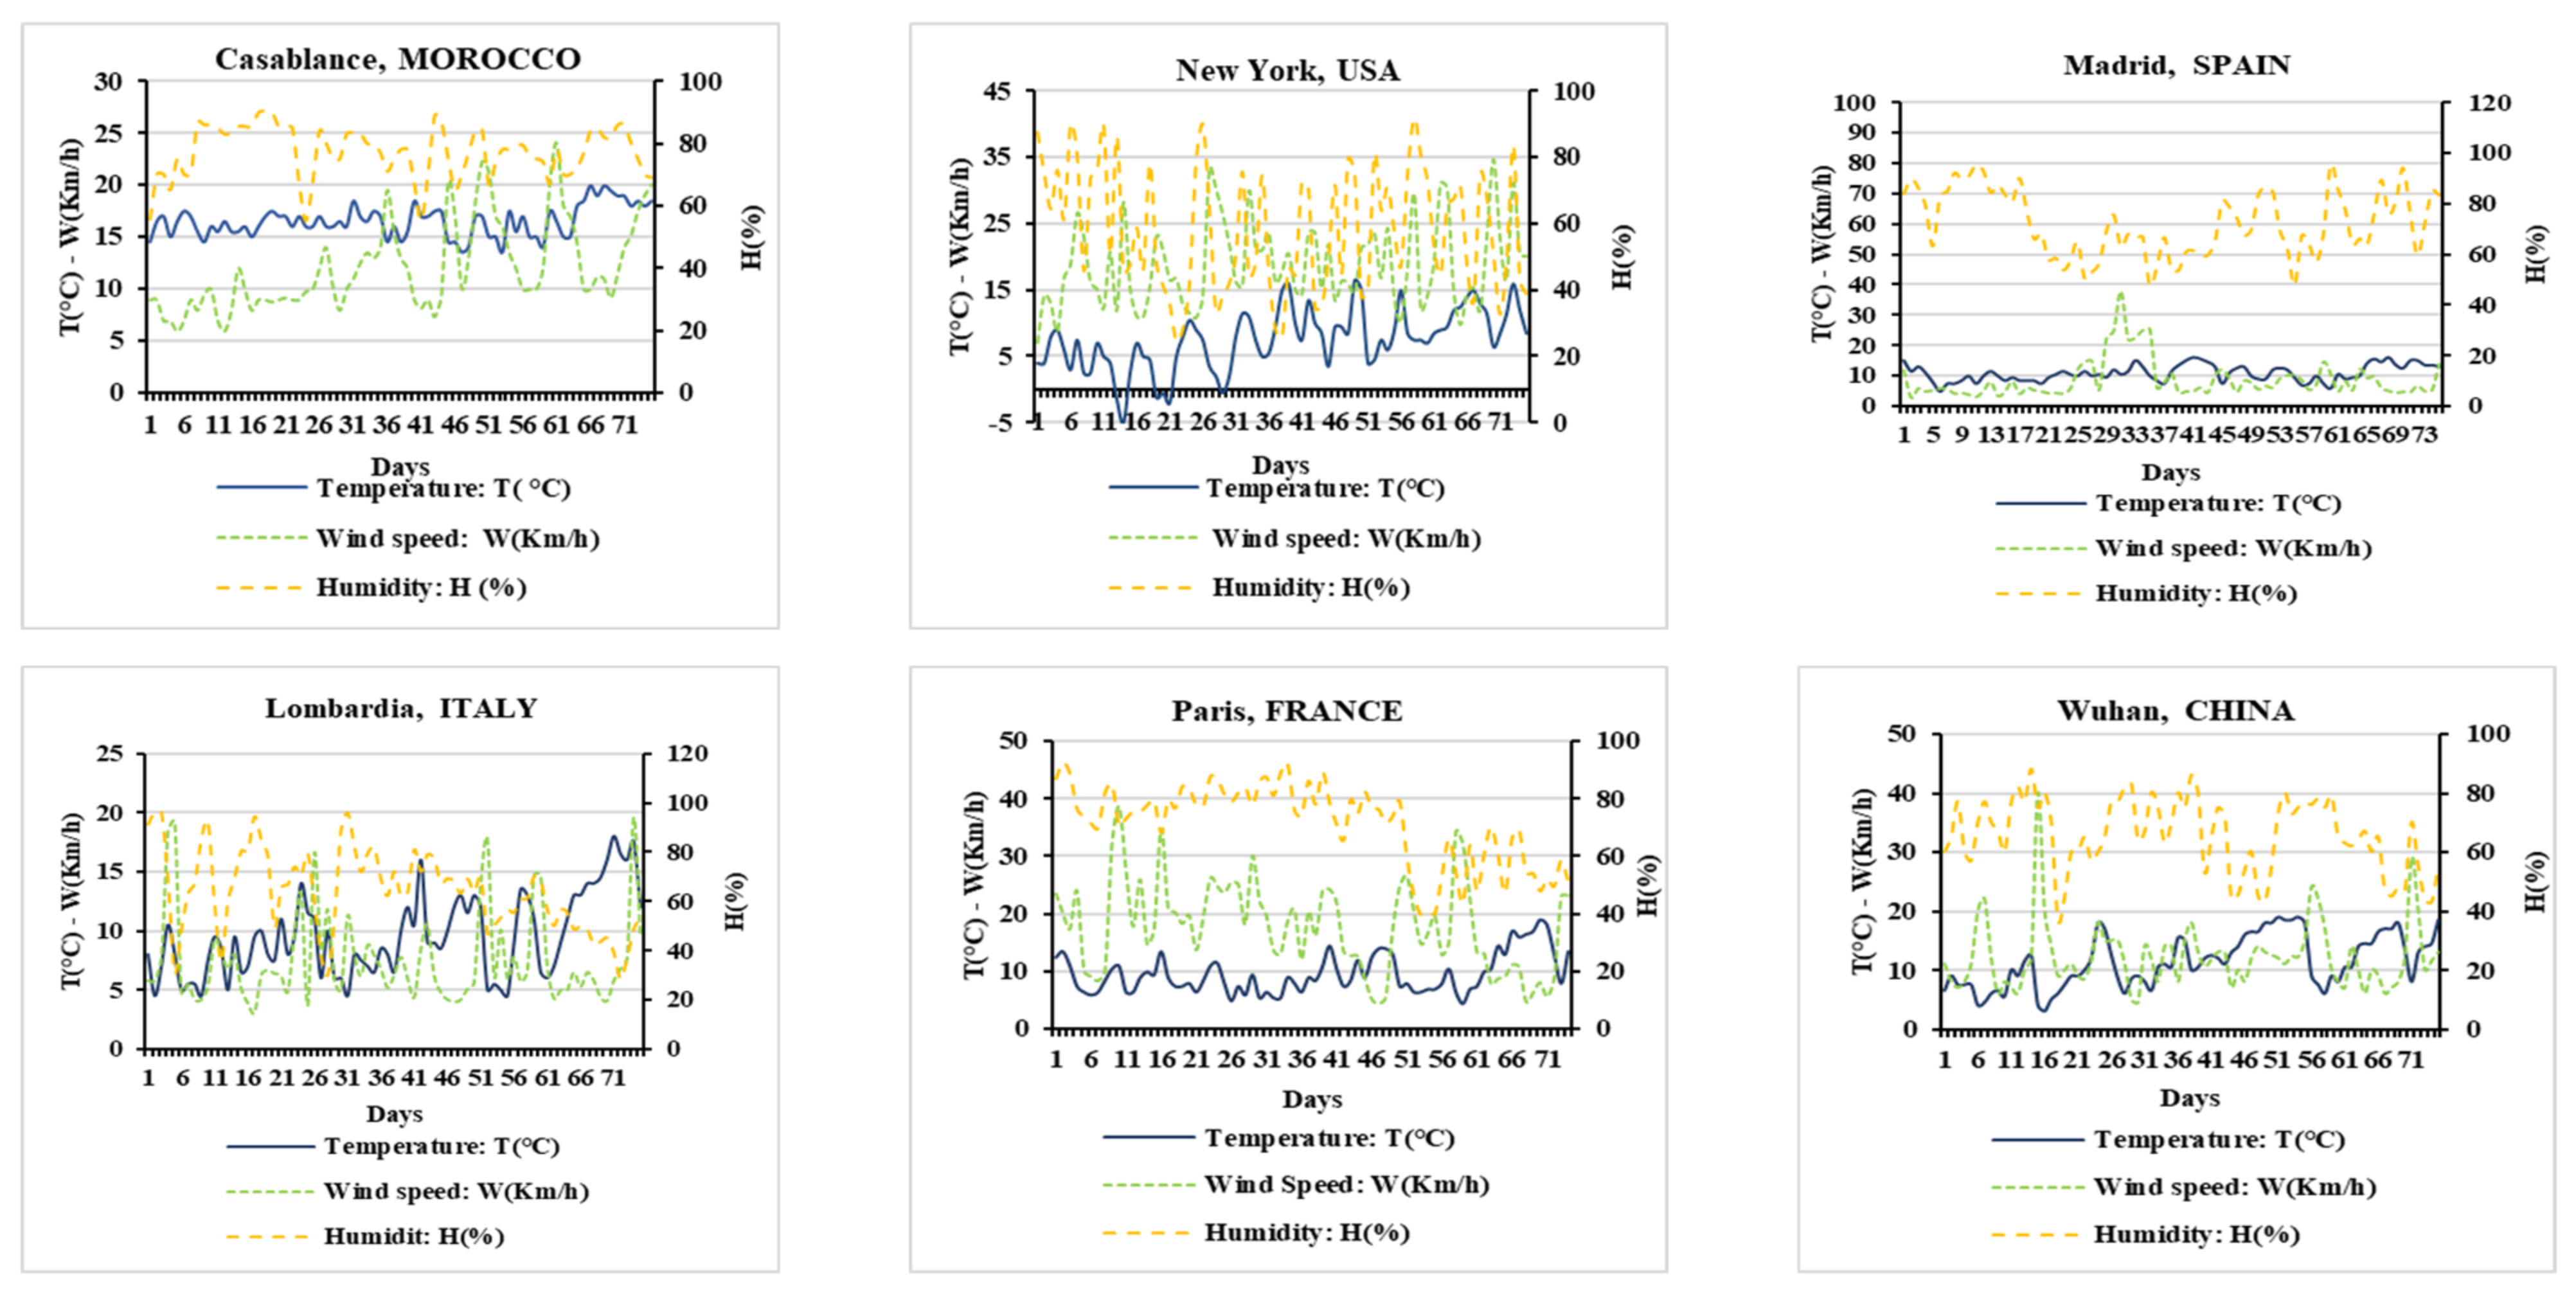
| Casablanca | 13.5 °C | 20 °C | 55% | 90.5% | 6 km/h | 25 km/h |
| New York | −0.5 °C | 16.5 °C | 24.5% | 91.8% | 11.2 km/h | 55.7 km/h |
| Madrid | 5 °C | 16.3 °C | 47.5% | 95.3% | 4.5 km/h | 60.8 km/h |
| Lombardy-Milan | 4.5 °C | 19.3 °C | 28.7% | 96% | 4.96 km/h | 32 km/h |
| Paris | 4.5 °C | 19 °C | 40% | 93% | 6.88 km/h | 55 km/h |
| Wuhan | 3 °C | 19 °C | 37% | 87% | 6 km/h | 29 km/h |
Appendix B
References
- Lupia, T.; Scabini, S.; Pinna, S.M.; Di Perri, G.; De Rosa, F.G.; Corcione, S. 2019 novel coronavirus (2019-nCoV) outbreak: A new challenge. J. Glob. Antimicrob. Resist. 2020, 21, 22–27. [Google Scholar] [CrossRef] [PubMed]
- Chen, S.; Yang, J.; Yang, W.; Wang, C.; Bärnighausen, T. COVID-19 control in China during mass population movements at New Year. Lancet 2020, 395, 764–766. [Google Scholar] [CrossRef] [Green Version]
- Berenbaum, M.R. PNAS and the pandemic. Proc. Natl. Acad. Sci. USA 2020, 117, 9650–9651. [Google Scholar] [CrossRef] [Green Version]
- Trilla, A.; Trilla, G.; Daer, C. The 1918 “Spanish Flu” in Spain. Clin. Infect. Dis. 2008, 47, 668–673. [Google Scholar] [CrossRef] [PubMed] [Green Version]
- Wang, C.; Horby, P.W.; Hayden, F.G.; Gao, G.F. A novel coronavirus outbreak of global health concern. Lancet 2020, 395, 470–473. [Google Scholar] [CrossRef] [Green Version]
- Hui, D.S.; Azhar, E.I.; Madani, T.A.; Ntoumi, F.; Kock, R.; Dar, O.; Ippolito, G.; Mchugh, T.D.; Memish, Z.A.; Drosten, C.; et al. The continuing 2019-nCoV epidemic threat of novel coronaviruses to global health—The latest 2019 novel coronavirus outbreak in Wuhan, China. Int. J. Infect. Dis. 2020, 91, 264–266. [Google Scholar] [CrossRef] [PubMed] [Green Version]
- World Health Organization. World Health Organization COVID-19 Dashboard. Available online: https://covid19.who.int/ (accessed on 10 January 2021).
- Şahin, M. Impact of weather on COVID-19 pandemic in Turkey. Sci. Total Environ. 2020, 728, 138810. [Google Scholar] [CrossRef] [PubMed]
- Sajadi, M.M.; Habibzadeh, P.; Vintzileos, A.; Shokouhi, S.; Miralles-Wilhelm, F.; Amoroso, A. Temperature and Latitude Analysis to Predict Potential Spread and Seasonality for COVID-19. SSRN Electron. J. Mar. 2020, 3, e2011834. [Google Scholar] [CrossRef] [PubMed]
- Wells, C.R.; Sah, P.; Moghadas, S.M.; Pandey, A.; Shoukat, A.; Wang, Y.; Wang, Z.; Meyers, L.A.; Singer, B.H.; Galvani, A.P. Impact of international travel and border control measures on the global spread of the novel 2019 coronavirus outbreak. Proc. Natl. Acad. Sci. USA 2020, 117, 7504–7509. [Google Scholar] [CrossRef] [PubMed] [Green Version]
- Pung, R.; Chiew, C.J.; Young, B.E.; Chin, S.; Chen, M.I.; Clapham, H.E.; Cook, A.R.; Maurer-Stroh, S.; Toh, M.P.H.S.; Poh, C.; et al. Investigation of three clusters of COVID-19 in Singapore: Implications for surveillance and response measures. Lancet 2020, 395, 1039–1046. [Google Scholar] [CrossRef]
- You, C.; Deng, Y.; Hu, W.; Sun, J.; Lin, Q.; Zhou, F.; Pang, C.H.; Zhang, Y.; Chen, Z.; Zhou, X.-H. Estimation of the time-varying reproduction number of COVID-19 outbreak in China. Int. J. Hyg. Environ. Health 2020, 228, 113555. [Google Scholar] [CrossRef] [PubMed]
- McCluskey, C.C. Complete global stability for an SIR epidemic model with delay—Distributed or discrete. Nonlinear Anal. Real World Appl. 2010, 11, 55–59. [Google Scholar] [CrossRef]
- Hwaiz, R.; Ali, K.; Al-Tawil, N. Effect of Lockdown, Temperature, and Humidity on the Pattern of COVID-19 in Erbil Province, Kurdistan Region, Iraq. Diyala J. Med. 2021, 20, 56–67. [Google Scholar] [CrossRef]
- Dos Santos, J.M.A.; de Menezes, T.A.; de Arruda, R.G.; Fernandes, F.E.C.V. Climate Influences on COVID-19 Prevalence Rates: An Application of a Panel Data Spatial Model. Reg. Sci. Policy Pract. 2021, 22, 1–18. [Google Scholar] [CrossRef]
- Baron, C. Demographics Statista. 2020. Available online: https://www.statista.com/markets/411/topic/446/demographics/ (accessed on 1 March 2020).
- Health Care Ministry of Morocco. Statistiques et Cas Coronavirus au Maroc. 2020. Available online: http://www.covidmaroc.ma/Pages/AccueilAR.aspx (accessed on 30 April 2020).
- NewYork Governor. New York State Government, Oficial Website. 2020. Available online: http://en.nhc.gov.cn/news.html (accessed on 30 April 2020).
- De Sanidad, E.M. El Coronavirus, en Datos Casos en España y el Mundo. 2020. Available online: https://www.eldiario.es/sociedad/mapa-evolucion-coronavirus-expansion-Espana.html (accessed on 30 April 2020).
- Flourish. Coronavirus in Italy: Updated Map and Case Count. 2020. Available online: https://lab24.ilsole24ore.com/coronavirus/en/ (accessed on 30 April 2020).
- Nirasay, S. Statistiques et cas Coronavirus COVID-19 Île-de-France. 2020. Available online: https://www.cascoronavirus.fr/ (accessed on 30 April 2020).
- National Health Commission of the People’s Republic of China. Novel Coronavirus Cases in China. 2020. Available online: http://en.nhc.gov.cn/ (accessed on 30 April 2020).
- Sas, O. Topographic Maps, Elevation, Relief. 2020. Available online: https://en-gb.topographic-map.com/ (accessed on 5 March 2020).

Publisher’s Note: MDPI stays neutral with regard to jurisdictional claims in published maps and institutional affiliations. |
© 2021 by the authors. Licensee MDPI, Basel, Switzerland. This article is an open access article distributed under the terms and conditions of the Creative Commons Attribution (CC BY) license (https://creativecommons.org/licenses/by/4.0/).
Share and Cite
Lagtayi, R.; Lairgi, L.; Daya, A.; Khouya, A. The Impact of the Average Temperature, Humidity, Wind Speed, Altitude, and Population Density on Daily COVID-19 Infection Evolution. Med. Sci. Forum 2021, 4, 30. https://doi.org/10.3390/ECERPH-3-09094
Lagtayi R, Lairgi L, Daya A, Khouya A. The Impact of the Average Temperature, Humidity, Wind Speed, Altitude, and Population Density on Daily COVID-19 Infection Evolution. Medical Sciences Forum. 2021; 4(1):30. https://doi.org/10.3390/ECERPH-3-09094
Chicago/Turabian StyleLagtayi, Rachid, Lamya Lairgi, Abdelmajid Daya, and Ahmed Khouya. 2021. "The Impact of the Average Temperature, Humidity, Wind Speed, Altitude, and Population Density on Daily COVID-19 Infection Evolution" Medical Sciences Forum 4, no. 1: 30. https://doi.org/10.3390/ECERPH-3-09094
APA StyleLagtayi, R., Lairgi, L., Daya, A., & Khouya, A. (2021). The Impact of the Average Temperature, Humidity, Wind Speed, Altitude, and Population Density on Daily COVID-19 Infection Evolution. Medical Sciences Forum, 4(1), 30. https://doi.org/10.3390/ECERPH-3-09094