Proceeding Paper

Mapping Public Sentiment: A Data-Driven Analysis of COVID-19 Discourse on Social Media in Italy †

by
Gabriela Fernandez
*,
Siddharth Suresh-Babu
and
Domenico Vito
Metabolism of Cities Living Lab, Center for Human Dynamics in the Mobile Age, San Diego State University, 5500 Campanile Drive, San Diego, CA 92182, USA
*
Author to whom correspondence should be addressed.
Presented at the 3rd International One Health Conference, Athens, Greece, 15–17 October 2024.
Med. Sci. Forum 2025, 33(1), 3; https://doi.org/10.3390/msf2025033003
Published: 8 July 2025

Abstract

This study provides a detailed analysis of COVID-19-related social media discourse in Italy, using 535,886 tweets from 10 major cities between 30 August 2020 and 8 June 2021. The tweets were translated from Italian to English for analysis. A multifaceted methodology was employed: Latent Dirichlet Allocation (LDA) identified 20 key themes; sentiment analysis, using TextBlob, Flair, and TweetNLP, and emotion recognition using TweetNLP, revealed the emotional tone of the discourse, with 453 tweets unanimously positive across all algorithms. TextBlob was used for lexical analysis to rank the most salient positive and negative terms. The results indicated that positive sentiments centered on hope, safety measures, and vaccination progress, while negative sentiments focused on fear, death, and quarantine frustrations. This research offers valuable insights for public health officials, enabling tailored messaging, real-time strategy monitoring, and agile policymaking during the pandemic, with implications for future health crises.

1. Introduction

The COVID-19 pandemic has profoundly impacted global societies, affecting public health, economies, and social behaviors. Italy, one of the hardest-hit countries during the early stages of the pandemic, saw widespread social media engagement as people used platforms like Twitter to voice their opinions, frustrations, hopes, and fears. Social media has become a crucial space for public discourse, and analyzing this data offers invaluable insights into the public’s response to health crises.
This study aims to explore the dynamics of public sentiment expressed on social media, particularly Twitter, in 10 major cities across Italy from 30 August 2020 to 8 June 2021. By conducting a detailed analysis of 535,886 tweets, this paper investigates key themes, sentiment trends, and emotions that dominated the discourse during the pandemic. Additionally, this research offers implications for public health messaging, agile policy making, and crisis communication strategies.
The hypothesis of this study is as follows: Public sentiment on social media during the COVID-19 pandemic in Italy exhibits temporal and geographical variations, with positive sentiments linked to hope, safety, and vaccines, while negative sentiments are driven by fear, death, and frustrations with lockdown measures. Lexical and sentiment analysis of COVID-19-related tweets reveals that significant emotional undertones—such as joy, fear, and anticipation—fluctuate according to policy changes, such as vaccine rollout or lockdowns.

2. Literature Review

Several studies have examined the use of social media during public health crises [1,2,3]. Public sentiment analysis has become a valuable tool for understanding public reactions and informing policymakers. Akbik et al. [4] highlighted the importance of using social media data to analyze misinformation and societal reactions to COVID-19, emphasizing the role of online platforms in shaping public perception.
Lorenzoni et al. [5] examined the role of behavior and communication in shaping public response during health emergencies, stressing the importance of understanding emotions and sentiment in crisis communication. Moreover, studies [6,7,8,9] have utilized sentiment analysis and topic modeling to gauge public discourse surrounding COVID-19. These studies affirm the utility of real-time data analysis for public health strategizing [10], though few have focused on Italy with the depth of this research.
This paper builds on these previous efforts by extending the analysis to include sentiment, lexical, and emotional recognition in an Italian context, providing a geographically and temporally nuanced perspective.

3. Methodology

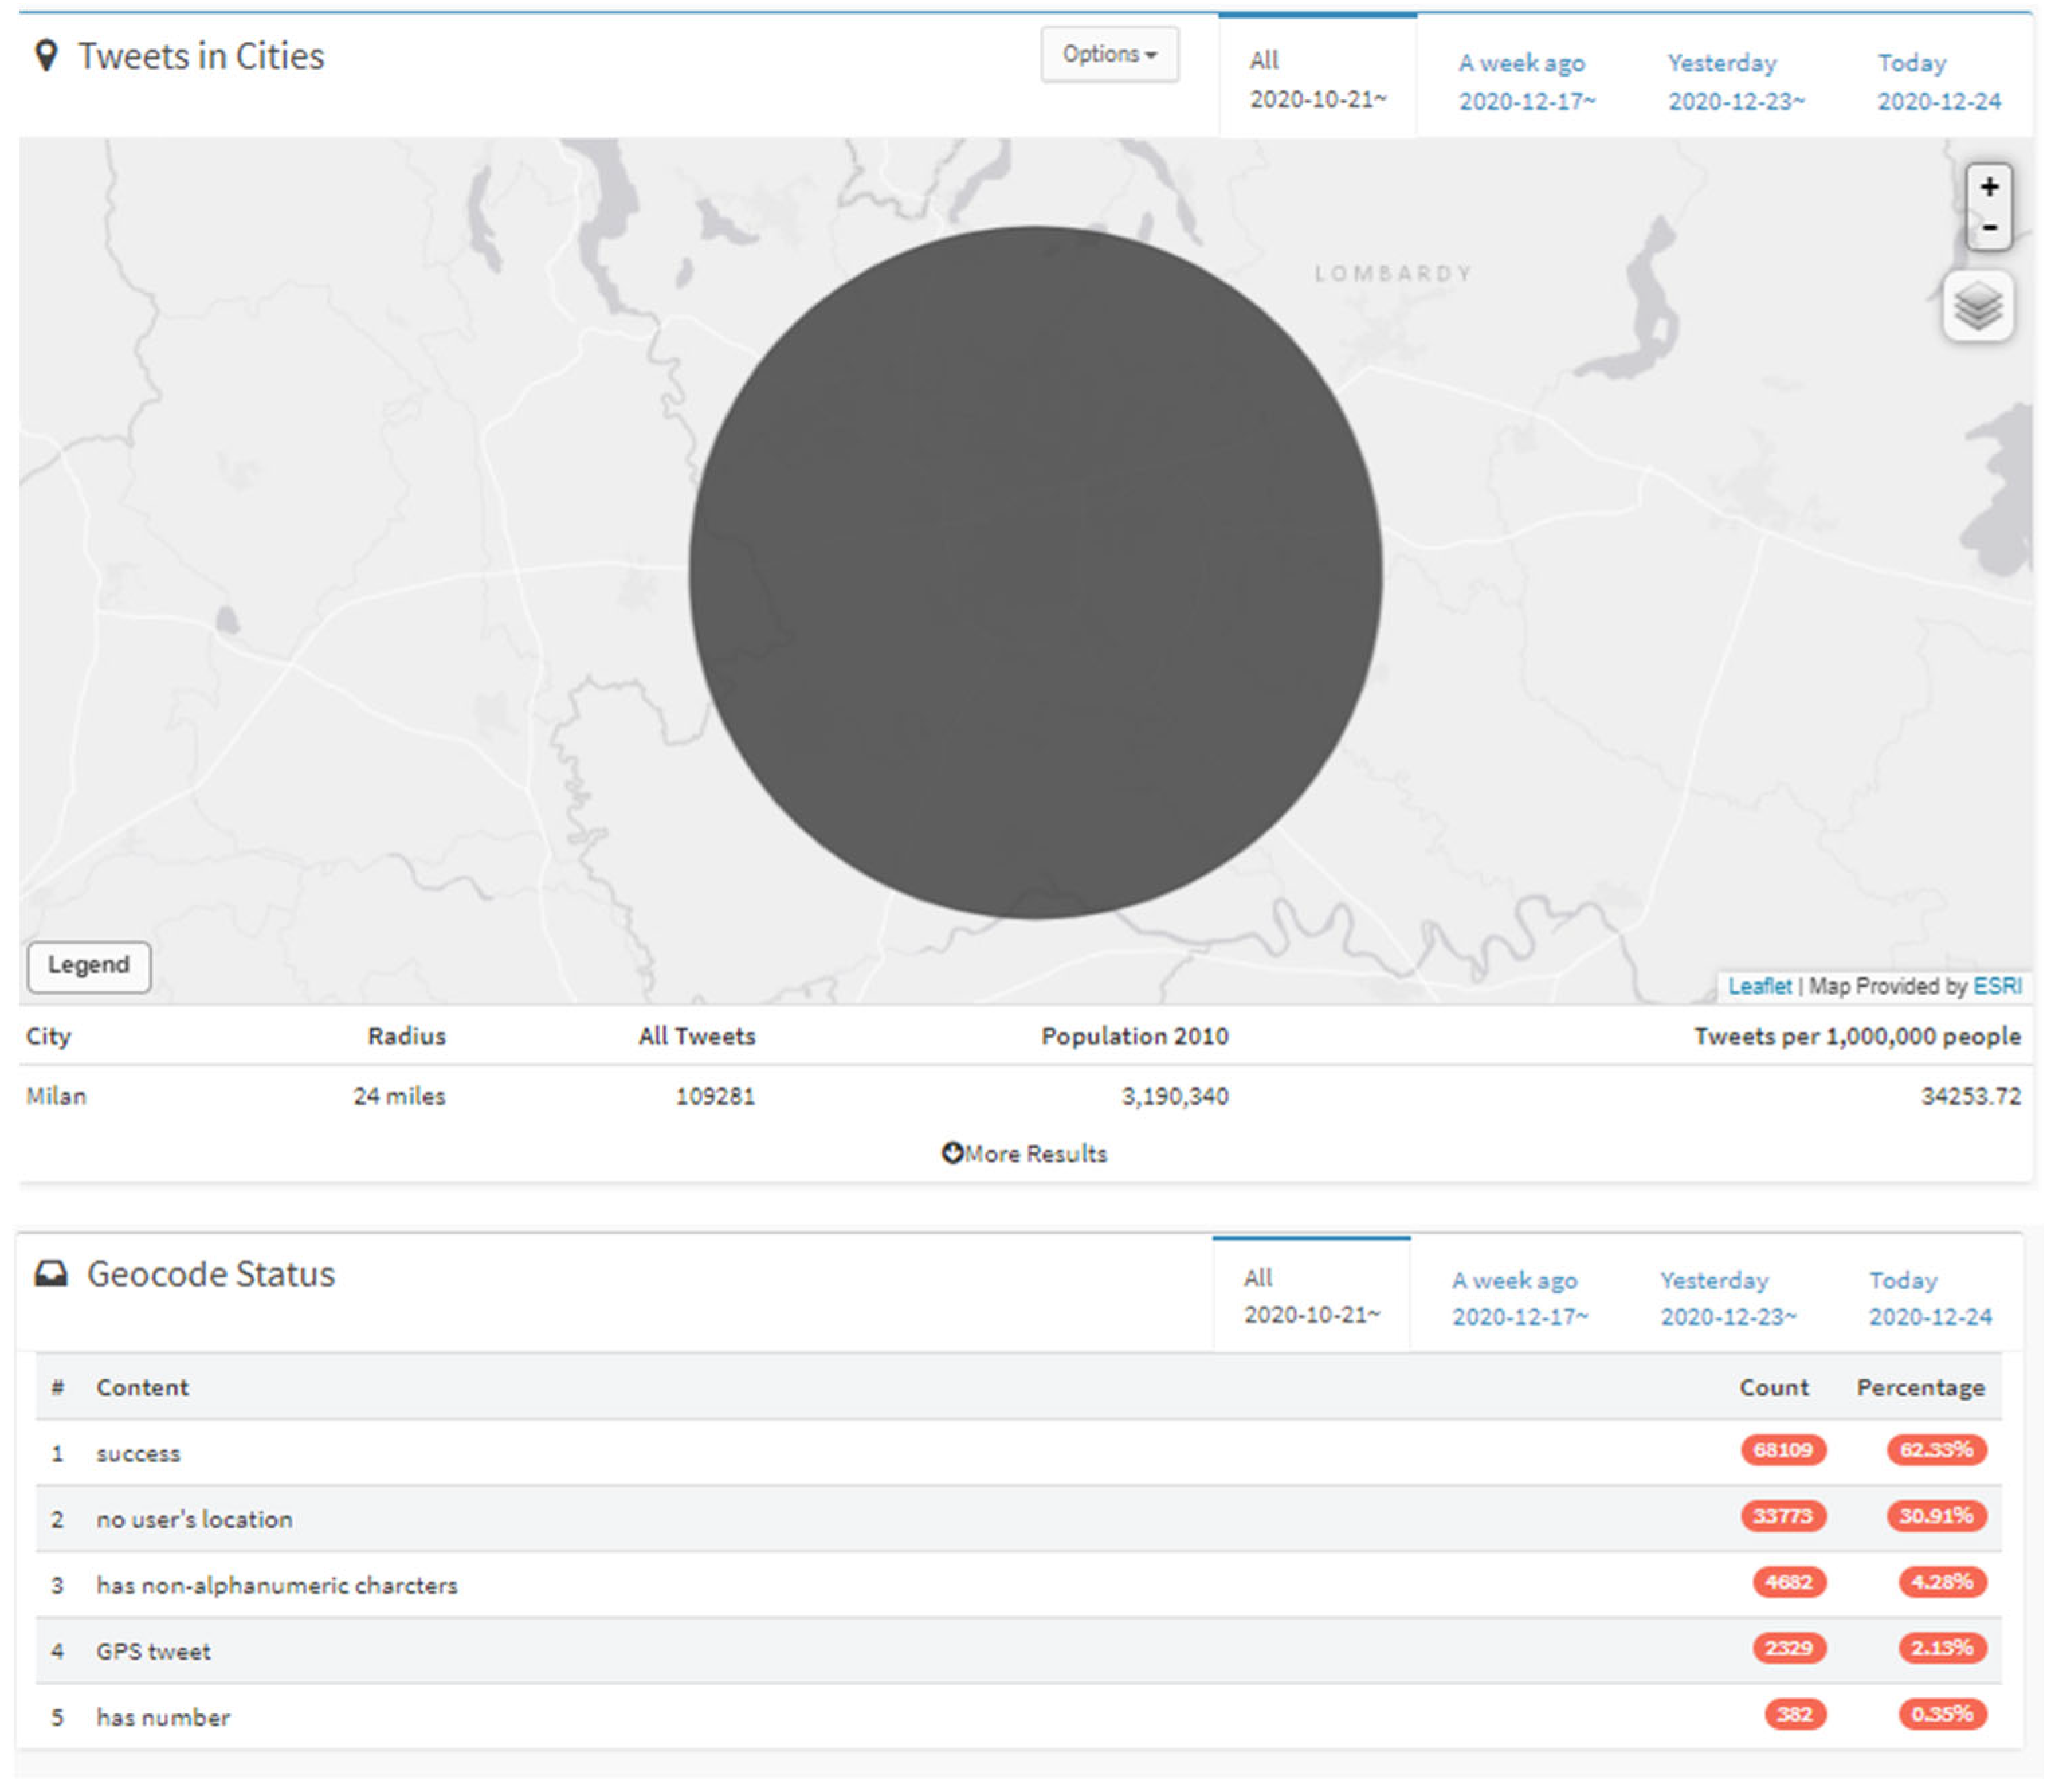
3.1. Data Collection

The dataset used in this study comprises 543,351 tweets collected between 30 August 2020 and 8 June 2021 (see Appendix A). The tweets were gathered from ten major Italian cities, including Milan, Turin, Bologna, Venice, Florence, Rome, Naples, Bari, Palermo, and Cagliari (see Figure 1). The cities were chosen to cover a diverse set of geographical regions: the north, center, south, and islands of Italy (see Table 1).
All the tweets were translated from Italian to English using Google Translate to facilitate the analysis. Due to the sheer volume of data, manual translations were not feasible. Instead, random samples were manually checked for translation accuracy, verifying that the translations maintained essential sentiment and context.

3.2. Data Preprocessing

Data preprocessing was crucial to ensure the quality of the analysis. This step involved the following:
  • Replacing emojis with their corresponding descriptions to retain emotional content.
  • Stripping out links, mentions, and special characters to focus on the textual content.
  • Cleaning hashtags embedded within sentences while preserving their meaning.
  • Removing punctuation and normalizing text to create a standardized dataset for analysis.
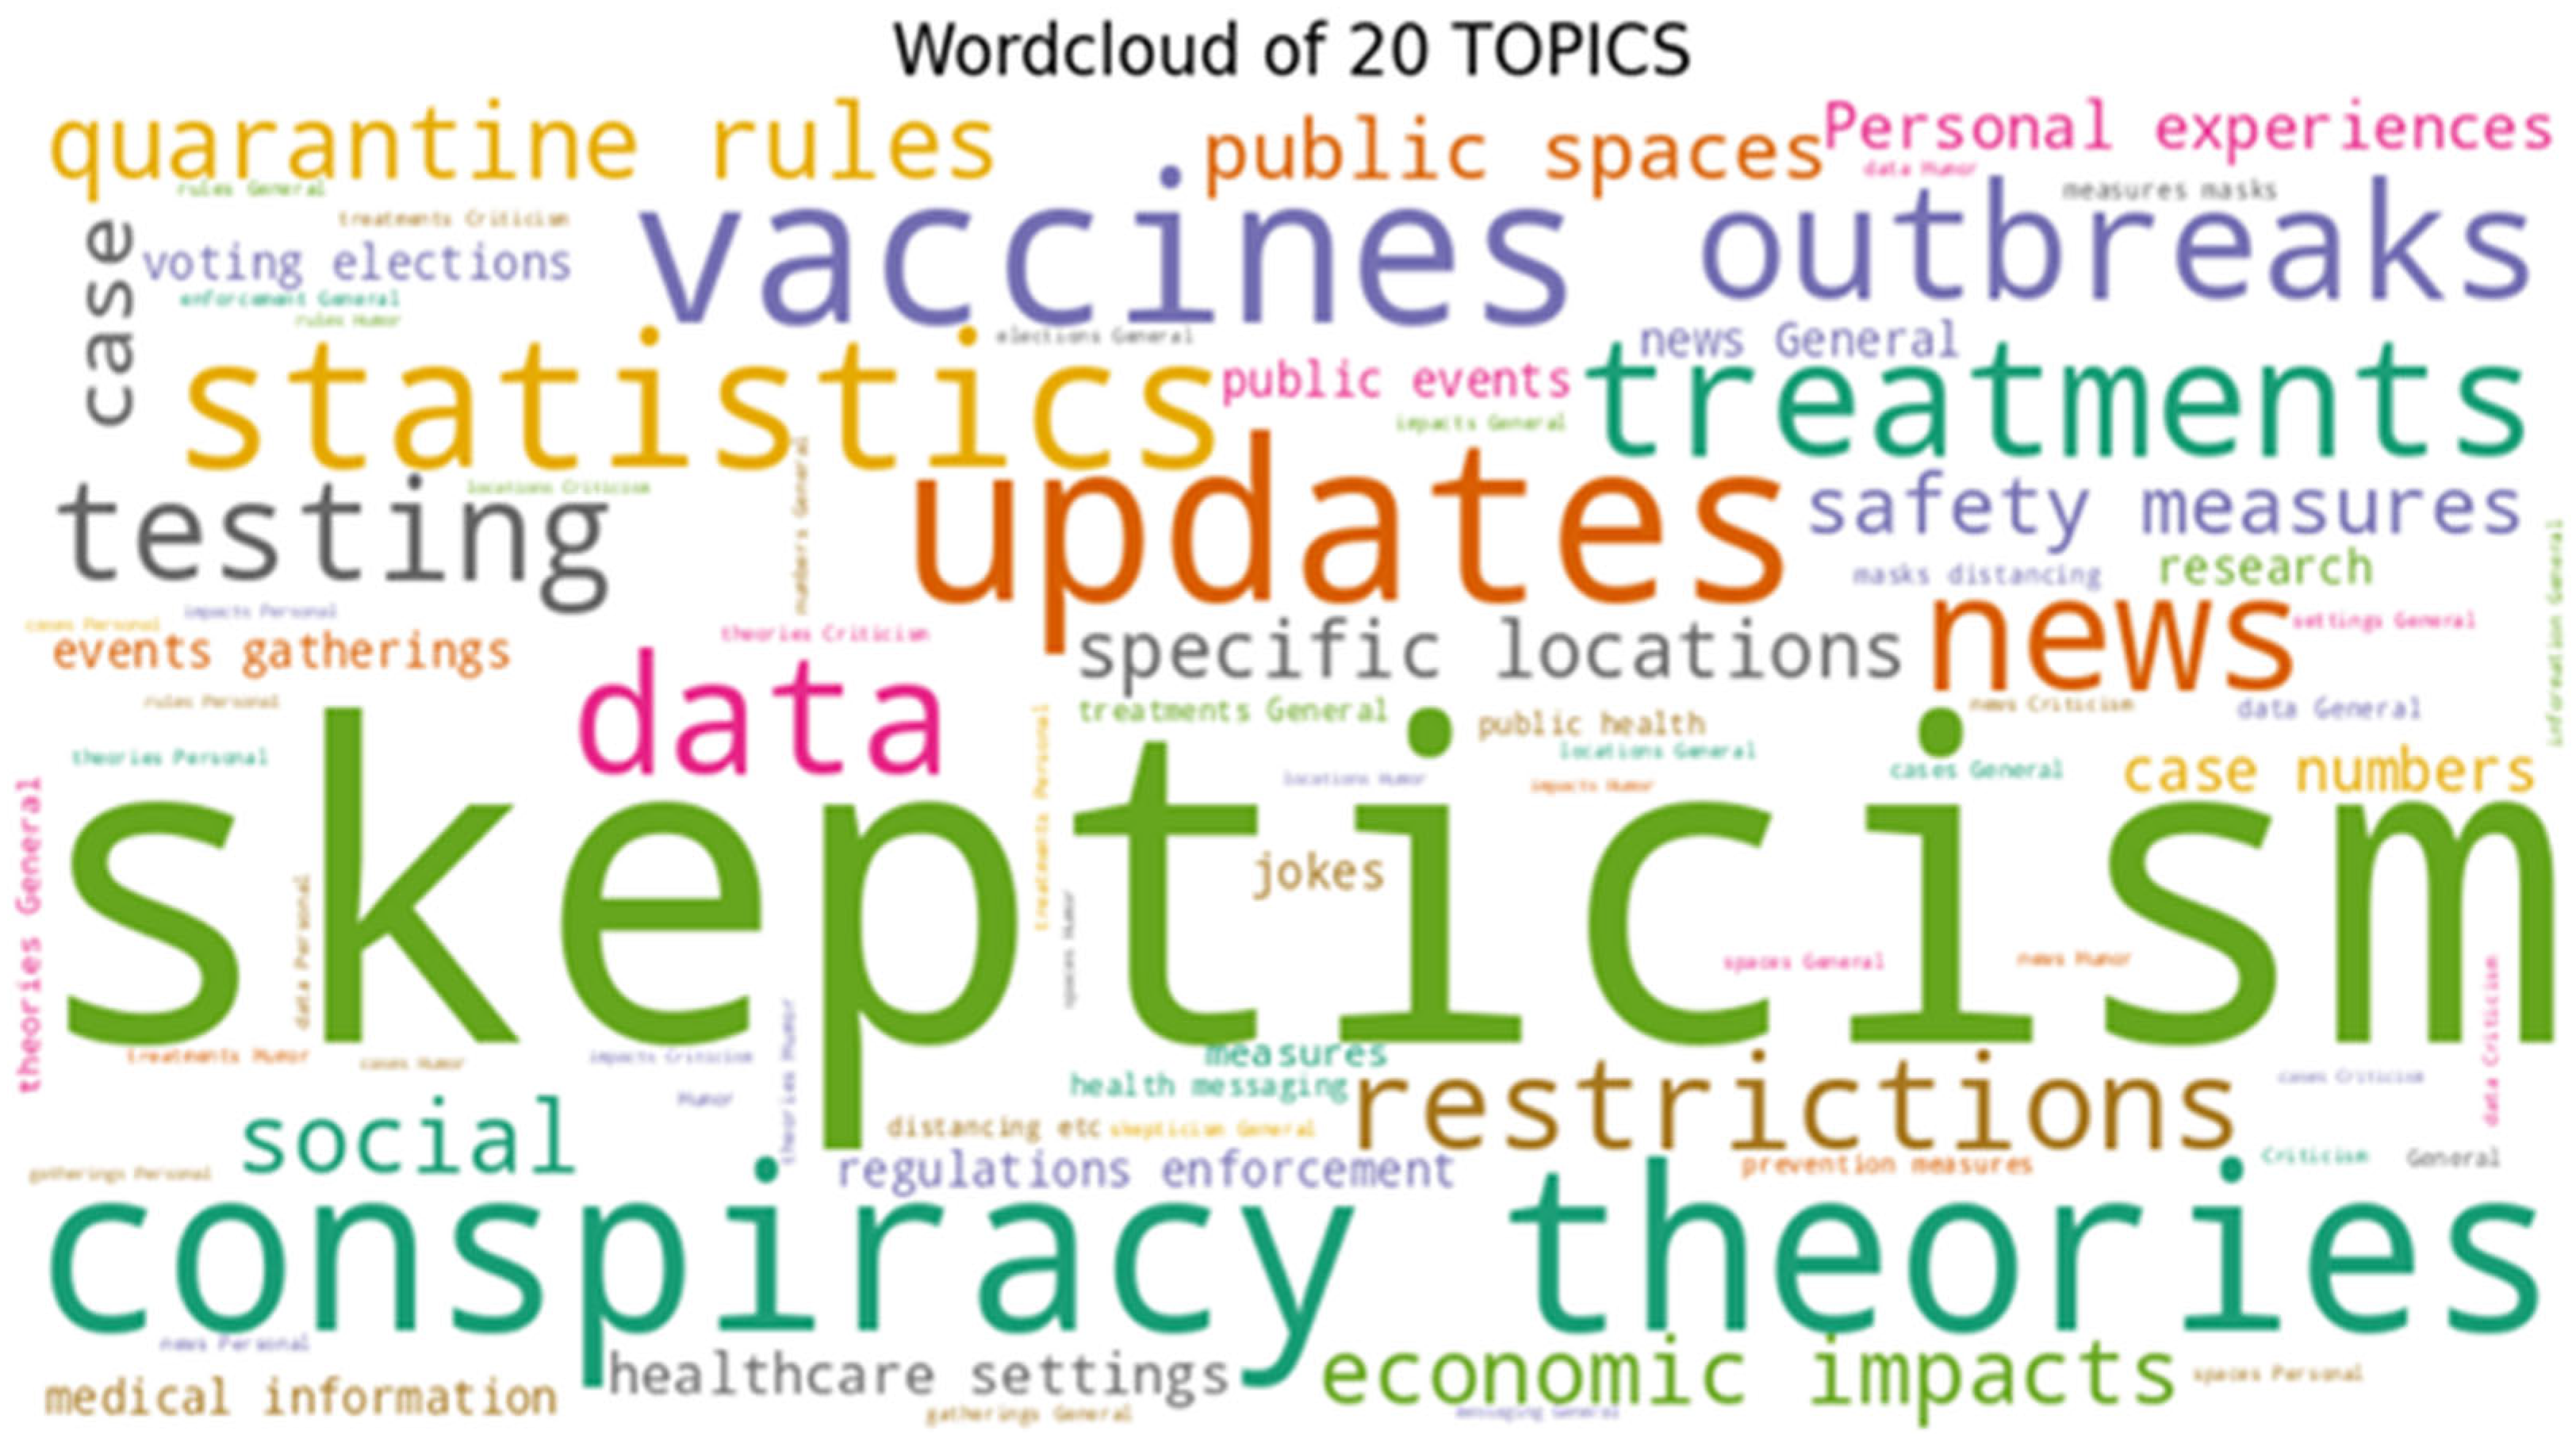
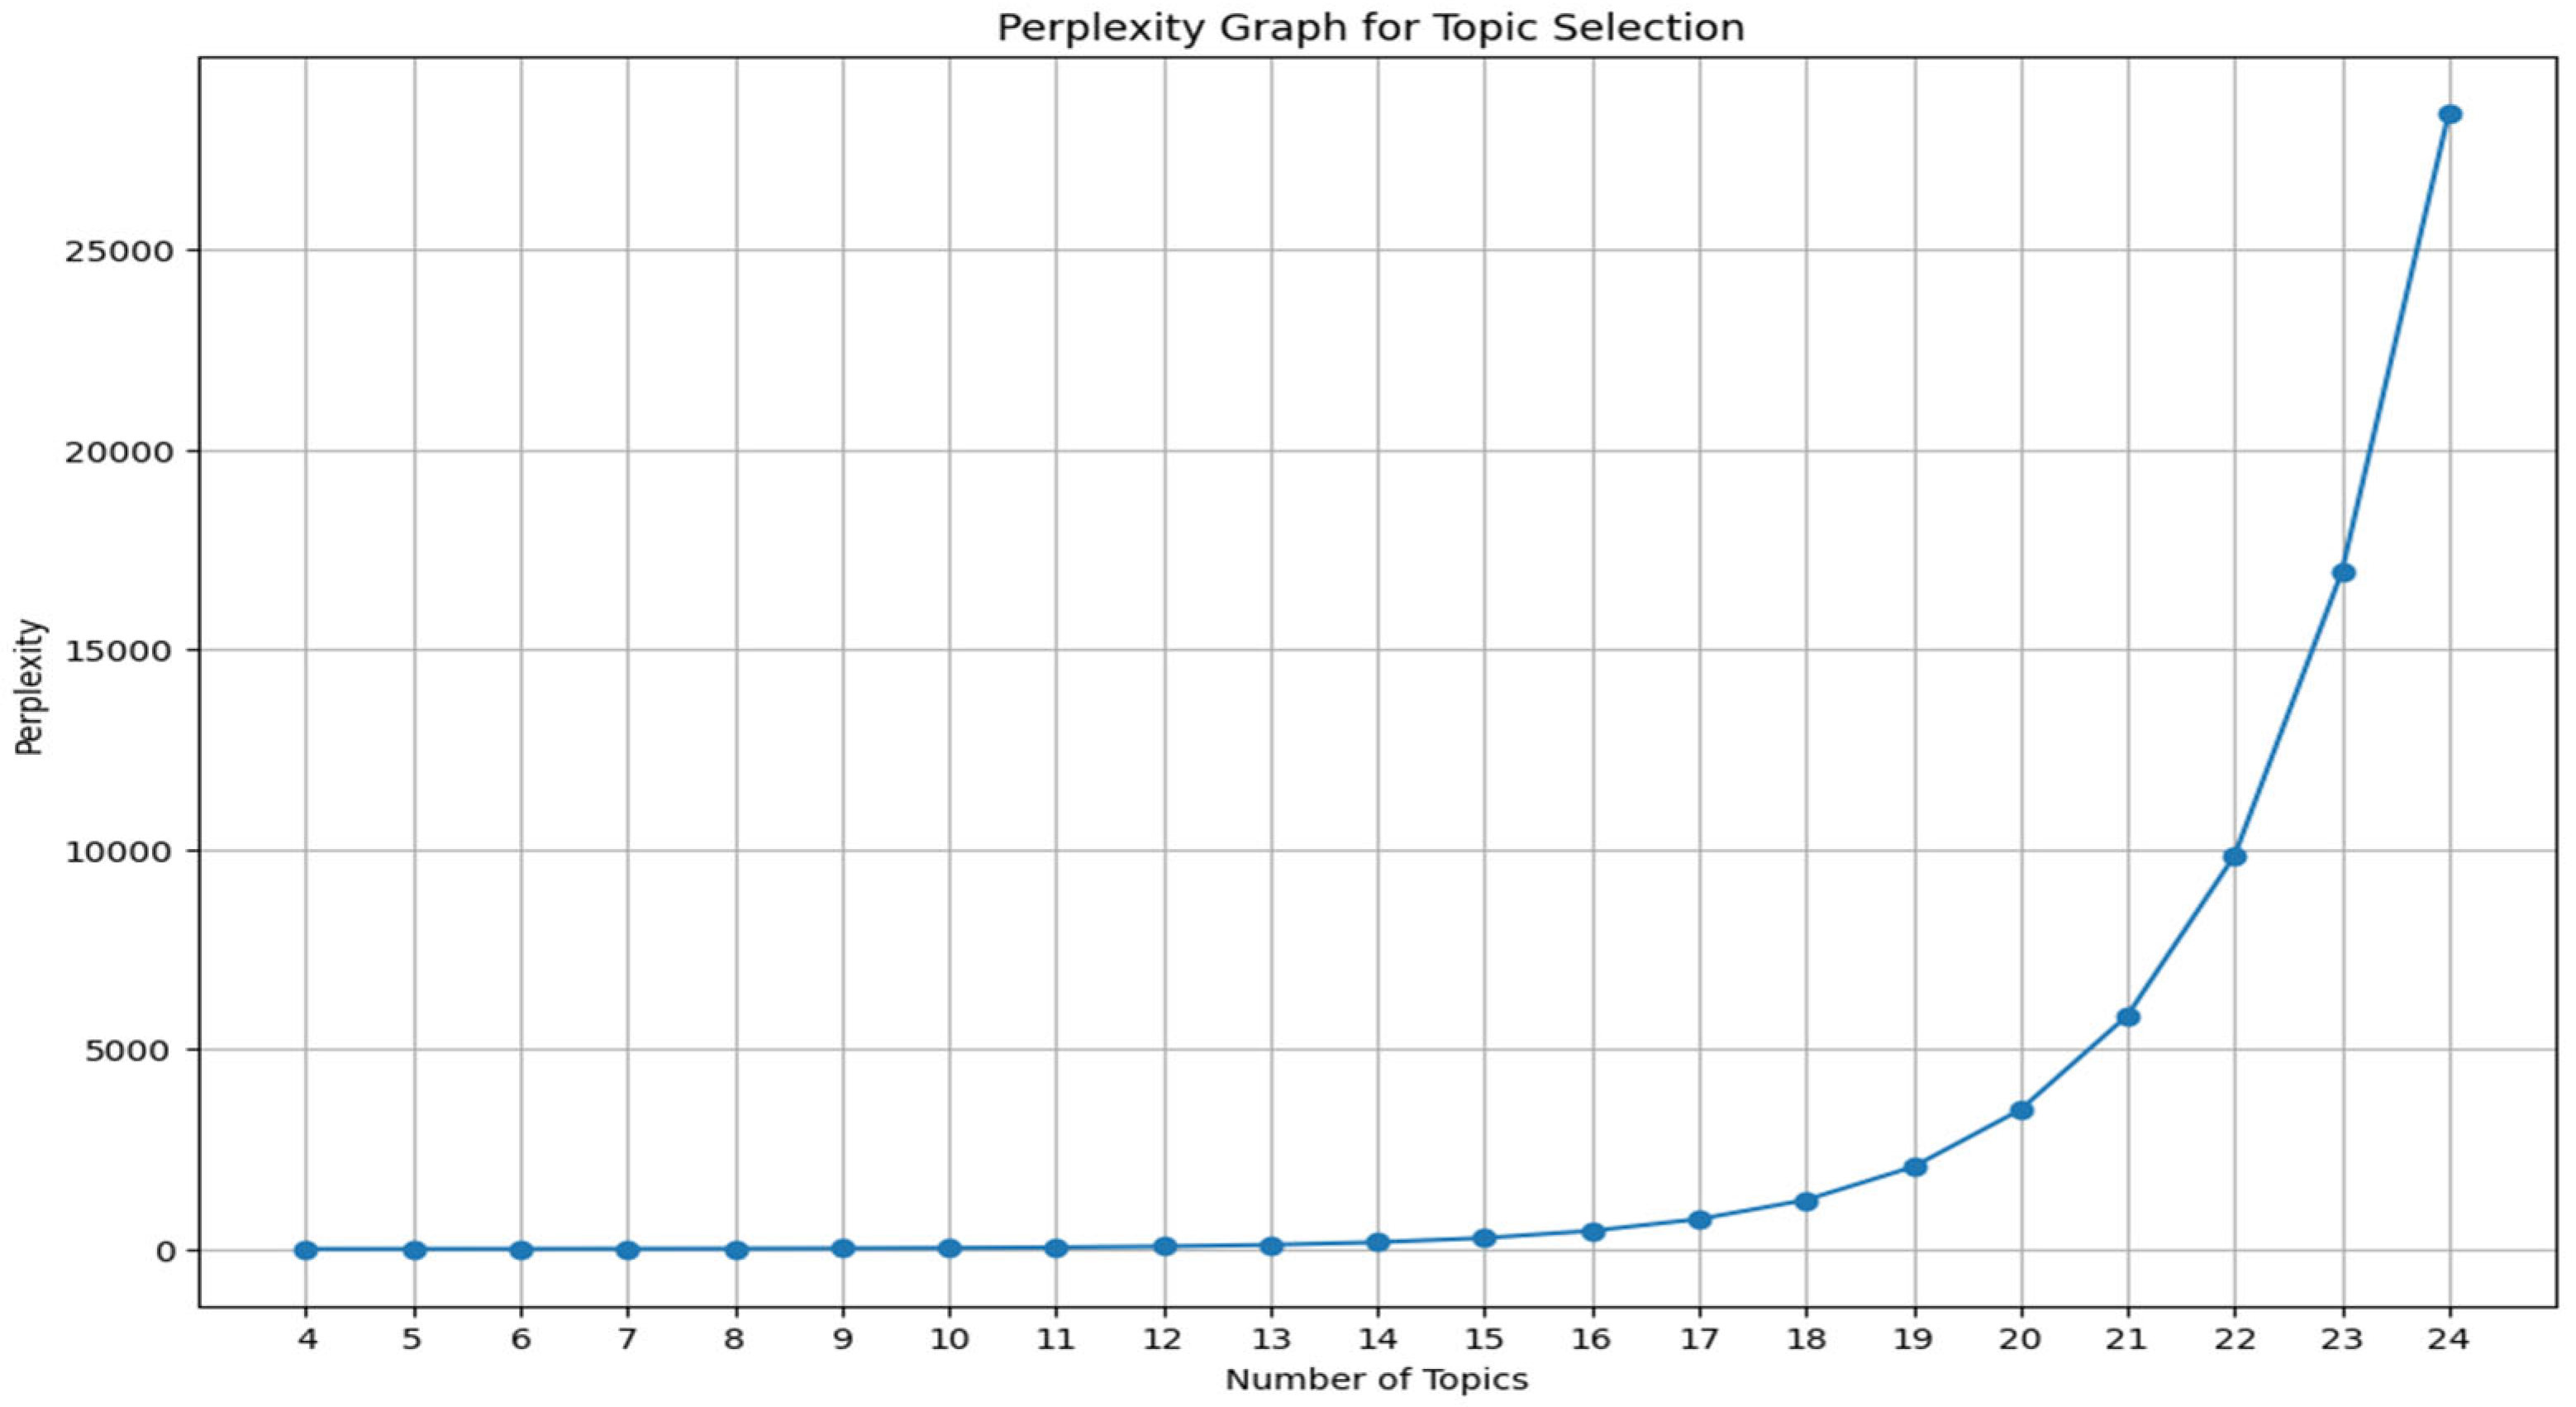
3.3. Topic Modeling

Latent Dirichlet Allocation (LDA) was employed to identify key themes from the dataset. A perplexity graph was used to determine the optimal number of topics, but the perplexity scores (see Figure 2) continued to increase with the number of topics. This phenomenon, while counterintuitive, is not unprecedented in topic modeling literature. Chang et al., 2009 [11] have demonstrated that the number of topics based on human judgment and the number of topics based on perplexity are not correlated. Given the computational constraints and the recognized limitations of perplexity as a sole determinant of topic number, we selected 20 topics and labeled them manually for further exploration. The topics included (1) COVID-19 healthcare responses; (2) personal experiences with the virus; (3) criticism of government policies; and (4) vaccination efforts (see Table 2).

3.4. Sentiment Analysis

Four sentiment analysis techniques were applied to the data: VADER and NLTK, lexicon-based models used for polarity determination; TextBlob, which assigns sentiment based on polarity and subjectivity; and Flair, a deep learning model that assigns continuous sentiment scores. Given its robustness and advantages, Flair was chosen as the primary model for sentiment analysis in this study. Of the total tweets, 453 were unanimously classified as positive by all models, reflecting hope around vaccination and safety measures.

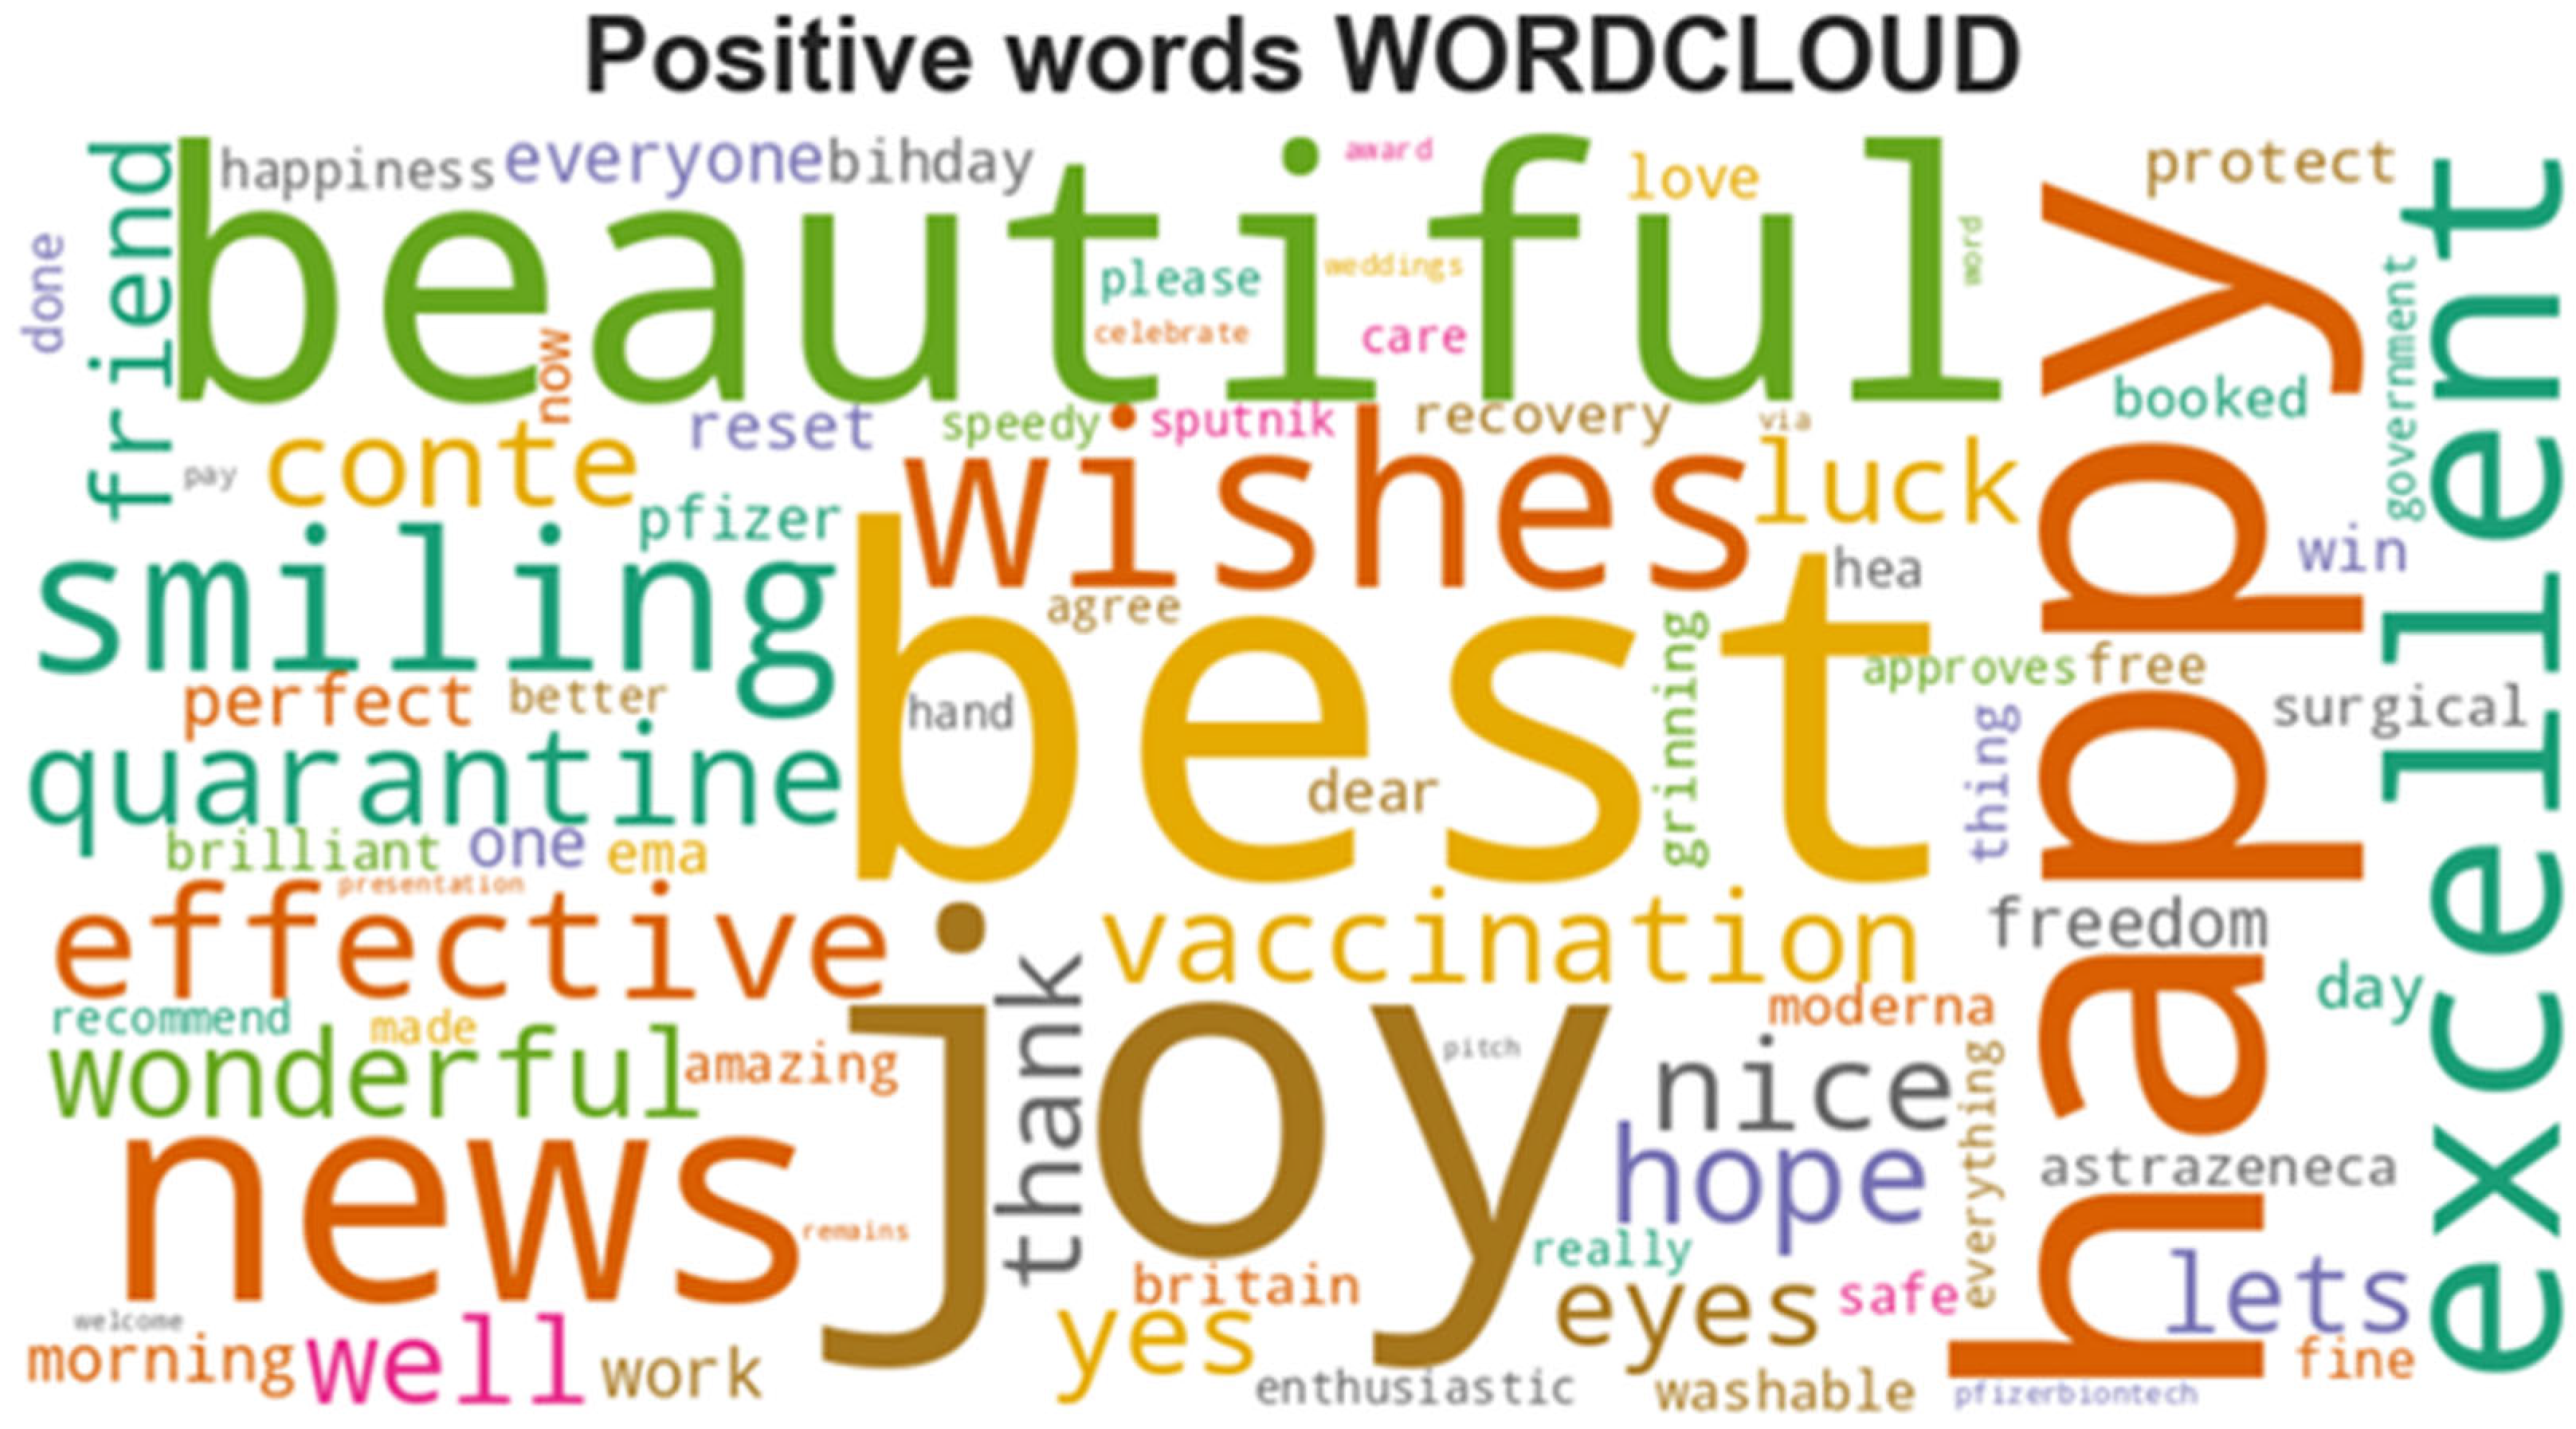
3.5. Lexical and Emotion Recognition Analysis

Lexical analysis using TextBlob provided insights into the most salient terms driving sentiment. Positive words (see Figure 3) included “vaccine”, “hope”, “joy”, and “safety”, while negative terms (see Figure 4) such as “death”, “terrible”, “masks”, and “fear” dominated the discourse on pandemic restrictions.
For emotion recognition, TweetNLP identified nine categories of emotions, including sadness, anger, fear, and joy. Fear and sadness were associated with rising case numbers, while joy and optimism related to vaccination progress.

4. Analysis

The COVID-19 pandemic in Italy was characterized by a series of policy interventions aimed at containing the spread of the virus while balancing public health concerns with social and economic needs. This study focuses on eleven key dates between October 2020 and June 2021 (see Table 3), selected for their potential to significantly impact public sentiment. These dates represent critical junctures in Italy’s pandemic response, encompassing the introduction of new restrictions, adjustments to existing measures, milestone achievements in vaccination efforts, and gradual reopening strategies. The selection criteria prioritized events that directly affected daily life, introduced notable changes in policy direction, or marked significant progress in pandemic management. By analyzing public sentiment around these pivotal moments, we aim to provide insights into the effectiveness of various policy measures and their reception by the Italian public.
This selection provides a comprehensive framework for examining the relationship between policy decisions and public sentiment throughout a critical period of the pandemic in Italy.

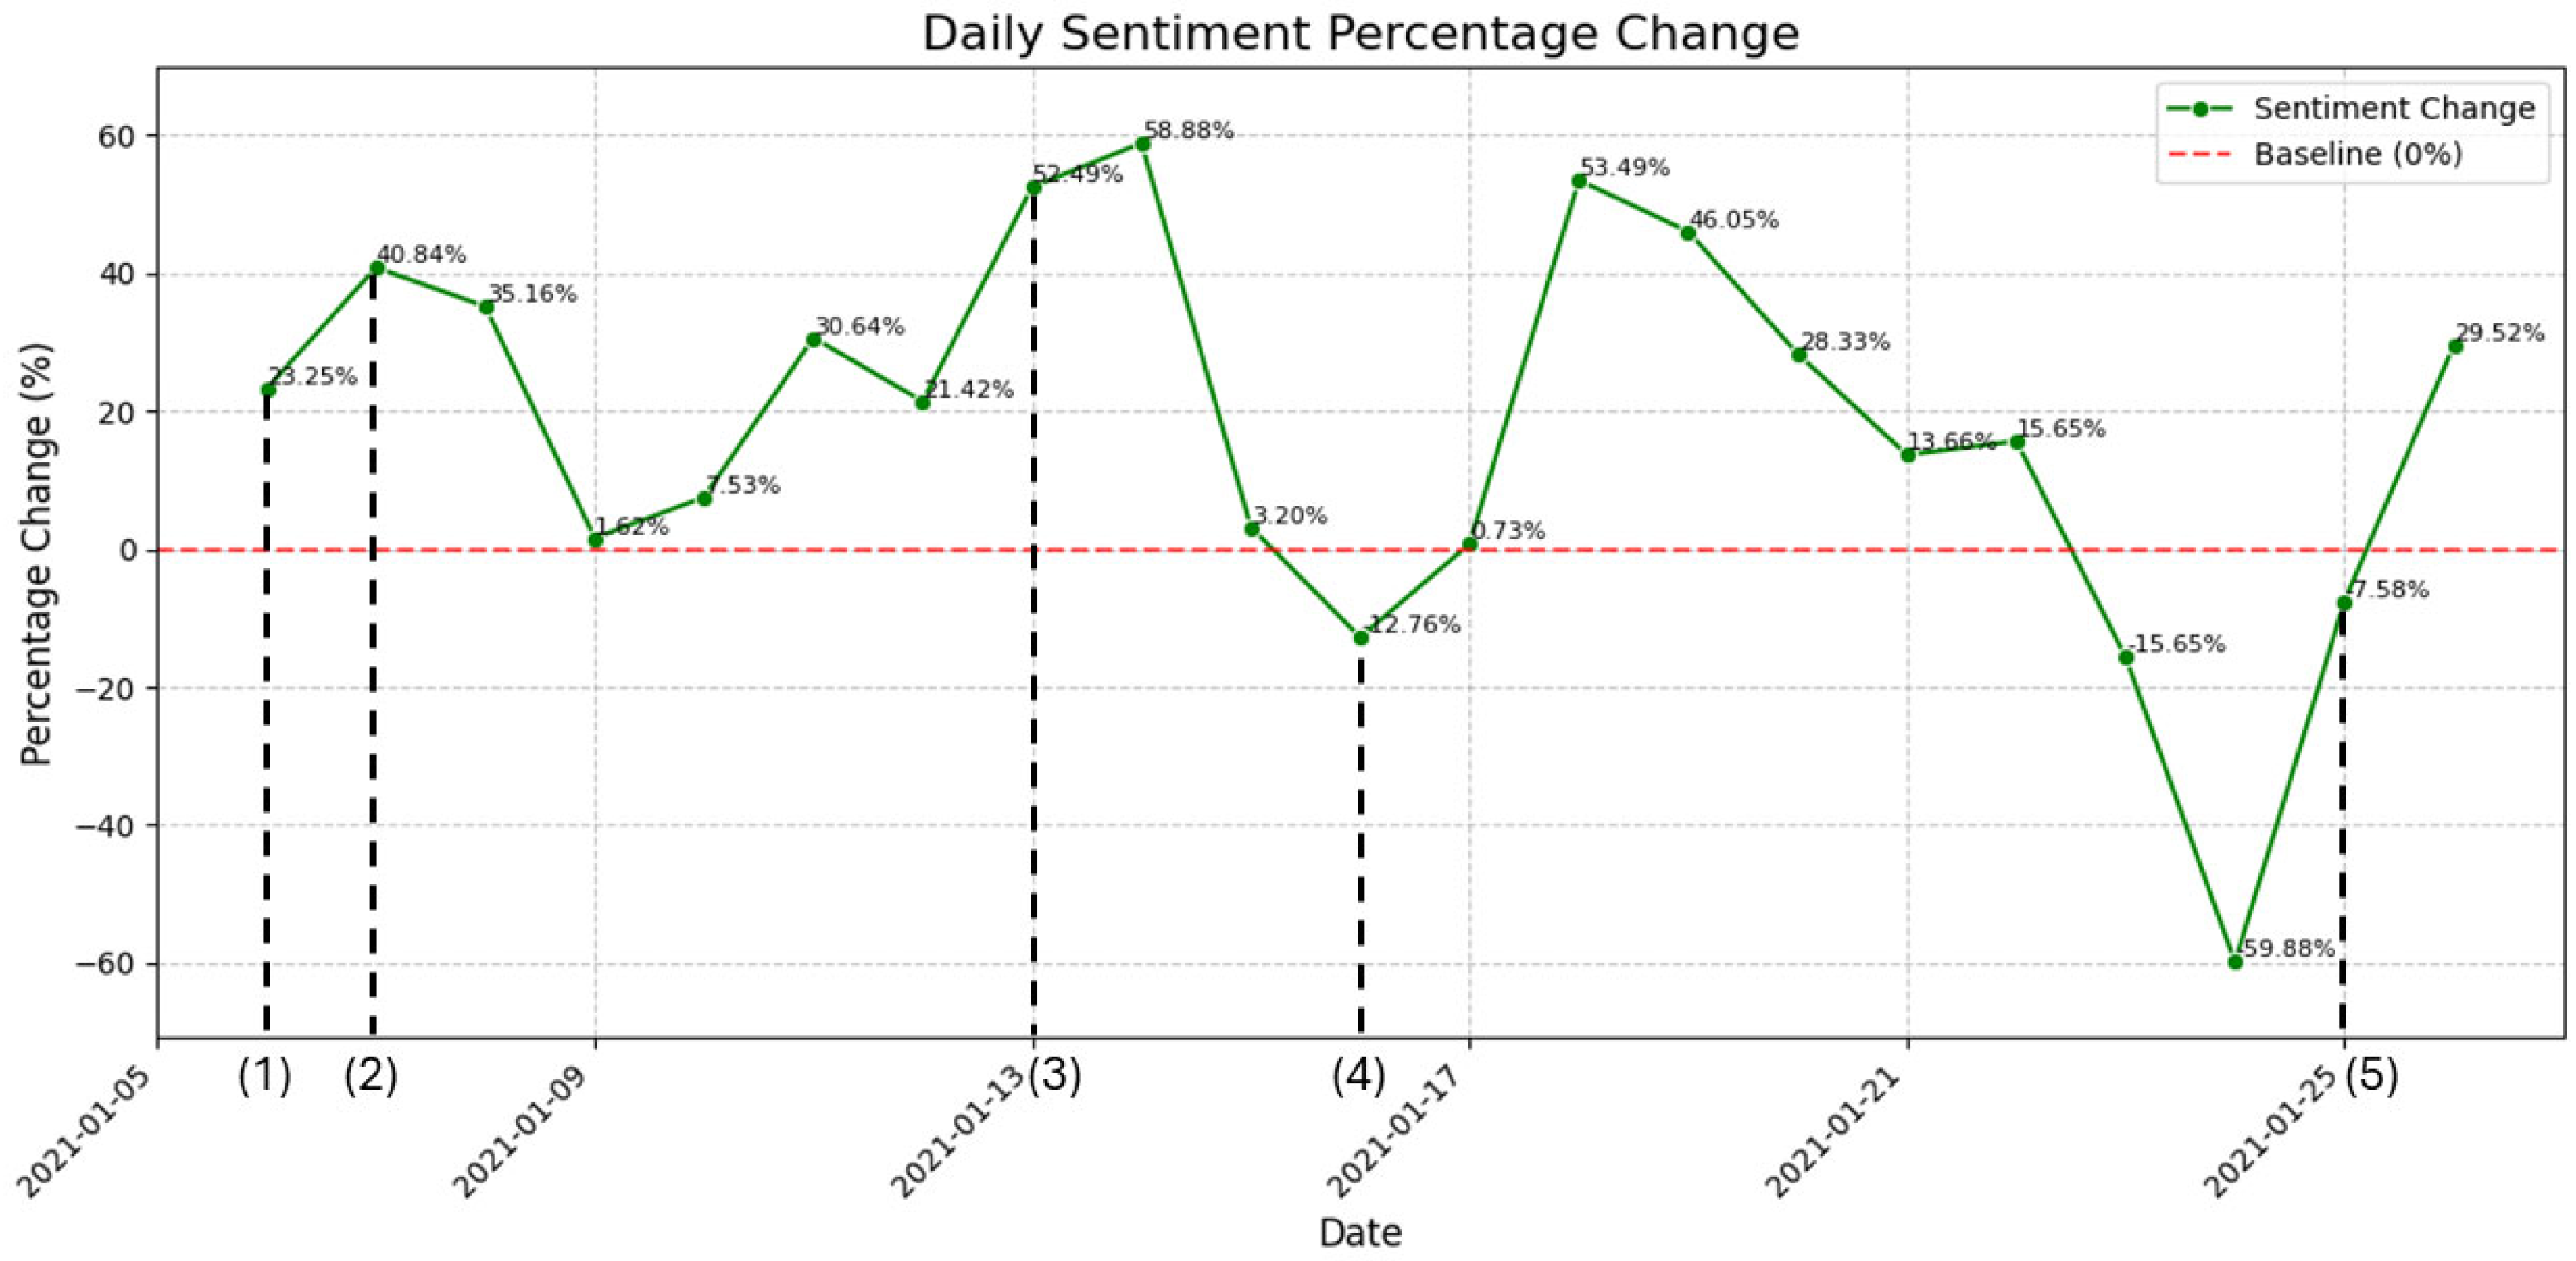
4.1. Sentiment Trends over Time

To analyze the shifts in public sentiment associated with policy changes, we focused on sentiment trends over a 30-day period following the implementation of each policy date. This analysis involved calculating percentage changes in sentiment scores, which provided insights into immediate public reactions, the evolution of sentiment over time, and potential patterns in the impact of various policies on public sentiment.
The percentage change in sentiment was calculated using the formula:
P e r c e n t a g e   C h a n g e = ( ( N e w   V a l u e O r i g i n a l   V a l u e ) / O r i g i n a l   V a l u e )   ×   100
In this formula, ‘New Value’ represents the sentiment score for a specific day, while ‘Original Value’ denotes the baseline sentiment score prior to the policy’s implementation. This approach to feature engineering allowed the normalization of sentiment score changes, facilitating a comparative analysis of sentiments before and after policy implementation.
This methodology not only enabled the identification of trends in public response to various policy types but also provided a framework for comparing the impacts of different policies on public sentiment. Moreover, it enhanced our understanding of the duration and intensity of public reactions to policy changes, thus contributing to a more nuanced interpretation of how policy interventions influence public sentiment over time.
The analysis showed that positive sentiments peaked during announcements of successful vaccination campaigns, especially surrounding the introduction of the AstraZeneca and Pfizer vaccines. In contrast, spikes in negative sentiment correlated with rising death tolls and stricter quarantine measures in early 2021.
The analysis demonstrated (see Figure 5) that the approval of the Moderna vaccine by the European Medicines Agency (EMA) on 6 January 2021 (1), following the initiation of the vaccination campaign on 27 December 2020, initially led to an improvement in public sentiment, as expressed on Twitter. This positive trend, however, was short-lived and characterized by significant volatility in the days following the announcement (see website: https://sites.google.com/sdsu.edu/covid-19twitterdiscourseitaly/home (accessed on 1 July 2025) for more graphs).
The graph illustrates a complex pattern of sentiment fluctuations in the aftermath of the Moderna vaccine approval. While there was an initial uptick in positive sentiment, likely driven by hope and optimism surrounding the expanded vaccine options, this improvement was not sustained. The data reveals sharp oscillations in sentiment, with notable downward trends observed around 13 January (3) and 16 January (4).
These downward shifts in sentiment appear to correlate with subsequent policy announcements and implementations. The government announced the extension of restrictions and curfews, while also focusing on the rollout of the COVID-19 vaccine on 7 January (2), and the announcement of the extension of the state of emergency to 30 April 2021, on 13 January (3), may have dampened public optimism, as it signaled a prolonged period of crisis management.
Furthermore, the implementation of a tiered restriction system based on regional COVID-19 risk levels, particularly the designation of Milan as a “red zone” on 16 January (4), likely contributed to increased negative sentiment. These measures, which included the closure of non-essential retail and travel restrictions in high-risk areas, potentially overshadowed the initial positive response to vaccine developments.
The fluctuations in sentiment also reflect the public’s response to the government’s multifaceted approach to pandemic management. While vaccination efforts progressed, the simultaneous tightening of restrictions, as evidenced by the extension of curfews and movement controls announced on 7 January (2), may have created a sense of contradiction or frustration among the public. This juxtaposition of hope (from vaccine availability) and constraint (from ongoing restrictions) appears to have resulted in a complex and volatile sentiment landscape.
Interestingly, the partial reopening of high schools on 25 January (5) does not seem to have had an immediate, significant positive impact on overall sentiment, but the overall sentiment of the public seemed to be improving in the following days. This suggests that while educational policies were important, their effect on public sentiment may have been overshadowed by broader concerns about the pandemic and its management.
In conclusion, this analysis of the above selected days underscores the intricate relationship between public health policy announcements, vaccine developments, and public sentiment. It highlights the challenges faced by policymakers in managing public expectations and reactions during a rapidly evolving health crisis, where positive developments in one area (such as vaccine approvals) can be quickly offset by necessary but restrictive measures in others.
Refer to the ‘Sentiment Trends vs. Public Policies section on our website: https://sites.google.com/sdsu.edu/covid-19twitterdiscourseitaly/sentiment-trends-vs-public-policies?authuser=0 (accessed on 1 July 2025) for more percentage change analysis and for other important dates.

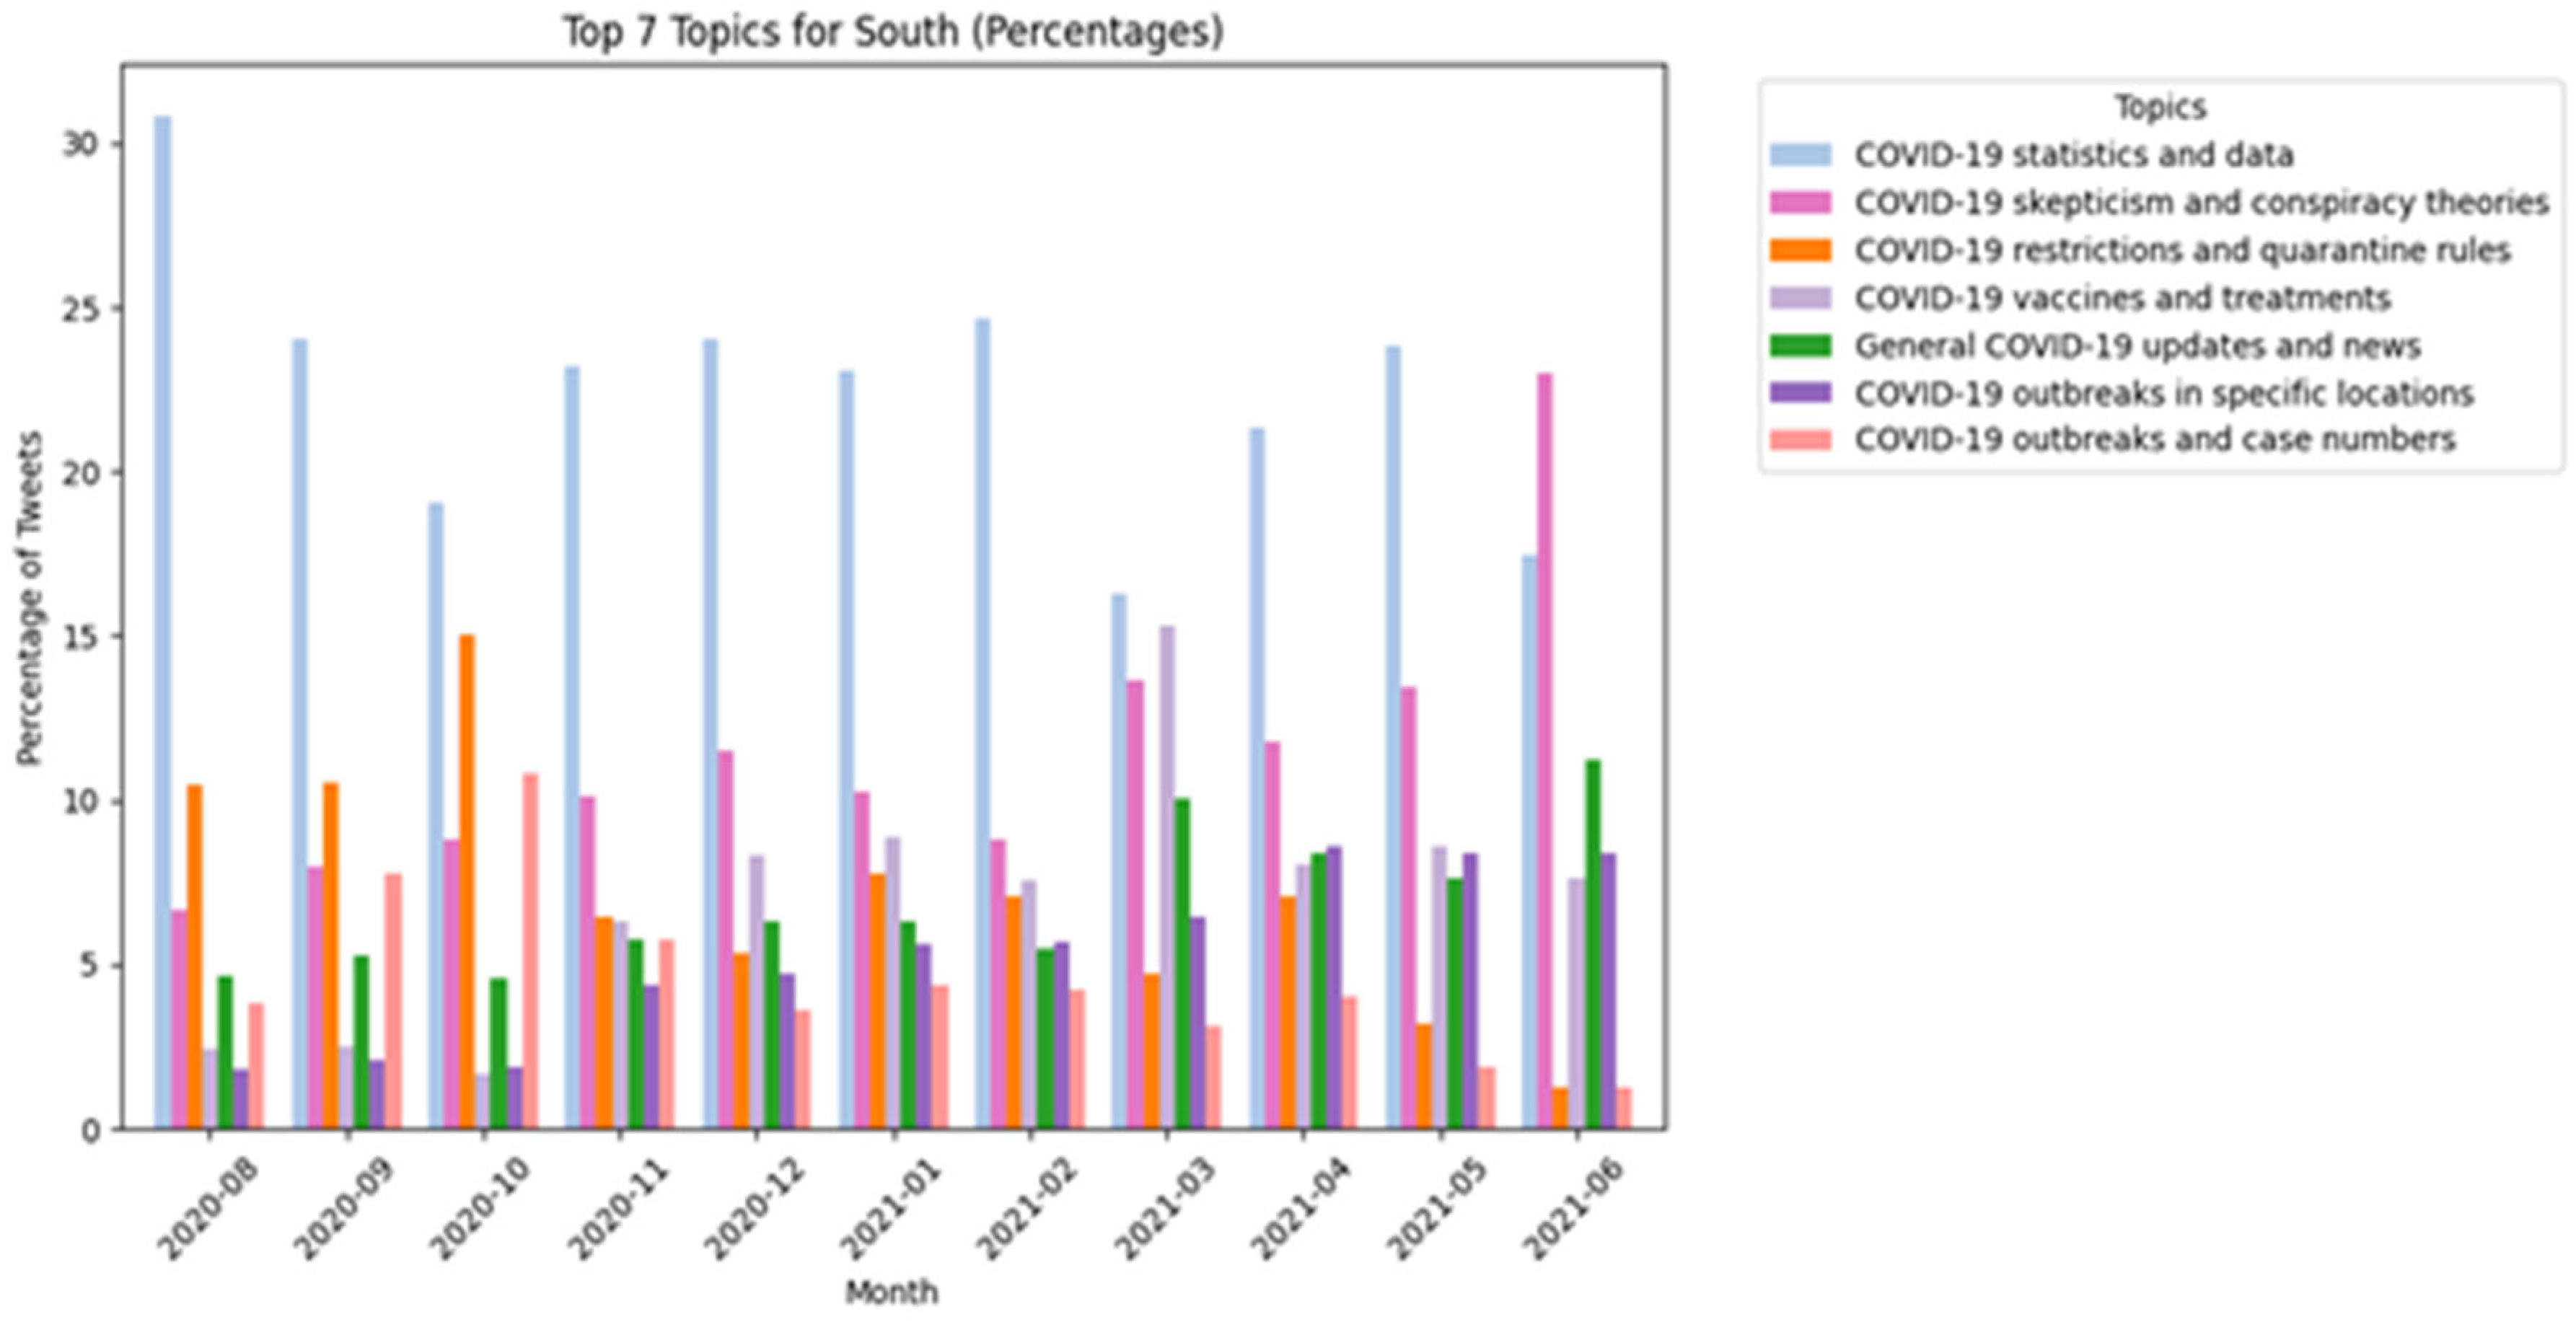
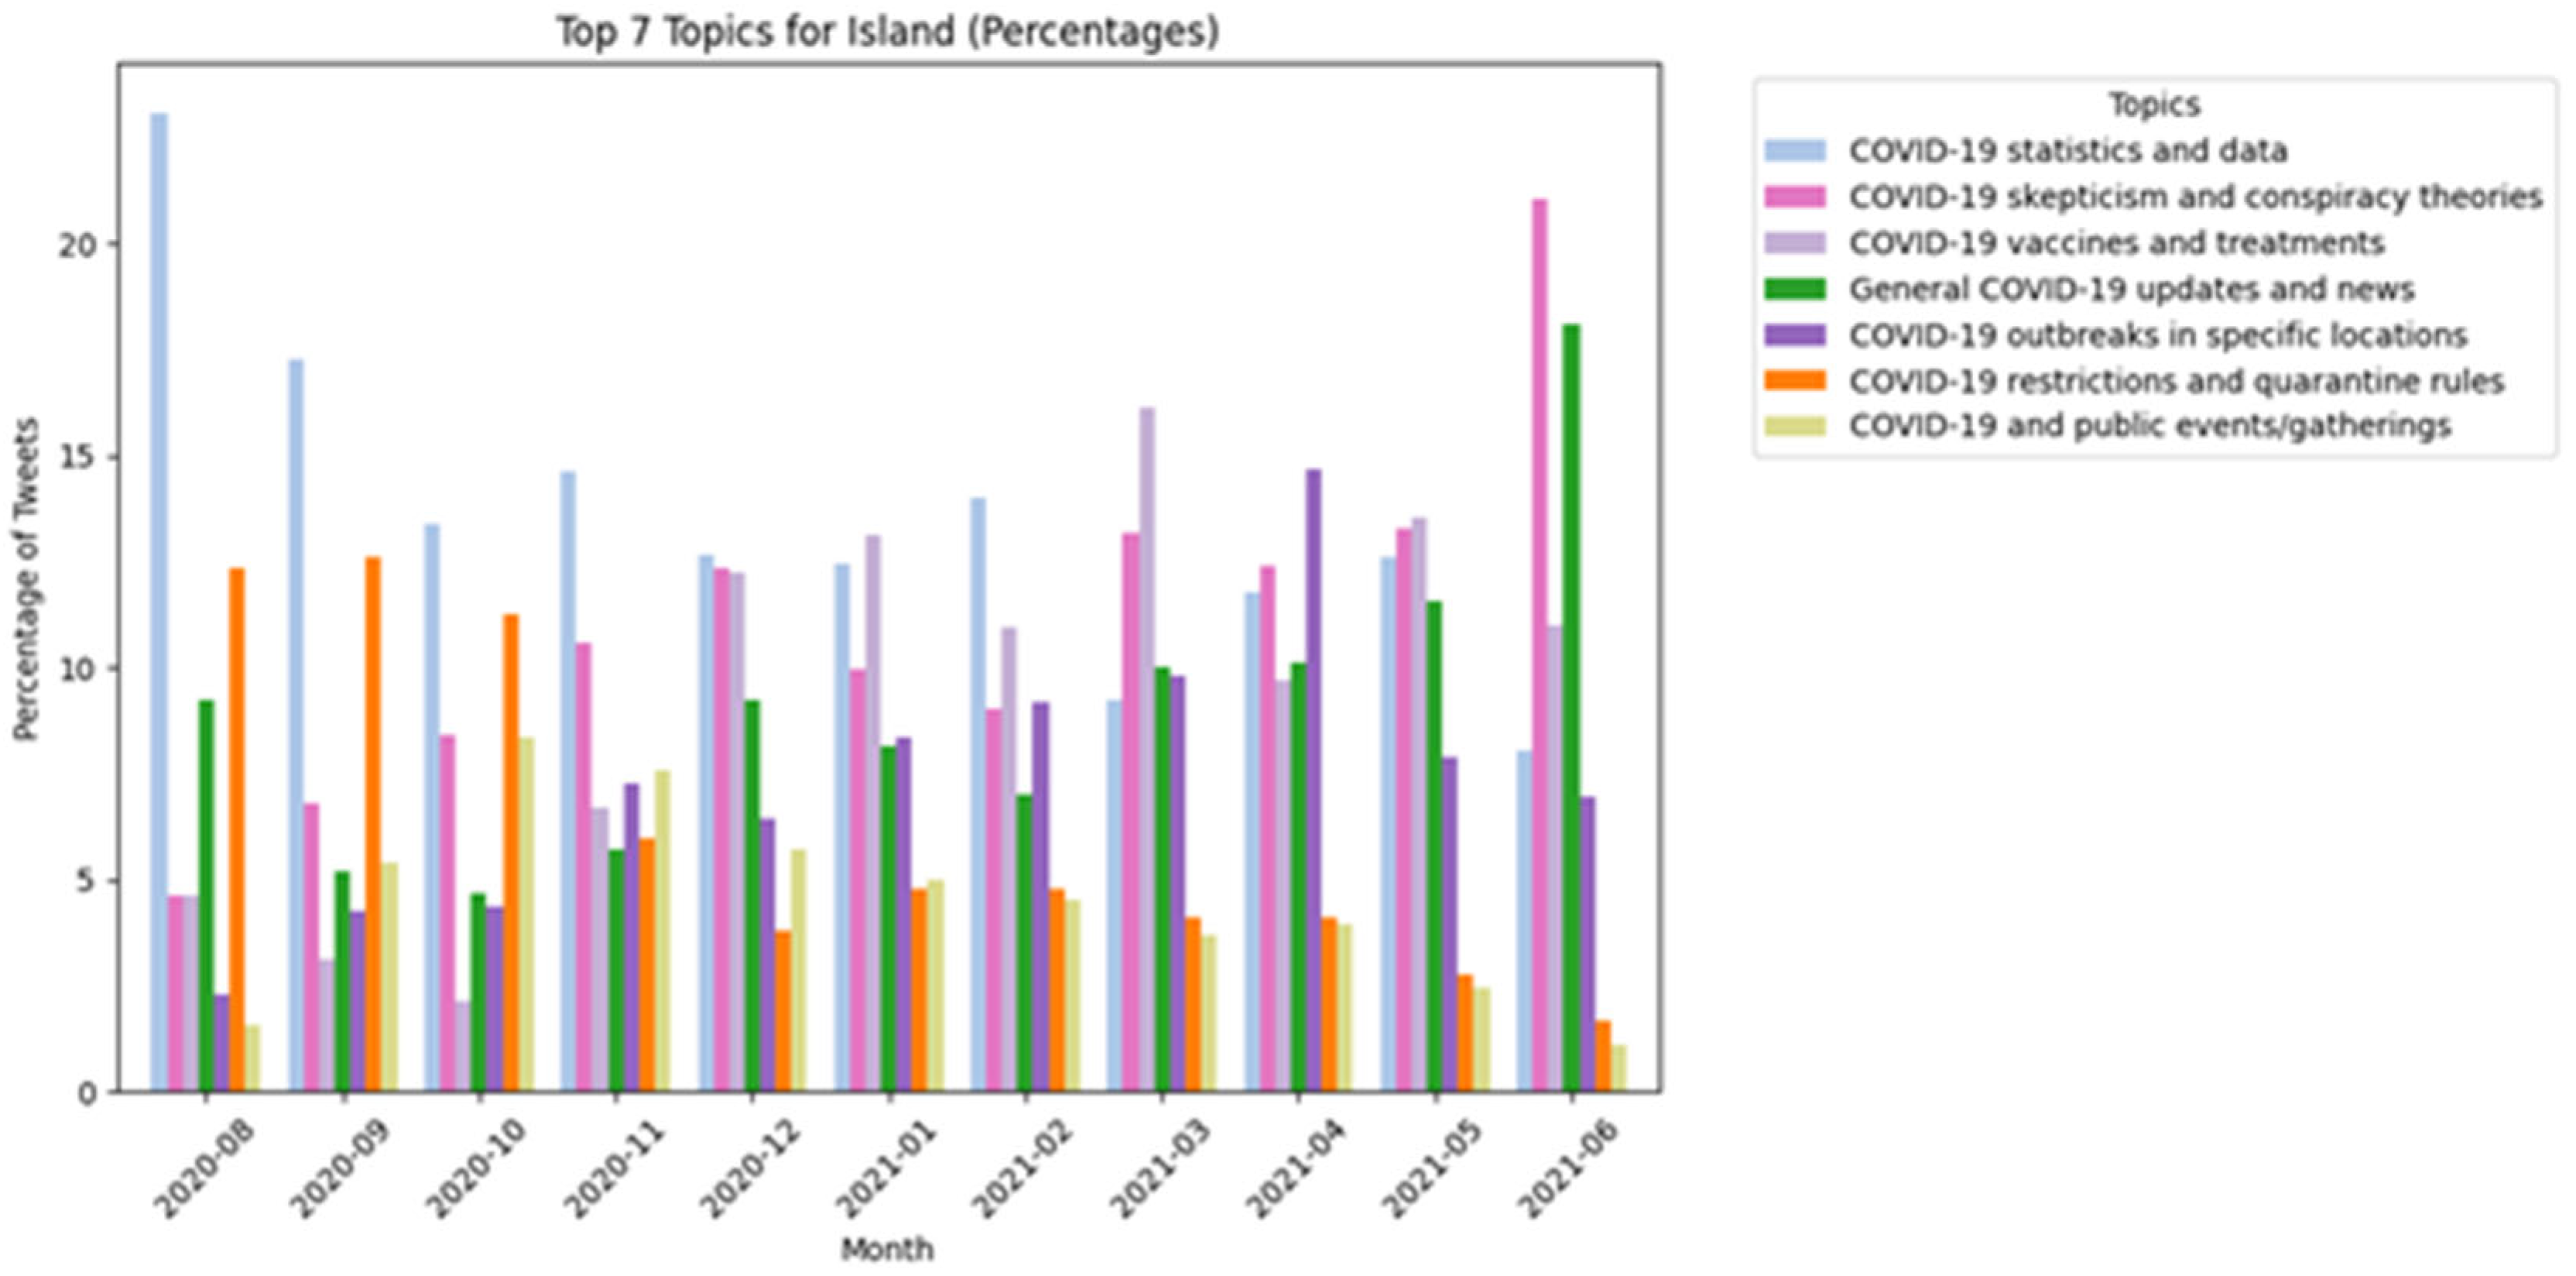
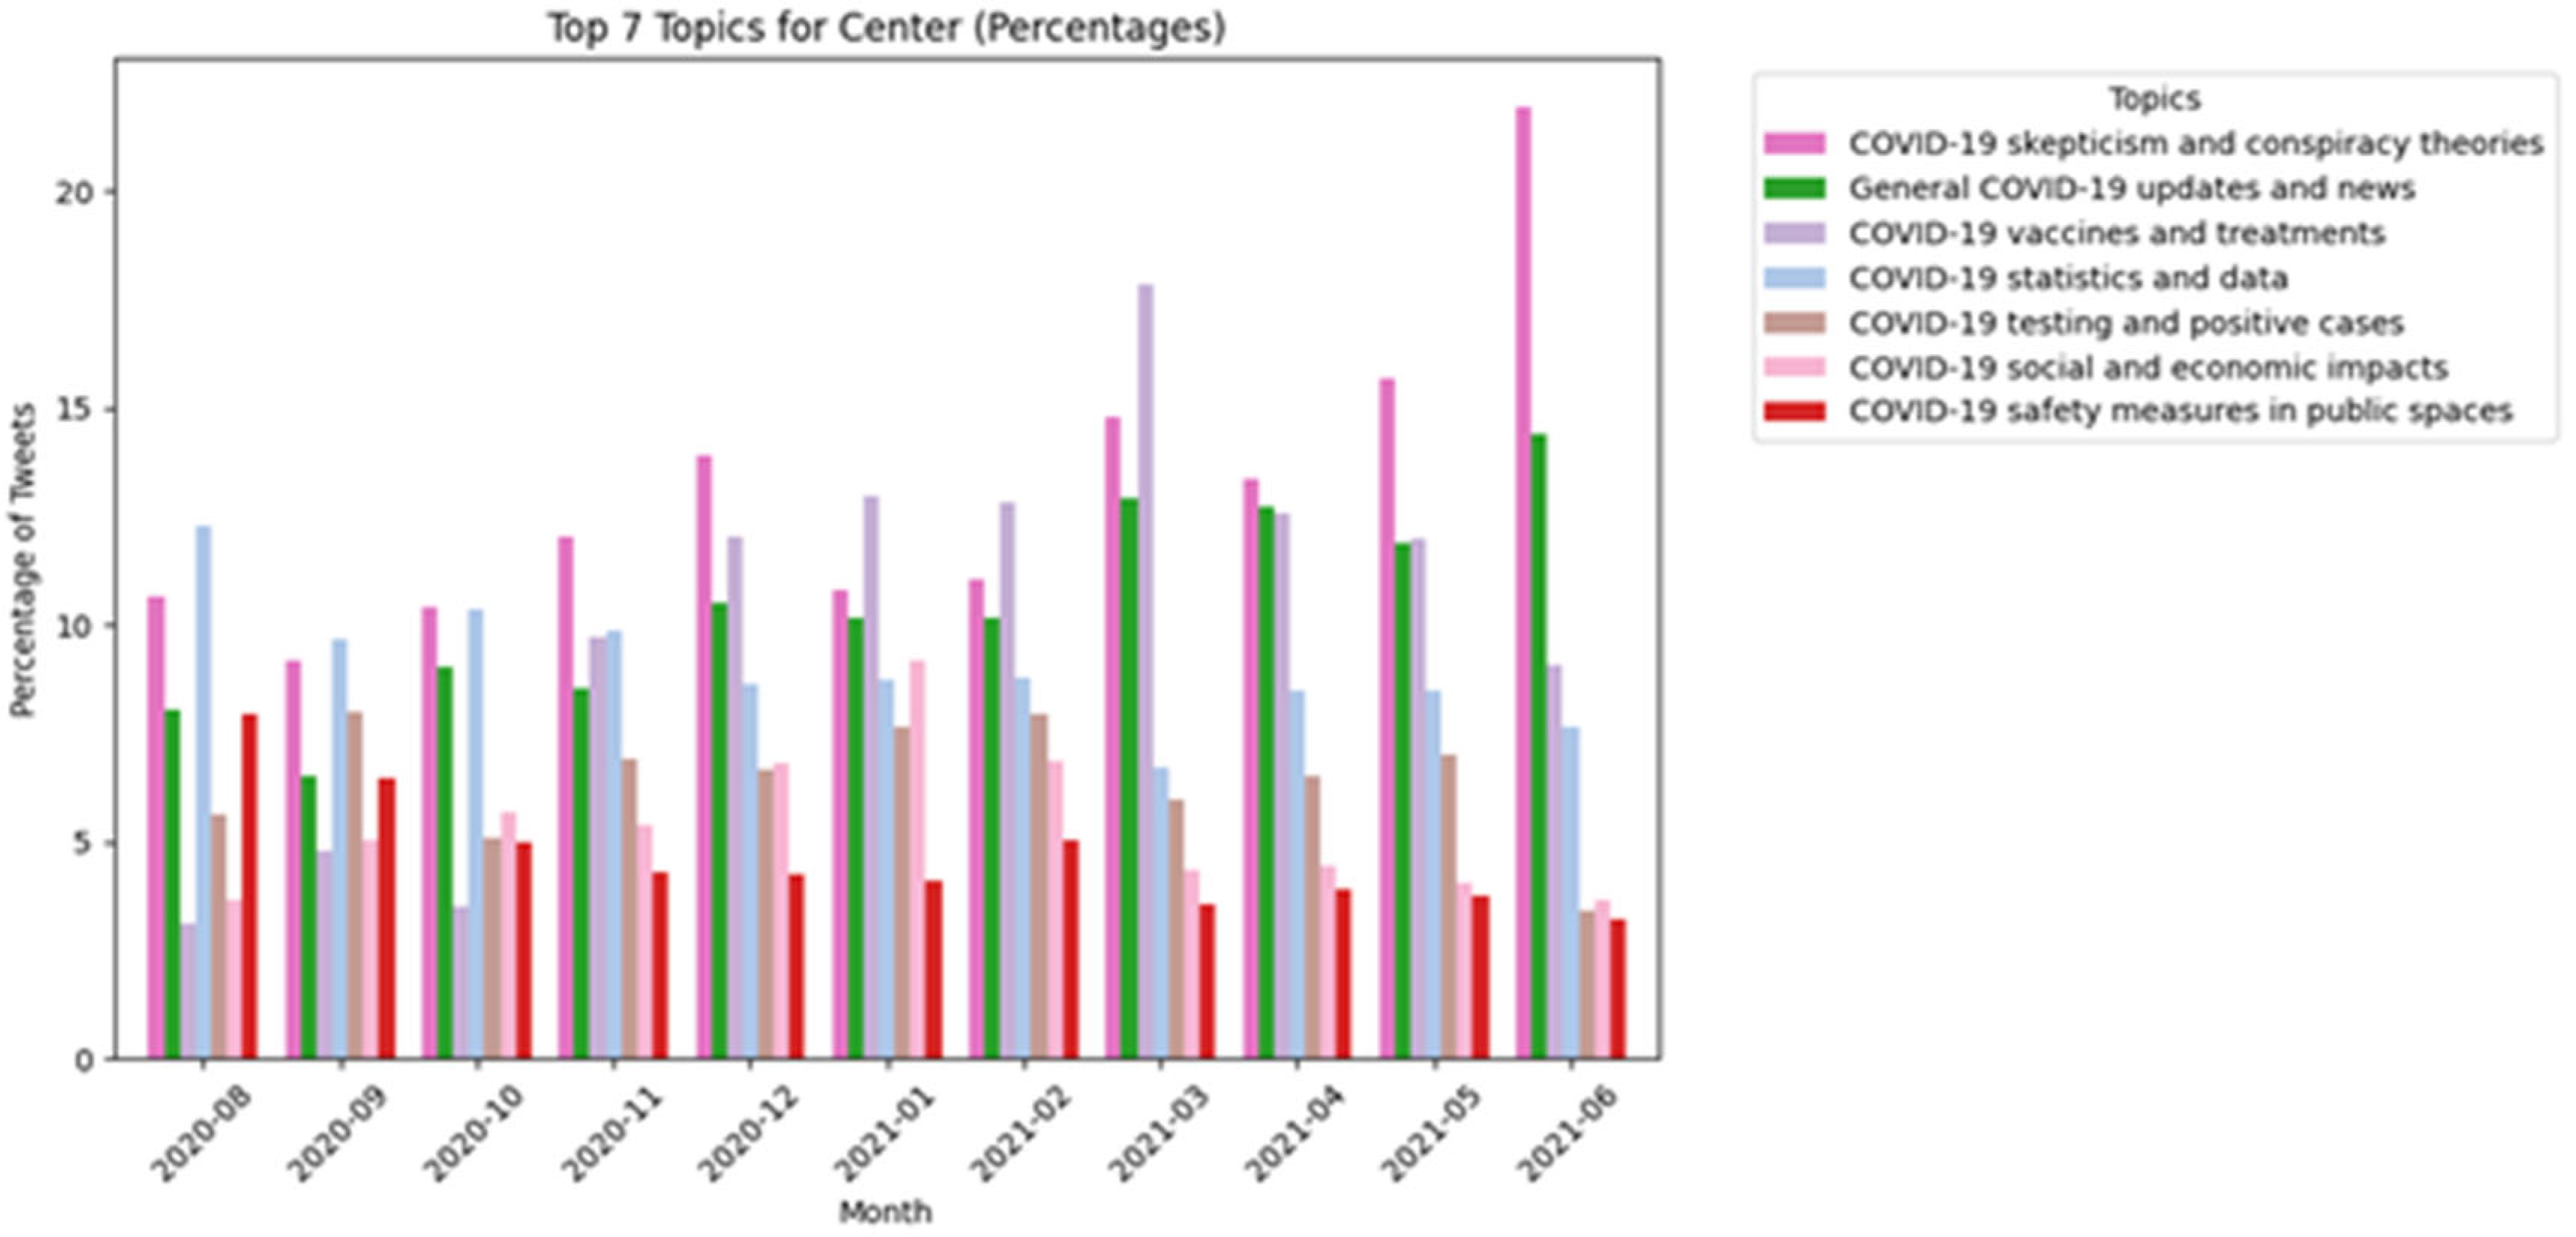
4.2. Geographical Variation in Topics

A geographical analysis revealed a noteworthy pattern across all regions—north, south, center, and islands—indicating that discussions surrounding vaccinations and treatments peaked concurrently with the widespread availability of vaccines [12].
However, significant regional disparities emerged. Some noteworthy discussions can be observed in the island regions; topics such as “COVID-19 and public events/gathering” and “COVID-19 outbreaks in specific locations” have a higher mention based on the bar graph below in Figure 6, as compared to the other regions. This indicates that discourse regarding these topics was notably more pronounced; this likely reflects their reliance on tourism and tighter community networks, amplifying concerns about superspreader events.
The discourse in the center region, particularly in urban areas like Rome and Florence, showed a higher volume of tweets related to the topic of “COVID-19 social and economic impacts” compared to other regions. This indicates a distinct emphasis on the socioeconomic consequences of the pandemic, as evidenced by the topic distribution in Figure 7. The graph also reveals that socioeconomic discussions in the center often coincided with spikes in ‘general updates’, such as during national lockdown announcements. Additionally, tweets related to topics like ‘testing/positive cases’ and ‘skepticism/conspiracy theories’ remained consistently high, suggesting that Twitter users in these urban areas were actively engaged in discussions aimed at explaining both the consequences of the pandemic and the surrounding theories.
Additionally, in the southern and northern regions, throughout the timeline, there are fluctuations in topic prevalence that reflect changing regional concerns. For further visual representation and a detailed explanation of these regions, refer to the graphs in the Appendix A.

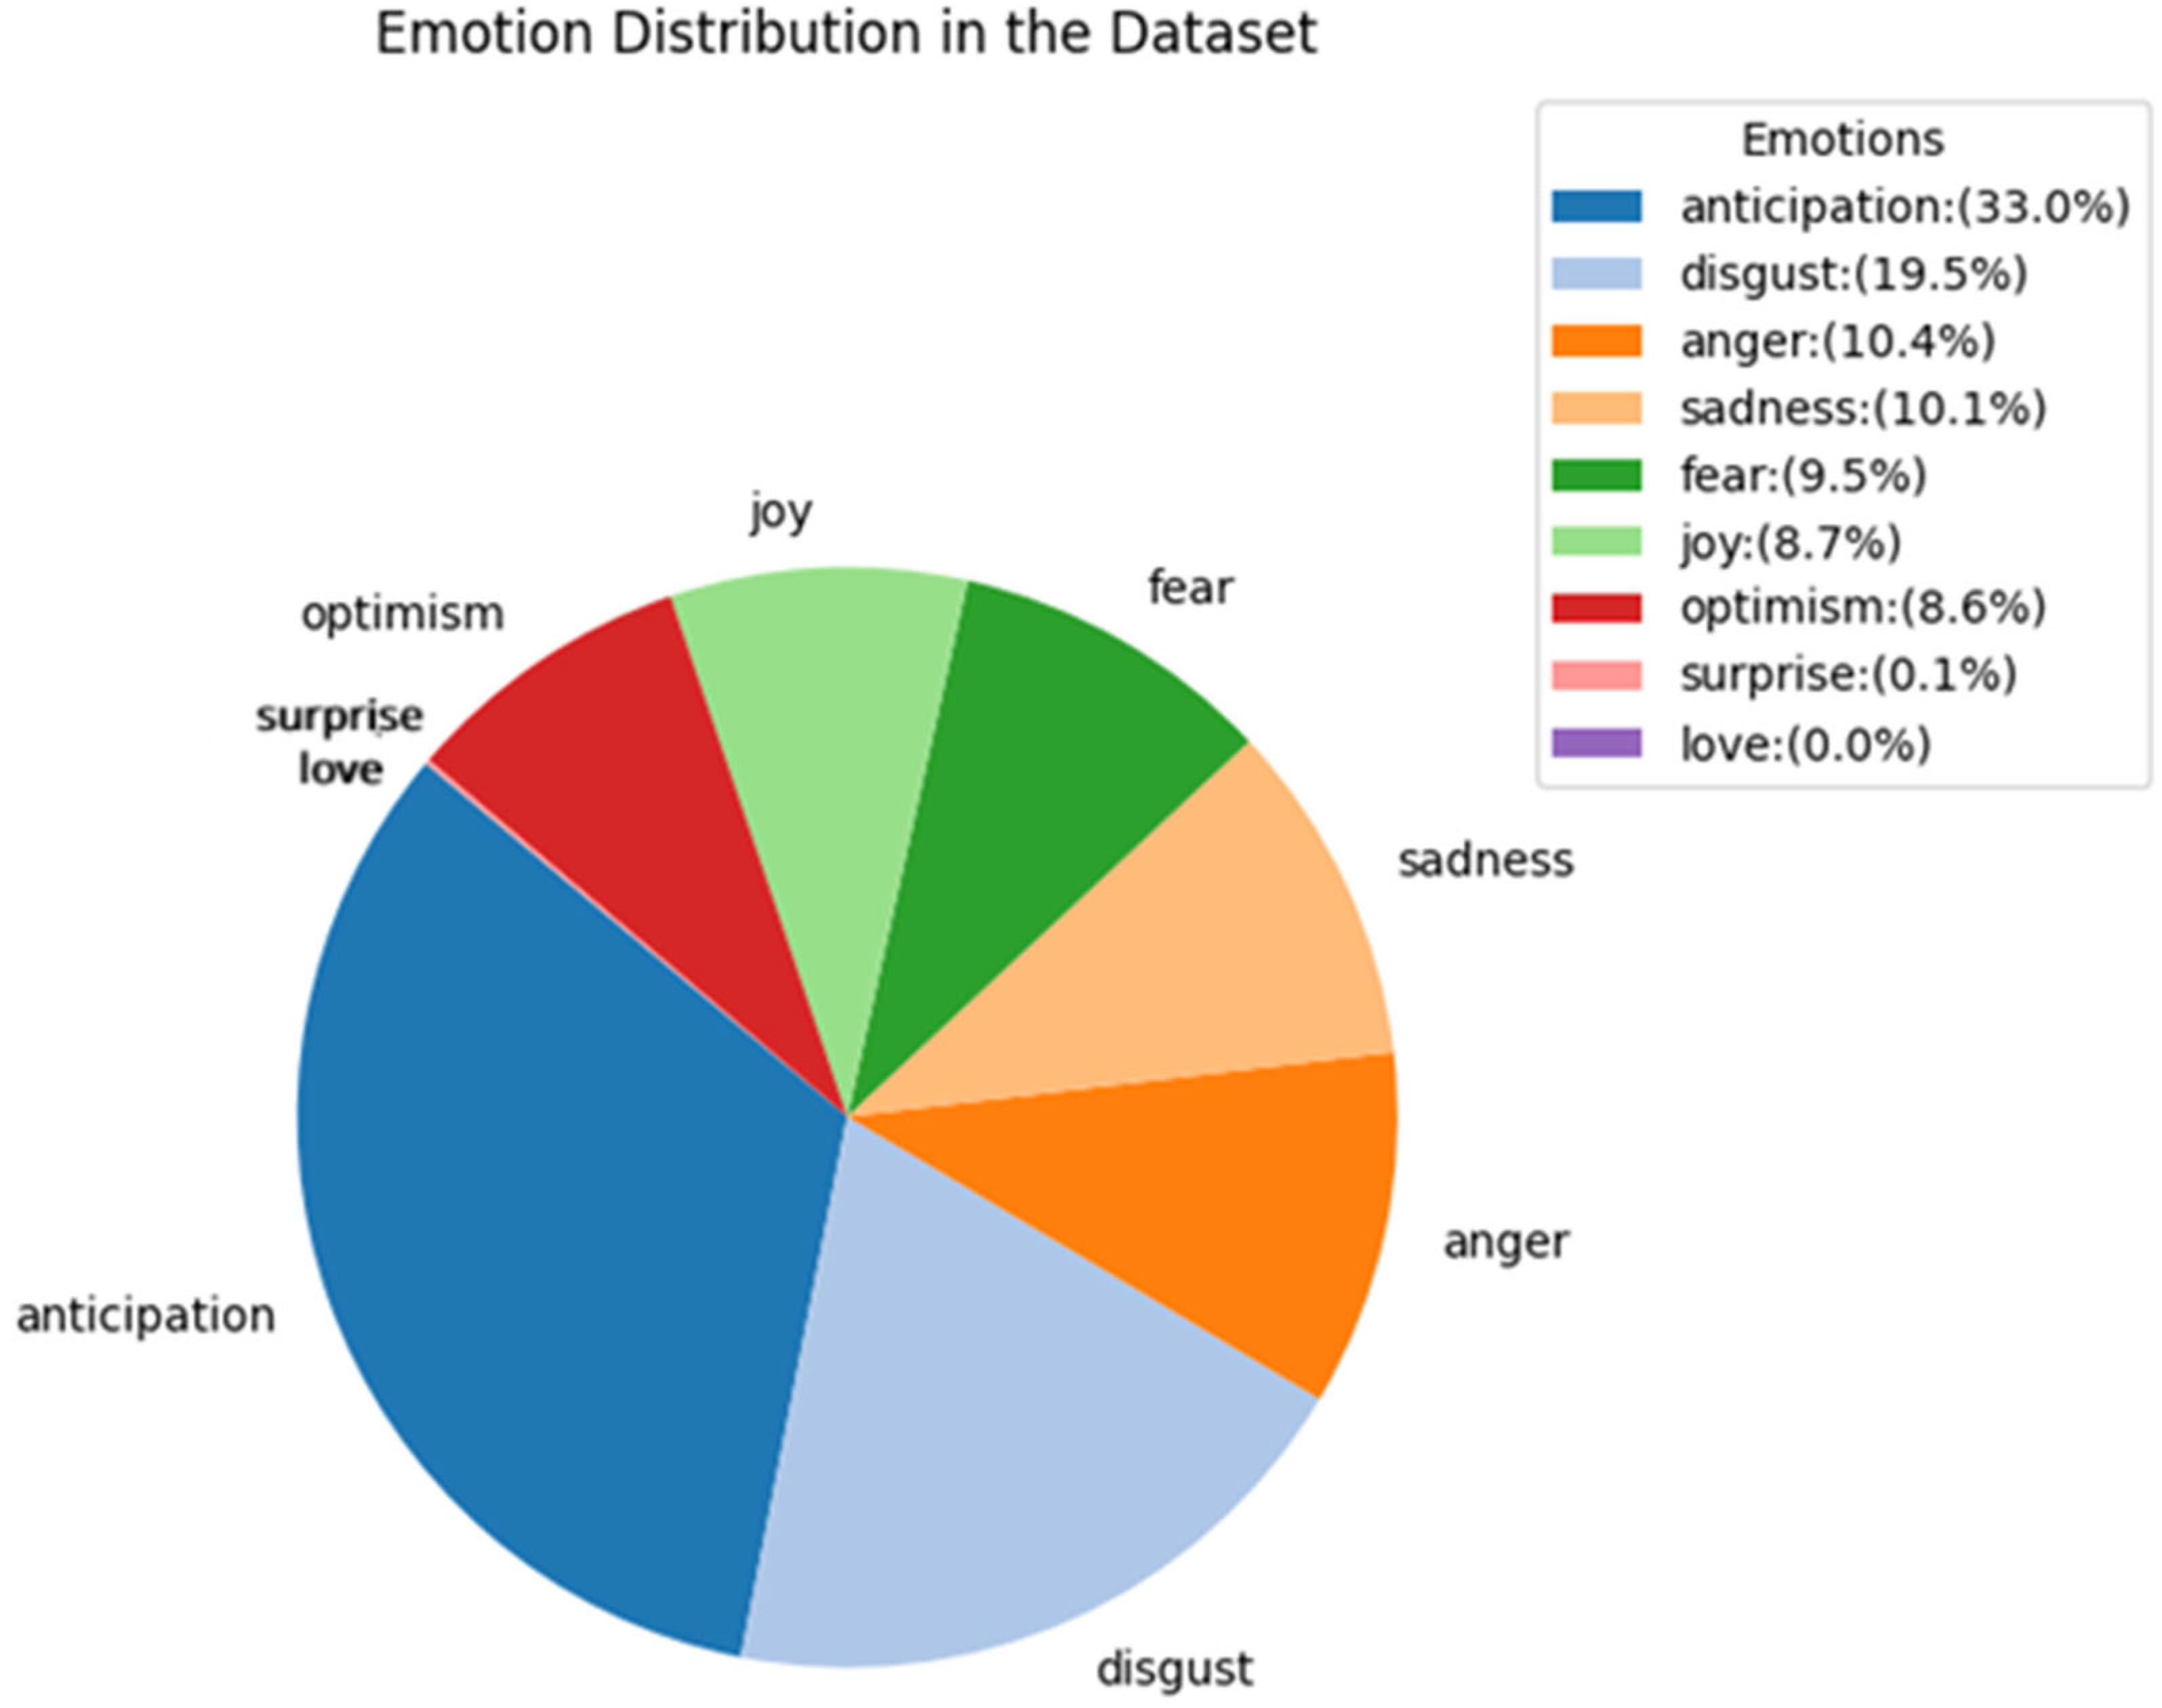
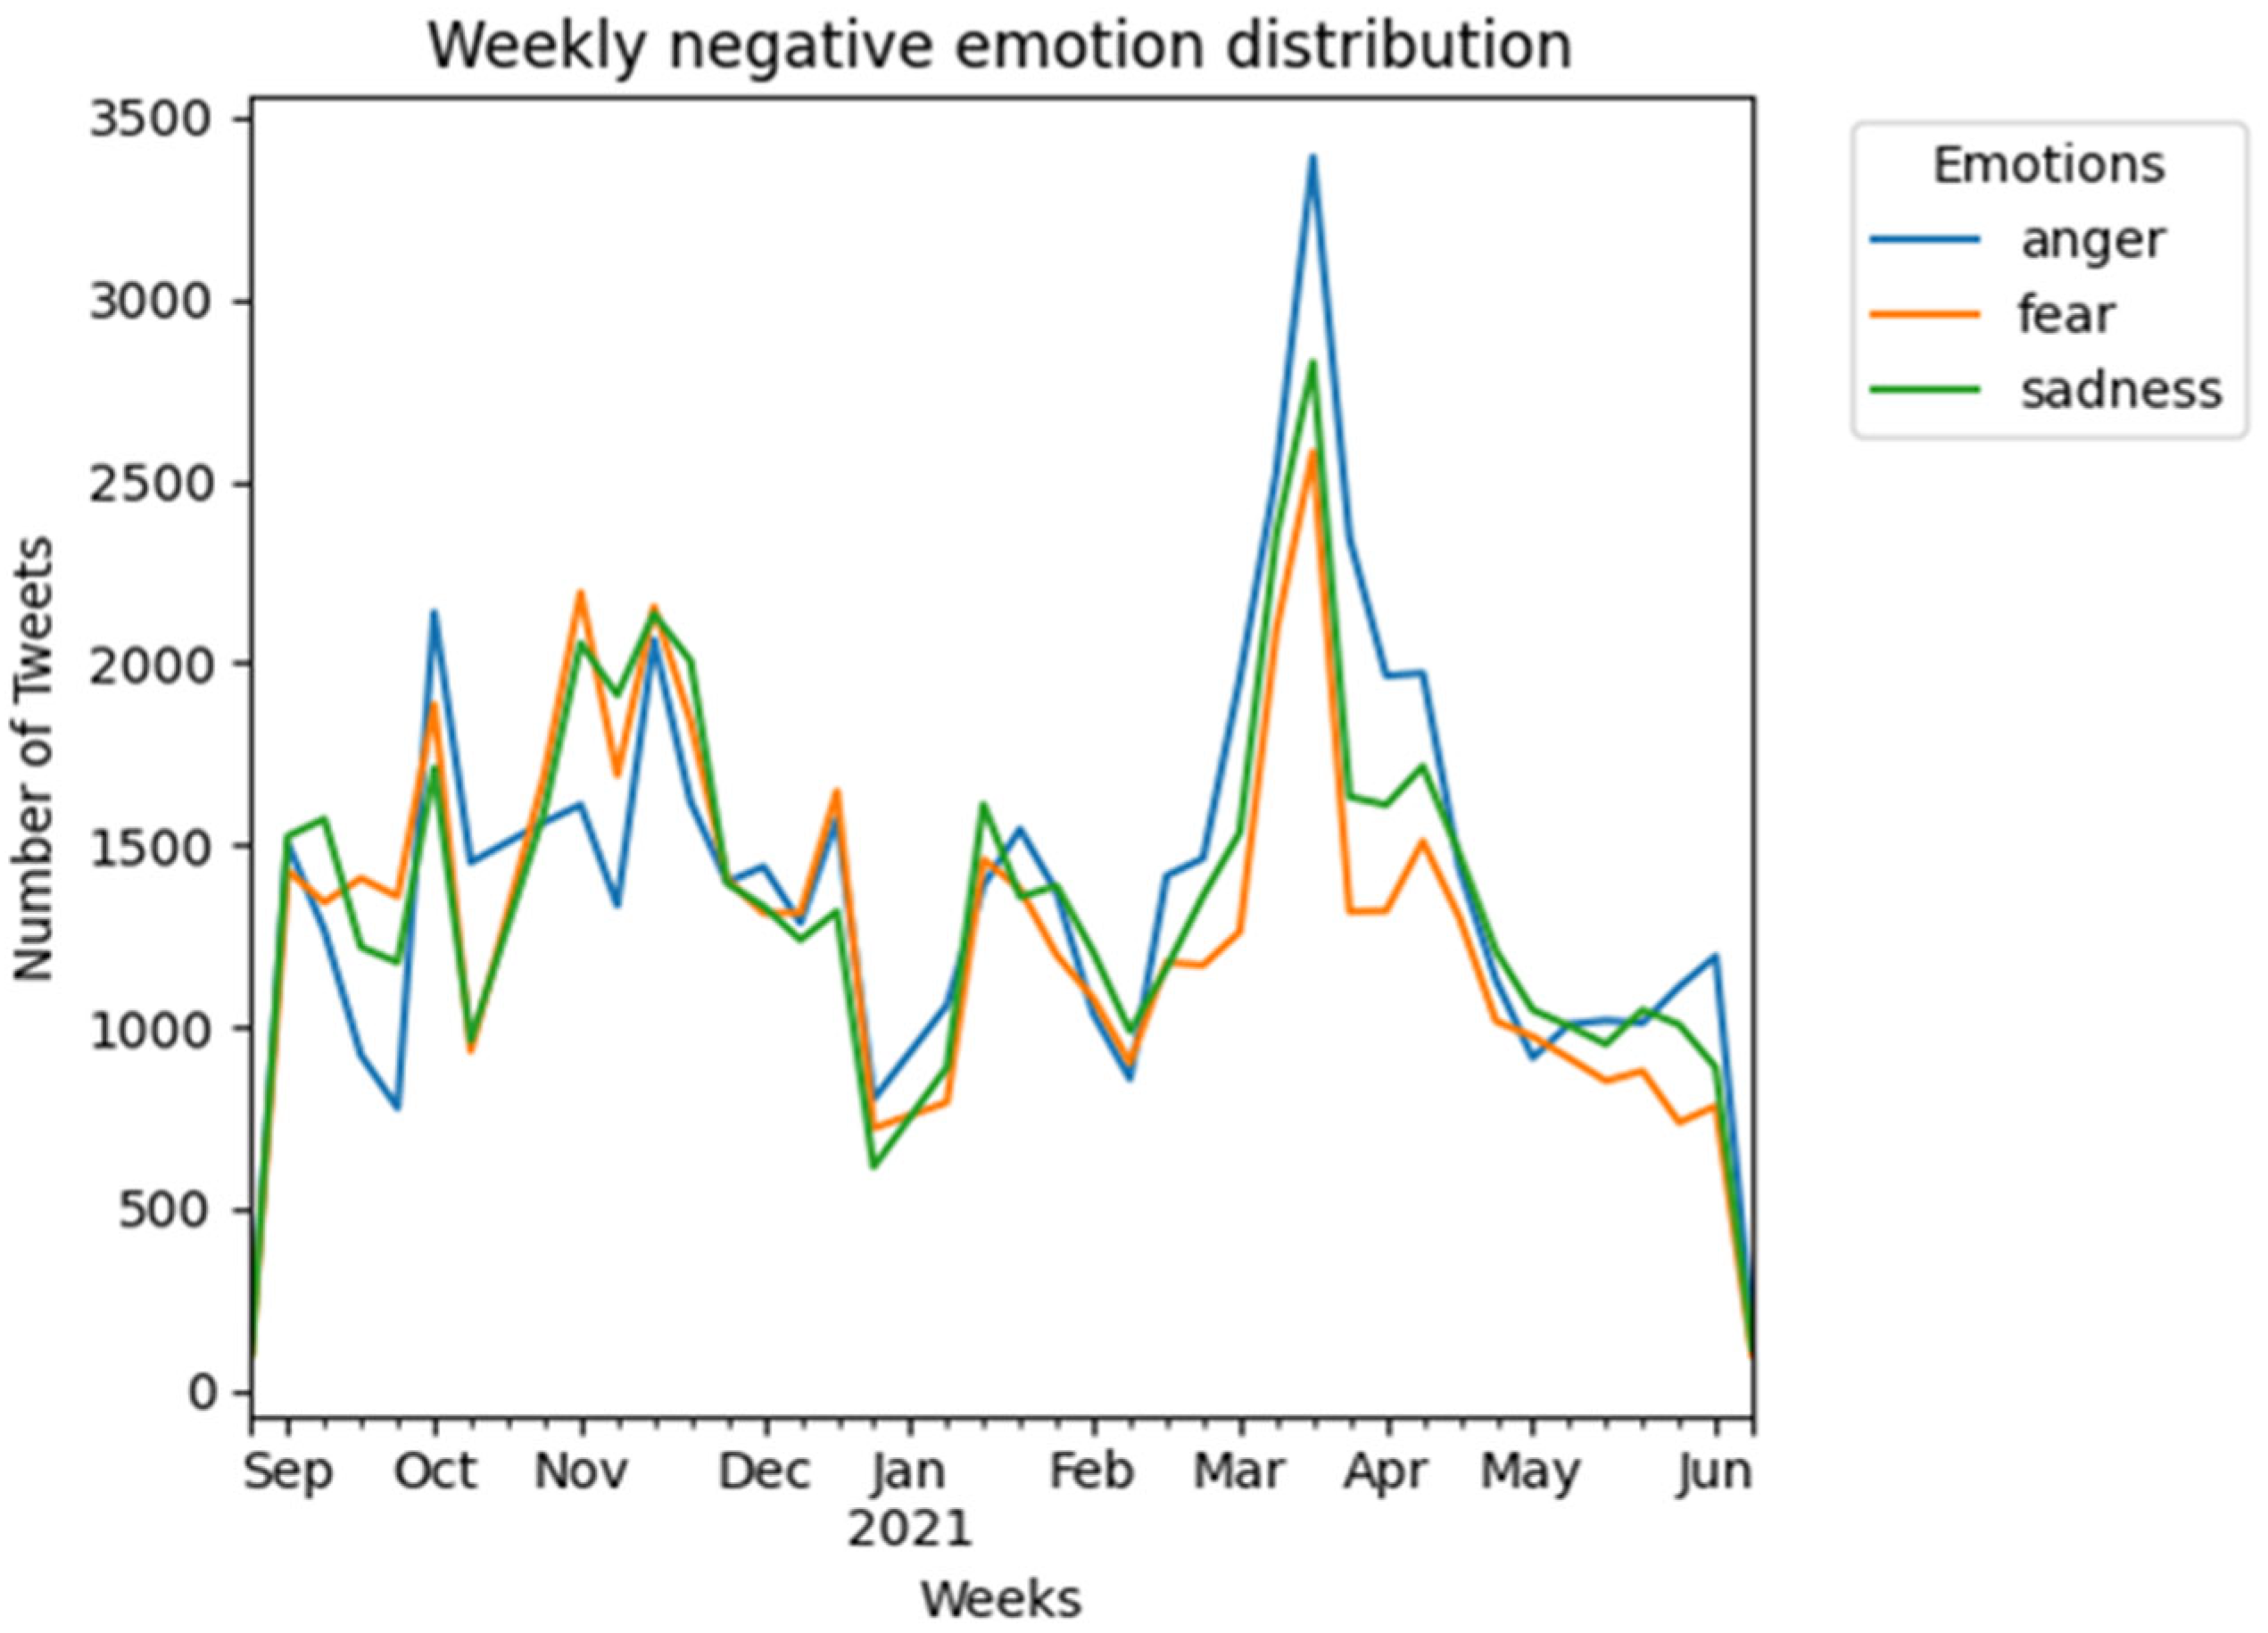
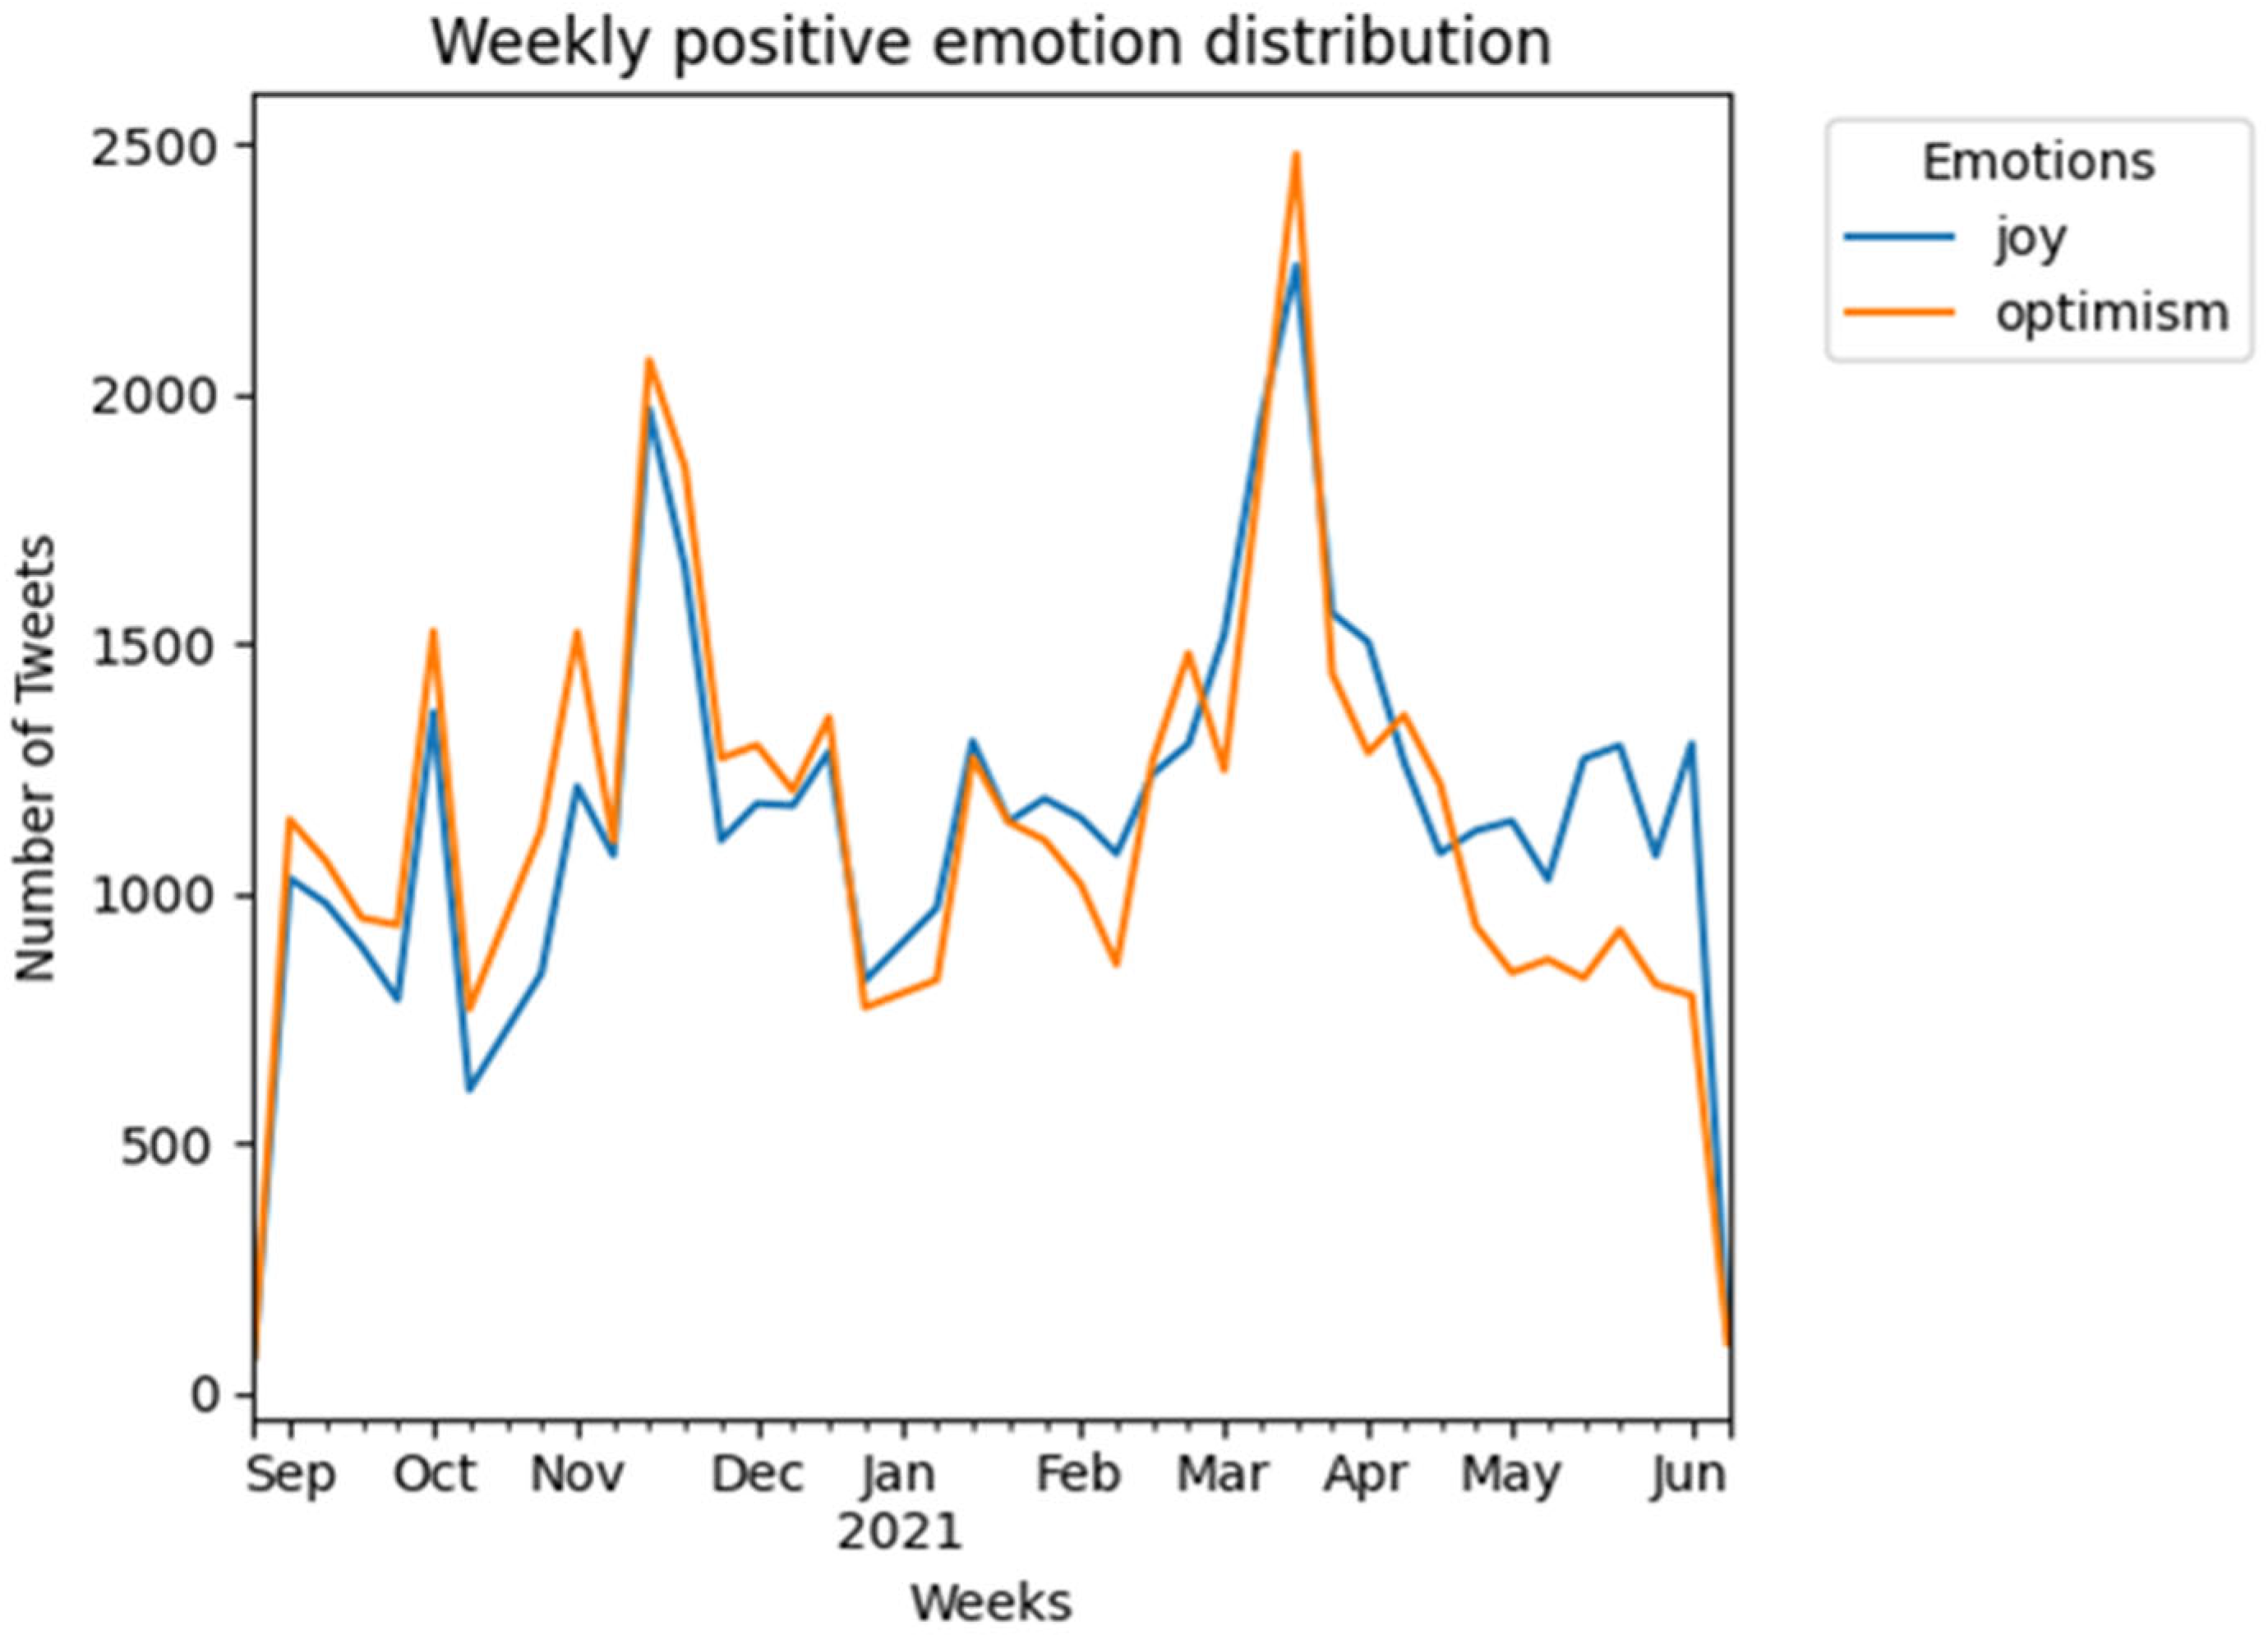
4.3. Emotional Insights

Anger, fear, and sadness peaked during lockdown restrictions in October and November of 2020 as Italy experienced a severe second wave of infections. These emotions also peaked during March 2021 as Italy reintroduced nationwide lockdown and tighter restrictions (see Figure 8).
However, optimism rose sharply in Spring 2021 (see Figure 9), coinciding with eased lockdown restrictions and widespread vaccine availability.

5. Conclusions

This research has demonstrated that social media sentiment analysis is a powerful tool for understanding public discourse during health crises. By examining over half a million tweets, this study uncovered key insights into how Italian citizens responded to the pandemic. The analysis revealed that positive sentiments were linked to vaccinations and safety measures, while negative sentiments revolved around death and frustrations with restrictions.
The quantified percentage changes in public sentiment, when analyzed in conjunction with epidemiological indicators such as recovery rates, vaccination rates, and infection curves, provide a comprehensive framework for assessing the effectiveness of implemented policies during the COVID-19 pandemic. This multidimensional approach allows a nuanced evaluation of policy impacts, considering both public health outcomes and societal responses. By correlating sentiment fluctuations with specific policy implementations and their subsequent effects on disease metrics, policymakers can gain valuable insights into the public’s receptiveness to various measures and their ultimate efficacy in controlling the spread of the virus. Furthermore, this integrated analysis can reveal potential time lags between policy implementation, public sentiment shifts, and observable changes in health outcomes, thereby informing more precise and timely policy adjustments.
These findings offer practical implications for public health messaging, highlighting the importance of addressing specific public concerns and employing real-time data to monitor public opinion.

5.1. Public Health Implications

The insights derived from this study have significant implications for public health communication and policy formulation. The methodological framework developed in this study offers a robust approach for real-time monitoring of public sentiment in response to health measures. This approach enables public health officials to track the immediate and evolving reactions of the public to implemented policies and helps to identify emerging concerns or misconceptions within the public discourse. Such timely insights can inform the adjustment of communication strategies, allowing more responsive and effective public health messaging.
Moreover, the analysis of sentiment fluctuations following policy announcements provides valuable guidance on the optimal timing for introducing new measures. This study underscores the importance of preparatory communication preceding the implementation of new health policies. It also highlights the necessity for sustained supportive communication in the aftermath of policy implementation, ensuring continued public understanding and compliance. Ultimately, this holistic methodology not only enhances our understanding of policy effectiveness but also provides a data-driven foundation for developing more targeted, acceptable, and impactful public health strategies in future crisis scenarios.
The geographical variation in discourse topics across Italian cities and regions reveals how local sociopolitical, economic, and cultural contexts shaped public engagement during the pandemic. While discussions around vaccinations peaked nationwide, region-specific concerns emerged—such as public gatherings and tourism-related risks in the islands, socioeconomic impacts in central urban centers, and data-driven discourse in the south. Milan emphasized hospitals and vaccines, reflecting its healthcare role, whereas Rome focused on lockdowns, linked to its political and tourism significance. These differences highlight the limitations of a one-size-fits-all communication strategy and emphasize the need for geographically tailored messaging. The north’s increasing skepticism and the south’s consistent demand for factual updates illustrate the necessity of adaptive communication strategies that evolve alongside regional sentiment shifts. Integrating spatially granular sentiment and topic modeling into future public health frameworks can help design more targeted, responsive, and trusted interventions—ultimately improving public adherence and enhancing the effectiveness of crisis communication.

5.2. Limitations and Future Research

Several limitations must be acknowledged. The use of Google Translate introduces potential inaccuracies in sentiment analysis due to lost nuance in translation. Additionally, reliance on Twitter data may not fully represent the sentiments of the broader population, particularly older demographics or those without access to social media. Future research could expand to include data from other platforms, such as Facebook or Instagram, or incorporate more sophisticated translation techniques.
Future studies might also consider analyzing other aspects of social media discourse, such as misinformation spread or the role of influencers in shaping public sentiment. Finally, a comparative analysis between Italy and other European countries could provide further insights into cross-cultural responses to the pandemic.

Author Contributions

Conceptualization, G.F., S.S.-B. and D.V.; methodology, G.F. and S.S.-B.; software, S.S.-B.; validation, G.F. and S.S.-B.; formal analysis, G.F. and S.S.-B.; investigation, G.F., S.S.-B. and D.V.; resources, G.F.; data curation, G.F., S.S.-B. and D.V.; writing—original draft preparation, G.F. and S.S.-B.; writing—review and editing, G.F. and S.S.-B.; visualization, S.S.-B.; supervision, G.F. and D.V.; project administration, G.F. All authors have read and agreed to the published version of the manuscript.

Funding

This research received no external funding.

Institutional Review Board Statement

Not applicable for studies.

Informed Consent Statement

Not applicable for studies.

Data Availability Statement

Data is available upon request.

Conflicts of Interest

The authors declare no conflicts of interest.

Appendix A

More information can be found on our website: https://sites.google.com/sdsu.edu/covid-19twitterdiscourseitaly/home (accessed on 1 July 2025).
The following table provides Twitter API keywords and hashtags extracted data.
Table A1. Twitter keywords and hashtags extracted data.
COVID-19
Coronavirus
CoronavirusOutbreak
coronavirusitaly
racism
razzismo
COVID2019
COVID19italy
Flu
ItalyCoronavirus
Influenza
Lombardy
Italyquarantine
quarantineItaly
Covid
Amuchina
quarantena
focolai
zonarossa
Lombardia
COVID19italia
Coronaviriusitalia
Italiani all’estero
Covid2019italia
Coronavirusitalia
CoronavirusItalla
Codogno
Contagiati
Contagio
Figure A1. Milan geocoding Twitter data and Geocode status and buffer tweets in cities.
Msf 33 00003 g0a1
Figure A2. Example top retweet by Matteo Salvini, Italian politician.
Msf 33 00003 g0a2
Figure A3. Word cloud of 20 topics.
Msf 33 00003 g0a3
As seen in the bar graph below in Figure A4 for the southern region, the dominant topic throughout the period is “COVID-19 statistics and data”, which consistently maintains the highest percentage of tweets each month. Other notable topics, such as “COVID-19 skepticism and conspiracy theories” and “COVID-19 outbreaks and case numbers”, fluctuate in prominence but generally rank below statistics and data. Topics like “COVID-19 vaccines and treatments” and “COVID-19 restrictions and quarantine rules” show varying degrees of activity, with some spikes during specific months, reflecting the lockdown policies and the vaccination campaigns and possibly indicating changing public concerns or pandemic developments. Overall, the focus appears to shift slightly among secondary topics, but the primary emphasis remains on data and statistics.
Figure A4. Top 7 topics for south by month.
Msf 33 00003 g0a4
The data in the bar graph below in Figure A5 for the northern regions reveals significant patterns, including a major spike in general COVID-19 updates around December 2020, reaching nearly 30%, and the growing prominence of skepticism and conspiracy theories over time, peaking at approximately 25% by June 2021. Vaccine and treatment discussions became more prevalent in late 2020 and early 2021, during the vaccination campaigns. While all topics show monthly fluctuations that reflect shifting public interests. This region has the highest population in the dataset, which explains the diverse range of COVID-19 topics being discussed and their varying intensity throughout the pandemic period.
Figure A5. Top 7 topics for the north by month.
Msf 33 00003 g0a5
Figure A6. Emotions tagged in the entire dataset.
Msf 33 00003 g0a6

References

  1. Fernandez, G.; Maione, C.; Yang, H.; Zaballa, K.; Bonnici, N.; Carter, J.; Spitzberg, B.H.; Jin, C.; Tsou, M.-H. Social Network Analysis of COVID-19 Sentiments: 10 Metropolitan Cities in Italy. Int. J. Environ. Res. Public Health 2022, 19, 7720. [Google Scholar] [CrossRef]
  2. Devlin, J.; Chang, M.-W.; Lee, K.; Toutanova, K. BERT: Pre-training of Deep Bidirectional Transformers for Language Understanding. In Proceedings of the 2019 Conference of the North American Chapter of the Association for Computational Linguistics (NAACL), Minneapolis, MN, USA, 2–7 June 2019; pp. 4171–4186. [Google Scholar] [CrossRef]
  3. Blei, D.M.; Ng, A.Y.; Jordan, M.I. Latent Dirichlet Allocation. J. Mach. Learn. Res. 2003, 3, 993–1022. [Google Scholar]
  4. Akbik, A.; Bergmann, T.; Blythe, D.; Rasul, K.; Schweter, S.; Vollgraf, R. FLAIR: An Easy-to-Use Framework for State-of-the-Art NLP. In Proceedings of the 2019 Conference of the North American Chapter of the Association for Computational Linguistics: Demonstrations, Minneapolis, MN, USA, 2–7 June 2019; pp. 54–59. [Google Scholar]
  5. Lorenzoni, V.; Andreozzi, G.; Bazzani, A.; Casigliani, V.; Pirri, S.; Tavoschi, L.; Turchetti, G. How Italy Tweeted about COVID-19: Detecting Reactions to the Pandemic from Social Media. Int. J. Environ. Res. Public Health 2022, 19, 7785. [Google Scholar] [CrossRef]
  6. Hutto, C.; Gilbert, E. VADER: A Parsimonious Rule-Based Model for Sentiment Analysis of Social Media Text. In Proceedings of the International AAAI Conference on Web and Social Media, Ann Arbor, MI, USA, 1–4 June 2014; Volume 8, pp. 216–225. [Google Scholar] [CrossRef]
  7. Barbieri, F.; Camacho-Collados, J.; Neves, L.; Espinosa-Anke, L. TweetEval: Unified Benchmark and Comparative Evaluation for Tweet Classification. In Proceedings of the 2020 Conference on Empirical Methods in Natural Language Processing (EMNLP), Online, 16–20 November 2020; Association for Computational Linguistics: Stroudsburg, PA, USA, 2020; pp. 1644–1650. [Google Scholar]
  8. Mattei, M.; Caldarelli, G.; Squartini, T.; Saracco, F. Italian Twitter semantic network during the Covid-19 epidemic. EPJ Data Sci. 2021, 10, 47. [Google Scholar] [CrossRef] [PubMed]
  9. Fernandez, G.; Maione, C.; Zaballa, K.; Bonnici, N.; Spitzberg, B.H.; Carter, J.; Yang, H.; McKew, J.; Bonora, F.; Ghodke, S.S.; et al. The Geography of Covid-19 Spread in Italy Using Social Media and Geospatial Data Analytics. Int. J. Intell. Secur. Public Aff. 2021, 23, 228–258. [Google Scholar] [CrossRef]
  10. Zaballa, K.; Fernandez, G.; Maione, C.; Bonnici, N.; Carter, J.; Vito, D.; Tsou, M.-H. Social Response to COVID-19 SMART Dashboard: Proposal for Case Study. In International Conference on Smart Homes and Health Telematic; Springer International Publishing: Cham, Switzerland, 2022; pp. 154–165. [Google Scholar]
  11. Chang, J.; Boyd-Graber, J.; Wang, C.; Gerrish, S.; Blei, D.M. Reading tea leaves: How humans interpret topic models. In Advances in Neural Information Processing Systems, 23rd Annual Conference on Neural Information Processing Systems 2009, Vancouver, BC, Canada, 7–10 December 2009; NIPS; Curran Associates Inc.: Red Hook, NY, USA, 2009. [Google Scholar]
  12. Fernandez, G.; Suresh-Babu, S.; Vito, D. Mapping Infodemic Responses: A Geospatial Analysis of COVID-19 Discourse on Twitter in Italy. Int. J. Environ. Res. Public Health 2025, 22, 668. [Google Scholar] [CrossRef]
Figure 1. Case studies: 10 Italian cities.
Msf 33 00003 g001
Figure 2. Perplexity graph.
Msf 33 00003 g002
Figure 3. Top positive words.
Msf 33 00003 g003
Figure 4. Top negative words.
Msf 33 00003 g004
Figure 5. Percentage Sentiment change.
Msf 33 00003 g005
Figure 6. Top 7 topics in the islands by month.
Msf 33 00003 g006
Figure 7. Top 7 topics in the center by month.
Msf 33 00003 g007
Figure 8. Negative emotions distribution.
Msf 33 00003 g008
Figure 9. Positive emotions distribution.
Msf 33 00003 g009
Table 1. Ten Italian city case studies by geography.
Serial NumberGeographyCitiesRegionUnique
Tweets
PopulationPopulation
Density (/km2)
1NorthVeniceVeneto30,746858,455349
2NorthMilanLombardy132,2663,190,3402026
3NorthTurinPiedmont40,1292,293,340336
4NorthBolognaEmilia Romagna10,0781,005,831271
5CenterFlorenceTuscany30,1801,007,435 287
6CenterRomeLazio197,969 4,336,915 810
7SouthNaplesCampania62,807 3,128,702 2672
8SouthBariApulia15,056 1,251,004 327
9IslandCagliariSardinia8669 431,302 346
10IslandPalermoSicily15,451 1,276,525 255
Table 2. Twenty key topics in the COVID-19 crisis.
COVID-19 in healthcare settingsCOVID-19 statistics and dataCOVID-19 restrictions and quarantine rulesCriticism of COVID-19 measures and skepticismGeneral COVID-19 updates and news
Personal experiences with COVID-19COVID-19 safety measures in public spacesCOVID-19 outbreaks and case numbersCOVID-19 outbreaks in specific locationsCOVID-19 vaccines and treatments
COVID-19 research and medical information COVID-19 testing and positive casesCOVID-19 skepticism and conspiracy theoriesCOVID-19 social and economic impactsCOVID-19 regulations enforcement
COVID-19 public health messagingHumor and jokes about COVID-19COVID-19 and public events/gatheringsCOVID-19 and voting/electionsCOVID-19 prevention measures (masks, distancing, etc.)
Table 3. Critical dates in the COVID-19 crisis [11].
DatePolicy
14 September 2020Schools reopen in Italy, following strict health protocols after months of closure.
7 October 2020The Italian government extends the state of emergency until 31 January 2021, due to rising cases.
13 October 2020Italy introduces new containment measures, including mandatory masks outdoors and tighter restrictions on social gatherings.
24 October 2020New restrictions imposed, including closing restaurants and bars early, limiting sporting events, and encouraging remote work.
3 November 2020Italy enacts a tiered system with regional color codes (yellow, orange, red), based on the severity of the outbreak, with varying restrictions.
27 December 2020Italy launches its vaccination campaign, starting with healthcare workers and the elderly.
6 January 2021The European Medicines Agency (EMA) approves the Moderna vaccine for use in the EU.
13 January 2021The Italian government extended the state of emergency until 30 April 2021, due to the pandemic’s persistence.
15 March 2021Italy tightens restrictions once more, enforcing a nationwide lockdown over the Easter period, treating all regions as “red zones”.
26 April 2021The country began a phase reopening, including the reopening of outdoor dining and some cultural and sporting events.
23 May 2021Gyms are allowed to reopen in yellow zones under strict health and safety guidelines.
Disclaimer/Publisher’s Note: The statements, opinions and data contained in all publications are solely those of the individual author(s) and contributor(s) and not of MDPI and/or the editor(s). MDPI and/or the editor(s) disclaim responsibility for any injury to people or property resulting from any ideas, methods, instructions or products referred to in the content.

