Abstract
Intensive forestry, particularly the establishment of monospecific plantations with exotic species, can deeply impact the ecological functioning of forest streams, where riparian leaf litter is the primary source of energy. In this study, we investigated the effects of Eucalyptus globulus afforestation on macroinvertebrate communities in 20 streams in Galicia (NW Spain) with varying levels of accumulated eucalypt leaf litter. Sampling was done in autumn 2020 and spring 2021. In autumn, six streams had leaf litter composed of >50% of eucalypt leaves, a proportion that increased to 12 streams in spring. A total of 24,705 individuals were found in autumn and 12,529 in spring, belonging to 125 taxa. Although some taxa decreased their abundance with an increase in the proportion of eucalypt litter, variability in overall macroinvertebrate abundance was mainly explained by season, stream flow, and water temperature. However, species richness and diversity were significantly lower in streams mainly subsided by Eucalyptus litter compared to those dominated by native riparian vegetation. Macroinvertebrate abundance, richness, and diversity peaked in autumn, coinciding with the influx of deciduous litterfall and lower proportion of eucalypt litter. The lower quality, low-nutrient content, and presence of feeding deterrents in Eucalyptus leaf litter compared to native deciduous tree species likely drive these observed patterns, underscoring the importance of preserving native riparian forests to sustain stream biodiversity, even in managed landscapes dominated by Eucalyptus plantations.
1. Introduction
Human activities frequently facilitate the relocation of species beyond their native ranges, whether intentionally or unintentionally [1]. Some of these introduced species become invasive, leading to biodiversity loss in the recipient ecosystems [2] and contributing to global biological homogenization [3,4]. The introduction of exotic invasive species can also incur economic costs, both directly, as pests or pathogens, and indirectly, through the disruption of ecosystem services like pollination or negative impacts on human health [5,6].
The genus Eucalyptus, native to Australia, includes species widely used in forestry such as E. globulus, E. nitens, E. grandis and E. camaldulensis, as well as their hybrids [7]. These trees are extensively cultivated to provide raw material for the paper industry [8], and large Eucalyptus plantations have been established in regions such as South Africa, Australia, South America, India, and China [9]. In Europe, the Iberian Peninsula supports large areas managed for commercial plantations of the exotic Eucalyptus globulus Labill [10], which covers approximately 1.5 million hectares [11] and has a clear invasive behavior in the region, mostly after fires [12].
This widespread cultivation raises critical concerns about the ecological impacts of Eucalyptus plantations, particularly in riparian zones where native forests are often replaced. Stream ecosystems heavily depend on organic matter inputs from riparian vegetation with leaf litter serving as the primary energy source [13,14]. This organic matter is processed by microorganisms (mainly aquatic hyphomycetes) and shredder invertebrates, which integrate it into the food web. The chemical and physical properties of leaf litter strongly influence consumers feeding activities, e.g., [15], and shifts in the composition of riparian plant species can significantly alter energy flow and biological structure of stream ecosystems, e.g., [16,17].
Removing riparian forests severely affects the ecology of aquatic trophic webs [18]. Additionally, the replacement of diverse riparian forests with monospecific Eucalyptus plantations has been shown to reduce litter quality and synchronize litterfall timing, potentially disrupting the ecological roles of shredders, decomposers, and overall organic matter breakdown [16,19]. Research in Central Portugal has demonstrated that streams running through Eucalyptus plantations host lower macroinvertebrate diversity compared to streams bordered by deciduous or mixed forests, with the shredders particularly affected [20]. This reduction in diversity is attributed to the low nutritional quality of Eucalyptus litter, which contains feeding deterrents [21,22,23] and has a low nutrient content [24,25,26]. Similar findings have been reported in Galicia, Northwestern Spain, e.g., [19]. However, some studies in the Basque Country, northern Spain, suggest that streams running through Eucalyptus plantations and native forests exhibit comparable litter breakdown rates in the long term, although shredder densities remain lower in rivers dominated by eucalypt inputs [27].
Climatic conditions may explain these geographic disparities in the effects of eucalypt plantations on macroinvertebrate communities [28]. Northern Spain’s humid climate ensures relatively stable flows throughout the year, while Central Portugal experiences dry summers, adding stress upon macroinvertebrates feeding on Eucalyptus leaf litter [28]. The intensity of plantation management is also a crucial factor that determines the ability of eucalypt plantations to offer substitutive habitats for wildlife [9], particularly when understory species are eliminated. In this study, we document the ecological impacts of Eucalyptus plantations on the structure and function of aquatic macroinvertebrate assemblages in Galicia, Northwest Spain. This region has the largest area of eucalypt plantations of Spain, but their effects on small streams remain understudied. We hypothesize that the low quality of Eucalyptus litter negatively affects macroinvertebrate communities, reducing abundance, richness, and diversity in streams dominated by Eucalyptus inputs in comparison to those surrounded by mixed deciduous forests. We compared autumn and spring communities, as the native vegetation loses its leaves in autumn, in contrast to eucalypts, which lose their leaves mainly in summer [29]; therefore, we expected more diverse communities in autumn. Additionally, we also hypothesized that shredder taxa would be more strongly affected and that generalist feeders (e.g., filterers of fine Particulate Organic Matter) would dominate in streams influenced by Eucalyptus inputs. To test these hypotheses, we compared macroinvertebrate communities in 20 streams with varying levels of Eucalyptus litter input in Galicia, which shares a humid climate with northern Spain but also experiences dry summers like Central Portugal.
2. Materials and Methods
2.1. Study Area
The study was carried out in streams of Galicia (Northwestern Spain), a region characterized by a sub-Mediterranean climate [30]. Annual rainfall exceeds 1000 mm in 80% of the region’s climatic stations, with some areas receiving annual maxima exceeding 3000 mm. The months with the highest precipitation are typically from November to January, while July and August are the driest months [30]. Floristically, the area represents a transition between the Atlantic and the Mediterranean ecosystems; thus, coexisting are the deciduous oak forests dominated by Quercus robur L. and the evergreen oak forest, with Quercus suber L. and other Mediterranean species [31].
Approximately 28% of tree cover in Galicia is made up of eucalypt plantations, with around 409,000 ha dominated by Eucalyptus L’Hér. species, particularly concentrated along the coastal areas [32]. We sampled 20 streams in 10 localities (see Table A1). In each locality, we selected one stream predominantly running through Eucalyptus globulus Labill. plantations and another bordered by native deciduous forests. This design avoided spatial clustering of each type of stream. In native forests, the most abundant tree species were oak (Quercus robur), chestnut (Castanea sativa Mill.), and alder (Alnus glutinosa (L.) Gaertn.). Sampling was carried out in the fall of 2020 and spring of 2021. The average straight-line distance between each pair of streams was 3.5 ± 0.6 km (mean ± SE), estimated using Google Earth Pro 7.3.6.10201 software (further details in the Supplementary Information).
2.2. Sampling Methods
Macroinvertebrates were sampled at each site along a 12 m longitudinal transect, which was divided into three 4 m sections, where we sampled all microhabitats. In each section, we took samples with a D-net with 500 µm mesh size (four kicks per section, each kick covering 30 cm × 30 cm; totaling 12 kicks per transect). Samples were cleaned of large organic debris over a white tray, sieved through a 1 mm mesh sieve, placed in a labeled bag, and preserved with 70° ethanol. To estimate algal primary productivity, a stone was collected randomly from each section, transported to the laboratory in a plastic container within an ice box to extract chlorophyll-a. Stones were soaked individually in alcohol for 24 h, and chlorophyll absorption was measured at 750 nm and 664 nm using a spectrophotometer. Chlorophyll-a concentration was calculated following Lowe and LaLiberté [33]. After biological sampling, we measured stream flow across the entire channel width (every 5–10 cm), using a current meter (Global Water FP111, Spectrum Technologies, Inc. Aurora, IL, USA). Water velocity was measured moving the spin-wheel across the channel width making slow and wave-like movements to cover the stream velocity in the water column. Along the transect, we also recorded the substrate type (rock, stone, gravel, sand, or silt) to estimate the availability of the different microhabitats. We measured water temperature, pH, and conductivity at approximately 4 m upstream of the biological sampling zone, using a Hanna HI98130 sensor. The percentage of shadow in the stream bed was established visually by the same observer to ensure consistency. To determine the solids in suspension of the stream water, which could increase if logging or other human disturbances occur upstream, we collected three water samples with a 20 mL syringe with a pre-weighed filter (Whatman GF/F filter discs 0.7 μm). These sample filters were air-dried (24 h), oven-dried (48 h, 60 °C), and reweighted. We then estimated the amount of solids suspended as the difference in mass of the filters. We also took three samples of leaf litter (Coarse Particulate Organic Matter, CPOM), using the area of a Surber net (33 cm × 33 cm), and three samples of Fine Benthic Particulate Organic Matter (FBPOM, <1 mm). To estimate FBPOM, we resuspended the organic matter accumulated in the stream bed in a 10 cm × 18 cm × 10 cm area delimited by a plastic cube frame. The suspension was also sampled with a 20 mL syringe, and, in the laboratory, we passed the sample through a pre-weighed filter, which was oven-dried and reweighed again. In the laboratory, we separated the leaf litter into the categories Eucalyptus and deciduous native species. Leaf litter samples were dried in the air (48 h) and in the oven (48 h, 60 °C) and weighed (Denver Instrument Company, model XE-50, Denver, CO, USA).
Once in the laboratory, macroinvertebrates were sorted and identified to the genus level, except for Diptera, Oligochaeta, and some larval Coleoptera, which were identified to the family level or higher (see Supplementary Information).
2.3. Data Analysis
For the analyses, each stream was considered a replicate. We followed an information theory approach [34] to model the effect of environmental variables on the response variables (abundance, richness, and diversity). Complementarily, we also used a frequentist approach based on statistical hypothesis testing for some a priori expectations. However, it should be taken into account that our experiment is not manipulative, a fact that may affect the validity of frequentist tests [35]. Macroinvertebrate abundance was calculated as the total number of individuals, community richness as the number of different taxa found at each site (when possible at the genus level), and diversity using the Shannon–Wiener index [36].
Our a priori proxy to estimate the impact of eucalypt plantations on stream macroinvertebrate communities was the proportion of eucalypt litter in the stream bed (negative effect), as well as the weight of eucalypt litter (negative effect) and that of native litter (positive effect). We also expected relevant seasonal changes related to litter seasonality [29]. Therefore, we first explored the effects of the proportion of eucalypt litter and season (and their interaction) on the abundance of the commonest taxa by using linear mixed-effects models fitted by restricted maximum likelihood (REML), with stream identity included as a random term.
For community abundance, richness, and diversity, we built REML models including the following predictor variables: the proportion of eucalypt litter, the weight of eucalypt and native litter, season, chlorophyll-a, conductivity, CPOM, FBPOM, stream flow, pH, shadow, temperature, and stream width. First, we built REML models with all 13 predictor variables one by one (and the constant term) and ranked these models by their Akaike’s Information Criterion corrected for small samples (AICc) [37]. In a second step, we retained the variable that produced the best model (minimum AICc) and built all models with that variable and the remaining predictor variables and ranked them by their AICc. When the proportion of eucalypt litter performed among the best univariate models, this variable was also used for further model building. Finally, models with more variables were only built using the best models with 2–3 variables and specifically included the proportion of eucalypt litter, the weight of eucalypt litter, and the weight of native litter as these were our a priori main predictor variables. Finally, all models were ranked again by their AICc values. Details of the models and their performance are in Table A2, Table A3 and Table A4. Means are presented with their standard errors. All analyses were conducted using GenStat 24th edition (VSN International) and JASP (Version 0.19.3).
3. Results
3.1. Stream Site Characterization
Sampled streams were 0.2–2.2 m wide, with a maximum depth of 47 cm, mean flow of 47.2 ± 9.0 L/s (range: 1.1–279.2), and shaded by 73.4 ± 2.5% (range: 40–100). Water conductivity averaged 58.0 ± 6.4 μS/cm (range: 20.2–191.3), pH was 6.5 ± 0.1 (range: 5.8–7.4), and chlorophyll concentrations averaged 9.1 ± 2.9 μg/m2 (range: 0–82.9). FBOPM averaged 0.39 ± 0.07 µg/L (range: 0–1.83) and CPOM 272.1 ± 28.0 g/m2 (range: 0.04–871.2). The correlation among environmental variables was, in general, low (Figure A1). However, some values worth highlighting are the negative correlation between the proportion of eucalypt litter and community diversity (r = −0.49, p = 0.001) and the positive correlation between flow rate and diversity (r = 0.50, p = 0.001). CPOM was positively correlated with the weight of native litter (0.79, p < 0.001), emphasizing the prominent contribution of native vegetation to CPOM standing stock. Stream width was negatively correlated with eucalypt litter weight (r = −0.43, p = 0.006) and positively with diversity (r = 0.44, p = 0.005). The weight of native litter was positively correlated with richness (r = 0.33, p = 0.037) and diversity (r = 0.45, p = 0.005). Correlation values are in the Supplementary Information.
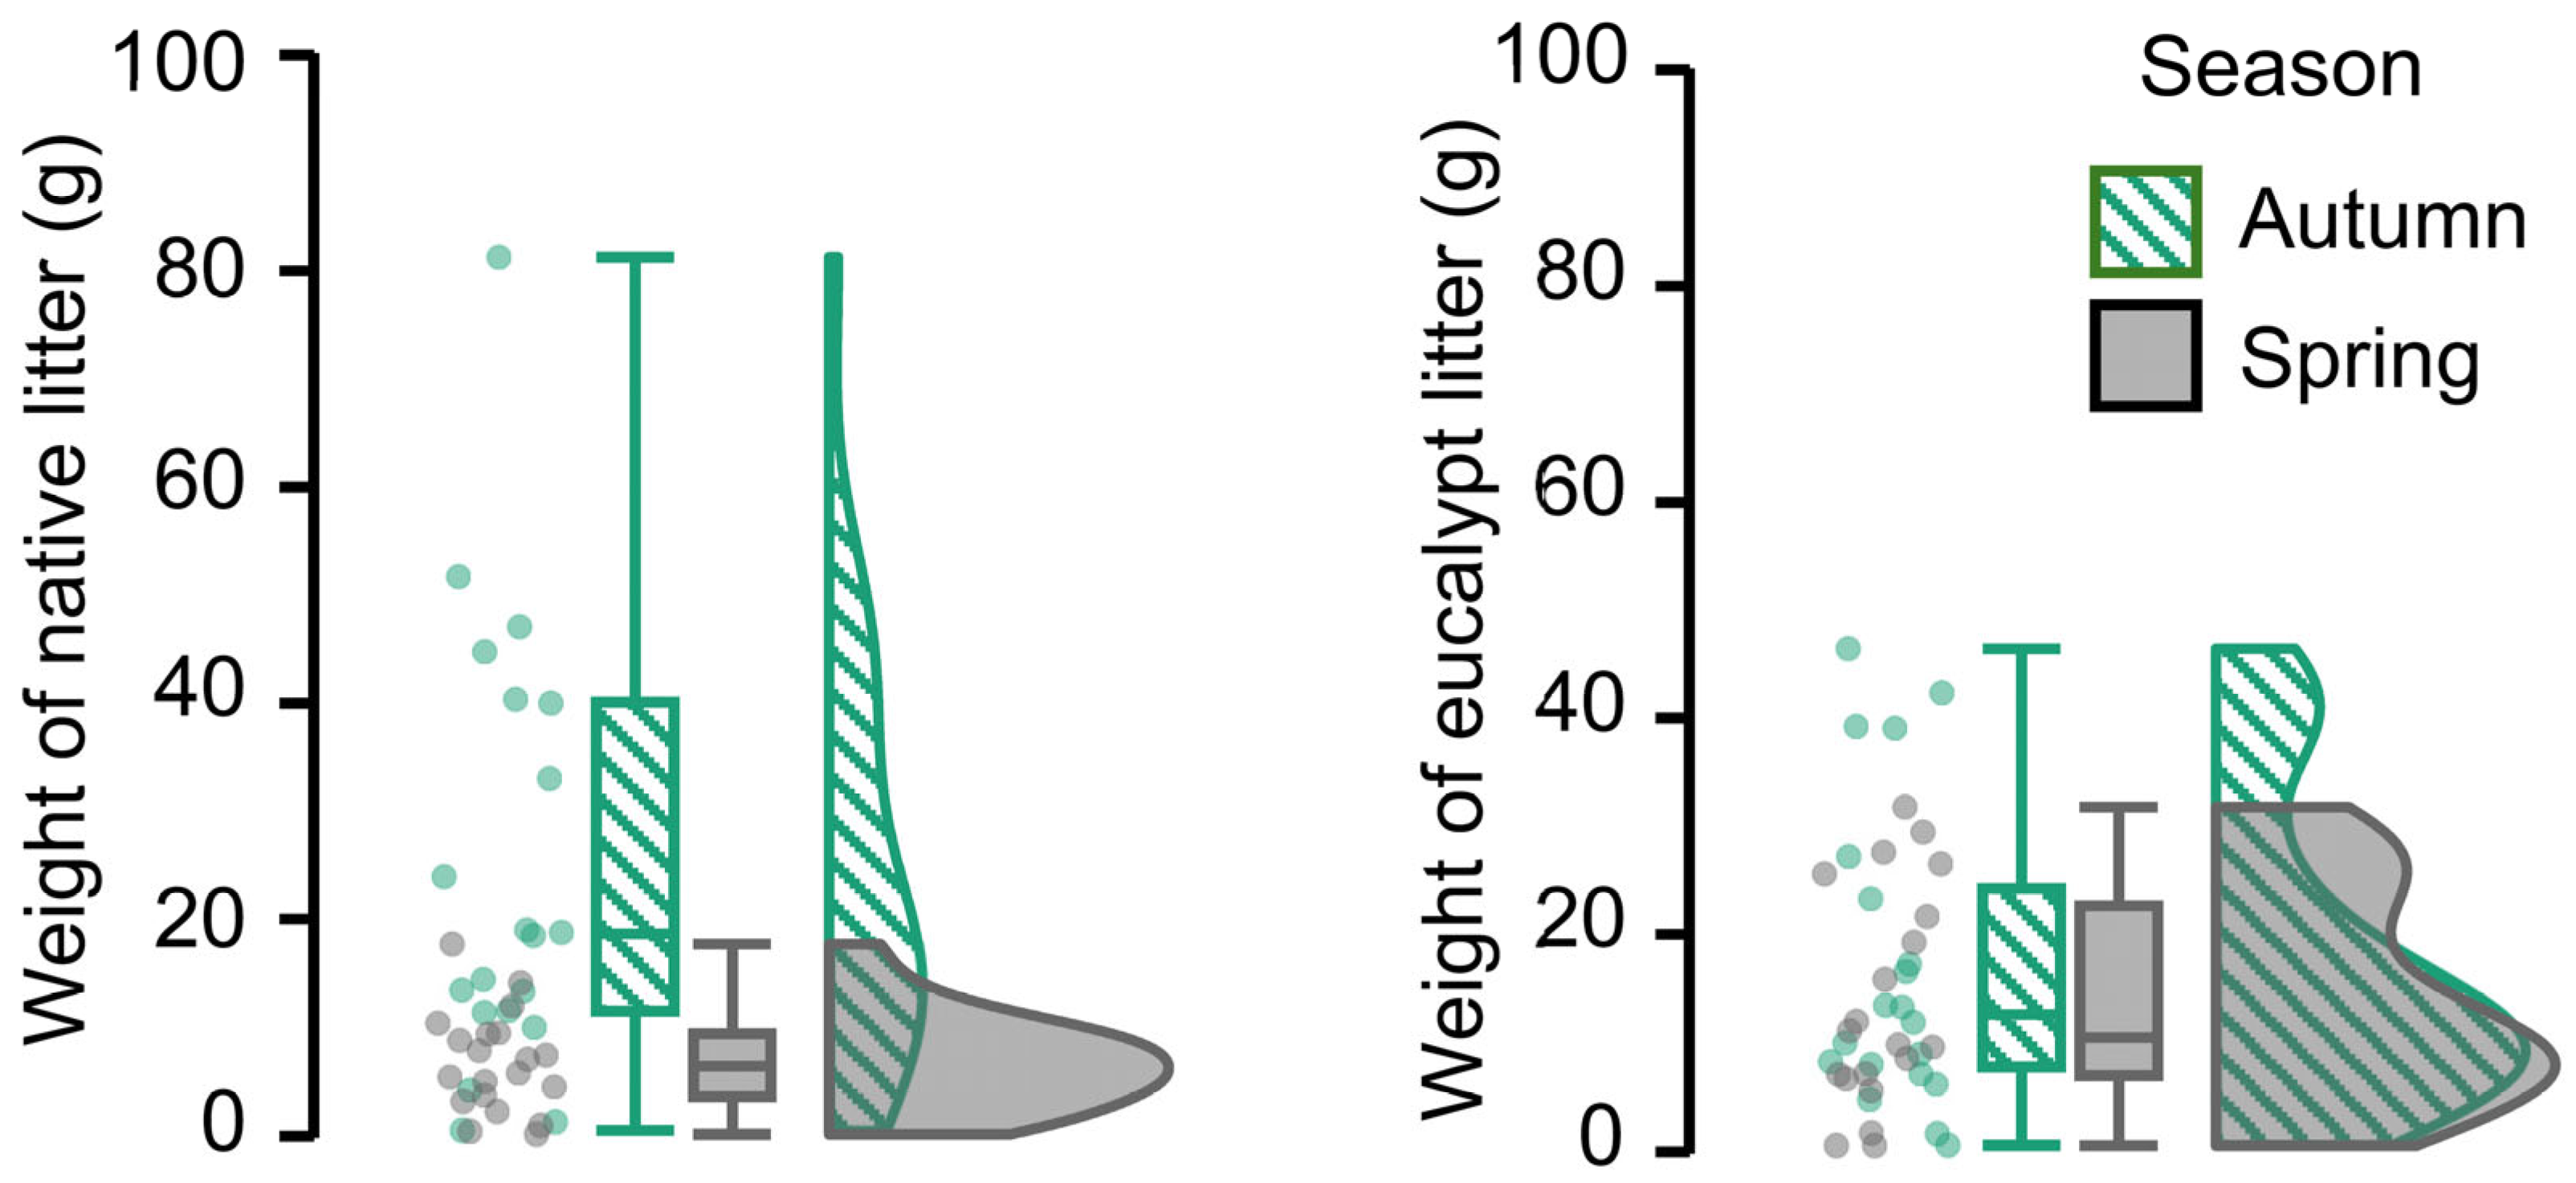
All environmental variables were similar between seasons (Table A1), with three exceptions. FBOPM was higher in autumn (0.58 ± 0.09) than in spring (0.19 ± 0.09, t37 = 3.13, p = 0.003). CPOM was higher and more variable in autumn (357.4 ± 45.4) compared to spring (186.8 ± 19.6, t25.84 = 3.45, p = 0.002). Native litter was also higher and more variable in autumn (25.1 ± 20.5 vs. 6.9 ± 4.6, t20.92 = 3.87, p < 0.001; Figure 1). In autumn, only six streams had more than 50% of their litter composed of eucalypt leaves, whereas, in spring, 12 streams showed a predominance of eucalypt litter (Table 1). While the overall amount of eucalypt litter was slightly higher in autumn (16.7 ± 3.2 g versus 13.3 ± 2.3 g; Table 1; Figure 1), the nearly four-fold increase in native litter in autumn (25.1 ± 4.6 g vs. 6.9 ± 1.0 g; Table 1; Figure 1) made eucalypt inputs more relevant in spring.
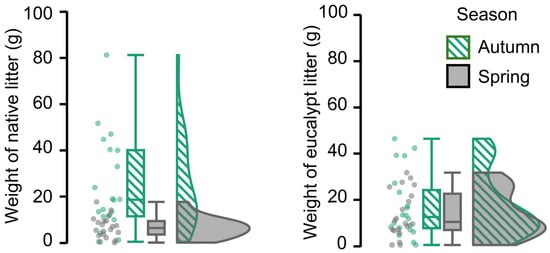
Figure 1.
Raincloud plot showing the distribution of native (left) and eucalypt litter (right) weight by season. Note that eucalypt litter was very similar between seasons, but native litter was more abundant in autumn. The individual values are presented as dots, followed by box-plots and density plots.

Table 1.
Characteristics of 20 streams sampled in the autumn of 2020 and the spring of 2021. Values are the means of measurements taken at three sections of each transect. “Eucalypt” and deciduous “Native” refer to the dry mass of benthic litter (g in the area of the Surber, 0.1089 m2; see Methods), expressed as a percentage in % eucalypt. Abundance, richness, and Shannon (diversity) refer to macroinvertebrate taxa, generally identified to the genus level.
3.2. Macroinvertebrate Abundance, Richness, and Diversity
A total of 24,705 individuals were sampled in autumn and 12,529 in spring, belonging to 125 taxa. Of these, 30 taxa comprised ≥0.5% of the total abundance (Table 2). Four taxa, primarily grazers or shredders—Protonemura (Plecoptera), Gammarus (Amphipoda), Tanytarsini (Chironomidae), and Hydropsyche (Trichoptera)—accounted for 50% of all individuals.
Table 2.
Abundance (number of individuals) of macroinvertebrates by season. Only taxa that appeared with a frequency of ≥0.5% are indicated. Statistical tests (F) and p-values derive from a REML analysis, testing the effect of the proportion of eucalypt litter and season on taxon abundance, including site as a random term. The interaction term between % eucalypt and season was never significant. Significant values (p < 0.05) are in bold.
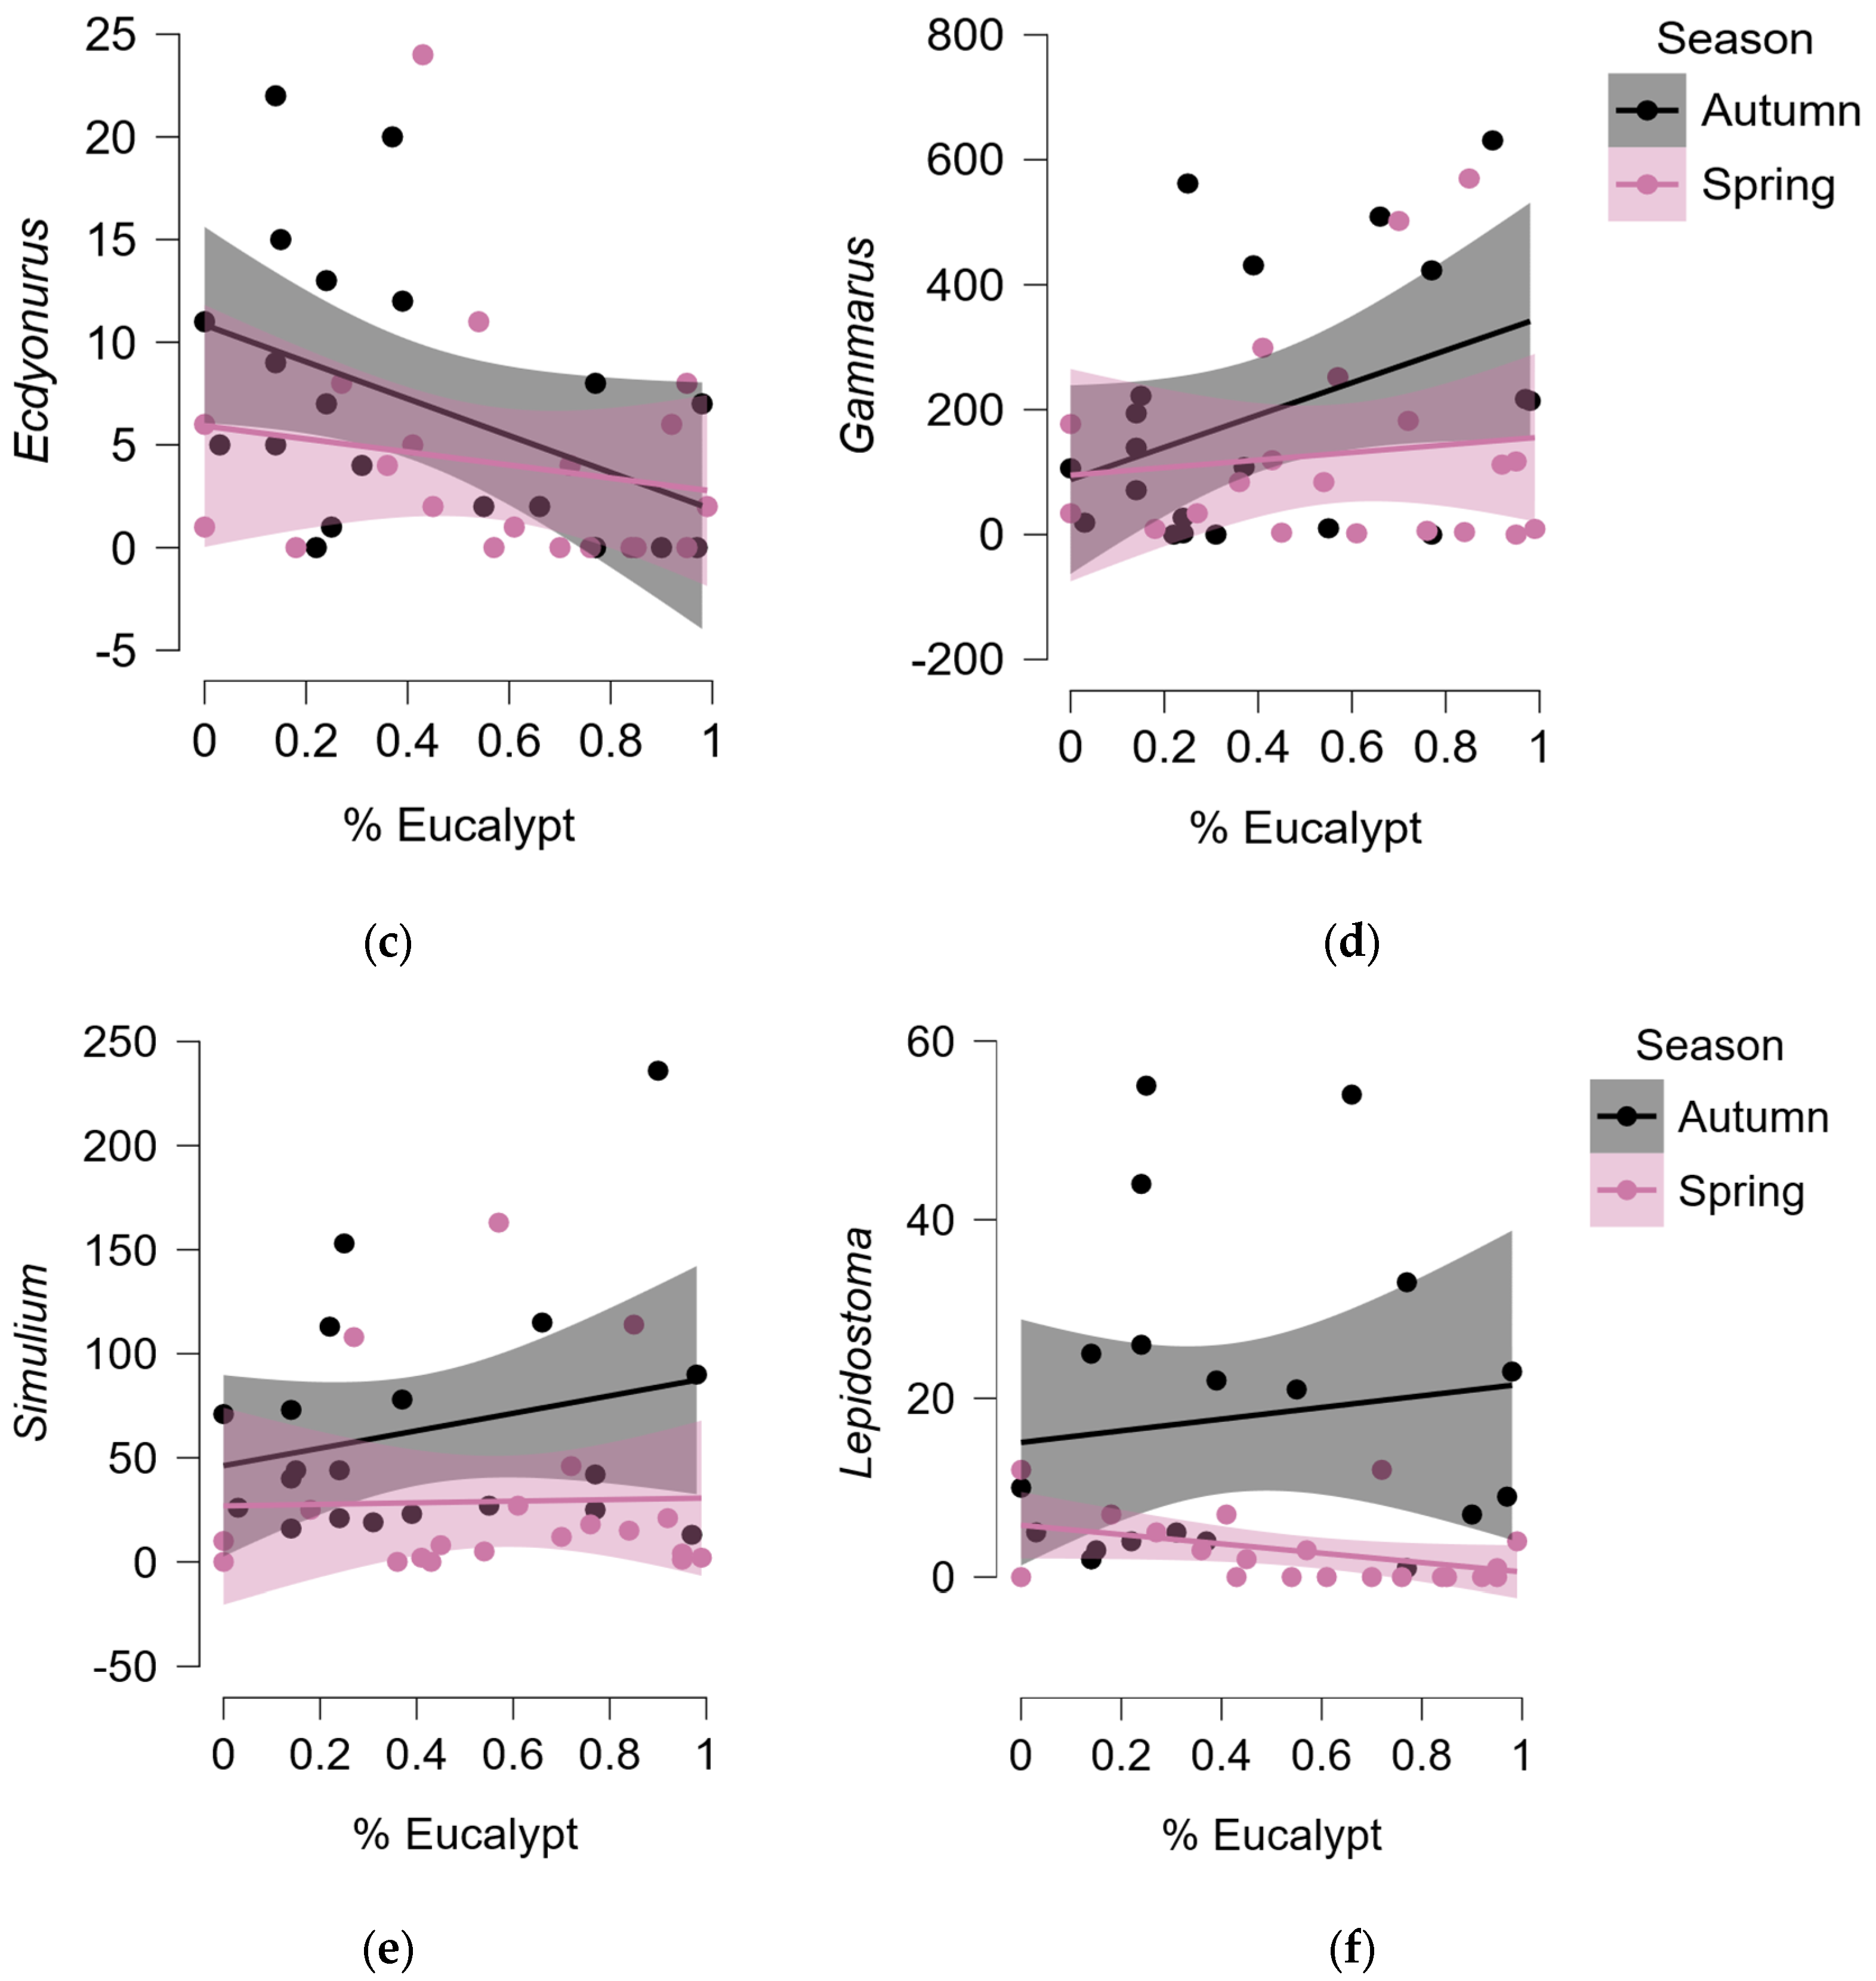
The effects of the proportion of eucalypt litter and season on macroinvertebrate abundance were analyzed with a REML with site as a random term. The abundance of Limnephilus (Trichoptera; Figure 2a), Crunoecia (Trichoptera), and Ecdyonurus (Ephemeroptera; Figure 2b) was negatively associated with the proportion of eucalypt litter, particularly in autumn (Table 2, Figure 3). The abundance of nine taxa, including Gammarus (Figure 2c), Simulium (Diptera; Figure 2d), Orthocladiinae (Diptera), Leuctra (Plecoptera), Lepidostoma (Trichoptera), Diplectrona (Trichoptera), Rhyacophila (Trichoptera), Oligochaeta, and Hexatoma (Diptera) was higher in autumn than in spring (Table 2, Figure 3), Gammarus being especially relevant as it accounted for 17.4% of total individuals.

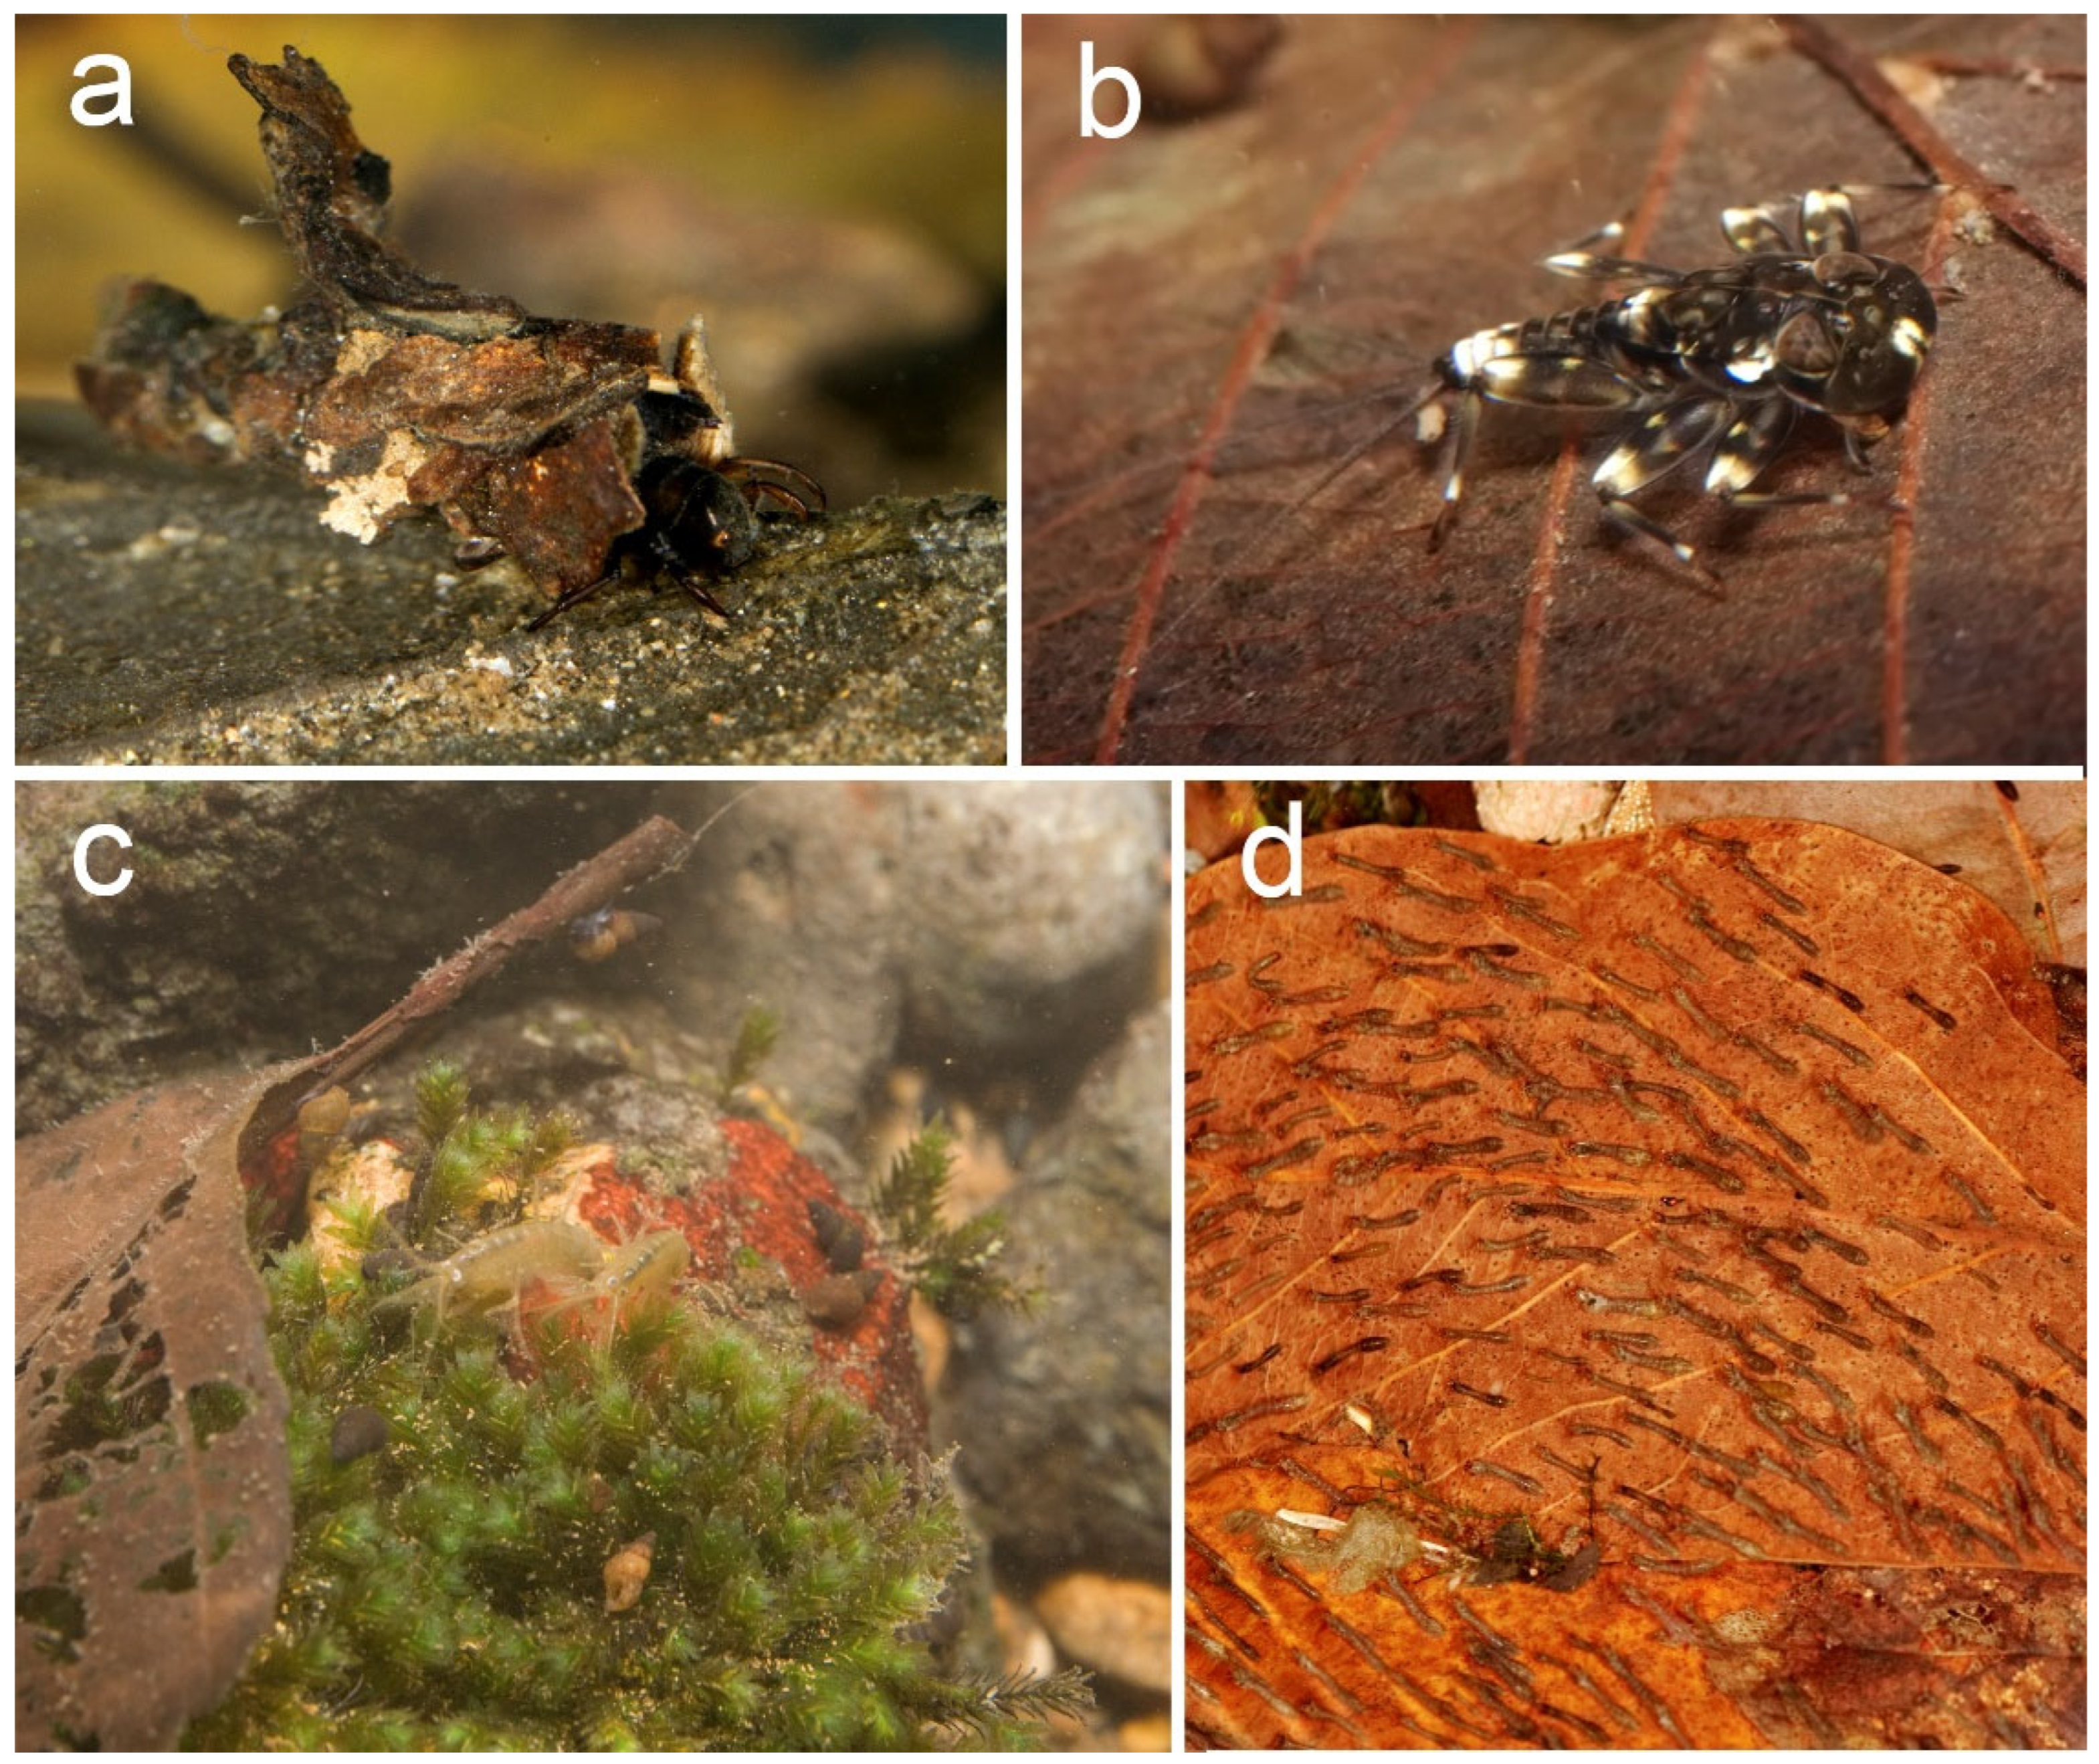
Figure 2.
Habitus and behavior of key macroinvertebrate taxa. Some caddisfly larvae, like members of the family Limnephilidae (a) and mayfly larvae ((b), Ecdyonurus), which feed as shredders or scrapers on leaves, were among the taxa whose abundance was negatively affected by the increase in eucalypt litter, whereas grinders like Gammarus (c) and several dipterans like black flies (Simuliidae, (d)), which are filterers, were little or not affected. Pictures by ACR.
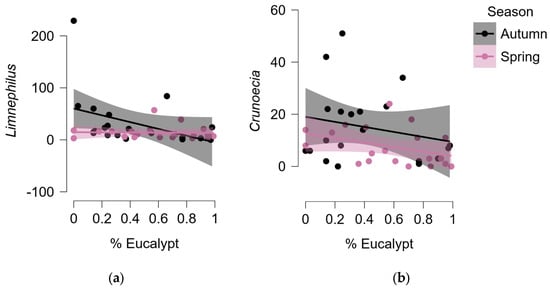
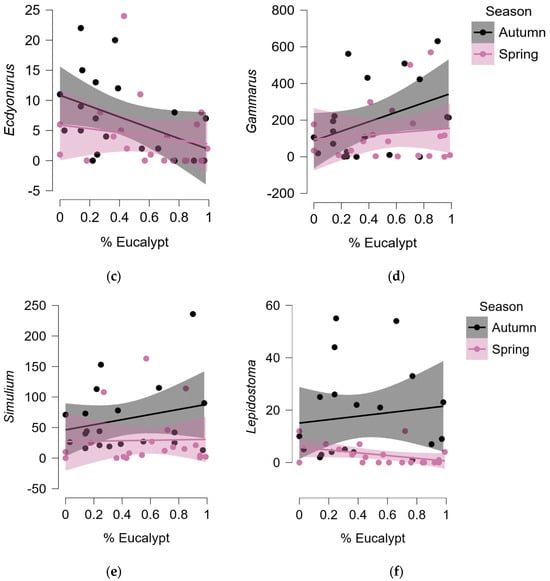
Figure 3.
Losers and winners: the relationship between abundance of selected taxa and the proportion of eucalypt leaves, by season, with 95% confidence intervals. The abundance of Limnephilus (a), Crunoecia (b) and Ecdyonurus (c), which feed on algae (more available in spring) or leaves, diminished with the increase in eucalypt litter, particularly in autumn. The remaining species (including all with significant seasonal effects in Table 2) had higher abundance in autumn, when more native litter was available. The figure shows the abundance of Gammarus (d), Simulium (e) and Lepidostoma (f).
The best model to explain variability in macroinvertebrate abundance included the effects of season, flow, and temperature, with an AICc of 552.19 and an Akaike weight of 0.35 (Table A2). The estimates of parameters from this model indicate that abundance in autumn was higher than in spring (coefficient: 765.6 ± 204.2), stream flow had a negative effect (−4.539 ± 2.001), and temperature had a positive effect (267.8 ± 98.9). However, five models with one additional variable performed in a similar way (delta AICc 1.45–2.61). The variables included were conductivity, the weight of native litter, the proportion of eucalypt litter, stream width, and the weight of eucalypt litter. The Akaike weight of models including the weight of native litter (0.12), the proportion of eucalypt litter (0.11), and the weight of eucalypt litter (0.10) is relatively high, supporting the hypothesis that these variables are relevant in explaining variability in macroinvertebrate abundance. In agreement with our hypothesis, the effect of native litter was positive on abundance (4.728 ± 7.286), and the impact of eucalypt litter was negative, measured as eucalypt litter mass (−1.444 ± 9.545) or the proportion of eucalypt litter (−182.30 ± 375.10). However, the standard errors were large, indicating high variability.
Community richness was best explained by a model including season and FBPOM, with an AICc of 219.19 and an Akaike weight of 0.32 (Table A3). Richness was higher in autumn compared to spring (11.35 ± 3.07), and FBPOM had a positive effect (4.13 ± 6.17). Two further models had a delta AICc of 1.50–2.00 and an Akaike weight of 0.15–0.12. The first model added the negative effect of the proportion of eucalypt litter (−4.88 ± 5.27). The second model only included season and a negative effect of stream flow (−0.0072 ± 0.0292). Again, standard errors were very large.
The best model explaining invertebrate diversity included the proportion of eucalypt litter, season, stream width, and pH (AICc = −28.54; Table A4). This model is highly supported by the data, given its Akaike weight of 0.43. The effect of eucalypt litter was negative (−0.488 ± 0.202), autumn diversity was higher (0.476 ± 0.123), and stream width had a positive effect (0.291 ± 0.107) and pH also (0.334 ± 0.177). The second model excluded pH and has a delta AICc of 1.32 and is, therefore, of similar explanatory power, with an Akaike weight of 0.22.
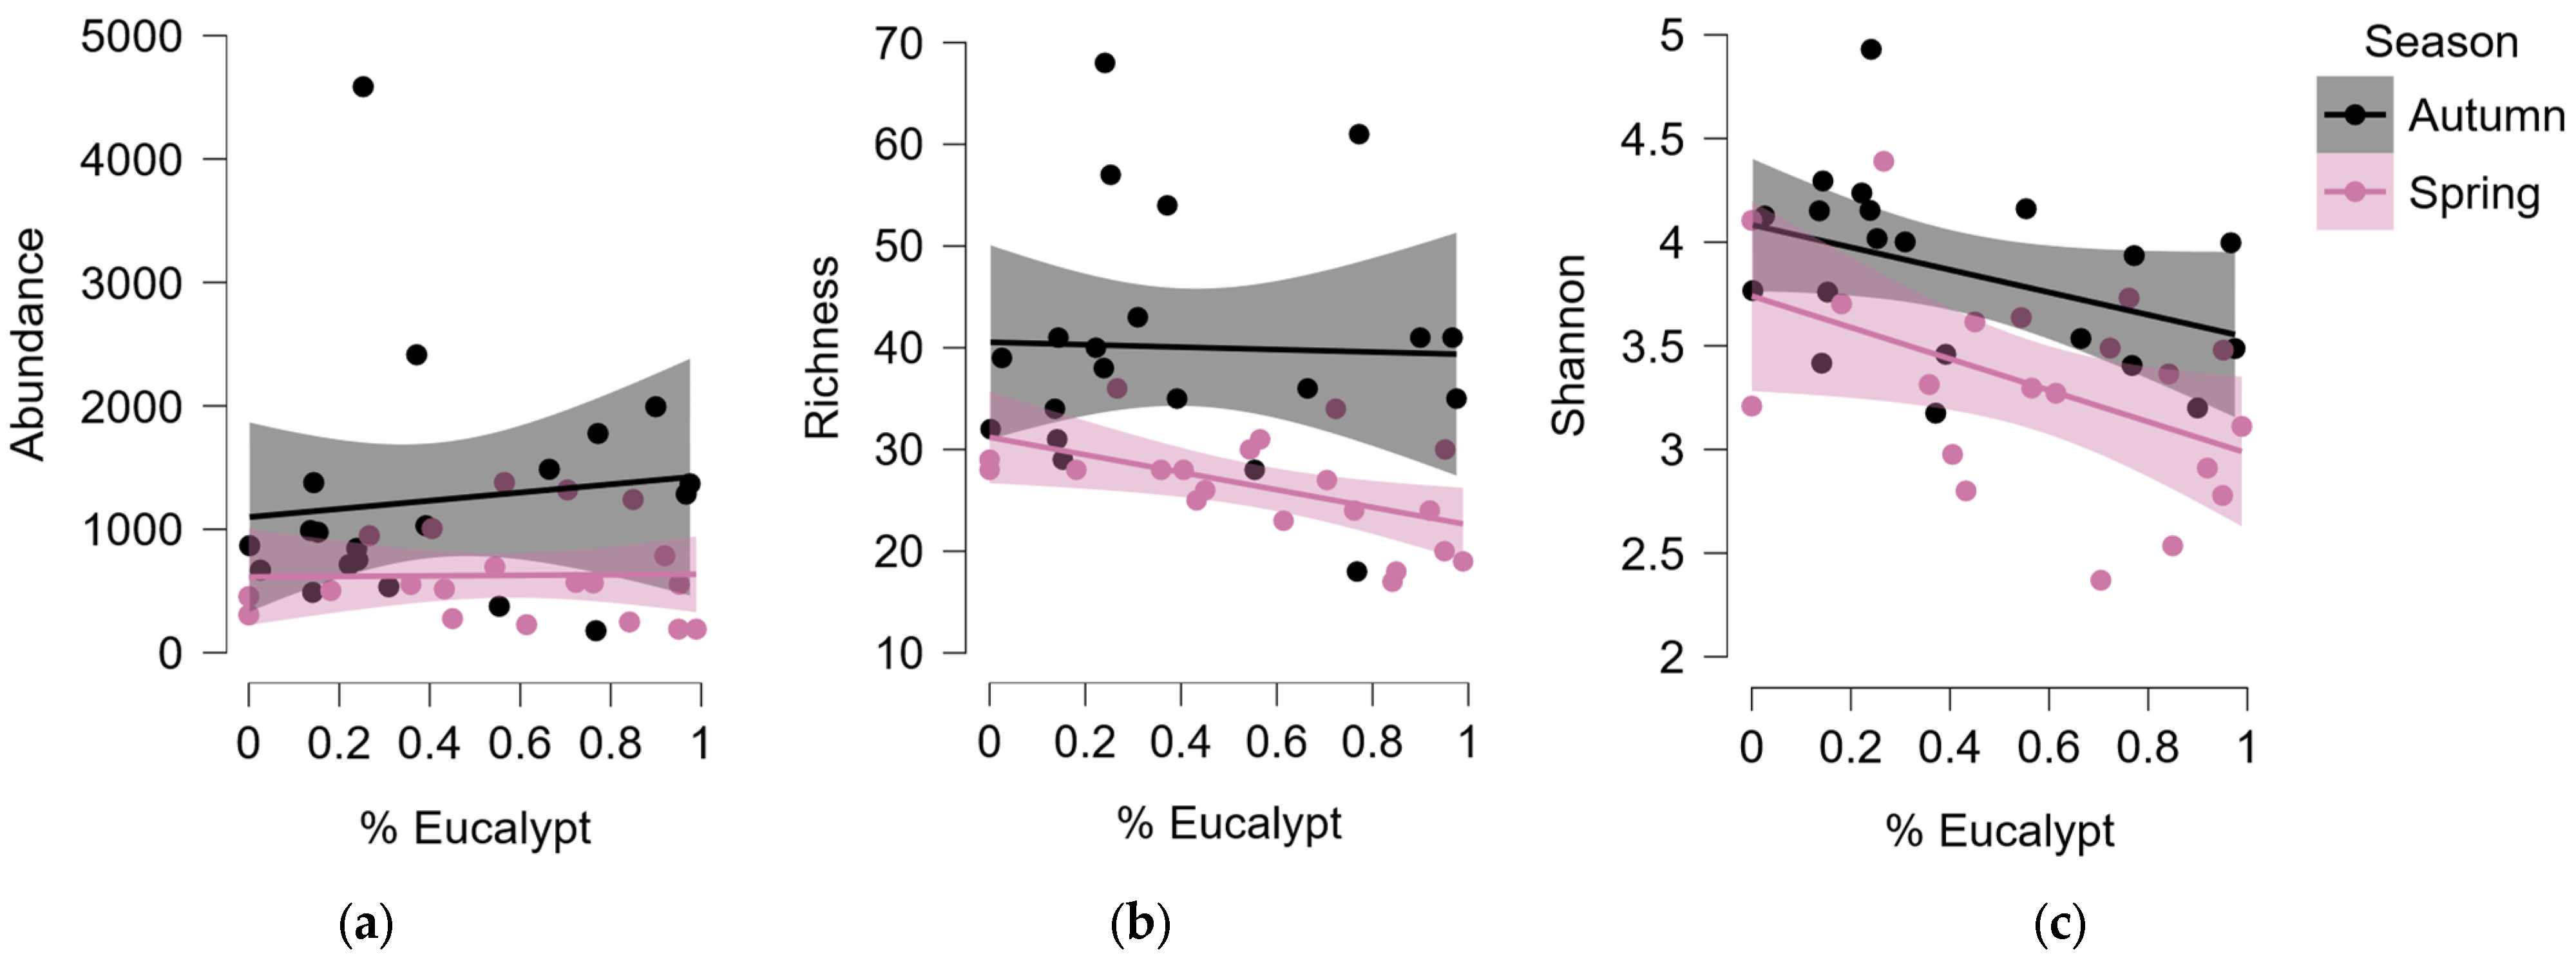
Finally, we used a frequentist approach to test our a priori hypothesis that predicted a negative effect of the proportion of eucalypt litter and a positive effect of autumn season on our three community variables. Given the contrasting effect of eucalypt litter on the different taxa (Figure 3), we found that total invertebrate abundance showed no significant relation with the proportion of eucalypt litter (Figure 4; REML, F1,30.8 = 0.78, p = 0.385), but abundance was higher in autumn (F1,20.4 = 9.00, p = 0.007). However, richness decreased with the increase in the proportion of eucalypt litter (Figure 4; F1,28.6 = 7.47, p = 0.011) and was also higher in autumn (F1,20.1 = 22.44, p < 0.001), and the same was observed with diversity, which was clearly reduced with an increase in eucalypt litter (Figure 4; F1,29.0 = 14.38, p < 0.001) and was also significantly higher in autumn (F1,20.1 = 13.56, p < 0.001).
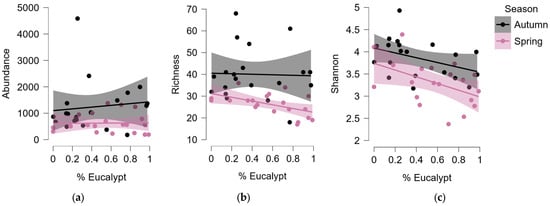
Figure 4.
The relationship between the proportion of eucalypt leaves on the stream bed and the abundance (number of individuals, (a)), richness (number of taxa, (b)), and diversity (Shannon index, (c)) of the macroinvertebrate community, by season. Richness and diversity diminished significantly with the increase in eucalypt leaves (REML), and all three variables were lower in spring than in autumn.
4. Discussion
Our findings show that eucalypt plantations influence the seasonality of litter accumulation in streams, with a higher proportion of eucalypt leaves in spring compared to autumn. We used two complementary approaches (AIC model selection and hypothesis testing) to study the effect of eucalypt litter and season on stream macroinvertebrates, and both suggest that the impact of eucalypts is negative. While overall invertebrate abundance was not affected, some taxa (e.g., Limnephilus, Crunoecia, and Ecdyonurus) were less abundant when eucalypt litter increased. In agreement with our predictions, richness and diversity decreased with increasing eucalypt litter, suggesting again a negative impact on the composition of macroinvertebrate communities.
Previous studies in the Iberian Peninsula, e.g., [20,38], reported similar findings regarding seasonal patterns of litterfall (higher in autumn for native vegetation) and stream discharge. In agreement with this, the accumulation of litter in spring was generally higher in eucalypt-dominated streams than in deciduous-dominated streams (Figure 1), and wider streams accumulated less eucalypt litter (r = −0.43, p = 0.006; Figure A1). These results can be explained by the peak of eucalypt litterfall occurring in spring–summer [29], the longer time required for eucalypt litter to decompose [27], and/or the lower abundance of decomposers that could break down eucalypt leaf litter. Therefore, as established by Ferreira et al. [28], the effects of eucalypt plantations on streams may be greater in regions where summer droughts are more pronounced and where autochthonous deciduous riparian species are absent. Native deciduous trees provide high-quality litter for macroinvertebrates that play a crucial role in riparian ecosystem processes [18]. Overall, litter decomposition in eucalypt-dominated streams is reduced by 23% [11]. The effects of eucalypt plantations may vary in different geographical regions [39], according to the local macroinvertebrate community composition, the tree species used in plantations, the intensity of management, and the degree of similarity between the eucalypt litter and that of native species.
Our results also suggest that litter quality plays a crucial role in terms of physical properties and nutrient content. Eucalyptus globulus litter generally has lower phosphorus and nitrogen contents than Iberian riparian native litter [38]. Additionally, the higher N:P ratios increase the abundance of shredders [27], which preferentially consume high-quality leaves in deciduous forests. The preponderance of generalists in streams dominated by Eucalyptus [28] reinforce the importance of native litter for maintaining a healthy macroinvertebrate community [19]. In fact, the total abundance of macroinvertebrates was not affected by the increase in eucalypt litter because some generalist species (e.g., Protonemura and Gammarus, which mainly feed as grinders, and Hydropsyche, a filterer–collector), were as abundant in autumn as in spring (Table 2). The abundance of Gammarus (Figure 2c) is very high in streams dominated by eucalypts in NW Spain for instance, as is illustrated in Figure 9 of the reference [12].
We used an information theory approach to model abundance, richness, and diversity in the function of environmental variables and found that season and the proportion of eucalypt litter were included in the most supported models in all cases, particularly in relation to diversity (Table A2, Table A3 and Table A4). These results are in agreement with previous theoretical [12,40] and experimental work [19], which suggest that the transfer of energy from eucalypts to higher trophic levels in Europe is limited by the absence of native herbivores able to feed on eucalypts and the inhibitory effect of leaf chemistry on leaf decomposers [11]. However, under high nutrient levels (particularly phosphorus), eucalypt leaves are readily colonized by fungi, increasing decomposition rate [27].
Although the abundance of Eucalyptus litter in streams did not correlate with total invertebrate abundance, we observed a significant decrease in richness and diversity with increasing proportions of eucalypt leaves. This pattern, coupled with the observation of higher richness and diversity in autumn (when the proportion of eucalypt leaves was lower), once again indicates that native litter plays a crucial role in supporting diverse and healthy macroinvertebrate communities [41]. In fact, the weight of native litter was positively correlated with richness and diversity, reinforcing the relevance of this kind of subsidy for the structuration of macroinvertebrate communities. The increase in eucalypt leaves changes the energy inputs for the macroinvertebrate community, altering its composition. Part of the differences, we found between seasons could be attributed to the association of some taxa with the food types and litter available, with many trichopterans and mayflies emerging in spring and being more abundant in autumn.
The dominance of specific macroinvertebrate taxa in autumn (when native litter is more abundant) strengthens the link between litter quality and community composition. Among these taxa, many are ephemeropterans, trichopterans, and plecopterans (Table 2), which are recognized as indicators of good ecological status in streams (ETP index) [42,43]. This association is true in temperate areas but also in Eucalyptus-dominated regions of the Neotropics [44,45]. Conversely, shredders—a group highly affected by leaf litter quality due to their dependence on consumable organic matter—are expected to be less abundant in streams with higher proportions of eucalypt leaves. This has been demonstrated by their slower growth rates when fed on low-quality eucalypt leaves. Canhoto and Graça [22] experimentally found that the larvae of Tipulidae (Diptera) reduced their consumption of native leaves by 50% when oils and polyphenols from E. globulus leaves were added to native leaves. Experiments adding eucalypt leaves to small streams also found that leachates from eucalypt leaves exert toxic effects on periphyton, diatom, and invertebrate assemblages [42]. All these observations align with established knowledge that eucalypt litter has lower nutritional value due to its high oil and polyphenolic content [14].
All three community variables, abundance, richness, and diversity, were lower in spring (Figure 4). However, the standard procedures to evaluate the water quality of streams in Spain highlight the fact that sampling should be done in spring [46], albeit there is evidence that combining sampling in different seasons produces better results, at least in the Mediterranean region [47]. The autumn of 2020 was dry in NW Spain, with a precipitation 20% lower than the period 1981–2020 [48], and a similar value, 21% lower than the reference period, was recorded in the spring of 2021 [49]. Further studies should analyze whether the seasonal differences that we found are consistent over the years or could be explained by meteorological conditions of particular years.
Our study offers clear evidence of the negative effects of intensive forestry on stream ecology, e.g., [50]. A previous study in the same region revealed a negative association between macroinvertebrate community richness and the percentage of eucalypt plantations on the basin, with a similar trend observed for diversity [19]. In agreement with our results, Eucalyptus plantations in Brazilian streams have been shown to reduce the richness and diversity of benthic macroinvertebrates [45]. The negative impacts of exotic tree monocultures extend beyond Eucalyptus, with oil palm plantations also modifying the physical structure and communities of aquatic insects in Brazilian streams, affecting groups such as odonates [51] and heteropterans [52]. However, these predators may only be indirectly associated with litter quality. These negative effects are not limited to invertebrates but also apply to fish [53], amphibians [54], or birds [55,56]. One clear message emerges from these studies: plantation forestry should be avoided close to the streams to prevent a significant input of exotic litter. Currently, when streams are at least 2 m in width, eucalypts cannot be legally planted at less than 15 m in Galicia [57]. However, our streams were narrower, and the fact is that these legal requirements are not respected. The reluctance of owners to “give up” land from productive areas to protect these buffer zones is a problem for the effectiveness of such a strategy [58]. Maintaining a wide and diverse riparian forest is a guarantee for the minimization of impacts on rivers [59] and a way to promote the ecosystem services that these streams provide, including biodiversity conservation, mitigation of extreme flows, and water supply, but also services provided by aquatic insects, like pollination, pest control, and soil fertilization [60], and the export of nutrients to terrestrial systems [61].
While monocultures of fast-growing tree species like Eucalyptus offer high economic benefits for the wood industry, such as increased plantation efficiency and productivity, mixed-species plantations are expanding and becoming more common due to their numerous advantages. Mixed-species plantations, which incorporate a diverse array of tree species, have demonstrated benefits for forest health, economic sustainability, and biodiversity conservation and may have increased productivity compared to monospecific plantations [62]. The diversity in species, functions, structures, and genotypes observed within mixed-species plantations makes them more sustainable and environmentally friendly, particularly when incorporating autochthonous species [63]. Furthermore, diverse forests can buffer maximum temperatures thanks to their structural diversity [64], a fact very relevant under the current global warming. Thus, conserving native riparian areas, especially in streams impacted by Eucalyptus plantations, is crucial to mitigate the negative effects on stream communities and ecological processes.
Supplementary Materials
The following supporting information can be downloaded at: https://www.mdpi.com/article/10.3390/hydrobiology4020016/s1. Supplementary File S1: Excel file with the data.
Author Contributions
Conceptualization, A.R.-T., A.L.-D., M.Á. and A.C.-R.; methodology, A.L.-D. and M.Á.; formal analysis, A.C.-R.; investigation, all authors; resources, A.C.-R.; data curation, A.R.-T., A.L.-D. and A.C.-R.; writing—original draft preparation, A.R.-T., M.A.S.G. and A.C.-R.; writing—review and editing, all authors; supervision, M.A.S.G. and A.C.-R.; project administration, A.C.-R.; funding acquisition, A.C.-R. All authors have read and agreed to the published version of the manuscript.
Funding
A.R.-T was funded by a Margarita Salas fellowship (REC-SALAS-21). This work was funded by grant PGC2018-096656-B-I00 to ACR from MCIN/AEI/10.13039/501100011033 and from “ERDF A way of making Europe” by the “European Union”. L.J. thanks the Brazilian National Council for Scientific and Technological Development (CNPq) for a productivity grant (304710/2019-9).
Institutional Review Board Statement
Not applicable.
Informed Consent Statement
Not applicable.
Data Availability Statement
Data are available in the Appendix A and the Supplementary Materials.
Acknowledgments
We are grateful to Eva Pérez and Samuel Brun for their help with field and laboratory work.
Conflicts of Interest
The authors declare no conflicts of interest. The funders had no role in the design of the study; in the collection, analyses, or interpretation of data; in the writing of the manuscript; or in the decision to publish the results.
Abbreviations
The following abbreviations are used in this manuscript:
| AIC | Akaike’s Information Criterion |
| CPOM | Coarse Particulate Organic Matter |
| FBOPM | Fine Benthic Particulate Organic Matter |
Appendix A
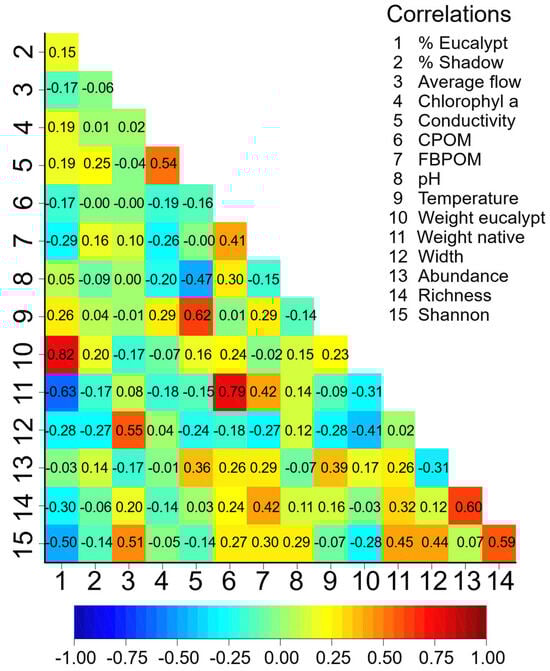
Figure A1.
Correlation plot between the environmental variables and community variables. Values indicate the Pearson correlation coefficient.
Figure A1.
Correlation plot between the environmental variables and community variables. Values indicate the Pearson correlation coefficient.
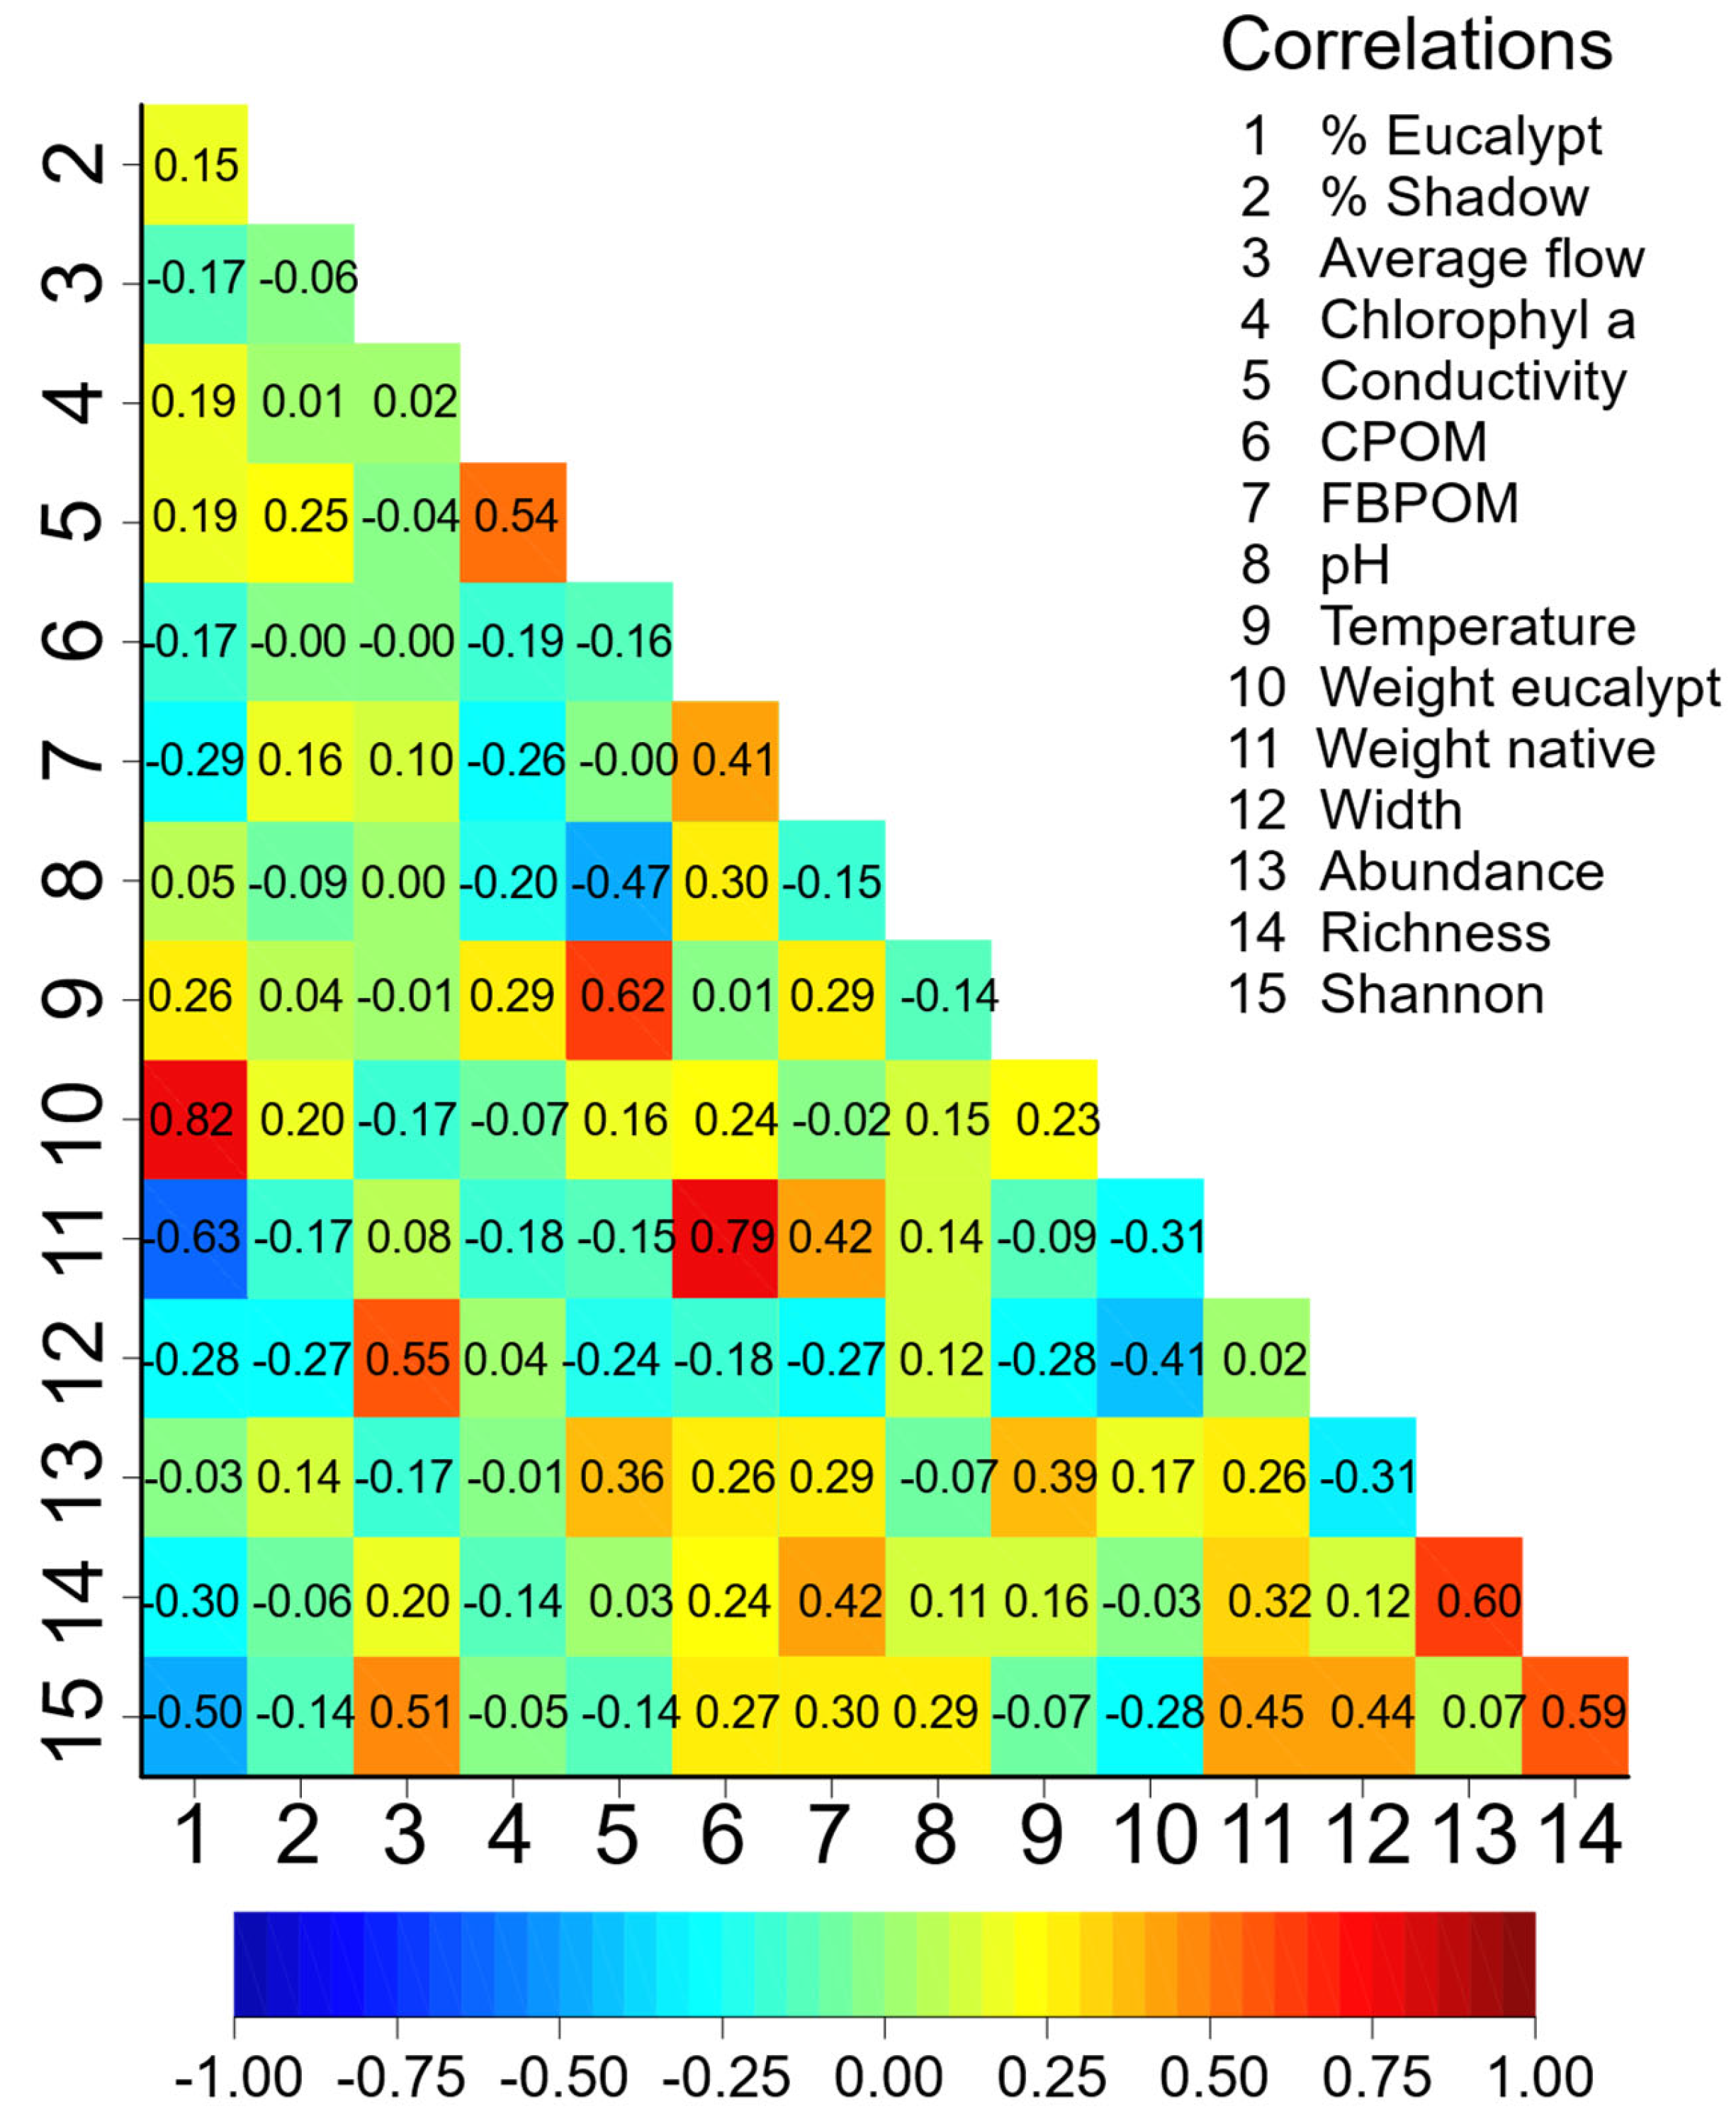
Table A1.
Geographical coordinates and environmental variables of the sampled streams. Conductivity in μS/cm, width in m, flow in L/s, FBPOM in g/L, CPOM in g/m2, and chlorophyll in μg/m2.
Table A1.
Geographical coordinates and environmental variables of the sampled streams. Conductivity in μS/cm, width in m, flow in L/s, FBPOM in g/L, CPOM in g/m2, and chlorophyll in μg/m2.
| Locality and Stream | Latitude | Longitude | T (°C) | Conductivity | pH | % Shadow | Width | Flow | FBPOM | CPOM | Chlorophyll-a |
|---|---|---|---|---|---|---|---|---|---|---|---|
| Autumn | |||||||||||
| Aldán, Bouzas | 42.29872 | −8.81164 | 14.30 | 171.00 | 5.98 | 70 | 0.65 | 2.93 | 0.3133 | 82.62 | 0.502 |
| Aldán, Orxas | 42.28328 | −8.81056 | 14.70 | 153.50 | 6.21 | 70 | 2.17 | 158.45 | 0.3433 | 172.95 | 3.267 |
| Marín, Agrela | 42.38064 | −8.66778 | 11.20 | 54.40 | 6.77 | 90 | 0.48 | 2.55 | 0.4383 | 463.80 | 0.241 |
| Marín, Gorgadas | 42.33878 | −8.72917 | 11.70 | 51.90 | 6.31 | 60 | 1.47 | 75.26 | 0.3983 | 380.65 | 1.969 |
| Vilaboa, Portiño | 42.33289 | −8.66764 | 13.80 | 43.80 | 6.71 | 75 | 1.55 | 92.78 | 0.7470 | 549.32 | 0.672 |
| Vilaboa, Maior | 42.33211 | −8.66083 | 14.40 | 39.60 | 7.37 | 50 | 1.90 | 11.76 | 0.8233 | 357.73 | 0.634 |
| Coruxo, Gontade | 42.17664 | −8.78444 | 14.80 | 70.40 | 6.81 | 100 | 0.20 | 1.14 | 1.0250 | 399.39 | 0.020 |
| Coruxo, Saiáns | 42.16736 | −8.79714 | 14.10 | 113.80 | 6.47 | 100 | 0.54 | 2.49 | 0.9767 | 583.88 | 0.201 |
| Gondomar, Peitieiros | 42.08669 | −8.73131 | 12.40 | 34.80 | 6.77 | 40 | 1.30 | 58.81 | 0.2900 | 491.47 | 11.829 |
| Gondomar, Mordagáns | 42.11244 | −8.72339 | 12.20 | 49.80 | 6.76 | 70 | 1.73 | 121.26 | 0.7833 | 293.04 | 27.557 |
| Mondariz, da Vida | 42.17842 | −8.58033 | 12.80 | 48.00 | 6.50 | 70 | 1.10 | 63.07 | 0.0633 | 0.0441 | 9.882 |
| Mondariz, Cillarga | 42.21158 | −8.56094 | 13.20 | 36.00 | 6.50 | 75 | 0.98 | 75.53 | 0.5583 | 565.71 | 10.385 |
| Porriño, da Fraga | 42.21444 | −8.58953 | 12.60 | 31.20 | 6.60 | 90 | 1.93 | 279.24 | 0.8400 | 278.37 | 0.052 |
| Porriño, Louro | 42.17589 | −8.60692 | 13.70 | 66.50 | 5.80 | 75 | 0.52 | 31.13 | 1.8333 | 483.12 | 0.024 |
| Campo Lameiro, Grande | 42.53258 | −8.48572 | 12.40 | 23.00 | 6.74 | 85 | 1.63 | 25.01 | 0.5217 | 249.23 | 0.695 |
| Campo Lameiro, Teixoeiras | 42.54658 | −8.54872 | 12.00 | 28.90 | 6.81 | 60 | 1.56 | 40.96 | 0.4150 | 871.20 | 0.932 |
| Pontevedra, Seixiña | 42.53839 | −8.46836 | 12.30 | 29.10 | 6.31 | 60 | 0.83 | 6.58 | 0.4883 | 281.18 | 0.878 |
| Pontevedra, As Laceiras | 42.53042 | −8.41822 | 10.00 | 25.00 | 6.32 | 90 | 1.63 | 44.51 | 0.4467 | 175.05 | 0.667 |
| Ponteareas, Xabriña | 42.20158 | −8.42372 | 12.80 | 34.70 | 6.32 | 50 | 2.23 | 108.62 | 0.2867 | 315.99 | 7.848 |
| Ponteareas, Fragón | 42.19333 | −8.45972 | 13.50 | 61.10 | 6.20 | 65 | 1.64 | 81.58 | 0.0650 | 153.54 | 15.115 |
| mean | 12.95 | 58.33 | 6.51 | 72.25 | 1.30 | 64.18 | 0.58 | 357.41 | 4.67 | ||
| Spring | |||||||||||
| Aldán, Bouzas | 42.29872 | −8.81164 | 13.90 | 191.30 | 5.98 | 90 | 0.65 | 3.28 | 0.0000 | 282.41 | 75.115 |
| Aldán, Orxas | 42.28328 | −8.81056 | 14.20 | 123.90 | 6.21 | 70 | 2.17 | 68.17 | 0.0000 | 127.45 | 82.897 |
| Marín, Agrela | 42.38064 | −8.66778 | 12.80 | 43.60 | 6.77 | 65 | 0.48 | 6.13 | 0.0000 | 342.79 | 7.393 |
| Marín, Gorgadas | 42.33878 | −8.72917 | 13.40 | 67.10 | 6.31 | 80 | 1.47 | 68.68 | 0.8650 | 224.58 | 25.298 |
| Vilaboa, Portiño | 42.33289 | −8.66764 | 13.70 | 46.50 | 6.71 | 90 | 1.55 | 100.75 | - | 110.57 | 0.690 |
| Vilaboa, Maior | 42.33211 | −8.66083 | 14.30 | 42.30 | 7.37 | 60 | 1.90 | - | 0.0000 | 57.64 | 0.188 |
| Coruxo, Gontade | 42.17664 | −8.78444 | 14.00 | 66.00 | 6.81 | 95 | 0.20 | 2.88 | 0.4950 | 328.28 | 9.333 |
| Coruxo, Saiáns | 42.16736 | −8.79714 | 14.10 | 106.40 | 6.47 | 90 | 0.54 | 10.52 | 0.0000 | 81.52 | 33.864 |
| Gondomar, Peitieiros | 42.08669 | −8.73131 | 13.00 | 37.90 | 6.77 | 45 | 1.30 | 13.10 | 0.0717 | 152.83 | 29.101 |
| Gondomar, Mordagáns | 42.11244 | −8.72339 | 13.00 | 53.10 | 6.76 | 70 | 1.73 | 117.64 | 0.0000 | 133.89 | 5.024 |
| Mondariz, da Vida | 42.17842 | −8.58033 | 13.40 | 51.00 | 6.50 | 60 | 1.10 | 21.22 | 0.0900 | 271.78 | 0.276 |
| Mondariz, Cillarga | 42.21158 | −8.56094 | 13.00 | 34.20 | 6.50 | 45 | 0.98 | 3.03 | 0.2650 | 196.92 | 0.374 |
| Porriño, da Fraga | 42.21444 | −8.58953 | 13.10 | 31.70 | 6.60 | 90 | 1.93 | 18.63 | 0.1017 | 229.85 | 0.176 |
| Porriño, Louro | 42.17589 | −8.60692 | 14.00 | 61.90 | 5.80 | 70 | 0.52 | 8.63 | 1.4317 | 138.39 | 0.182 |
| Campo Lameiro, Grande | 42.53258 | −8.48572 | 11.50 | 20.20 | 6.74 | 70 | 1.63 | 22.45 | 0.0000 | 205.02 | 0.095 |
| Campo Lameiro, Teixoeiras | 42.54658 | −8.54872 | 11.10 | 26.10 | 6.81 | 90 | 1.56 | 11.17 | 0.0000 | 205.24 | 0.091 |
| Pontevedra, Seixiña | 42.53839 | −8.46836 | 12.50 | 26.40 | 6.31 | 80 | 0.83 | 3.07 | 0.0000 | 270.02 | 0.160 |
| Pontevedra, As Laceiras | 42.53042 | −8.41822 | 11.30 | 24.00 | 6.32 | 60 | 1.63 | 30.26 | 0.0000 | 50.92 | 0.962 |
| Ponteareas, Xabriña | 42.20158 | −8.42372 | 11.80 | 36.80 | 6.32 | 80 | 2.23 | 23.69 | 0.2867 | 238.97 | 0.161 |
| Ponteareas, Fragón | 42.19333 | −8.45972 | 12.30 | 61.60 | 6.20 | 90 | 1.64 | 27.09 | 0.0650 | 87.74 | 0.000 |
| Mean | 13.02 | 57.60 | 6.51 | 74.50 | 1.30 | 29.49 | 0.19 | 186.84 | 13.57 |
Table A2.
Modeling macroinvertebrate abundance in relation to environmental variables. Models were fitted by REML with stream as a random term and are ranked by increasing Akaike’s Information Criterion corrected for small samples (AICc). Sample size (n) and the number of parameters (K) are indicated. Models in bold are those more supported judging by their Akaike weight. Models in green are similar to the first model in their statistical support.
| Rank | Model | Deviance | AIC | n | K | AICc | deltaAICc | Relative Likelihood | Akaike Weight |
|---|---|---|---|---|---|---|---|---|---|
| 1 | Season + Flow + Temperature | 509.00 | 551.50 | 39 | 3 | 552.19 | 0.00 | 1.00 | 0.35 |
| 2 | Season + Flow + Temperature + Conductivity | 505.50 | 552.46 | 39 | 4 | 553.64 | 1.45 | 0.48 | 0.17 |
| 3 | Season + Flow + Temperature + Weight native | 504.61 | 553.16 | 39 | 4 | 554.34 | 2.15 | 0.34 | 0.12 |
| 4 | Season + Flow + Temperature + % Eucalypt | 496.92 | 553.39 | 39 | 4 | 554.57 | 2.38 | 0.30 | 0.11 |
| 5 | Season + Flow + Temperature + Width | 497.86 | 553.45 | 39 | 4 | 554.63 | 2.44 | 0.30 | 0.10 |
| 6 | Season + Flow + Temperature + Weight eucalypt | 504.48 | 553.62 | 39 | 4 | 554.80 | 2.61 | 0.27 | 0.10 |
| 7 | Season + Flow | 524.69 | 556.48 | 39 | 2 | 556.81 | 4.63 | 0.10 | 0.03 |
| 20 | Season + FBPOM | 516.69 | 558.66 | 39 | 2 | 558.99 | 6.81 | 0.03 | 0.01 |
| 29 | FBPOM | 530.91 | 560.22 | 39 | 1 | 560.33 | 8.14 | 0.02 | 0.01 |
| 8 | Flow | 546.18 | 565.63 | 39 | 1 | 565.74 | 13.55 | 0.00 | 0.00 |
| 9 | Season + Temperature | 528.63 | 567.99 | 40 | 2 | 568.31 | 16.13 | 0.00 | 0.00 |
| 10 | Season + Conductivity | 536.15 | 568.43 | 40 | 2 | 568.75 | 16.57 | 0.00 | 0.00 |
| 11 | Season + Width | 528.70 | 569.55 | 40 | 2 | 569.87 | 17.69 | 0.00 | 0.00 |
| 12 | Season | 543.21 | 571.49 | 40 | 1 | 571.60 | 19.41 | 0.00 | 0.00 |
| 13 | Season + Weight eucalypt | 537.91 | 572.87 | 40 | 2 | 573.19 | 21.01 | 0.00 | 0.00 |
| 14 | Season + CPOM | 543.25 | 572.88 | 40 | 2 | 573.20 | 21.02 | 0.00 | 0.00 |
| 15 | Season + Weight native | 538.62 | 573.06 | 40 | 2 | 573.38 | 21.20 | 0.00 | 0.00 |
| 16 | Season + Shadow | 538.78 | 573.12 | 40 | 2 | 573.44 | 21.26 | 0.00 | 0.00 |
| 17 | Season + pH | 530.86 | 573.15 | 40 | 2 | 573.47 | 21.29 | 0.00 | 0.00 |
| 18 | Season + Chlorophyll | 539.43 | 573.40 | 40 | 2 | 573.72 | 21.54 | 0.00 | 0.00 |
| 19 | Season + % Eucalypt | 531.17 | 573.54 | 40 | 2 | 573.86 | 21.68 | 0.00 | 0.00 |
| 21 | Conductivity | 555.16 | 574.95 | 40 | 1 | 575.06 | 22.87 | 0.00 | 0.00 |
| 22 | Temperature | 548.32 | 575.31 | 40 | 1 | 575.42 | 23.23 | 0.00 | 0.00 |
| 23 | Weight native | 554.01 | 575.67 | 40 | 1 | 575.78 | 23.59 | 0.00 | 0.00 |
| 24 | CPOM | 558.93 | 575.88 | 40 | 1 | 575.99 | 23.80 | 0.00 | 0.00 |
| 25 | Width | 547.85 | 576.21 | 40 | 1 | 576.32 | 24.13 | 0.00 | 0.00 |
| 26 | Weight eucalypt | 556.22 | 578.77 | 40 | 1 | 578.88 | 26.69 | 0.00 | 0.00 |
| 27 | Shadow | 557.78 | 579.72 | 40 | 1 | 579.83 | 27.64 | 0.00 | 0.00 |
| 28 | pH | 550.01 | 579.82 | 40 | 1 | 579.93 | 27.74 | 0.00 | 0.00 |
| 30 | % Eucalypt | 550.04 | 579.98 | 40 | 1 | 580.09 | 27.90 | 0.00 | 0.00 |
| 31 | Chlorophyll | 558.50 | 580.15 | 40 | 1 | 580.26 | 28.07 | 0.00 | 0.00 |
Table A3.
Modeling macroinvertebrate richness in relation to environmental variables. Models were fitted by REML with stream as a random term and are ranked by increasing Akaike’s Information Criterion corrected for small samples (AICc). Sample size (n) and the number of parameters (K) are indicated. Models in bold are those more supported judging by their Akaike weight. Models in green are similar to the first model in their statistical support.
| Rank | Model | Deviance | AIC | n | K | AICc | deltaAICc | Relative Likelihood | Akaike Weight |
|---|---|---|---|---|---|---|---|---|---|
| 1 | Season + FBPOM | 203.10 | 218.86 | 39 | 2 | 219.19 | 0.00 | 1.00 | 0.32 |
| 2 | % Eucalypt + Season + FBPOM | 198.93 | 220.05 | 39 | 3 | 220.74 | 1.54 | 0.46 | 0.15 |
| 3 | Season + Flow | 214.90 | 220.86 | 39 | 2 | 221.19 | 2.00 | 0.37 | 0.12 |
| 4 | Season + Flow + Temperature | 212.95 | 221.62 | 39 | 3 | 222.31 | 3.11 | 0.21 | 0.07 |
| 5 | % Eucalypt + Season + Flow | 210.39 | 221.67 | 39 | 3 | 222.36 | 3.16 | 0.21 | 0.06 |
| 6 | Season | 212.38 | 223.25 | 40 | 1 | 223.36 | 4.16 | 0.12 | 0.04 |
| 7 | % Eucalypt + Season + Flow + Weight native | 213.62 | 222.85 | 39 | 4 | 224.03 | 4.83 | 0.09 | 0.03 |
| 8 | Season + Temperature | 210.42 | 223.90 | 40 | 2 | 224.22 | 5.03 | 0.08 | 0.03 |
| 9 | % Eucalypt + Season | 207.97 | 224.04 | 40 | 2 | 224.36 | 5.17 | 0.08 | 0.02 |
| 10 | % Eucalypt + Season + Temperature | 205.18 | 223.84 | 40 | 3 | 224.51 | 5.31 | 0.07 | 0.02 |
| 11 | % Eucalypt + Season + Flow + Weight eucalypt | 212.80 | 223.42 | 39 | 4 | 224.60 | 5.40 | 0.07 | 0.02 |
| 12 | Season + Width | 209.86 | 224.70 | 40 | 2 | 225.02 | 5.83 | 0.05 | 0.02 |
| 13 | Weight eucalypt + Season | 216.11 | 224.87 | 40 | 2 | 225.19 | 6.00 | 0.05 | 0.02 |
| 14 | Season + pH | 209.10 | 225.06 | 40 | 2 | 225.38 | 6.19 | 0.05 | 0.01 |
| 15 | Season + CPOM | 221.56 | 225.18 | 40 | 2 | 225.50 | 6.31 | 0.04 | 0.01 |
| 16 | Season + Conductivity | 218.83 | 225.28 | 40 | 2 | 225.60 | 6.41 | 0.04 | 0.01 |
| 17 | Season + Shadow | 217.07 | 225.30 | 40 | 2 | 225.62 | 6.43 | 0.04 | 0.01 |
| 18 | Season + Chlorophyll | 217.39 | 225.32 | 40 | 2 | 225.64 | 6.45 | 0.04 | 0.01 |
| 19 | Weight native + Season | 216.95 | 225.32 | 40 | 2 | 225.64 | 6.45 | 0.04 | 0.01 |
| 20 | % Eucalypt + Season + Weight native | 211.55 | 225.48 | 40 | 3 | 226.15 | 6.95 | 0.03 | 0.01 |
| 21 | % Eucalypt + Season + Weight eucalypt | 210.44 | 225.66 | 40 | 3 | 226.33 | 7.13 | 0.03 | 0.01 |
| 22 | FBPOM | 217.21 | 229.37 | 39 | 1 | 229.48 | 10.28 | 0.01 | 0.00 |
| 23 | Flow | 231.86 | 233.85 | 39 | 1 | 233.96 | 14.76 | 0.00 | 0.00 |
| 24 | Weight native | 232.69 | 237.07 | 40 | 1 | 237.18 | 17.98 | 0.00 | 0.00 |
| 25 | % Eucalypt | 225.88 | 238.16 | 40 | 1 | 238.27 | 19.07 | 0.00 | 0.00 |
| 26 | CPOM | 238.95 | 238.74 | 40 | 1 | 238.85 | 19.65 | 0.00 | 0.00 |
| 27 | Temperature | 229.67 | 239.25 | 40 | 1 | 239.36 | 20.16 | 0.00 | 0.00 |
| 28 | Width | 228.88 | 239.71 | 40 | 1 | 239.82 | 20.62 | 0.00 | 0.00 |
| 29 | pH | 228.12 | 240.07 | 40 | 1 | 240.18 | 20.98 | 0.00 | 0.00 |
| 30 | Chlorophyll | 235.84 | 240.11 | 40 | 1 | 240.22 | 21.02 | 0.00 | 0.00 |
| 31 | Weight eucalypt | 235.28 | 240.14 | 40 | 1 | 240.25 | 21.05 | 0.00 | 0.00 |
| 32 | Conductivity | 237.82 | 240.27 | 40 | 1 | 240.38 | 21.18 | 0.00 | 0.00 |
| 33 | Shadow | 235.84 | 240.31 | 40 | 1 | 240.42 | 21.22 | 0.00 | 0.00 |
Table A4.
Modeling macroinvertebrate diversity (Shannon index) in relation to environmental variables. Models were fitted by REML with stream as a random term and are ranked by increasing Akaike’s Information Criterion corrected for small samples (AICc). Sample size (n) and the number of parameters (K) are indicated. Models in bold are those more supported judging by their Akaike weight. Models in green are similar to the first model in their statistical support.
| Rank | Model | Deviance | AIC | n | K | AICc | deltaAICc | Relative Likelihood | Akaike Weight |
|---|---|---|---|---|---|---|---|---|---|
| 1 | % Eucalypt + Season + Width + pH | −22.50 | −29.68 | 40 | 4 | −28.54 | 0.00 | 1.00 | 0.43 |
| 2 | % Eucalypt + Season + Width | −22.57 | −27.88 | 40 | 3 | −27.21 | 1.32 | 0.52 | 0.22 |
| 3 | % Eucalypt + Season + Width + Weight eucalypt | −13.92 | −26.23 | 40 | 4 | −25.09 | 3.45 | 0.18 | 0.08 |
| 4 | % Eucalypt + Season + Width + Weight native | −12.28 | −25.96 | 40 | 4 | −24.82 | 3.72 | 0.16 | 0.07 |
| 5 | % Eucalypt + Season + Width + Flow | −9.53 | −25.94 | 39 | 4 | −24.76 | 3.77 | 0.15 | 0.07 |
| 6 | % Eucalypt + Season + Flow | −11.01 | −25.31 | 39 | 3 | −24.62 | 3.91 | 0.14 | 0.06 |
| 7 | % Eucalypt + Season + pH | −20.35 | −24.22 | 40 | 3 | −23.55 | 4.98 | 0.08 | 0.04 |
| 8 | % Eucalypt + Flow | −9.78 | −22.14 | 39 | 2 | −21.81 | 6.73 | 0.03 | 0.01 |
| 9 | % Eucalypt + Season | −19.36 | −21.70 | 40 | 2 | −21.38 | 7.16 | 0.03 | 0.01 |
| 10 | % Eucalypt + Season + Weight eucalypt | −10.39 | −19.71 | 40 | 3 | −19.04 | 9.49 | 0.01 | 0.00 |
| 11 | % Eucalypt + Season + Weight native | −9.05 | −19.64 | 40 | 3 | −18.97 | 9.56 | 0.01 | 0.00 |
| 12 | % Eucalypt + Season + CPOM | −3.88 | −19.61 | 40 | 3 | −18.94 | 9.59 | 0.01 | 0.00 |
| 13 | Season | −17.08 | −18.28 | 40 | 1 | −18.17 | 10.36 | 0.01 | 0.00 |
| 14 | % Eucalypt + Width | −14.95 | −17.96 | 40 | 2 | −17.64 | 10.90 | 0.00 | 0.00 |
| 15 | % Eucalypt + pH | −14.18 | −15.84 | 40 | 2 | −15.52 | 13.02 | 0.00 | 0.00 |
| 16 | % Eucalypt | −13.09 | −13.18 | 40 | 1 | −13.07 | 15.46 | 0.00 | 0.00 |
| 17 | % Eucalypt + Weight eucalypt | −5.72 | −12.88 | 40 | 2 | −12.56 | 15.98 | 0.00 | 0.00 |
| 18 | % Eucalypt + CPOM | 0.71 | −12.79 | 40 | 2 | −12.47 | 16.07 | 0.00 | 0.00 |
| 19 | % Eucalypt + Weight native | −4.28 | −12.66 | 40 | 2 | −12.34 | 16.20 | 0.00 | 0.00 |
| 20 | Flow | −1.65 | −12.04 | 39 | 1 | −11.93 | 16.61 | 0.00 | 0.00 |
| 22 | Width | −9.83 | −11.32 | 40 | 1 | −11.21 | 17.32 | 0.00 | 0.00 |
| 21 | % Eucalypt + FBPOM | −10.52 | −11.44 | 39 | 2 | −11.11 | 17.43 | 0.00 | 0.00 |
| 27 | Weight native | −3.24 | −11.02 | 40 | 1 | −10.91 | 17.62 | 0.00 | 0.00 |
| 23 | % Eucalypt + Shadow | −2.57 | −11.22 | 40 | 2 | −10.90 | 17.64 | 0.00 | 0.00 |
| 24 | % Eucalypt + Chlorophyll | −2.22 | −11.22 | 40 | 2 | −10.90 | 17.64 | 0.00 | 0.00 |
| 25 | % Eucalypt + Temperature | −7.96 | −11.22 | 40 | 2 | −10.90 | 17.64 | 0.00 | 0.00 |
| 26 | % Eucalypt + Conductivity | −0.69 | −11.21 | 40 | 2 | −10.89 | 17.65 | 0.00 | 0.00 |
| 33 | FBPOM | −7.84 | −7.55 | 39 | 1 | −7.44 | 21.10 | 0.00 | 0.00 |
| 28 | Weight eucalypt | 1.02 | −6.32 | 40 | 1 | −6.21 | 22.32 | 0.00 | 0.00 |
| 29 | CPOM | 6.71 | −5.44 | 40 | 1 | −5.33 | 23.20 | 0.00 | 0.00 |
| 30 | pH | −5.24 | −5.02 | 40 | 1 | −4.91 | 23.62 | 0.00 | 0.00 |
| 31 | Shadow | 4.50 | −2.79 | 40 | 1 | −2.68 | 25.85 | 0.00 | 0.00 |
| 32 | Conductivity | 6.36 | −2.72 | 40 | 1 | −2.61 | 25.92 | 0.00 | 0.00 |
| 34 | Chlorophyll | 5.41 | −2.13 | 40 | 1 | −2.02 | 26.51 | 0.00 | 0.00 |
| 35 | Temperature | −0.22 | −2.10 | 40 | 1 | −1.99 | 26.54 | 0.00 | 0.00 |
References
- Parker, J.D.; Torchin, M.E.; Hufbauer, R.A.; Lemoine, N.P.; Alba, C.; Blumenthal, D.M.; Bossdorf, O.; Byers, J.E.; Dunn, A.M.; Heckman, R.W.; et al. Do Invasive Species Perform Better in Their New Ranges? Ecology 2013, 94, 985–994. [Google Scholar] [CrossRef] [PubMed]
- Bellard, C.; Cassey, P.; Blackburn, T.M. Alien Species as a Driver of Recent Extinctions. Biol. Lett. 2016, 12, 20150623. [Google Scholar] [CrossRef] [PubMed]
- Havel, J.E.; Kovalenko, K.E.; Thomaz, S.M.; Amalfitano, S.; Kats, L.B. Aquatic Invasive Species: Challenges for the Future. Hydrobiologia 2015, 750, 147–170. [Google Scholar] [CrossRef]
- McKinney, M.L.; Lockwood, J.L. Biotic Homogenization: A Few Winners Replacing Many Losers in the next Mass Extinction. Trends Ecol. Evol. 1999, 14, 450–453. [Google Scholar] [CrossRef]
- Mooney, H.A.; Mack, R.N.; Neville, L.E.; Schei, P.J.; Waage, J.K. Invasive Alien Species: A New Synthesis; Island Press: Washington, DC, USA, 2005. [Google Scholar]
- Pyšek, P.; Hulme, P.E.; Simberloff, D.; Bacher, S.; Blackburn, T.M.; Carlton, J.T.; Dawson, W.; Essl, F.; Foxcroft, L.C.; Genovesi, P.; et al. Scientists’ Warning on Invasive Alien Species. Biol. Rev. 2020, 95, 1511–1534. [Google Scholar] [CrossRef]
- Stanturf, J.A.; Vance, E.D.; Fox, T.R.; Kirst, M. Eucalyptus beyond Its Native Range: Environmental Issues in Exotic Bioenergy Plantations. Int. J. For. Res. 2013, 2013, e463030. [Google Scholar] [CrossRef]
- Tomé, M.; Almeida, M.H.; Barreiro, S.; Branco, M.R.; Deus, E.; Pinto, G.; Silva, J.S.; Soares, P.; Rodríguez-Soalleiro, R. Opportunities and Challenges of Eucalyptus Plantations in Europe: The Iberian Peninsula Experience. Eur. J. For. Res. 2021, 140, 489–510. [Google Scholar] [CrossRef]
- Iglesias-Carrasco, M.; Torres, J.; Cruz-Dubon, A.; Candolin, U.; Wong, B.B.M.; Velo-Antón, G. Global Impacts of Exotic Eucalypt Plantations on Wildlife. Biol. Rev. 2025, brv70022. [Google Scholar] [CrossRef]
- Nunes, L.J.R.; Meireles, C.I.R.; Pinto Gomes, C.J.; Almeida Ribeiro, N.M.C. Historical Development of the Portuguese Forest: The Introduction of Invasive Species. Forests 2019, 10, 974. [Google Scholar] [CrossRef]
- Ferreira, V.; Boyero, L.; Calvo, C.; Correa, F.; Figueroa, R.; Gonçalves, J.F.; Goyenola, G.; Graça, M.A.S.; Hepp, L.U.; Kariuki, S.; et al. A Global Assessment of the Effects of Eucalyptus Plantations on Stream Ecosystem Functioning. Ecosystems 2019, 22, 629–642. [Google Scholar] [CrossRef]
- Cordero-Rivera, A. O Eucalipto é Como o Estado: Chupa e Leva Todo Para El. Recur. Rurais 2019, 15, 19–33. [Google Scholar] [CrossRef]
- Graça, M.A.S. The Role of Invertebrates on Leaf Litter Decomposition in Streams-A Review. Internat. Rev. Hydrobiol. 2001, 86, 383–393. [Google Scholar] [CrossRef]
- Graça, M.A.; Pozo, J.; Canhoto, C.; Elosegi, A. Effects of Eucalyptus Plantations on Detritus, Decomposers, and Detritivores in Streams. Sci. World 2002, 2, 1173–1185. [Google Scholar] [CrossRef] [PubMed]
- González, J.M.; Graça, M.A.S. Conversion of Leaf Litter to Secondary Production by a Shredding Caddis-fly. Freshw. Biol. 2003, 48, 1578–1592. [Google Scholar] [CrossRef]
- Ferreira, V.; Koricheva, J.; Pozo, J.; Graça, M.A.S. A Meta-Analysis on the Effects of Changes in the Composition of Native Forests on Litter Decomposition in Streams. For. Ecol. Manag. 2016, 364, 27–38. [Google Scholar] [CrossRef]
- Pereira, M.; Greet, J.; Jones, C.S. Native Riparian Plant Species Dominate the Soil Seedbank of In-Channel Geomorphic Features of a Regulated River. Environ. Manag. 2021, 67, 589–599. [Google Scholar] [CrossRef]
- Oester, R.; Altermatt, F.; Bruder, A. Riparian Forests Shape Trophic Interactions in Detrital Stream Food Webs. Funct. Ecol. 2024, 38, 2196–2206. [Google Scholar] [CrossRef]
- Cordero-Rivera, A.; Martínez Álvarez, A.; Álvarez, M. Eucalypt Plantations Reduce the Diversity of Macroinvertebrates in Small Forested Streams. Anim. Biodivers. Conserv. 2017, 40, 87–97. [Google Scholar] [CrossRef]
- Abelho, M.; Graça, M.A.S. Effects of Eucalyptus Afforestation on Leaf Litter Dynamics and Macroinvertebrate Community Structure of Streams in Central Portugal. Hydrobiologia 1996, 324, 195–204. [Google Scholar] [CrossRef]
- Canhoto, C.; Graça, M.A.S. Food Value of Introduced Eucalypt Leaves for a Mediterranean Stream Detritivore: Tipula Lateralis. Freshw. Biol. 1995, 34, 209–214. [Google Scholar] [CrossRef]
- Canhoto, C.; Graça, M.A.S. Leaf Barriers to Fungal Colonization and Shredders (Tipula Lateralis) Consumption of Decomposing Eucalyptus Globulus. Microb. Ecol. 1999, 37, 163–172. [Google Scholar] [CrossRef] [PubMed]
- Carvalho, E.M.; Graça, M.A.S. A Laboratory Study on Feeding Plasticity of the Shredder Sericostoma Vittatum Rambur (Sericostomatidae). Hydrobiologia 2007, 575, 353–359. [Google Scholar] [CrossRef]
- O’Connell, A.M.; Menagé, P.M.A. Litter Fall and Nutrient Cycling in Karri (Eucalyptus Diversicolor F. Muell.) Forest in Relation to Stand Age. Aust. J. Ecol. 1982, 7, 49–62. [Google Scholar] [CrossRef]
- Pozo, J. Leaf Litter Processing of Alder and Eucalyptus in the Agüera Stream System (North Spain) I. Chemical Changes. Arch. Hydrobiol. 1993, 127, 299–317. [Google Scholar] [CrossRef]
- Molinero, J.; Pozo, J.; Gonzalez, E. Litter Breakdown in Streams of the Agüera Catchment: Influence of Dissolved Nutrients and Land Use. Freshw. Biol. 1996, 36, 745–756. [Google Scholar] [CrossRef]
- Pozo, J.; Basaguren, A.; Elósegui, A.; Molinero, J.; Fabre, E.; Chauvet, E. Afforestation with Eucalyptus Globulus and Leaf Litter Decomposition in Streams of Northern Spain. In Oceans, Rivers and Lakes: Energy and Substance Transfers at Interfaces; Amiard, J.-C., Le Rouzic, B., Berthet, B., Bertru, G., Eds.; Springer: Dordrecht, The Netherlands, 1998; pp. 101–109. ISBN 978-94-010-6216-9. [Google Scholar]
- Ferreira, V.; Larrañaga, A.; Gulis, V.; Basaguren, A.; Elosegi, A.; Graça, M.A.S.; Pozo, J. The Effects of Eucalypt Plantations on Plant Litter Decomposition and Macroinvertebrate Communities in Iberian Streams. For. Ecol. Manag. 2015, 335, 129–138. [Google Scholar] [CrossRef]
- Pozo, J.; Gonzalez, E.; Diez, J.R.; Molinero, J.; Elosegui, A. Inputs of Particulate Organic Matter to Streams with Different Riparian Vegetation. J. N. Am. Benthol. Soc. 1997, 16, 602–611. [Google Scholar] [CrossRef]
- Carballeira, A.; Devesa, C.; Retuerto, R.; Santillán, E.; Ucieda, F. Bioclimatología de Galicia; Fundación Barrié de la Maza: A Coruña, Spain, 1983. [Google Scholar]
- García, X.R. Guía Das Plantas de Galicia; Edicións Xerais de Galicia: Vigo, Spain, 2008. [Google Scholar]
- Consellería Do Medio Rural Primeiros Resultados Do Inventario Forestal Continuo de Galicia. In Estimación de Superficies a Partires Do Mapa Forestal de Media Resolución; Xunta de Galicia: Santiago de Compostela, Spain, 2023.
- Lowe, R.L.; La Liberté, G.D. Benthic Stream Algae: Distribution and Structure. In Methods in Stream Ecology; Hauer, F.R., Lamberti, G.A., Eds.; Academic Press: San Diego, CA, USA, 2007; pp. 193–221. [Google Scholar]
- Anderson, D.R.; Burnham, K.P.; Thompson, W.L. Null Hypothesis Testing: Problems, Prevalence, and an Alternative. J. Wildl. Manag. 2000, 64, 912–923. [Google Scholar] [CrossRef]
- Johnson, D.H. The Insignificance of Statistical Significance Testing. J. Wildl. Manag. 1999, 63, 763–772. [Google Scholar] [CrossRef]
- Moreno, C.E. Métodos Para Medir La Biodiversidad; Manuales y Tesis SEA.: Zaragoza, Spain, 2000; Volume 1. [Google Scholar]
- Anderson, D.R.; Link, W.A.; Johnson, D.H.; Burnham, K.P. Suggestions for Presenting the Results of Data Analyses. J. Wildl. Manag. 2001, 65, 373–378. [Google Scholar] [CrossRef]
- Molinero, J.; Pozo, J. Impact of a Eucalyptus (Eucalyptus Globulus Labill.) Plantation on the Nutrient Content and Dynamics of Coarse Particulate Organic Matter (CPOM) in a Small Stream. Hydrobiologia 2004, 528, 143–165. [Google Scholar] [CrossRef]
- Mah, A.N.M.M.A.; Puan, C.H.; Isa, M.F.M.; Saadun, N.; Razi, N.A. Response of Aquatic Fauna towards Eucalypt Plantations: A Review. Malays. For. 2022, 85, 141–151. [Google Scholar]
- Cordero-Rivera, A. Cuando Los Árboles No Dejan Ver El Bosque: Efectos de Los Monocultivos Forestales En La Conservación de La Biodiversidad. Acta Biol. Colomb. 2011, 16, 247–268. [Google Scholar]
- Graça, M.A.S.; Ferreira, V.; Canhoto, C.; Encalada, A.C.; Guerrero-Bolaño, F.; Wantzen, K.M.; Boyero, L. A Conceptual Model of Litter Breakdown in Low Order Streams. Internat. Rev. Hydrobiol. 2015, 100, 1–12. [Google Scholar] [CrossRef]
- González-Paz, L.; Gestido, J.; Delgado, C.; Pedrol, N.; Pardo, I. Short-Term Effect of Eucalyptus Leachates on Green Food Webs in Headwaters. Water 2022, 15, 115. [Google Scholar] [CrossRef]
- Tubić, B.; Andjus, S.; Zorić, K.; Vasiljević, B.; Jovičić, K.; Čanak Atlagić, J.; Paunović, M. Aquatic Insects (Ephemeroptera, Plecoptera and Trichoptera) Metric as an Important Tool in Water Quality Assessment in Hilly and Mountain Streams. Water 2024, 16, 849. [Google Scholar] [CrossRef]
- do Amaral, P.H.M.; Rocha, C.H.B.; Alves, R.D.G. Effect of Eucalyptus Plantations on the Taxonomic and Functional Structure of Aquatic Insect Assemblages in Neotropical Springs. Stud. Neotrop. Fauna Environ. 2023, 58, 35–46. [Google Scholar] [CrossRef]
- Peixoto, S.S.D.J.; Guimarães, L.P.; Alves, R.D.G. Influence of Eucalyptus Plantations on Benthic Macroinvertebrate Assemblages in Neotropical Springs. Acta Limnol. Bras. 2024, 36, e24. [Google Scholar] [CrossRef]
- de Agricultura, M.; Ambiente, A.Y.M. Protocolo de Muestreo y Laboratorio de Fauna Bentónica de Invertebrados En Ríos Vadeables. Código: ML-Rv-I-2013; Ministerio de Agricultura, Alimentación y Medio Ambiente: Madrid, Spain, 2013. [Google Scholar]
- Bonada, N.; Prat, N.; Munné, A.; Plans, M.; Solà, C.; Álvarez, M.; Pardo, I.; Moyà, G.; Ramon, G.; Toro, M.; et al. Intercalibración de La Metodología GUADALMED. Selección de Un Protocolo de Muestreo Para La Determinación Del Estado Ecológico de Los Ríos Mediterráneos. Limnética 2002, 21, 13–33. [Google Scholar] [CrossRef]
- MeteoGalicia Informe Climatolóxico Outono 2020; Xunta de Galicia: Santiago de Compostela, Spain, 2020; p. 18.
- MeteoGalicia Informe Climatolóxico Primavera 2021; Xunta de Galicia: Santiago de Compostela, Spain, 2021; p. 17.
- Erdozain, M.; Kidd, K.; Kreutzweiser, D.; Sibley, P. Linking Stream Ecosystem Integrity to Catchment and Reach Conditions in an Intensively Managed Forest Landscape. Ecosphere 2018, 9, e02278. [Google Scholar] [CrossRef]
- Da Silva, E.C.; De Azevedo, K.D.F.S.; De Carvalho, F.G.; Juen, L.; Da Rocha, T.S.; Oliveira-Junior, J.M.B. Impacts of Oil Palm Monocultures on Freshwater Ecosystems in the Amazon: A Case Study of Dragonflies and Damselflies (Insecta: Odonata). Aquat. Sci. 2025, 87, 1. [Google Scholar] [CrossRef]
- Cunha, E.J.; Juen, L. Impacts of Oil Palm Plantations on Changes in Environmental Heterogeneity and Heteroptera (Gerromorpha and Nepomorpha) Diversity. J. Insect Conserv. 2017, 21, 111–119. [Google Scholar] [CrossRef]
- Ferreira, M.C.; Begot, T.O.; Da Silveira Prudente, B.; Juen, L.; De Assis Montag, L.F. Effects of Oil Palm Plantations on Habitat Structure and Fish Assemblages in Amazon Streams. Environ. Biol. Fishes 2018, 101, 547–562. [Google Scholar] [CrossRef]
- Correa, F.S.; Juen, L.; Rodrigues, L.C.; Silva-Filho, H.F.; Santos-Costa, M.C. Effects of Oil Palm Plantations on Anuran Diversity in the Eastern Amazon. Anim. Biol. 2015, 65, 321–335. [Google Scholar] [CrossRef]
- Goded, S.; Ekroos, J.; Domínguez, J.; Azcárate, J.G.; Guitián, J.A.; Smith, H.G. Effects of Eucalyptus Plantations on Avian and Herb Species Richness and Composition in North-West Spain. Glob. Ecol. Conserv. 2019, 19, e00690. [Google Scholar] [CrossRef]
- García-Fernández, F.; Vidal, M.; Regos, A.; Domínguez, J. Eucalyptus Cover as the Primary Driver of Native Forest Bird Reductions: Evidence from a Stand-Scale Analysis in NW Iberia. For. Ecol. Manag. 2025, 586, e122714. [Google Scholar] [CrossRef]
- de Galicia, X. LEI 3/2018, do 26 de decembro, de Medidas Fiscais e Administrativas. D. Of. De Galicia 2018, 247, 54319–54435. [Google Scholar]
- Hickey, M.B.C.; Doran, B. A Review of the Efficiency of Buffer Strips for the Maintenance and Enhancement of Riparian Ecosystems. Water Qual. Res. J. Can. 2004, 39, 311–317. [Google Scholar] [CrossRef]
- Braun, B.M.; Pires, M.M.; Stenert, C.; Maltchik, L.; Kotzian, C.B. Effects of Riparian Vegetation Width and Substrate Type on Riffle Beetle Community Structure. Entomol. Sci. 2018, 21, 66–75. [Google Scholar] [CrossRef]
- Raitif, J.; Plantegenest, M.; Roussel, J.M. From Stream to Land: Ecosystem Services Provided by Stream Insects to Agriculture. Agric. Ecosyst. Environ. 2019, 270–271, 32–40. [Google Scholar] [CrossRef]
- Rivas-Torres, A.; Cordero-Rivera, A. A Review of the Density, Biomass, and Secondary Production of Odonates. Insects 2024, 15, 510. [Google Scholar] [CrossRef] [PubMed]
- Liu, C.L.C.; Kuchma, O.; Krutovsky, K.V. Mixed-Species versus Monocultures in Plantation Forestry: Development, Benefits, Ecosystem Services and Perspectives for the Future. Glob. Ecol. Conserv. 2018, 15, e00419. [Google Scholar] [CrossRef]
- Manson, D.G.; Schmidt, S.; Bristow, M.; Erskine, P.D.; Vanclay, J.K. Species-Site Matching in Mixed Species Plantations of Native Trees in Tropical Australia. Agrofor. Syst. 2013, 87, 233–250. [Google Scholar] [CrossRef]
- Schnabel, F.; Beugnon, R.; Yang, B.; Richter, R.; Eisenhauer, N.; Huang, Y.; Liu, X.; Wirth, C.; Cesarz, S.; Fichtner, A.; et al. Tree Diversity Increases Forest Temperature Buffering via Enhancing Canopy Density and Structural Diversity. Ecol. Lett. 2025, 28, e70096. [Google Scholar] [CrossRef]

Disclaimer/Publisher’s Note: The statements, opinions and data contained in all publications are solely those of the individual author(s) and contributor(s) and not of MDPI and/or the editor(s). MDPI and/or the editor(s) disclaim responsibility for any injury to people or property resulting from any ideas, methods, instructions or products referred to in the content. |
© 2025 by the authors. Licensee MDPI, Basel, Switzerland. This article is an open access article distributed under the terms and conditions of the Creative Commons Attribution (CC BY) license (https://creativecommons.org/licenses/by/4.0/).