Article

Key Habitat and Predatory Influences on the Community- and Species-Level Population Dynamics of Spring-Breeding Amphibian Larvae Within a Remnant Tupelo-Cypress Wetland

1
School of Biological Sciences, Southern Illinois University, Carbondale, IL 62901, USA
2
Prairie Research Institute, University of Illinois Urbana-Champaign, Champaign, IL 61820, USA
*
Author to whom correspondence should be addressed.
Hydrobiology 2025, 4(2), 15; https://doi.org/10.3390/hydrobiology4020015
Submission received: 29 March 2025 / Revised: 3 May 2025 / Accepted: 27 May 2025 / Published: 30 May 2025

Abstract

Understanding the factors influencing amphibian populations is essential for effective freshwater conservation, particularly for species with biphasic life histories. This study examined how pond- and landscape-level characteristics shape larval amphibian occupancy, abundance, and detection in a remnant Tupelo-Cypress wetland in southeastern Illinois. Given the small number of available ponds (n = 4), we standardized survey effort across sites and incorporated robust hierarchical Bayesian models to evaluate environmental effects at both community and species levels. Occupancy probabilities were generally high across species, with canopy cover significantly increasing both community and species occupancy, particularly for salamanders (up to 6.4-fold). Predatory backswimmers and fish substantially reduced occupancy (by 21.7-fold and 6.0-fold, respectively). Anurans, especially Pseudacris spp., were more abundant than salamanders, with abundance positively associated with canopy cover, leaf litter, and pond perimeter. Detection probabilities were generally low and varied by species, with predatory invertebrates reducing detection up to 83.3-fold. These findings underscore the importance of maintaining canopy cover while mitigating predation risks to support amphibian populations. The application of multi-species hierarchical models provides a nuanced understanding of species-specific responses, offering valuable insights for conservation strategies in regions affected by habitat loss and climate change. However, given the limited spatial replication, these findings should be interpreted cautiously and validated through additional studies across broader temporal and spatial scales.

1. Introduction

The persistence of organisms with complex biphasic life histories, characterized by distinct aquatic larval and semi-aquatic post-metamorphic (i.e., adult) stages, depends heavily on the environmental conditions and pressures experienced during their aquatic larval stage [1,2]. These conditions shape key behavioral, physiological, and morphological traits that are critical for successful recruitment into post-metamorphic breeding populations [3]. Habitat suitability and associated pressures, such as predation and resource availability, play pivotal roles in regulating the global distribution and persistence of these organisms [4]. With accelerating anthropogenic changes, understanding the drivers of species distributions and population dynamics becomes increasingly critical for informing effective conservation strategies and habitat management [5]. However, identifying the key abiotic and biotic factors influencing community and species-specific patterns across landscapes remains challenging, particularly as perfect detection is impossible [6,7].
Biphasic amphibians are vital components of ecosystem function, playing roles in aquatic and terrestrial nutrient cycling, energy flow, and predator-prey dynamics [8,9,10,11]. Yet, they are among the most threatened vertebrate groups, with 41% of species facing extinction due to pressures operating across spatial scales [12,13]. Their vulnerability is compounded by their biphasic life history, as the aquatic larval stage is particularly sensitive to abiotic factors such as temperature, dissolved oxygen, and hydroperiod, as well as biotic pressures like predation, competition, and disease [14,15,16,17]. These larval-stage conditions not only influence survival to metamorphosis, but also impact subsequent adult health, reproductive success, and population viability [18,19,20,21].
Key habitat factors such as hydroperiod, availability of reproductive resources, temperature, food availability, and predation risks critically influence larval amphibian communities [22,23]. Various physiological processes including growth, metabolism, and the timing of metamorphosis are directly moderated by these environmental conditions [18,21,24,25]. For instance, reduced dissolved oxygen or elevated temperatures, or changes in water levels can impose physiological pressures and cue changes in development that impact fitness across life stages [26,27,28,29]. In turn, these effects can cascade into adult populations, influencing body condition and fecundity [30,31]. Anthropogenic habitat alterations can exacerbate these pressures, with changes in hydroperiod, thermal regimes, and predation dynamics presenting heightened challenges [4,32,33]. Early pond drying, for example, disproportionately affects smaller water bodies, while the introduction of novel predators into historically predator-free habitats disrupts existing community dynamics [34,35].
Environmental factors can interact in complex ways, further complicating their impact on larval amphibians [36,37]. For instance, hydroperiod and temperature may jointly influence predator abundance and larval survival, while density-dependent effects such as resource competition can exacerbate these pressures [24,38]. Additionally, evolutionary adaptations can drive species-specific responses to environmental conditions [39]. Differences in behavior, growth rates, and development times among species contribute to varied physiological vulnerabilities and survival strategies [40]. These species-specific responses, shaped by shared evolutionary histories, add another layer of complexity to understanding community dynamics [41,42].
The multifaceted nature of these factors underscores the difficulty of disentangling the primary drivers of larval amphibian occupancy, abundance, and detection [43]. Within heterogeneous pond and wetland landscapes, ponds differ in aquatic habitat factors such as area, canopy cover, dissolved oxygen, maximum depth, hydroperiod, and predation pressures [44,45,46]. These variations can affect both community-level dynamics and species-specific responses, making it challenging to obtain robust estimates of population parameters [33,47]. Imperfect detectability, driven by unequal distributions and species’ habitat preferences, further complicates this process [48].
Multi-species occupancy models (MSOMs) with Bayesian inference provide a powerful framework for addressing the challenges of estimating occupancy, abundance, and detection in complex ecological systems with imperfect detection and sparse data [49,50]. This hierarchical framework links community- and species-level sub-models, enabling the simultaneous estimation of key population parameters while accounting for species-specific responses and sampling uncertainty [51,52,53]. By borrowing strength from frequently observed species, MSOMs improve parameter estimates for rare or cryptic taxa, yielding more accurate insights into metacommunity structure [49,54,55]. The framework also incorporates habitat-specific covariates, allowing researchers to assess how environmental conditions influence amphibian dynamics across ecological scales [56,57,58]. Key advantages of this approach include partial pooling of information across species (i.e., posterior shrinkage), the ability to account for overdispersion and interspecific variability through random effects, and enhanced inference under limited spatial replication, such as in small or fragmented wetland landscapes [52,53].
To investigate these complex ecological interactions, we evaluated the effects of pond- and landscape-level characteristics on larval amphibian occupancy, abundance, and detection probabilities in a remnant Tupelo-Cypress wetland complex in southeastern Illinois. We assessed the influence of key habitat features, including pond area, canopy cover, food and refuge resources, and the presence and abundance of aquatic predators at both the community and species levels. We hypothesized that predatory fish and invertebrates would negatively affect occupancy and detection probabilities across all species (Figure 1), while species-specific differences in occupancy and abundance would reflect divergent life history strategies. Our findings demonstrate the utility of hierarchical MSOMs in disentangling the relative contributions of habitat and predation pressures, even in systems with limited spatial replication. These results provide valuable insights for amphibian conservation and highlight the importance of targeted studies on predator impacts and habitat management to support diverse amphibian communities in increasingly fragmented wetland landscapes.

2. Materials and Methods

2.1. Study Area

Our study was conducted in Buttonland Swamp (BLS), a relatively small 1.8 km2 (450-acre), remnant Cypress-Tupelo wetland complex in southeastern Illinois. Importantly, BLS represents the northernmost Cypress-Tupelo wetland in the United States, supporting plant and animal assemblages at the edge of their biogeographic range. This transitional positioning makes it ecologically significant for both regional biodiversity and climate resilience. As such, BLS is designated as a Ramsar-recognized wetland [59], an Illinois Land and Water Reserve, and a focal area of the Illinois Wildlife Action Plan Streams Campaign. BLS is part of the larger Cache River State Natural Area (CRSNA) and is managed by the Illinois Department of Natural Resources. The CRSNA encompasses diverse habitats, including low-gradient rivers, shallow lentic areas, forested and emergent wetlands, and ephemeral ponds [60]. BLS primarily consists of forested and emergent wetlands, and ephemeral ponds [61,62].
During the winter and early spring of 2023, local rainfall patterns limited BLS to only consist of four water-filled ponds with defined boundaries. The ponds, separated by at least 400 m, varied in wetted size, hydroperiod (last duration of consistent water retention since 1 January 2022), maximum water depth, predator presence/abundance, and structural features such as leaf litter and canopy cover concentration/abundance (Table S1). Specifically, our study ponds consisted of a small (mean area: 216 m2), ephemeral (mean hydroperiod: 96 days), fishless pond, a medium-sized (1350 m2), ephemeral (123 days), fishless pond, a medium-sized (1060 m2), permanent pond (461 days) with predatory fish, and a large (11,855 m2), semi-ephemeral (145 days), fishless pond.

2.2. Larval Amphibian and Aquatic Predator Surveys

Over six weeks from April to May 2023, we conducted three systematic dipnet surveys at each pond at 14-day intervals. This timeframe corresponded with the larval period of the spring-breeding amphibians in the region [63]. Surveys were performed using long-handled dipnets (0.419 × 0.419 m2, 794 μm mesh; Perfect Dipnet Model 7P, Jonah’s Aquarium, Columbus, OH). To accommodate the wide range of pond sizes (mean range: 216–11,855 m2), we employed a perimeter-modified sampling method developed by Hutton et al. [62] derived from the area-scaled methods of Denton and Richter [64] and Hamer et al. [32]. This approach ensured comprehensive coverage of suitable microhabitats while adjusting survey effort proportionally to pond size. This survey design consisted of conducting three dipnet sweeps at 10 m intervals along the ponds’ perimeter. At each 10 m interval, three sweeps were made from the shoreline toward the pond center, spaced approximately 2 m apart and extending roughly 0.6 m in length [62]. In cases where a pond section did not allow for three sweeps, the maximum feasible number (1–2) was recorded. This survey approach aimed to minimize capture bias and maximize detection, by allowing for randomized sampling across key microhabitats, including cattail stands, emergent grass, and shallow and deep leaf litter [65]. As such, the number of dipnet sweeps represented the pond perimeter-scaled survey effort.
After each sweep, the larval anurans (frogs) and salamanders, predatory fish, and aquatic invertebrate predators were collected and placed in separate containers to prevent predation during processing. Once all sweeps were completed, the larval amphibians and aquatic predators were identified and counted using the diagnostic keys and illustrations in Phillips et al. (2022) and Altig et al. (2015) for larval amphibians [63,66] and Merritt and Cummins (2008) for aquatic macroinvertebrates [67]. These sources provided species- and family-level identification features based on morphology, pigmentation, gill structure, and size class. Predatory aquatic invertebrates were categorized into four taxonomic/functional groups: adult hemipterans (Notonectidae: backswimmers), adult and larval coleopterans (Dytiscidae and Gyrinidae: beetles), decapods (Cambaridae: crayfish), and larval Odonata/Zygoptera (dragonflies). Predatory fish (Aphredoderidae: pirate perch and Centrarchidae: sunfishes) were recorded as present or absent, as they were only observed in one pond. All animals were returned to their respective ponds within one hour of capture, and no mortality occurred during processing.
The larval amphibians within our ponds represented all seven spring-breeding species known to be present in the study area, which included four salamanders and three anurans. As we were unable to reliably distinguish the larvae of Pseudacris crucifer (spring peeper) and P. feriarum (upland chorus frog) and both species’ egg masses were present in the ponds, they were grouped together as Pseudacris spp. Thus, for the species-level analyses, we considered six species/groups (hereafter referred to as species): the salamanders Ambystoma maculatum (spotted salamander), A. talpoideum (mole salamander), A. texanum (smallmouth salamander) in the family Ambystomatidae and Siren intermedia (lesser siren) in Sirenidae, and the anurans Lithobates sphenocephalus (southern leopard frog) in Ranidae and Pseudacris spp. (chorus frogs) in Hylidae.

2.3. Site- and Habitat-Specific Covariates

Using expert knowledge of the study system, larval amphibian natural history, the focal amphibian species, and similar modeling approaches, we measured and recorded the site/survey and habitat/environmental covariates thought most likely to influence the separate probabilities of occupancy and detection and abundance estimates of the spring-breeding larval amphibians in our study area [32,33,63,68,69,70,71]. These covariates consisted of the wetted pond surface area (area: m2), perimeter (perm: m), hydroperiod (hydro: days), canopy cover above the pond (can: %), submerged leaf litter (leaf: %), submerged vegetation (veg: %), maximum water depth (depth: cm), dissolved water oxygen content (DO: mg/L), water temperature (temp: °C), survey effort (effort: number of dipnet sweeps), the number of days since the last rain event (DSLR), Julian Date (JD: the number of days since 1 January 2023), and the number of non-conspecific larval amphibian competitors (comp), non-conspecific predatory larval salamanders (salapred), fish (fish: absence (0) or presence (1)), and the number of predatory backswimmers (backswim), crayfish, beetles, and dragonflies (Table S1). Although forest cover has been known to influence various larval amphibian population parameters [32,72], the forest cover adjacent and between all our pond sites was 100%; therefore, forest cover was not included in our models.
We estimated the pond-specific area and perimeter for regularly-shaped ponds using equations for an ellipse. We obtained the necessary measurements for the length along the longest wetted transect and width perpendicular to the length transect with the aid of a digital rangefinder. For irregularly-shaped ponds, we split the pond into discrete segments and summed the individual values obtained with the appropriate geometric equations. To estimate leaf litter and submerged vegetation (veg) concentrations, we used 2 × 2 m (4 m2) quadrats randomly placed along the perimeter of the pond [73]. We scaled our effort to measure one quadrat per 25 m2 of pond area, with a maximum of 10 quadrats per survey. A random number generator determined the clockwise locations (m) from the first dipnet location and the distance from the shoreline to be placed 1–10 m from the shoreline following our dipnetting protocol. Values for leaf and veg were obtained by averaging the respective estimates from each quadrat following Simpkins et al. [73]. Maximum depth (depth) was obtained by locating and measuring the pond’s deepest location. Canopy cover (can) was estimated by averaging spherical densiometer readings from the four wetted cardinal direction pond edge extents and center [74]. We obtained water DO and temperature by averaging the digital measurements at each of the five locations described above. Lastly, we utilized terrestrial and aquatic Embedded Data Systems© Thermochron iButton temperature loggers at each site to determine the survey-specific hydroperiod by comparing the daily variances between them [75].

2.4. Covariate Scaling and Selection

Prior to model building, continuous covariates were standardized to reduce parameter estimation biases by centering each with a mean of 0 and scaling them to have a standard deviation (SD) of 1, whereas the categorical covariate fish, was scaled to −1 (absent) and 1 (present) [50,51,76,77]. Covariates lacking considerable variation across both ponds and surveys (e.g., DO, DSLR, temp, and veg; Table S1) were excluded to simplify models and reduce parameter estimate uncertainty [78,79]. To avoid multicollinearity, covariates with high variance inflation factors (VIF > 3) or strong pairwise Spearman correlations (|r| > 0.7) were not included within the same sub-model [80,81]. Pond hydroperiod, was highly correlated with fish presence (|r| = 0.93), as such, we opted to use only fish presence and not hydroperiod in our sub-models due to their established negative effects on larval amphibians [20,34,82,83]. Additionally, hydroperiod was correlated with several other key covariates (e.g., comp, crayfish, depth, dragonfly, leaf; |r| > 0.73) and was therefore excluded from our models altogether. Among the remaining covariates, depth was strongly correlated with crayfish, dragonfly, fish, leaf, and salapred (|r| > 0.74; Table S2). Other than between perimeter and beetles (|r| = 0.76), there were no strong correlative relationships between survey effort or pond size and any environmental or predator covariates (all |r| < 0.7; Table S2). Although we recognize that multicollinearity is often inevitable in ecological datasets, our decision to exclude strongly correlated covariates was based on the need to reduce overfitting risk and enhance model stability given our small sample size [78,79]. Alternative approaches such as dimensionality reduction or regularization may be more appropriate in larger datasets but were not feasible under the constraints of our study system.

2.5. Modeling

We utilized an extension of the MSOM family of models to evaluate the primary habitat and predation factors influencing the population parameters of the spring-breeding amphibian larval community [48,84]. Occupancy probability (ψ) was modeled using a Bernoulli process, while abundance (λ) was estimated conditionally on occupancy using a Poisson distribution [50,51,55]. While occupancy and abundance are linked, they were estimated through separate sub-models rather than occupancy being derived from abundance [76,85]. This structure allows for improved inference on both the presence and abundance of larval amphibians across a diverse wetland habitat. The linkage of multiple species into a single encompassing hierarchical model improves the precision of both community- and species-level responses to environmental covariates, as rare species borrow strength from more common ones [49,51,86]. Additionally, this integrated framework accounts for overdispersion and interspecific variation in reproductive parameters, such as clutch size, while estimating how environmental covariates influence larval occupancy, abundance, and detection probabilities at both community and species levels [32].
Our study ponds were spaced by more than twice the known maximum dispersal distance of the amphibian species in the region (i.e., 200 m) [63,70] and the entire study occurred over a relatively brief timescale (six weeks). Thus, we assumed ponds were independent, closed systems with no significant spatial autocorrelation or larval movement among sites during the study period. However, due to the small number of ponds (n = 4), we did not apply formal spatial autocorrelation tests but acknowledge it as a potential source of unmeasured variation. Importantly, we found sufficient variation across ponds and surveys for most of the covariates we examined (Table S1). Nonetheless, we also acknowledge the potential inferential limitations due to our small sample size and lack of spatial replication. However, the unique climatic and ecological conditions within BLS made the replication of pond types and hydroperiods impossible. Our study design instead focused on improving precision and interpretability of occupancy, abundance, and detection estimates at the community and individual species level. We achieved this by carefully modifying the sampling design to maximize standardized survey effort, temporal replication, and applying robust hierarchical Bayesian modeling approaches. Ultimately, these methods simplify interpretation and ensure consistency across sub-models while avoiding redundancy in effort correction [87].
We implemented single-season, closed, multi-species hierarchical models following the Bayesian N-mixture formulation by Royle [88] and Royle et al. [89]. Sub-models for occupancy, abundance conditional on occupancy, and detection also conditional on occupancy included community- and species-level covariates as well as random effects to address overdispersion and variability in larval amphibian occurrences and counts across sites, surveys, and species. The community- and species-level sub-models were interconnected through shared latent variables and random effects [90]. Random effects for unexplained variation (ε) were incorporated into occupancy (ψ), abundance (λ), and detection (p) estimates to mitigate the potential biases caused by overdispersion in count data [32,65,91,92].

2.6. Occupancy Model

The probability of occupancy (ψ) was modeled using the ten community- and species-level covariates area, backswim, beetle, can, crayfish, depth, dragonfly, fish, leaf, and salapred. These covariates were selected to represent factors influencing breeding site selection and larval survival [28,93,94,95,96,97]. Occupancy was modeled as a Bernoulli process:
z [ g ,   s ] ~ B e r n o u l i i ( ψ [ g ,   s ] )  
where z[g, s] represents the latent occupancy state of site g by species s. Here, z[g, s] = 1 if site g is occupied by species s, and z[g, s] = 0, otherwise [48]. The occupancy probability ψ[g, s] was expressed as a logit-link function of community- and species-level parameters, covariate effects (k), and a random site-level overdispersion effect to account for differences in occupancy among ponds:
l o g i t ( ψ g ,   s ) = ψ 0 + ψ 0 s + k = 1 10 ψ k + ψ k s ψ k [ g ,   s ] + ϵ ψ [ g ]
where ψ0 is the community-level intercept, ψ0[s] is the species-level intercept, ψ1–10 and ψ1–10[s] are the respective community- and species-level occupancy covariates, and ϵψ[g] ∼ Normal (0, τψ) is the random overdispersion effect for pond site.

2.7. Abundance Model

Abundance (λ) was modeled using the twelve community- and species-level covariates area, backswim, beetle, can, comp, crayfish, depth, dragonfly, fish, leaf, perm, and salapred. True but imperfectly observed abundance was modeled as a Poisson process:
N [ g ,   s ] ~ P o i s s o n ( λ [ g ,   s ] z [ g ,   s ] )  
where N[g, s] represents the expected abundance at site g for species s, conditional on occupancy (z[g, s]), with N[g, s] = 0 if z[g, s] = 0 [89]. The mean abundance (λ[g, s]) was expressed as a log-linear function of community- and species-level parameters, covariate effects (k), and a random effect for site-level overdispersion:
l o g ( λ g ,   s ) = λ 0 + λ 0 s + k = 1 12 λ k + λ k s λ k [ g ,   s ] + ϵ λ [ g ]
where λ0 and λk are community-level parameters, λ0[s] and λk[s] are species-specific parameters, and ϵλ[g] ∼ Normal(μλ, τλ) represents random site overdispersion.

2.8. Detection Model

Detection probability (p) was modeled using the nine community- and species-level covariates backswim, beetle, can, crayfish, dragonfly, effort, fish, JD, and salapred. True, but imperfectly observed detection was modeled as a binomial process:
y g ,   t ,   s ~ B i n o m i a l p g ,   t ,   s z g ,   s , N g ,   s  
where y[g, t, s] represents the count of individuals detected at site g during survey t for species s, conditional on occupancy (z[g, s]) and abundance (N[g, s]), with y[g, t, s] = 0 if z[g, s] = 0 or N[g, s] = 0 [89]. The detection probability (p[g, t, s]) of an individual at site g on survey t for species s (p[g, t, s]) was expressed as a logit-link function of community- and species-level parameters, covariate effects (k), and a random survey-level overdispersion effect:
l o g i t ( p g ,   t ,   s ) = p 0 + p 0 s + k = 1 9 p k + p k s p k [ g , t ,   s ] + ϵ p [ g ,   t , s ]
where p0 and pk are community-level parameters, p0[s] and pk[s] are species-specific parameters, and ϵp[g, t, s] ∼ Normal(0, τp) is the random overdispersion effect for survey.

2.9. Priors and Inference

The community-level priors for the occupancy, abundance, and detection sub-model intercepts and key environmental covariates were specified as normal distributions with hyperparameters representing the mean (μ) and precision (τ = 1/σ2). These priors provide flexibility while constraining parameters to biologically reasonable ranges. The community-level intercept terms in each sub-model (ψ0, λ0, p0) were estimated using Bayesian inference with priors for the hyperparameters drawn from a normal distribution, dnorm (1, 10) [32].
Slightly informative priors for the community-level means (μ) of covariates (k) were drawn from dnorm (1, 10) and dnorm (−1, 10). These distributions center parameters around modest positive or negative effects (on the logit or log scale), while also allowing for wide variance, thereby stabilizing estimation while remaining flexible [98,99]. The direction and magnitude of each prior reflected ecological expectations based on previous empirical studies. For instance, canopy cover and pond area have been shown to positively influence amphibian abundance and detection [32,33,93], whereas predatory fish and invertebrates are typically associated with negative effects on occupancy and detectability [34,83,100,101]. These priors were chosen to stabilize estimation without overly constraining the model and were broad enough to allow the data to dominate posterior inference, as supported by sensitivity analyses (see below). In parallel, precision hyperparameters (τ) for these priors were drawn from a uniform distribution, dunif (0.01, 0.5), to permit sufficient variance in parameter estimation while avoiding unreasonably diffuse priors [51].
To evaluate the robustness of our models to prior assumptions, we conducted sensitivity analyses comparing posterior estimates across alternative priors (e.g., dnorm (0, 1) and dnorm (0, 100)). These analyses showed consistent posterior means and credible intervals, indicating that model inference was primarily data-driven and not strongly influenced by prior specification [99].
We assumed that the spring-breeding amphibian species would have broadly similar responses to fish and aquatic invertebrate predators. Consequently, species-level responses were drawn from a common distribution, reflecting their shared ecological requirements [32,98]. Species-level effects were modeled hierarchically, with priors derived from corresponding community-level hyperparameters treated as random effects [51]. This hierarchical structure facilitated species-specific estimates while borrowing strength across species within the community, improving the parameter estimates for rare or sparsely observed species [49]. Sensitivity analyses confirmed that the choice of priors did not significantly influence posterior estimates, ensuring that the data primarily informed the results [102,103]. This approach balances ecological realism with statistical rigor, reducing convergence issues, and enabling robust, interpretable model outputs, particularly for sparse or complex data [104].
The posterior means (μ) of the model coefficients and the 2.5th and 97.5th percentiles of their posterior distributions, representing 95% Bayesian Credible Intervals (95% CIs), were estimated. Covariate parameter estimates with 95% CIs that did not include zero were considered to have strong evidence of an influential relationship, while those overlapping zero indicated greater uncertainty and weaker support [32,105]. To quantify species-level parameter differences, posterior probabilities of pairwise species differences were calculated, with 95% CIs excluding zero and posterior probabilities of differences above 95% (or below 5%) indicating strong evidence for significant differences in species-specific occupancy, abundance, and detection estimates [106]. Finally, covariates with smaller variance (σ) across hyperparameters reflected consistent effects among species, whereas larger values indicated more variable, species-specific responses [83].

2.10. Modeling Methods

We conducted Bayesian modeling using JAGS (version 4.3.00) [107] accessed via the R2jags package [108] in R (version 4.4.1) [109]. Each model employed three parallel Markov chain Monte Carlo (MCMC) chains run for 100,000 iterations, with a 20,000-iteration burn-in, and a thinning rate of 3. Convergence was assessed using the Brooks–Gelman–Rubin diagnostic [110,111] and visual inspection of posterior trace plots. Initial “full” models included all relevant, uncorrelated covariate parameters in each sub-model. Subsequent models incorporated specific covariates identified through model selection [112,113]. Bayesian p-values were calculated using the Freeman-Tukey fit statistic to evaluate model fit, with values near 0.5 indicating acceptable fit and values ≤ 0.1 or ≥0.9 suggesting potential lack-of-fit [114,115]. Model comparison relied on the Deviance Information Criterion (DIC) [116], with lower DIC values indicating better-supported models [117].

3. Results

3.1. Dipnet Surveys

Over three surveys at each of our four pond sites (12 total surveys), we conducted 516 dipnet sweeps (mean ± SD: 43 ± 19 per survey, range: 12–60). In total, we captured 1357 amphibian larvae (113 ± 92), with at least two individuals captured per survey (range: 2–302). Among our six species groups, we captured 2.3 ± 5.2 (0–14) A. maculatum, 11.3 ± 20.4 (0–70) A. talpoideum, 1.8 ± 3.6 (0–11) A. texanum, 2.2 ± 5.1 (0–16) S. intermedia, 32.9 ± 44.9 (0–181) L. sphenocephalus, and 62.5 ± 75.3 (1–235) Pseudacris spp.
We detected 3.3 ± 1.2 (mean ± SD) species groups each survey (range: 1–5), with 56.5 ± 111.7 individuals each species per pond (0–461). Across all surveys and ponds, mean species-specific totals were 226.2 ± 293.9, ranging from 22 A. texanum to 750 Pseudacris spp. Predatory sunfish (Lepomis spp.) and pirate perch (Aphredoderus sayanus) were present every survey at one pond but absent from the other ponds. Additionally, we detected 211 predatory salamanders (salapred: 18 ± 21 per survey, 0–70), 140 backswimmers (12 ± 14, 0–40), 638 crayfish (53 ± 48, 12–159), 218 beetles (18 ± 12, 2–44), and 74 dragonflies (6 ± 10, 0–37). Correlation analyses indicated a strong positive relationship between pond area and beetle abundance, but no other associations between pond size (area or perimeter), survey effort, and environmental or predator covariates were observed.

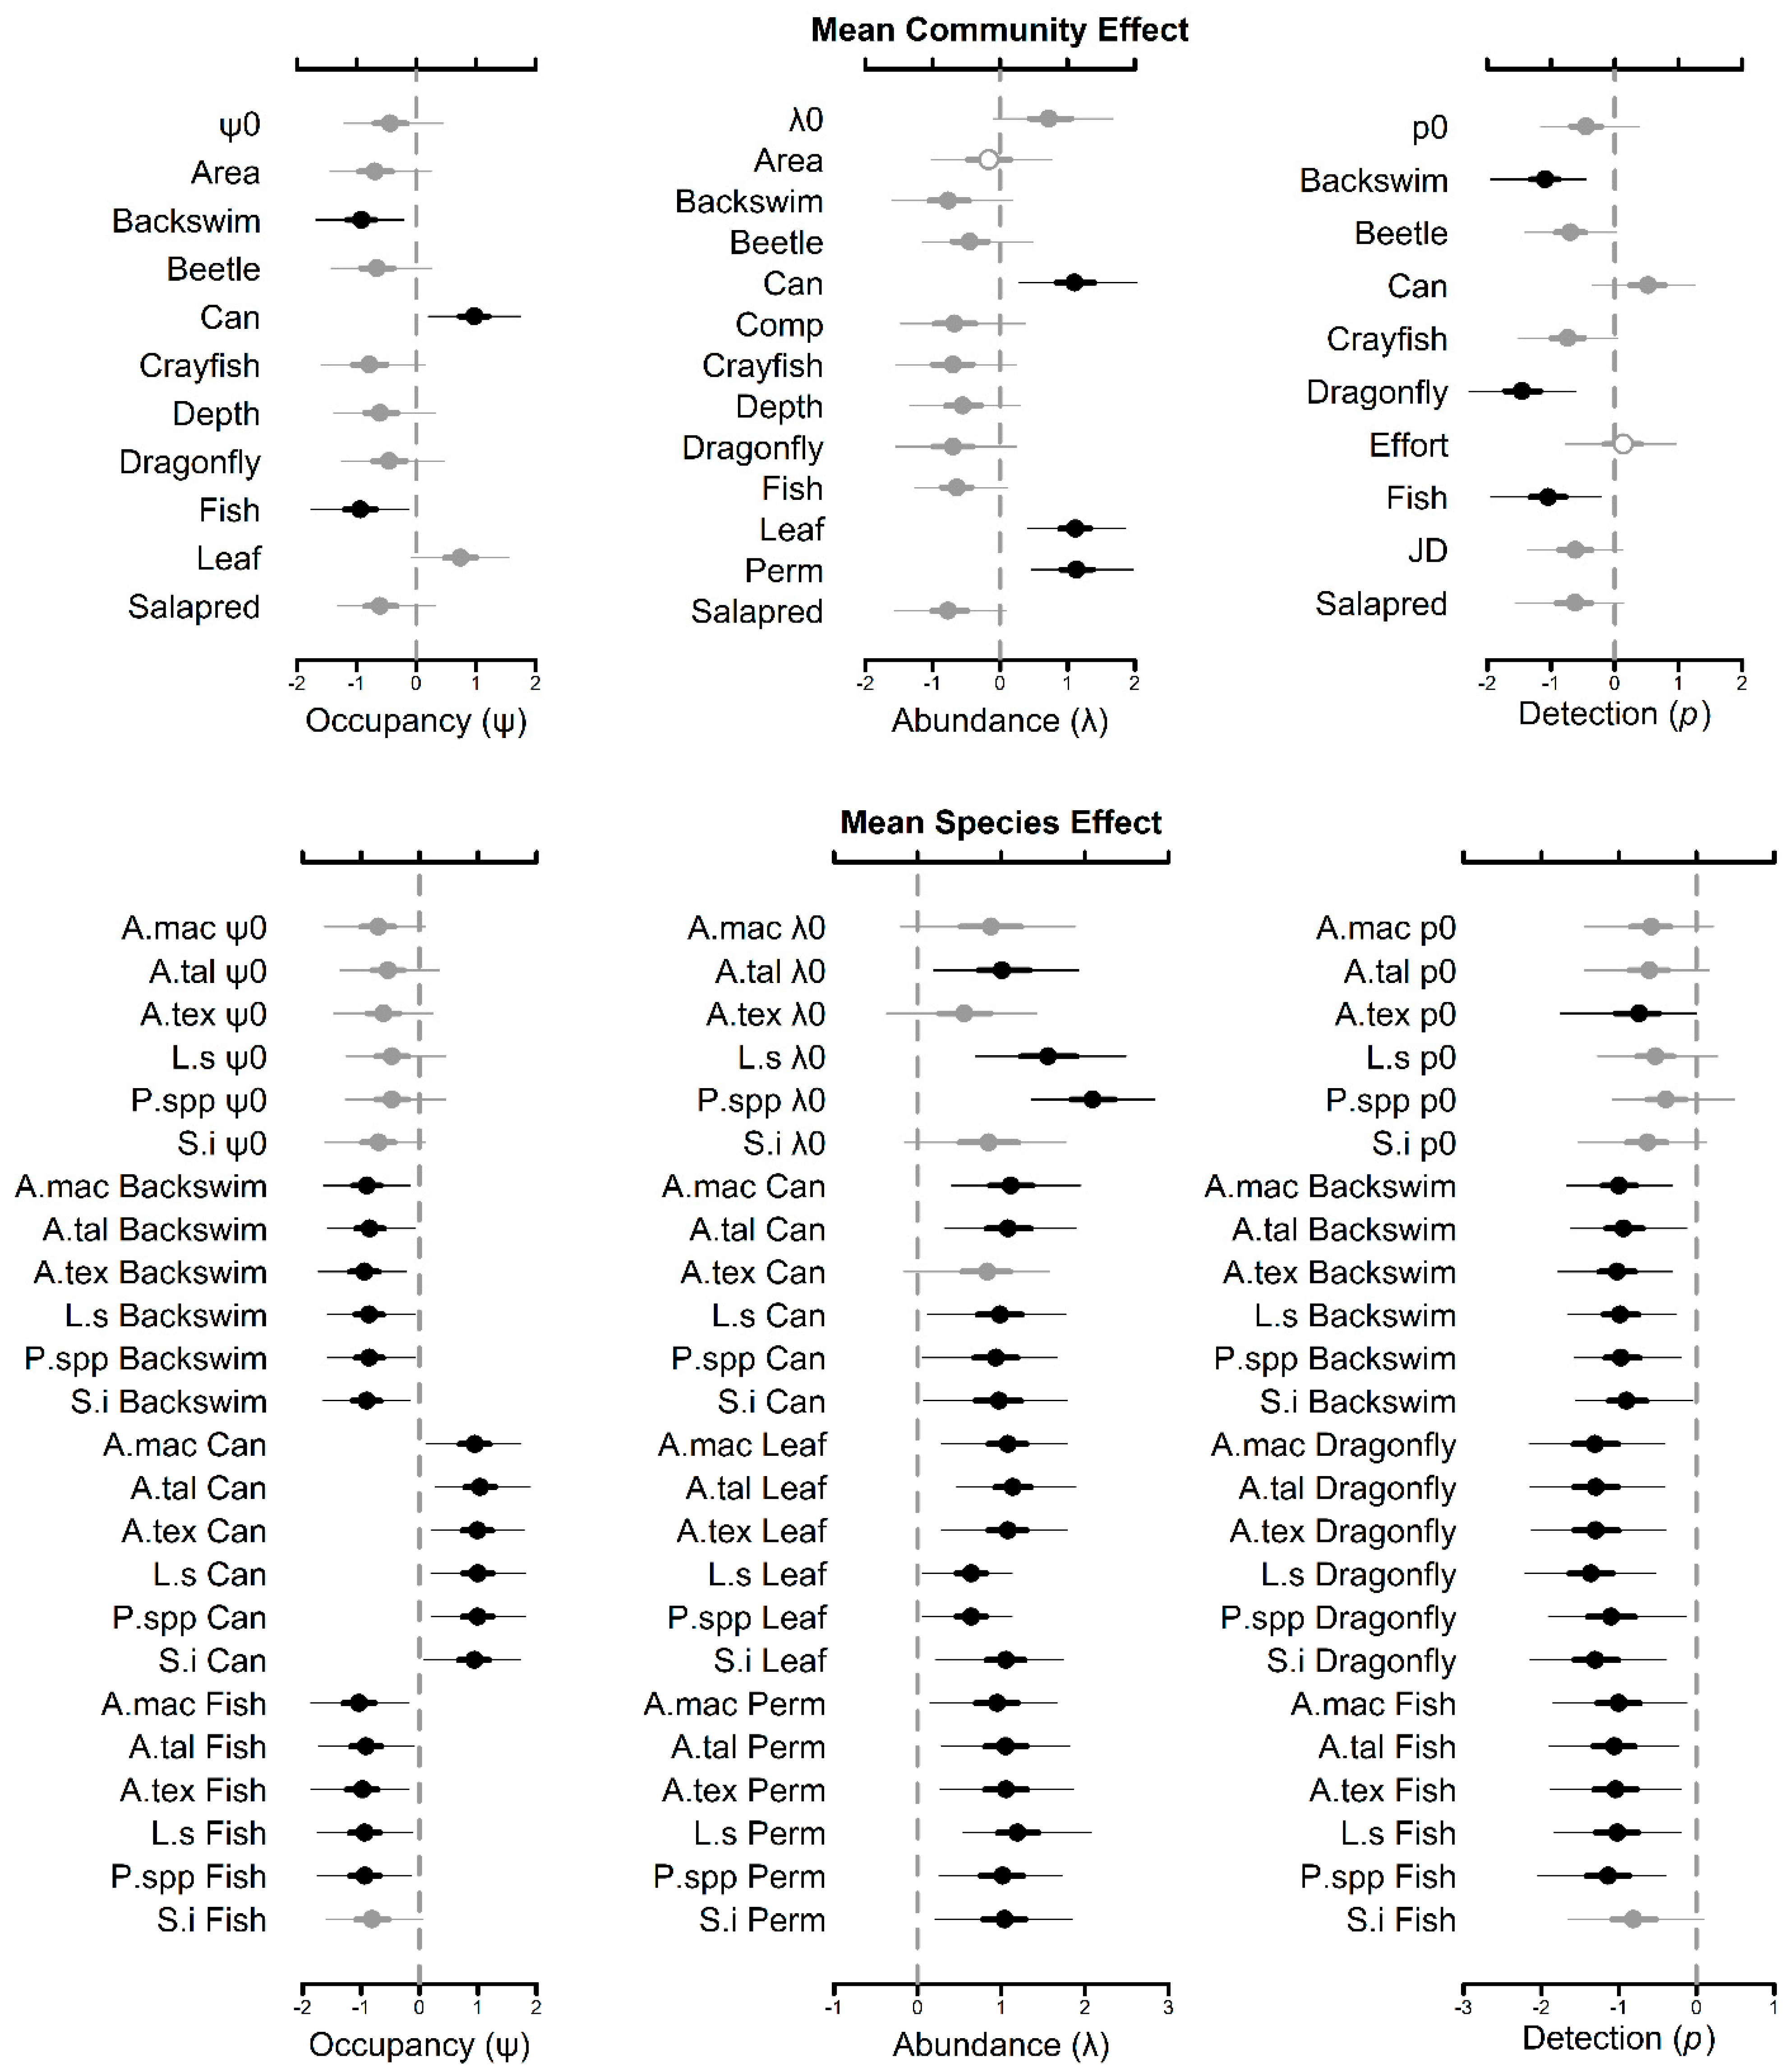
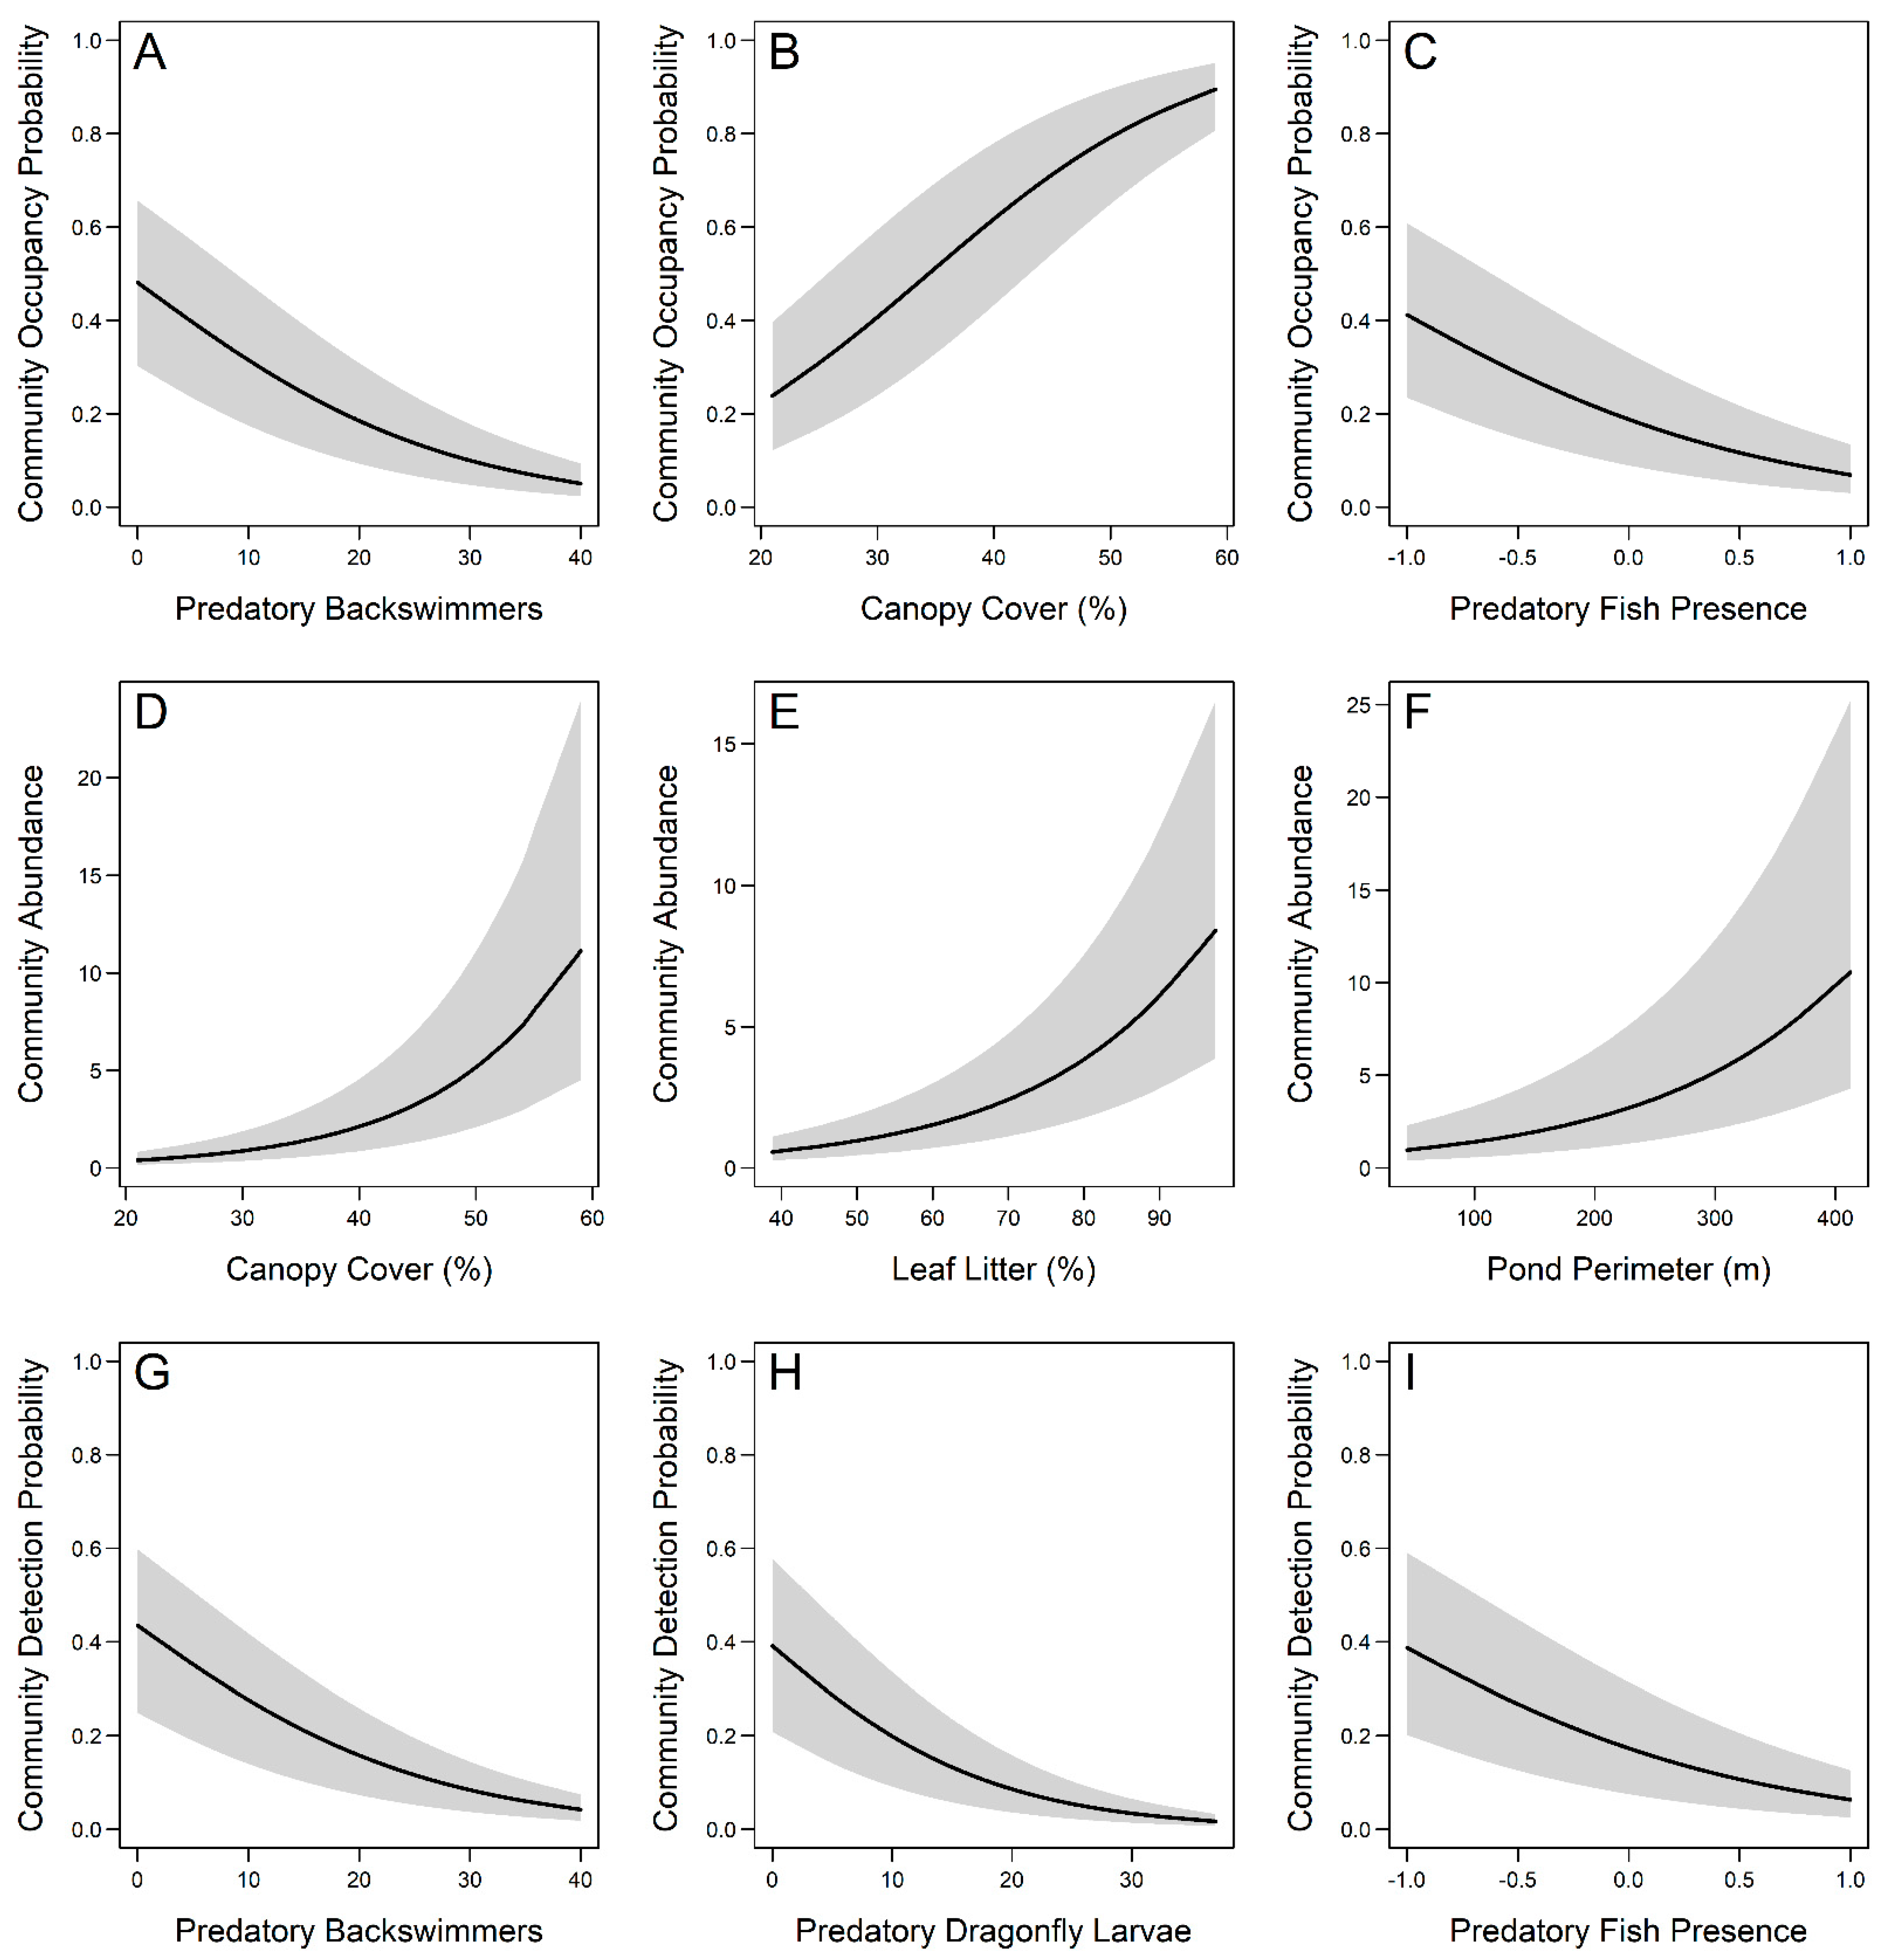
3.2. Community-Level Occupancy Responses

The estimated community-level occupancy intercept (ψ0) was −0.423 (95% CI: −1.207 to 0.457), indicating that the log-odds of baseline occupancy were slightly negative, but with high uncertainty (Figure 2). When transformed to probability space, this corresponds to a mean community occupancy probability of plogis (−0.423) ≈ 0.40, though the wide confidence interval suggests considerable variation among species. The intercept standard deviation (σψ0 = 0.296; Table S3) reflects moderate variability across species in their baseline occupancy before incorporating covariate effects (Figure 2). Importantly, since the intercept represents occupancy at average levels of all covariates, its interpretation should be made cautiously.
Among the covariates, leaf litter (ψleaf: 0.738) suggested a potential positive effect on occupancy, though its 95% CI overlapped zero (−0.084 to 1.551; Figure 2). In contrast, predatory backswimmers (ψbackswim: −0.924, 95% CI: −1.676 to −0.203) and fish presence (ψfish: −0.941, 95% CI: −1.752 to −0.135) exhibited strong negative effects on community occupancy. While canopy cover (ψcan: 0.971, 95% CI: 0.202–1.743) positively influenced occupancy probability (Figure 2). Variability in species-specific responses to these covariates was moderately high for σψbackswim (0.236), σψcan (0.251), and σψfish (0.252; Table S3). The best-fitting model, based on DIC, included ψ0, ψbackswim, ψcan, and ψfish, estimating a mean community occupancy probability of 0.678 (95% CI: 0.506 to 0.843; Figure 3). Predicted responses showed occupancy decreased 9.4-fold from 0.481 to 0.051 as backswimmer abundance increased from 0 to 40, increased 3.8-fold from 0.238 to 0.895 as canopy cover increased from 21% to 59%, and decreased 6.0-fold from 0.412 to 0.069 with fish presence (Figure 4A–C).

3.3. Community-Level Abundance Responses

The community-level abundance intercept (λ0) was estimated at 0.755 (95% CI: −0.103 to 1.674), indicating moderate baseline abundance on the log scale but with high uncertainty (Figure 2). When exponentiated, this corresponds to an expected baseline abundance of exp (0.755) ≈ 2.13 individuals, though the wide confidence interval suggests substantial variation across species. The intercept standard deviation (σλ0 = 0.462; Table S3) further reflects this variability, highlighting considerable uncertainty in baseline abundance estimates before incorporating covariate effects (Figure 2).
Among the covariates, canopy cover (λcan: 1.326, 95% CI: 0.469–2.346), leaf litter (λleaf: 1.117, 95% CI: 0.407–1.858), and pond perimeter (λperm: 1.325, 95% CI: 0.526–2.244) emerged as strong positive predictors of community abundance. Conversely, pond area (λarea: −0.155, 95% CI: −1.016–0.770), predatory beetle abundance (λbeetle: −0.242, 95% CI: −1.006–0.572), and fish presence (λfish: −0.586, 95% CI: −1.267–0.106) did not significantly influence abundance (Figure 2). Variability in species-specific responses was moderate for σλcan (0.283), σλleaf (0.241), and σλperm (0.269; Table S3). The top-performing model, incorporating λ0, λcan, λleaf, and λperm, estimated a mean community abundance of 1464.7 individuals (95% CI: 1133.0 to 2350.0; Figure 3). Predicted responses indicated a 26.2-fold increase in abundance (0.5 to 13.9) as canopy cover rose from 21% to 59%, a 14.0-fold increase (0.6 to 8.4) with leaf litter increasing from 39% to 97%, and a 58.5-fold increase (0.2 to 11.5) as pond perimeter expanded from 44 m to 412 m (Figure 4D,F).

3.4. Community-Level Detection Responses

The estimated community-level detection intercept (p0) was −0.439 (95% CI: −1.160 to 0.379), representing the log-odds of baseline detection probability (Figure 2). Transforming to probability space, this corresponds to an estimated detection probability of plogis (−0.439) ≈ 0.39, though the confidence interval indicates high uncertainty. The intercept standard deviation (σp0 = 0.297; Table S3) suggests notable variation in species-level detection probabilities, reinforcing the need to account for species differences and covariate effects (Figure 2).
Predatory backswimmers (pbackswim: −1.116, 95% CI: −1.944 to −0.452), dragonfly larvae (pdragonfly: −1.448, 95% CI: −2.291 to −0.609), and predatory fish (pfish: −1.050, 95% CI: −1.945 to −0.209) were strongly supported as predictors of reduced detection probability (Figure 2). One possible explanation is that these predators alter amphibian behavior, leading individuals to seek shelter in substrate or vegetation, thereby reducing their availability for detection in dipnet surveys. While beetles (pbeetle: −0.765, 95% CI: −1.505–0.093), crayfish (pcrayfish: −0.708, 95% CI: −1.493–0.083), and predatory salamanders (psalapred: −0.690, 95% CI: −1.414–0.077) appeared to negatively influence detection, their 95% CIs marginally included zero, suggesting weaker or more uncertain effects. Survey effort (peffort: 0.121, 95% CI: −0.779–0.962) had no significant effect. Variability in species responses to predictors was moderate, with σpbackswim (0.252), σpdragonfly (0.289), and σpfish (0.245; Table S3). The best-fitting model estimated a mean community detection probability of 0.277 (95% CI: 0.181 to 0.374; Figure 3). Predicted responses showed detection probability decreased 10.4-fold (0.435 to 0.042) with backswimmer abundance rising from 0 to 40, 23.0-fold (0.391 to 0.017) with dragonfly larvae increasing from 0 to 37, and 6.1-fold (0.387 to 0.063) in the presence of fish (Figure 4G–I).

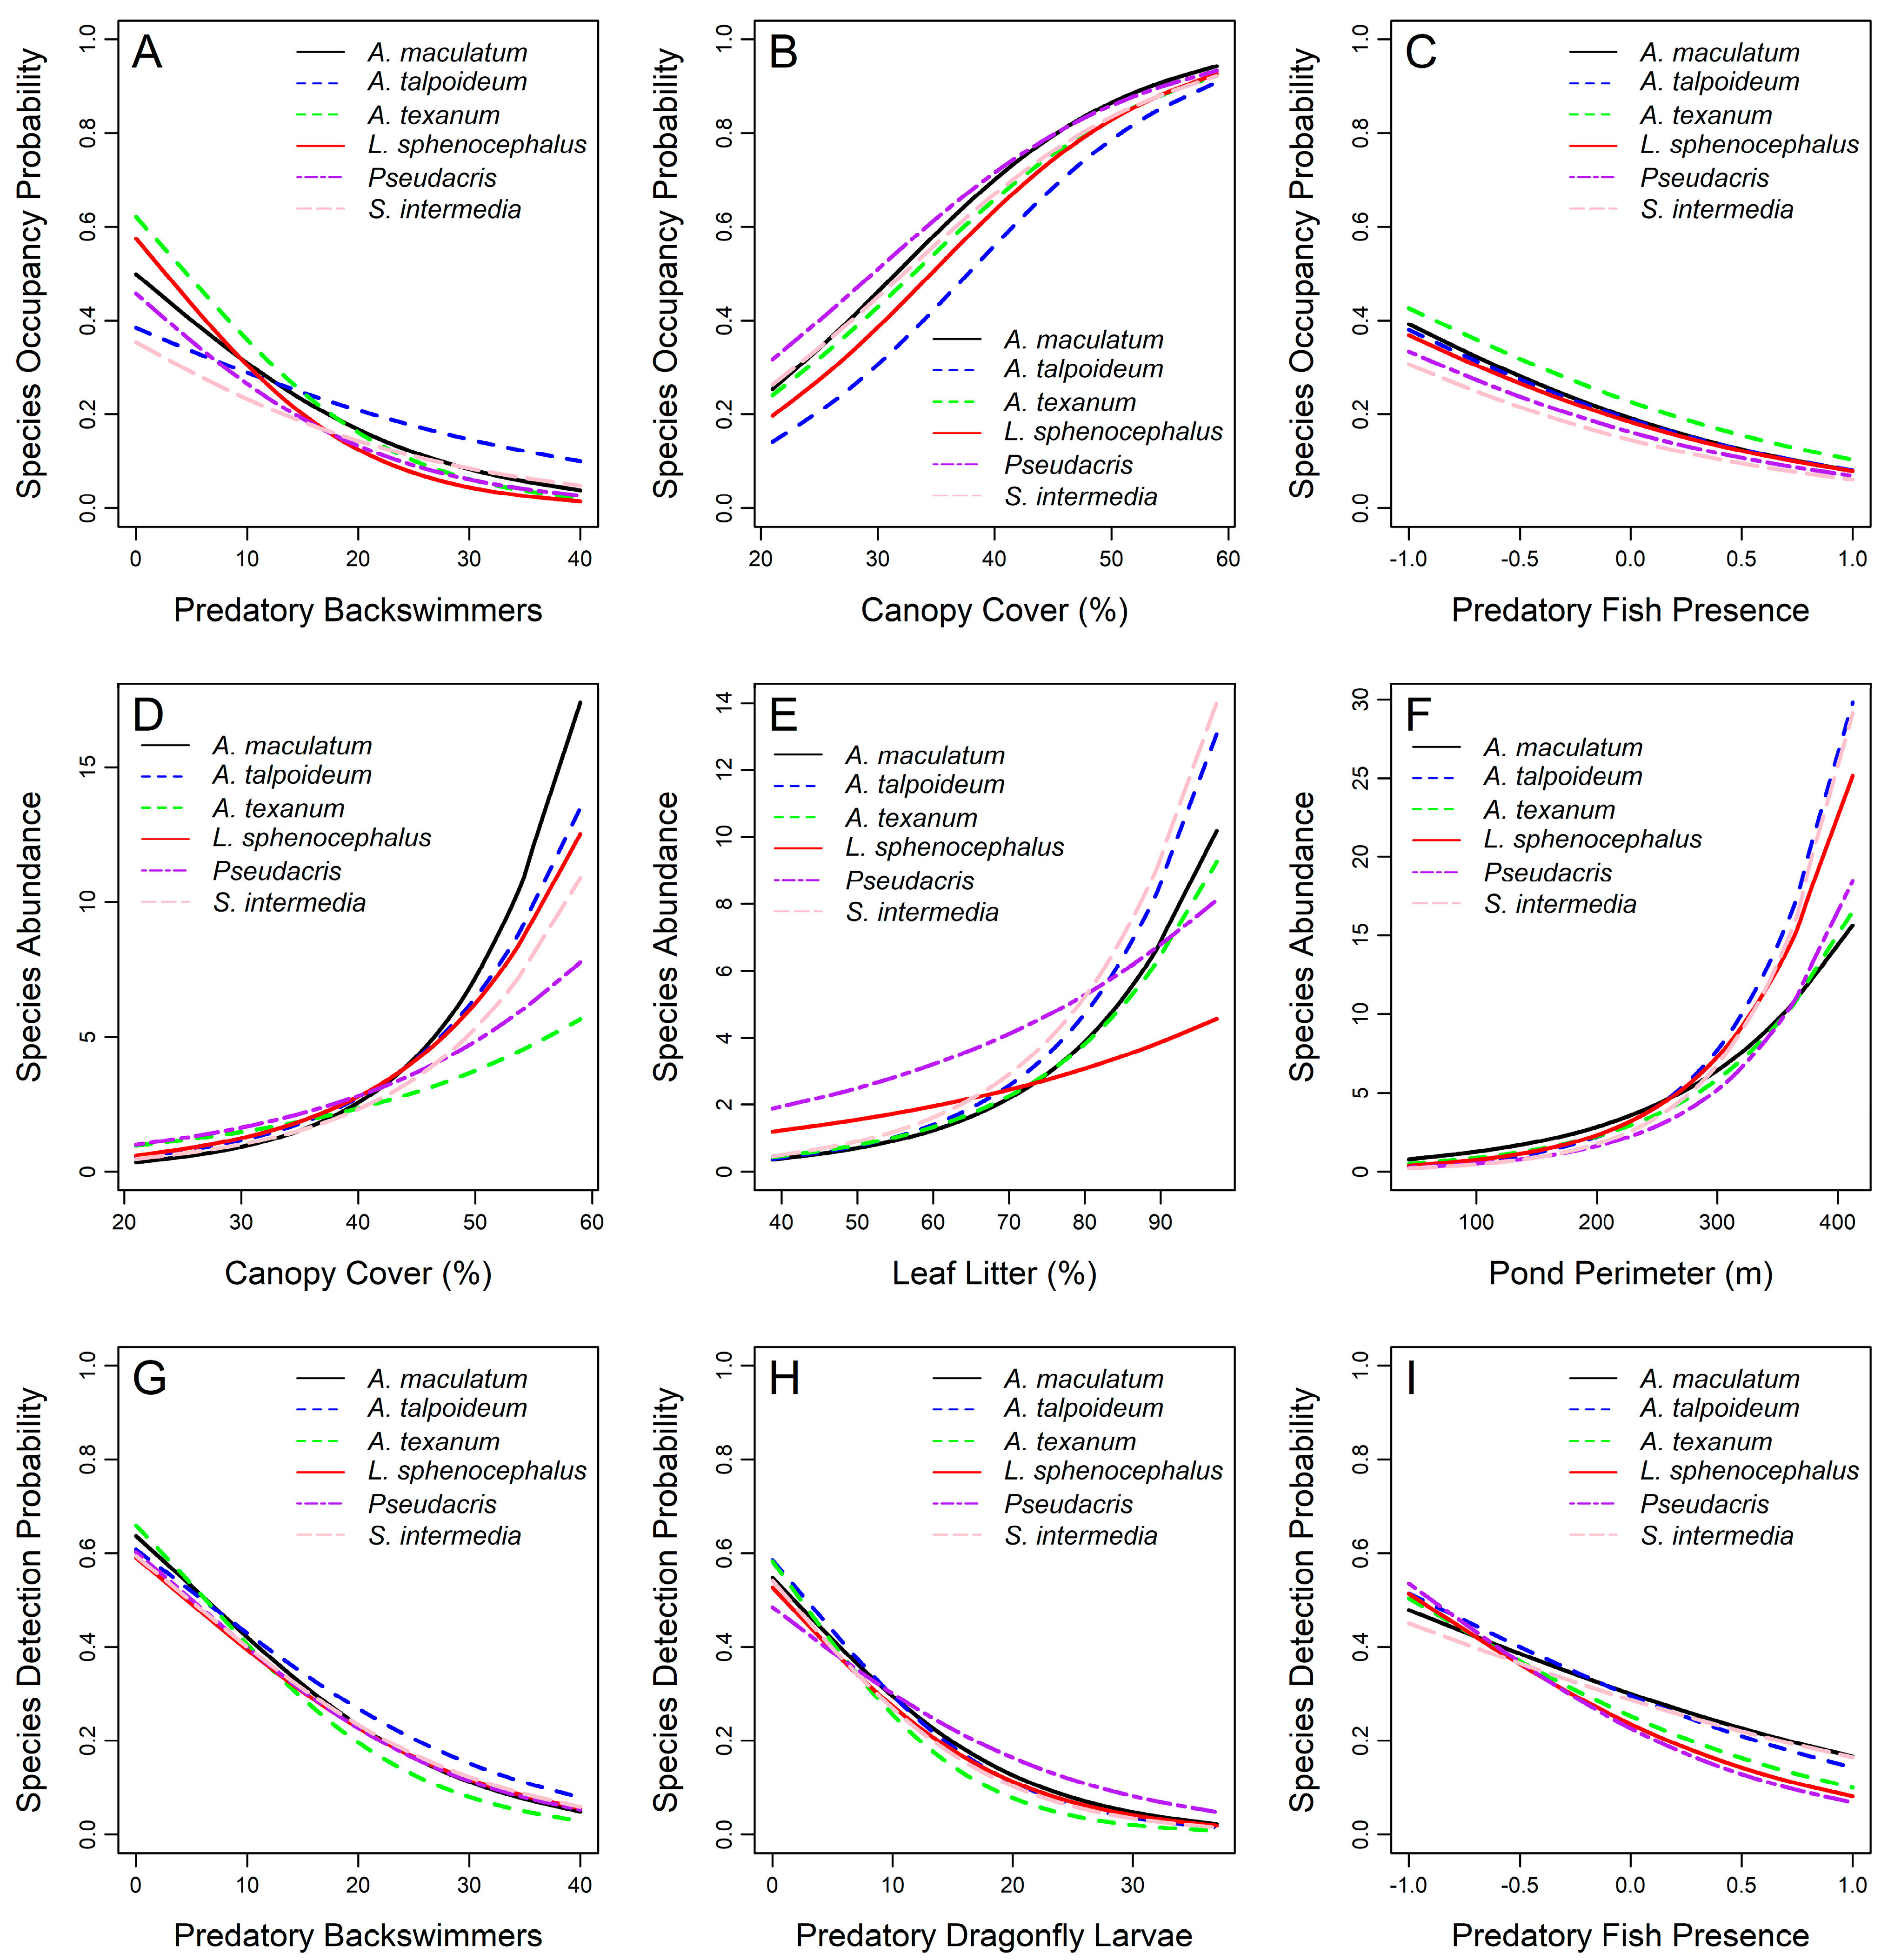
3.5. Species-Level Occupancy Responses

Species-level occupancy intercepts (ψ0[s]) ranged from −0.723 to −0.457 (Table S4), corresponding to relatively low log-odds of occupancy before incorporating covariate effects (Figure 2). In probability space, this translates to species-specific occupancy probabilities ranging from plogis (−0.723) ≈ 0.33 to plogis (−0.457) ≈ 0.39. However, the 95% CIs for these estimates included zero (range: 0.094–0.450; Table S4), indicating no strong evidence for significant differences in baseline occupancy among species. Similarly, posterior probabilities of pairwise differences in ψ0[s] between species did not exceed 95% (range: 50.1–70.4%; Table S5), reinforcing the lack of substantial variation in baseline occupancy across species.
The incorporation of covariates revealed consistent patterns across species, with predatory backswimmers, canopy cover, and fish presence significantly influencing occupancy probabilities (Figure 2). Although mean occupancy probabilities (ψ[s]) were broadly similar across species (range: 0.650–0.704), subtle differences emerged (Figure 3). For instance, the anurans L. sphenocephalus (ψ[L.s]: 0.703, 95% CI: 0.494–0.883) and Pseudacris spp. (ψ[P.spp.]: 0.704, 95% CI: 0.495–0.885) exhibited slightly higher probabilities compared to the salamanders A. maculatum (ψ[A.mac]: 0.654, 95% CI: 0.426–0.852), A. talpoideum (ψ[A.tal]: 0.694, 95% CI: 0.486–0.876), A. texanum (ψ[A.tex]: 0.666, 95% CI: 0.446–0.670), and S. intermedia (ψ[S.i]: 0.650, 95% CI: 0.424–0.848). These differences, however, were not statistically significant, as the 95% CIs for pairwise comparisons overlapped zero, and no posterior probabilities of differences exceeded 95% CI (range: 50.2–71.7%; Table S5).
Predatory backswimmers (ψbackswim[s]) had consistently negative effects on occupancy probabilities for all species, with effect sizes ranging from −0.949 to −0.844 (Figure 2; Table S4). The salamanders A. talpoideum and S. intermedia experienced moderate reductions in occupancy, with probabilities declining 5.0-fold (0.384 to 0.099) as backswimmer abundance rose from 0 to 40. In contrast, the other species showed a more pronounced 21.7-fold decline (0.538 to 0.025; Figure 5A).
Canopy cover (ψcan[s]) had strong positive effects across all species, with effect sizes ranging from 0.927 to 1.044 (Figure 2; Table S4). For example, A. talpoideum experienced the largest increase in occupancy (6.4-fold, from 0.141 to 0.908) as canopy cover increased from 21% to 59%. This effect exceeded the community-level mean increase of 3.8-fold. Although all species responded positively to canopy cover, variability in effect strength was most pronounced at lower canopy levels (Figure 5B).
Fish presence (ψfish[s]) negatively affected occupancy probabilities for most species, with effects ranging from −1.032 to −0.802 (Figure 2; Table S4). The weakest effect was observed for S. intermedia (−0.802, 95% CI: −1.598 to 0.059), whose 95% CI marginally included zero. Similarly, A. talpoideum had a weak negative effect (−0.913, 95% CI: −1.724 to −0.091) relative to other species. Despite these differences, fish presence reduced community occupancy by 6.0-fold (0.412 to 0.069; Figure 5C). While interspecies differences in covariate effects were not statistically significant (posterior probabilities ≤ 70.1%; Table S5), these trends highlight important variability in the magnitude of species-specific responses to these covariates.

3.6. Species-Level Abundance Responses

Species-level abundance intercepts (λ0[s]) ranged from 0.556 to 2.095, indicating moderate baseline abundances across species before accounting for covariate effects (Figure 2; Table S4). When exponentiated, these correspond to estimated baseline abundances between exp (0.556) ≈ 1.74 and exp (2.095) ≈ 8.13 individuals per sampling unit. Significant abundance intercepts were observed for A. talpoideum (1.032, 95% CI: 0.185–1.929), L. sphenocephalus (1.569, 95% CI: 0.696–2.494), and Pseudacris spp. (2.095, 95% CI: 1.363–2.832), as their 95% CIs excluded zero (Figure 2). Pseudacris spp. showed a 96.8% to 99.6% probability of higher baseline abundance than the salamanders, with mean differences ranging from 1.063 to 1.539, and an 81.2% probability of higher abundance than L. sphenocephalus (mean difference: 0.526; Table S5).
The best-supported abundance model included canopy cover, leaf litter, and pond perimeter as covariates (Figure 2). The anuran Pseudacris spp. had the highest estimated abundance (λ[s]: 721.1; 95% CI: 548–1084), followed by L. sphenocephalus (492.4; 95% CI: 326–939; Figure 3). Among the salamanders, A. talpoideum had the highest abundance (125.8; 95% CI: 85–275), exceeding A. maculatum (41.8; 95% CI: 15–146), A. texanum (39.6; 95% CI: 11–161), and S. intermedia (44.1; 95% CI: 16–168). Posterior probabilities of differences were high (99.7–100%), confirming significantly greater anuran abundances compared to salamanders (mean difference range: 366.6–681.5; Table S5). While A. talpoideum had probabilities ranging from 94.9% to 96.7% for having a greater abundance than the other salamanders (mean difference range: 81.7–86.2; Table S5).
Canopy cover (λcan[s]) increased abundance for most species, with effects ranging from 0.803 to 1.154 (Figure 2; Table S4). However, the effect for A. texanum was weaker, with an estimated value of 0.803 and its 95% CI included zero (−0.161–1.623). The strongest response was observed for A. maculatum, with a 58.0-fold increase (0.3 to 17.4) as canopy cover rose from 21% to 59%, well above the community-level mean increase of 26.2-fold. In contrast, the anuran Pseudacris spp. exhibited a smaller, though still notable, 6.0-fold increase (1.0 to 6.0). Although most species responded positively to canopy cover, the magnitude of the effect varied, particularly at higher canopy levels (Figure 5D).
Leaf litter (λleaf[s]) also positively influenced abundance (0.636 to 1.143; Figure 2; Table S4), with salamanders experiencing greater effects than anurans (posterior probabilities range: 78.3–88.9%, mean difference range: 0.361–0.511; Table S5). Mean salamander abundance increased 27.4-fold (0.4 to 11.7) as leaf litter concentration rose from 39% to 97%. In contrast, mean anuran abundance increased just 4.0-fold (1.6 to 6.4), which is markedly lower than the community-level mean increase of 14.0-fold. These findings emphasize interspecies and order-level variability in the influence of leaf litter on larval amphibian abundance, particularly at higher leaf litter concentrations (Figure 5E).
Similarly, pond perimeter (λperm[s]) had strong positive abundance effects across species (0.979 to 1.230; Figure 2; Table S4). The largest responses were observed for A. talpoideum, L. sphenocephalus, and S. intermedia, where mean abundance increased 110.6-fold (0.2 to 25.8) as pond perimeter expanded from 44 m to 412 m, which was greater than the community-level mean increase of 58.5-fold. In contrast, A. maculatum, A. texanum, and Pseudacris spp. exhibited a smaller, though still notable, 33.7-fold (0.6 to 19.1) mean increase. While all species responded positively to pond perimeter, the magnitude of the response varied, particularly as pond size increased (Figure 5F). While interspecies differences in covariate effects were not statistically significant (posterior probabilities ≤ 88.9%; Table S5), these trends highlight important variability in the magnitude of species-specific responses to these covariates.

3.7. Species-Level Detection Responses

Species-level detection intercepts (p0[s]) were consistently negative, ranging from −0.783 to −0.368 (Table S4), indicating relatively low log-odds of baseline detection probability (Figure 2). Transforming to probability space, this corresponds to estimated baseline detection probabilities between plogis (−0.783) ≈ 0.31 and plogis (−0.368) ≈ 0.41. Only A. texanum had a 95% CI excluding zero (−1.752 to −0.003), providing stronger evidence for a reduced baseline detection probability for this species. However, differences in p0[s] among species were not statistically significant, as 95% CIs overlapped, and posterior probabilities of pairwise differences did not exceed 77.9% (Table S5).
After accounting for backswimmer, dragonfly, and fish covariate effects, species-specific detection probabilities (p[s]) ranged from 0.201 to 0.375 (Figure 3; Table S4). Despite 95% CIs for pairwise posterior comparisons overlapping zero, probabilities of differences were relatively high (75.4–97.1%), suggestive of greater detection probabilities for the anurans relative to the salamanders (mean difference range: 0.067 to 0.173; Table S5). As such, L. sphenocephalus (p[s]: 0.375, 95% CI: 0.181–0.511) and Pseudacris spp. (0.338, 95% CI: 0.239–0.415) had high probabilities and were consistently detected across surveys and sites, whereas probabilities were lower for the salamanders A. maculatum (0.254, 95% CI: 0.076–0.459), A. texanum (0.221, 95% CI: 0.072–0.380), A. talpoideum (0.201, 95% CI: 0.099–0.341), and S. intermedia (0.272, 95% CI: 0.096–0.481; Figure 3).
Predatory backswimmers (pbackswim[s]) had consistently negative effects on detection across species, with effect sizes ranging from −1.024 to −0.875 (Figure 2; Table S4). For example, detection probability for A. texanum decreased 22.7-fold (0.659 to 0.029) as backswimmer abundance increased from 0 to 40, which exceeded the community-level mean reduction of 10.4-fold. By comparison, A. talpoideum experienced a smaller 7.7-fold decline (0.608 to 0.079; Figure 5G).
Dragonfly larvae (pdragonfly[s]) also had consistently negative effects on detection probabilities across species, with strong effects ranging from −2.207 to −1.906 (Figure 2; Table S4). The salamander A. texanum showed the most substantial 83.3-fold (0.583 to 0.007) decline in detection as dragonfly abundance increased from 0 to 37. Whereas Pseudacris spp. exhibited a smaller, though still notable, 10.1-fold decline (0.485 to 0.048), which is markedly lower than the community-level mean of 23.0-fold (Figure 5H).
Fish presence (pfish[s]) negatively affected detection probabilities for most species, with effects ranging from −1.155 to −0.805 (Figure 2; Table S4). The weakest effect was observed for S. intermedia (−0.805, 95% CI: −1.652–0.087), whose 95% CI marginally included zero. Conversely, Pseudacris spp. exhibited the largest effect, with a 7.9-fold (0.535 to 0.068) decline in detection with the presence of fish, compared to the community-level mean reduction of 6.1-fold (Figure 5I). While interspecies differences in covariate effects were not statistically significant (posterior probabilities ≤ 70.4%; Table S5), the results reveal clear trends and variability in the magnitude of these effects across species, underscoring the importance of these predators in shaping detection probabilities for larval amphibians.

4. Discussion

Understanding the ecological factors that govern species distributions is critical for predicting range dynamics and informing effective conservation strategies. This study explored how abiotic and biotic factors influence habitat suitability, shaping occupancy, abundance, and detection probabilities in a community of larval spring-breeding amphibians inhabiting a heterogeneous wetland landscape. By employing a Bayesian hierarchical modeling approach, we uncovered complex interactions that drive amphibian community dynamics and provided integrated insights into the mechanisms underlying species distributions. Our findings revealed that negative biotic factors, particularly predatory interactions, significantly impacted occupancy and detection probabilities, whereas positive abiotic and biotic factors such as canopy cover, leaf litter, and pond perimeter primarily influenced abundance. While general patterns were consistent across the community, notable variability emerged at the species level, especially between salamanders and anurans. These results emphasize the importance of incorporating species-specific ecological traits and responses into community-wide conservation frameworks.

4.1. Occupancy

Predatory invertebrate abundance and fish presence emerged as the most significant negative drivers of amphibian occupancy at both community and species levels, consistent with prior studies, e.g., [20,34,118]. Among invertebrates, backswimmers (Notonectidae) had the most pronounced negative effects, likely due to their role as efficient predators of amphibian larvae. While experimental studies have documented their impact on larval survival [118], this study provides the first evidence linking backswimmer abundance to reduced occupancy probabilities.
Fish presence also strongly reduced occupancy, though species-specific tolerances varied. The anurans L. sphenocephalus and Pseudacris spp. exhibited marked negative responses to fish, consistent with previous studies on closely related taxa [34,119]. In contrast, salamanders such as A. talpoideum and S. intermedia demonstrated greater tolerance. These results align with observations of their co-occurrence with fish in natural habitats [120,121,122,123,124,125] and likely reflect life-history adaptations. For example, A. talpoideum populations often include fully aquatic, gilled paedomorphic adults [126,127], while S. intermedia retains a fully aquatic adult stage, likely making them more resistant to fish predation compared to species with terrestrial adult stages [22]. Similarly, their weaker responses to backswimmers suggest a lower susceptibility to predation compared to species with terrestrial adult stages.
Conversely, canopy cover emerged as the strongest positive predictor of occupancy, enhancing habitat suitability across most species. This finding aligns with prior research showing the importance of forested wetlands in supporting amphibian populations [33,95,113]. In particular, species such as A. talpoideum benefitted, underscoring the role of forested habitats in supporting amphibian populations. Overall, the interplay between negative predatory pressures and positive habitat features like canopy cover reflects the nuanced habitat preferences of amphibians, emphasizing the need to preserve both structural and biological complexity in wetlands to support amphibian biodiversity [128,129].

4.2. Abundance

Abundance patterns showed significant variation between orders, with anurans being more abundant than salamanders. These differences likely stem from variations in reproductive strategies, as temperate spring-breeding anurans typically produce and lay substantially more eggs compared to sympatric salamanders [68,69]. In addition to reproductive output, larval anurans often exhibit faster development and more generalist habitat use, enabling higher colonization rates and resilience to variable pond conditions, while salamander larvae tend to develop more slowly, remain benthic, and exhibit stronger habitat specificity, which may contribute to their lower observed abundance in these dynamic systems [4,22,68,69,70]. Among the salamanders, A. talpoideum emerged as the most abundant species, reflecting its habitat tolerance breadth. Although predatory factors had weak overall effects on abundance, community and species-level abundance were shaped by a combination of positive biotic and abiotic factors, with habitat characteristics such as canopy cover, leaf litter, and pond perimeter exerting the strongest effects. These findings align with prior studies emphasizing the role of structural habitat features in providing foraging opportunities and refuges from predators [130,131]. Canopy cover, in particular, benefited forest-associated species like A. maculatum, which depend on shaded environments for optimal larval survival [132].
Canopy cover likely benefits larval amphibians through several ecological mechanisms. Shading from canopy trees can regulate water temperature and reduce thermal stress, especially during late spring and early summer [131]. Shaded ponds also often experience lower rates of evaporation, which may increase hydroperiod persistence in ephemeral systems. In addition, canopy cover contributes to the deposition of leaf litter, which provides foraging substrates, refuge from predators, and microhabitat complexity [128]. These benefits are particularly important for forest-associated salamanders, which depend on detritus-rich environments for larval development and predacious feeding [63,70]. Conversely, habitat generalists like A. texanum and A. talpoideum showed weaker associations with canopy cover, reflecting their broader ecological tolerances.
Leaf litter also played a crucial role in abundance, though its effects varied. While it had limited influence on anuran abundance, it strongly affected salamander abundance, as it provides essential foraging substrates and refuges for larval salamanders’ obligate carnivorous diets [68,69]. Experimental work by [133] underscores the importance of leaf litter in influencing amphibian survival, growth, and metamorphic traits. Although we found weak correlations between canopy cover and leaf litter concentration, the potential interactive effects warrant further investigation. Moreover, the quality and species composition of leaf litter can significantly influence larval fitness, as shown in experimental studies [134]. For example, L. sylvaticus larvae exhibited higher fitness with green ash (Fraxinus pennsylvanica) litter compared to red maple (Acer rubrum) or cattail (Typha latifolia) litter.
Pond perimeter emerged as another key driver of abundance, with A. talpoideum, L. sphenocephalus, and S. intermedia responding most strongly. The pronounced responses A. talpoideum and S. intermedia may reflect their tolerance for predatory fish, as larger ponds are often associated with fish presence. Conversely, the slightly weaker response of L. sphenocephalus is consistent with its limited dependence on canopy cover [131]. While pond perimeter often correlates with other biotic and abiotic site characteristics, such as canopy cover, depth, leaf litter, and the presence of predatory fish [32,33,34,72,83], our analysis only found strong relationships with pond area, beetle abundance, and survey effort. Future research should explore how habitat features interact to influence amphibian abundance, particularly the roles of tree species composition on litter quality. Such studies will improve predictions of species responses to habitat change and inform targeted conservation actions.
These results underscore the conservation value of maintaining forest canopy around amphibian breeding ponds. Canopy cover not only enhances larval abundance through increased detrital input and microhabitat structure but may also buffer ponds from accelerated drying under climate change by moderating temperature, reducing evaporation, and sustaining hydroperiods [128]. As climate-driven hydrological shifts continue to threaten amphibian breeding habitats, conserving and restoring canopy cover may be critical for supporting population resilience and maintaining suitable larval conditions in ephemeral wetland systems [32,33,133,134].

4.3. Detection

Detection probabilities were most strongly influenced by predatory pressures, with backswimmers, dragonfly larvae, and fish associated with reduced detection at both community and species levels. While these predators likely suppress amphibian abundance, their apparent effects on detection may also reflect behavioral changes that reduce larval availability to dipnet surveys. For instance, larvae may respond to predator presence with avoidance behaviors that reduce their use of pond microhabitats where dipnetting is most effective [135,136]. Although our hierarchical model structure partially accounts for abundance-driven suppression by conditioning detection on latent abundance, it is difficult to fully disentangle reduced detection probability from actual reductions in presence [137]. Therefore, we interpret these negative detection responses cautiously, acknowledging that they may arise from either predator-induced behavioral avoidance, true abundance declines, or a combination of both.
This distinction is particularly important when interpreting predator effects on detection. While our models account for detection conditional on abundance, predator presence may still confound inference by simultaneously reducing both the number of individuals available and their likelihood of detection [138]. However, without behavioral data, we cannot fully separate these mechanisms, and caution is warranted to avoid over-attributing detection effects to either process alone.
Predators can diminish breeding pond suitability and alter larval detectability through avoidance behaviors [139,140]. Amphibian larvae respond to visual cues and excreted kairomones from predators and wounded conspecifics by adopting defensive strategies, including increased refuge use and reduced movement [141,142]. These antipredator adaptations likely reduce the effectiveness of active sampling methods like dipnetting by limiting larval presence in open habitats [143]. Further investigation into species-specific behavioral responses to predation risk could clarify the relative contributions of abundance suppression versus detectability biases.
Survey effort had negligible effects on detection probabilities, suggesting that the perimeter-scaled dipnetting approach of Hutton et al. [62] minimizes bias across ponds of varying sizes. This finding supports the method’s applicability in other heterogeneous landscapes. In contrast, Hamer and Horányi [83] reported consistently positive effort effects across three anuran families and two salamandrid species, with high effort levels required for reliable detection. However, their study incorporated multiple capture methods, with funnel traps outperforming dipnets in detection rates. Unpublished data from JMH on past BLS surveys indicated that dipnets achieved higher community-wide detection probabilities than unbaited funnel or trashcan traps. These discrepancies highlight the importance of accounting for method-specific detection probabilities in population studies, particularly in systems with temporal method overlap and potential biases from predator presence, trap type, and baiting effects [144,145,146,147]. We also note that replicating pond types and hydroperiod conditions in this system was constrained by the ecological uniqueness and limited number of water-filled habitats available within the Tupelo-Cypress wetland during our survey period. As a remnant wetland complex with restricted temporal hydrological inputs, BLS represents a rare and ecologically significant system in the Midwest, and our findings provide an important foundation for future research in analogously constrained landscapes.
Similarly to abundance, order-level differences in detection were also evident, with anurans more easily detected than salamanders. This disparity may partly result from the anurans’ higher relative abundance, as density-dependent effects increase the likelihood of encountering more abundant species [148]. Additionally, ecological and behavioral traits, such as anurans’ active foraging compared to salamanders’ ambush-based strategies, can further enhance their detectability [68,69]. These differences in foraging mode and mobility likely affect exposure to predators and response to sampling gear, with anurans more likely to be captured by active dipnet sweeps, whereas more sedentary salamander larvae may be avoided, particularly under conditions of increased predation risk [148]. Despite these differences, detection among orders was primarily uniformly influenced by aquatic predators, with backswimmers, dragonfly larvae, and fish.
While species-level responses to predators were broadly consistent, notable variability emerged. For example, A. texanum exhibited the strongest negative responses to both backswimmers and dragonfly larvae, whereas A. talpoideum was less affected by backswimmers. Among salamanders, predatory fish had the most pronounced negative effect on A. texanum, while the effect was weakest on S. intermedia. Similar strong negative fish effects were observed for both anurans. The negative detection responses to backswimmer and larval dragonfly abundance identified in our study appear to be novel findings. Previous research from Stretz et al. [118], showed that A. maculatum survival declined in response to backswimmers, beetles, and dragonfly larvae, with backswimmers having the strongest impact and dragonfly larvae the second strongest. Overall, these findings emphasize the need to account for predator-prey dynamics and density-dependent effects when interpreting detection data. Failure to do so could introduce substantial biases in occupancy and abundance estimates, particularly in predator-rich systems [149,150]. It is also possible that predator abundance is influenced by amphibian density, as high concentrations of larvae may attract mobile or opportunistic predators [151,152]. Although our models did not account for this potential feedback, future studies incorporating predator behavioral dynamics or temporal predator-prey tracking could help disentangle these causal pathways and improve inference.

4.4. Limitations and Future Directions

While our study reveals clear patterns in amphibian community responses to habitat structure and predation, several limitations must be acknowledged. Particularly, the small number of ponds limited our ability to replicate environmental gradients spatially. Although the study ponds captured substantial variation in area, canopy cover, hydroperiod, and predator composition and risk, the lack of spatial replication reduced statistical power and ultimately limits the generalizability of these findings across broader ecological contexts [153]. As such, our inferences should be viewed as hypothesis-generating. However, we also note that our model results were robust to prior assumptions, as demonstrated by sensitivity analyses described in Section 2.8. Nonetheless, future research incorporating a larger number of ponds across multiple wetland complexes, or multi-year sampling within the same system, will be essential to validate these patterns and improve their robustness.
Our hierarchical Bayesian modeling approach accounted for overdispersion, imperfect detection, and sparse data through latent processes and partial pooling. However, the model’s structure also introduces posterior shrinkage, whereby species-level estimates, especially for rare or infrequently detected taxa, are partially informed by community-level distributions [49,51]. While this borrowing of strength stabilizes estimates and improves convergence, it may also reduce the apparent distinctiveness of rare species’ responses and should be considered when interpreting species-specific parameters [86].
Additionally, although we assumed site independence based on the spatial separation among ponds (>400 m) and the limited dispersal abilities of the focal amphibian species, we acknowledge that no formal spatial autocorrelation tests were conducted. Thus, potential connectivity among sites or unmeasured spatial processes may have influenced larval distributions or predator presence [153]. Future studies incorporating more spatially distributed datasets and explicit spatial modeling frameworks (e.g., spatial autocovariate terms or spatially structured random effects) would improve inference about landscape connectivity, dispersal barriers, and spatial dependence in occupancy and abundance.
Finally, although our model estimated detection conditional on latent abundance, we could not disentangle whether the strong negative effects of predators on detectability arose from true abundance suppression or predator-induced behavioral avoidance. As discussed above, predator presence may simultaneously reduce the number of larvae present and their likelihood of capture via dipnet surveys. Without concurrent behavioral data or repeated, within-survey sampling at multiple time intervals, it remains difficult to isolate these mechanisms [137,138]. Future work incorporating behavioral observations, predator-exclusion experiments, or temporally dynamic predator-prey tracking could better resolve the causal pathways underlying the potential predator effects on detectability and abundance.

5. Conclusions

This study demonstrates the utility of hierarchical MSOM modeling approaches in disentangling the ecological drivers of amphibian occupancy, abundance, and detection [83,154]. By integrating species- and community-level responses, we identified key biotic and abiotic factors shaping habitat suitability in a heterogenous wetland ecosystem. Predatory invertebrates and fish were the strongest negative biotic factors, significantly influencing both occupancy and detection, likely through predator avoidance behaviors. In contrast, positive habitat features such as canopy cover, pond perimeter, and leaf litter emerged as critical drivers of abundance, underscoring the importance of preserving habitat heterogeneity.
These results have direct implications for amphibian conservation. Management efforts should prioritize maintaining diverse wetland habitats that balance predator refuges with structural complexity, particularly in forested landscapes. Specifically, preserving or restoring forest canopy around breeding ponds may buffer against climate-driven drying and support larval survival by enhancing canopy-driven microhabitat stability [35,128]. Additionally, preventing the introduction of predatory fish or managing their persistence in historically fishless ponds may be critical for sustaining amphibian populations. Leaf litter inputs and structurally complex pond margins should also be maintained or restored to promote larval abundance and detectability [154]. Ultimately, this study advances our understanding of the ecological mechanisms driving amphibian community dynamics and highlights the value of species-specific approaches within community-wide conservation planning.

Supplementary Materials

The following supporting information can be downloaded at: https://www.mdpi.com/article/10.3390/hydrobiology4020015/s1.

Author Contributions

J.M.H. and R.W.W. contributed to the conceptualization, methodology, writing, and editing of the manuscript. J.M.H. conducted the investigation and analyses. All authors have read and agreed to the published version of the manuscript.

Funding

This research was funded by the Illinois Department of Natural Resources (IDNR; T-130-R1).

Institutional Review Board Statement

This research was approved by the Southern Illinois University Institutional Animal Care and Use Committee (Protocol 22-035). All animals were handled under IDNR Permit No. 14420.

Informed Consent Statement

Not applicable.

Data Availability Statement

The datasets analyzed from the current study are available from the corresponding author upon reasonable request.

Acknowledgments

We thank A. Iriate, K. Karl, S. Krieger, A. Macedo, and O. Villa for assistance with data collection. We would also like to thank A.J. Hamer for reviewing our models.

Conflicts of Interest

The authors declare no conflicts of interest. The funders had no role in the design of the study; in the collection, analyses, or interpretation of data; in the writing of the manuscript; or in the decision to publish the results.

References

  1. Tiegs, S.D.; Berven, K.A.; Carmack, D.J.; Capps, K.A. Stoichiometric implications of a biphasic life cycle. Oecologia 2016, 180, 853–863. [Google Scholar] [CrossRef]
  2. Rumrill, C.T.; Scott, D.E.; Lance, S.L. Delayed effects and complex life cycles: How the larval aquatic environment influences terrestrial performance and survival. Environ. Toxicol. Chem. 2018, 37, 2660–2669. [Google Scholar] [CrossRef] [PubMed]
  3. Yeh, P.J.; Price, T.D. Adaptive phenotypic plasticity and the successful colonization of a novel environment. Am. Nat. 2004, 164, 531–542. [Google Scholar] [CrossRef] [PubMed]
  4. Nolan, N.; Hayward, M.W.; Klop-Toker, K.; Mahony, M.; Lemckert, F.; Callen, A. Complex organisms must deal with complex threats: How does amphibian conservation deal with biphasic life cycles? Animals 2023, 13, 1634. [Google Scholar] [CrossRef] [PubMed]
  5. Simberloff, D. The contribution of population and community biology to conservation science. Annu. Rev. Ecol. Syst. 1988, 19, 473–511. [Google Scholar] [CrossRef]
  6. Dorazio, R.M.; Royle, J.A.; Soderstrom, B.; Glimskar, A. Estimating species richness and accumulation by modeling species occurrence and detectability. Ecology 2006, 87, 842–854. [Google Scholar] [CrossRef]
  7. Wisz, M.S.; Pottier, J.; Kissling, W.D.; Pellissier, L.; Lenoir, J.; Damgaard, C.F.; Svenning, J.C. The role of biotic interactions in shaping distributions and realized assemblages of species: Implications for species distribution modeling. Biol. Rev. 2013, 88, 15–30. [Google Scholar] [CrossRef]
  8. Burton, T.M.; Likens, G.E. Energy flow and nutrient cycling in salamander populations in the Hubbard Brook Experimental Forest, New Hampshire. Ecology 1975, 56, 1068–1080. [Google Scholar] [CrossRef]
  9. Seale, D.B. Influence of amphibian larvae on primary production, nutrient flux, and competition in a pond ecosystem. Ecology 1980, 61, 1531–1550. [Google Scholar] [CrossRef]
  10. Hocking, D.J.; Babbitt, K.J. Amphibian contributions to ecosystem services. Herpetol. Conserv. Biol. 2014, 9, 1–17. [Google Scholar]
  11. West, J. Importance of Amphibians: A Synthesis of Their Environmental Functions, Benefits to Humans, and Need for Conservation. Ph.D. Thesis, Bridgewater State University, Bridgewater, MA, USA, 2018. [Google Scholar]
  12. Houlahan, J.E.; Findlay, C.S.; Schmidt, B.R.; Meyer, A.H.; Kuzmin, S.L. Quantitative evidence for global amphibian population declines. Nature 2000, 404, 752–755. [Google Scholar] [CrossRef]
  13. Luedtke, J.A.; Chanson, J.; Neam, K.; Hobin, L.; Maciel, A.O.; Catenazzi, A.; Stuart, S.N. Ongoing declines for the world’s amphibians in the face of emerging threats. Nature 2023, 622, 308–314. [Google Scholar] [CrossRef] [PubMed]
  14. Werner, E.E. Amphibian metamorphosis: Growth rate, predation risk, and the optimal size at transformation. Am. Nat. 1986, 128, 319–341. [Google Scholar] [CrossRef]
  15. Warne, R.W.; Crespi, E.J.; Brunner, J.L. Escape from the pond: Stress and developmental responses to ranavirus infection in wood frog tadpoles. Funct. Ecol. 2011, 25, 139–146. [Google Scholar] [CrossRef]
  16. Dastansara, N.; Vaissi, S.; Mosavi, J.; Sharifi, M. Impacts of temperature on growth, development, and survival of larval Bufo (Pseudepidalea) viridis (Amphibia: Anura): Implications of climate change. Zool. Ecol. 2017, 27, 228–234. [Google Scholar] [CrossRef]
  17. Rollins-Smith, L.A. Amphibian immunity–stress, disease, and climate change. Dev. Comp. Immunol. 2017, 66, 111–119. [Google Scholar] [CrossRef] [PubMed]
  18. Denver, R.J. Environmental stress as a developmental cue: Corticotropin-releasing hormone is a proximate mediator of adaptive phenotypic plasticity in amphibian metamorphosis. Horm. Behav. 1997, 31, 169–179. [Google Scholar] [CrossRef]
  19. Beck, C.W.; Congdon, J.D. Effects of age and size at metamorphosis on performance and metabolic rates of Southern Toad, Bufo terrestris, metamorphs. Funct. Ecol. 2000, 14, 32–38. [Google Scholar] [CrossRef]
  20. Semlitsch, R.D. Critical elements for biologically based recovery plans of aquatic-breeding amphibians. Conserv. Biol. 2002, 16, 619–629. [Google Scholar] [CrossRef]
  21. Warne, R.W.; Crespi, E.J. Larval growth rate and sex determine resource allocation and stress responsiveness across life stages in juvenile frogs. J. Exp. Zool. Part A Ecol. Genet. Physiol. 2015, 323, 191–201. [Google Scholar] [CrossRef]
  22. Semlitsch, R.D.; Skelly, D.K. Ecology and conservation of pool-breeding amphibians. In Science and Conservation of Vernal Pools in Northeastern North America; CRC Press: Boca Raton, FL, USA, 2008; pp. 127–148. [Google Scholar]
  23. Brooks, G.C.; Kindsvater, H.K. Early development drives variation in amphibian vulnerability to global change. Front. Ecol. Evol. 2022, 10, 813414. [Google Scholar] [CrossRef]
  24. Newman, R.A. Ecological constraints on amphibian metamorphosis: Interactions of temperature and larval density with responses to changing food level. Oecologia 1998, 115, 9–16. [Google Scholar] [CrossRef] [PubMed]
  25. Warne, R.W.; Kardon, A.; Crespi, E.J. Physiological, behavioral, and maternal factors that contribute to size variation in larval amphibian populations. PLoS ONE 2013, 8, e76364. [Google Scholar] [CrossRef]
  26. Rohr, J.R.; Elskus, A.A.; Shepherd, B.S.; Crowley, P.H.; McCarthy, T.M.; Niedzwiecki, J.H.; Palmer, B.D. Multiple stressors and salamanders: Effects of an herbicide, food limitation, and hydroperiod. Ecol. Appl. 2004, 14, 1028–1040. [Google Scholar] [CrossRef]
  27. Denver, R.J.; Glennemeier, K.A.; Boorse, G.C. Endocrinology of complex life cycles: Amphibians. In Hormones, Brain and Behavior; Pfaff, D.W., Arnold, A.P., Etgen, A.M., Eds.; Academic Press: San Diego, CA, USA, 2002; pp. 469–XI. [Google Scholar]
  28. Linder, G.; Palmer, B.D.; Little, E.E.; Rowe, C.L.; Henry, P. Physiological ecology of amphibians and reptiles. In Ecotoxicology of Amphibians and Reptiles; CRC Press: Pensacola, FL, USA, 2010; pp. 105–166. [Google Scholar]
  29. Crespi, E.J.; Warne, R.W. Environmental conditions experienced during the tadpole stage alter post-metamorphic glucocorticoid response to stress in an amphibian. Integr. Comp. Biol. 2013, 53, 989–1001. [Google Scholar] [CrossRef]
  30. Székely, D.; Cogălniceanu, D.; Székely, P.; Armijos-Ojeda, D.; Espinosa-Mogrovejo, V.; Denoël, M. How to recover from a bad start: Size at metamorphosis affects growth and survival in a tropical amphibian. BMC Ecol. 2020, 20, 24. [Google Scholar] [CrossRef]
  31. Burraco, P.; Valdés, A.E.; Orizaola, G. Metabolic costs of altered growth trajectories across life transitions in amphibians. J. Anim. Ecol. 2020, 89, 855–866. [Google Scholar] [CrossRef]
  32. Hamer, A.J.; Barta, B.; Bohus, A.; Gál, B.; Schmera, D. Roads reduce amphibian abundance in ponds across a fragmented landscape. Glob. Ecol. Conserv. 2021, 28, e01663. [Google Scholar] [CrossRef]
  33. Hamer, A.J.; Schmera, D.; Mahony, M.J. Multi-species occupancy modeling provides novel insights into amphibian metacommunity structure and wetland restoration. Ecol. Appl. 2021, 31, e2293. [Google Scholar] [CrossRef]
  34. Amburgey, S.M.; Bailey, L.L.; Murphy, M.; Muths, E.; Funk, W.C. The effects of hydropattern and predator communities on amphibian occupancy. Can. J. Zool. 2014, 92, 927–937. [Google Scholar] [CrossRef]
  35. O’Regan, S.M.; Palen, W.J.; Anderson, S.C. Climate warming mediates negative impacts of rapid pond drying for three amphibian species. Ecology 2014, 95, 845–855. [Google Scholar] [CrossRef]
  36. Blaustein, A.R.; Walls, S.C.; Bancroft, B.A.; Lawler, J.J.; Searle, C.L.; Gervasi, S.S. Direct and indirect effects of climate change on amphibian populations. Diversity 2010, 2, 281–313. [Google Scholar] [CrossRef]
  37. Blaustein, A.R.; Han, B.A.; Relyea, R.A.; Johnson, P.T.; Buck, J.C.; Gervasi, S.S.; Kats, L.B. The complexity of amphibian population declines: Understanding the role of cofactors in driving amphibian losses. Ann. N. Y. Acad. Sci. 2011, 1223, 108–119. [Google Scholar] [CrossRef]
  38. Morin, P.J. Predation, competition, and the composition of larval anuran guilds. Ecol. Monogr. 1983, 53, 119–138. [Google Scholar] [CrossRef]
  39. Cocciardi, J.M.; Ohmer, M.E. Drivers of intraspecific variation in thermal traits and their importance for resilience to global change in amphibians. Integr. Comp. Biol. 2024, 64, 882–899. [Google Scholar] [CrossRef] [PubMed]
  40. Miller, D.A.; Grant, E.H.C.; Muths, E.; Amburgey, S.M.; Adams, M.J.; Joseph, M.B.; Sigafus, B.H. Quantifying climate sensitivity and climate-driven change in North American amphibian communities. Nat. Commun. 2018, 9, 3926. [Google Scholar] [CrossRef]
  41. Lavergne, S.; Mouquet, N.; Thuiller, W.; Ronce, O. Biodiversity and climate change: Integrating evolutionary and ecological responses of species and communities. Annu. Rev. Ecol. Evol. Syst. 2010, 41, 321–350. [Google Scholar] [CrossRef]
  42. Vellend, M.; Lajoie, G.; Bourret, A.; Múrria, C.; Kembel, S.W.; Garant, D. Drawing ecological inferences from coincident patterns of population- and community-level biodiversity. Mol. Ecol. 2014, 23, 2890–2901. [Google Scholar] [CrossRef]
  43. Guillera-Arroita, G. Modelling of species distributions, range dynamics and communities under imperfect detection: Advances, challenges and opportunities. Ecography 2017, 40, 281–295. [Google Scholar] [CrossRef]
  44. Skelly, D.K. Distributions of pond-breeding anurans: An overview of mechanisms. Isr. J. Zool. 2001, 47, 313–332. [Google Scholar] [CrossRef]
  45. Drayer, A.N.; Richter, S.C. Physical wetland characteristics influence amphibian community composition differently in constructed wetlands and natural wetlands. Ecol. Eng. 2016, 93, 166–174. [Google Scholar] [CrossRef]
  46. Meerhoff, M.; Beklioğlu, M. Shallow lakes and ponds. In Wetzel’s Limnology; Academic Press: Amsterdam, The Netherlands, 2024; pp. 859–892. [Google Scholar]
  47. Ruiz-Gutiérrez, V.; Zipkin, E.F. Detection biases yield misleading patterns of species persistence and colonization in fragmented landscapes. Ecosphere 2011, 2, 1–14. [Google Scholar] [CrossRef]
  48. Dorazio, R.M.; Royle, J.A. Estimating size and composition of biological communities by modeling the occurrence of species. J. Am. Stat. Assoc. 2005, 100, 389–398. [Google Scholar] [CrossRef]
  49. Dorazio, R.M. Accounting for imperfect detection and survey bias in statistical analysis of presence-only data. Glob. Ecol. Biogeogr. 2014, 23, 1472–1484. [Google Scholar] [CrossRef]
  50. Kéry, M.; Royle, J.A. Applied Hierarchical Modeling in Ecology: Analysis of Distribution, Abundance and Species Richness in R and BUGS, 1st ed.; Academic Press: Amsterdam, The Netherlands, 2015. [Google Scholar]
  51. Zipkin, E.F.; Dewan, A.; Royle, J.A. Impacts of forest fragmentation on species richness: A hierarchical approach to community modelling. J. Appl. Ecol. 2009, 46, 815–822. [Google Scholar] [CrossRef]
  52. Devarajan, K.; Morelli, T.L.; Tenan, S. Multi-species occupancy models: Review, roadmap, and recommendations. Ecography 2020, 43, 1612–1624. [Google Scholar] [CrossRef]
  53. Dorazio, R.M.; Kéry, M.; Royle, J.A.; Plattner, M. Models for inference in dynamic metacommunity systems. Ecology 2010, 91, 2466–2475. [Google Scholar] [CrossRef]
  54. Mihaljevic, J.R.; Joseph, M.B.; Johnson, P.T. Using multispecies occupancy models to improve the characterization and understanding of metacommunity structure. Ecology 2015, 96, 1783–1792. [Google Scholar] [CrossRef]
  55. Gomez, J.P.; Robinson, S.K.; Blackburn, J.K.; Ponciano, J.M. An efficient extension of N-mixture models for multi-species abundance estimation. Methods Ecol. Evol. 2018, 9, 340–353. [Google Scholar] [CrossRef]
  56. Link, W.A. Modeling pattern in collections of parameters. J. Wildl. Manag. 1999, 63, 1017–1027. [Google Scholar] [CrossRef]
  57. Zipkin, E.F.; Royle, J.A.; Dawson, D.K.; Bates, S. Multi-species occurrence models to evaluate the effects of conservation and management actions. Biol. Conserv. 2010, 143, 479–484. [Google Scholar] [CrossRef]
  58. Thorson, J.T.; Barnett, L.A. Comparing estimates of abundance trends and distribution shifts using single-and multispecies models of fishes and biogenic habitat. ICES J. Mar. Sci. 2017, 74, 1311–1321. [Google Scholar] [CrossRef]
  59. Ramsar Convention. The Ramsar Convention on Wetlands. Available online: http://www.ramsar.org (accessed on 15 April 2024).
  60. Demissie, M.; Soong, T.W.; Keefer, L.L.; Allgire, R.L.; Makowski, P.B. Cache River Basin: Hydrology, Hydraulics, and Sediment Transport; ISWS: Champaign, IL, USA, 1990; Volume 1. [Google Scholar]
  61. Hutton, J.M.; Macedo, A.D.; Warne, R.W. Factors influencing the occupancy and detection of nonbreeding Hyla chrysoscelis within artificial polyvinyl chloride refugia. Herpetologica 2024, 80, 221–233. [Google Scholar] [CrossRef]
  62. Hutton, J.M.; Macedo, A.D.; Brown, J.L.; Warne, R.W. A novel indicator to assess PIT tag retention in an aquatic amphibian: Impact of body size. Anim. Biotelemetry 2024, 12, 37. [Google Scholar] [CrossRef]
  63. Phillips, C.A.; Crawford, J.A.; Kuhns, A.R. Field Guide to Amphibians and Reptiles of Illinois; University of Illinois Press: Champaign, IL, USA, 2022. [Google Scholar]
  64. Denton, R.D.; Richter, S.C. A quantitative comparison of two common amphibian sampling techniques for wetlands. Herpetol. Rev. 2012, 43, 44–47. [Google Scholar]
  65. Knape, J.; Korner-Nievergelt, F. Estimates from non-replicated population surveys rely on critical assumptions. Methods Ecol. Evol. 2015, 6, 298–306. [Google Scholar] [CrossRef]
  66. Altig, R.; McDiarmid, R.W. Handbook of Larval Amphibians of the United States and Canada; Cornell University Press: Ithaca, NY, USA, 2017. [Google Scholar]
  67. Merritt, R.W.; Cummins, K.W. (Eds.) An Introduction to the Aquatic Insects of North America; Kendall Hunt: Dubuque, IA, USA, 1996. [Google Scholar]
  68. Duellman, W.E.; Trueb, L. Biology of Amphibians; Johns Hopkins University Press: Baltimore, MD, USA, 1994. [Google Scholar]
  69. Altig, R.; McDiarmid, R.W. (Eds.) Tadpoles: The Biology of Anuran Larvae; University of Chicago Press: Chicago, IL, USA, 1999. [Google Scholar]
  70. Lannoo, M.J. (Ed.) Amphibian Declines: The Conservation Status of United States Species; University of California Press: Berkeley, CA, USA, 2005. [Google Scholar]
  71. Anderson, J.T.; Zilli, F.L.; Montalto, L.; Marchese, M.R.; McKinney, M.; Park, Y.L. Sampling and processing aquatic and terrestrial invertebrates in wetlands. In Wetland Techniques; Anderson, J.T., Ed.; Springer: Dordrecht, The Netherlands, 2013; pp. 143–195. [Google Scholar]
  72. Peterman, W.E.; Anderson, T.L.; Drake, D.L.; Ousterhout, B.H.; Semlitsch, R.D. Maximizing pond biodiversity across the landscape: A case study of larval ambystomatid salamanders. Anim. Conserv. 2014, 17, 275–285. [Google Scholar] [CrossRef]
  73. Simpkins, C.A.; Shuker, J.D.; Lollback, G.W.; Castley, J.G.; Hero, J.M. Environmental variables associated with the distribution and occupancy of habitat specialist tadpoles in naturally acidic, oligotrophic waterbodies. Aust. Ecol. 2014, 39, 95–105. [Google Scholar] [CrossRef]
  74. Werner, E.E.; Skelly, D.K.; Relyea, R.A.; Yurewicz, K.L. Amphibian species richness across environmental gradients. Oikos 2007, 116, 1697–1712. [Google Scholar] [CrossRef]
  75. Anderson, T.L.; Heemeyer, J.L.; Peterman, W.E.; Everson, M.J.; Ousterhout, B.H.; Drake, D.L.; Semlitsch, R.D. Automated analysis of temperature variance to determine inundation state of wetlands. Wetl. Ecol. Manag. 2015, 23, 1039–1047. [Google Scholar] [CrossRef]
  76. MacKenzie, D.I.; Nichols, J.D.; Lachman, G.B.; Droege, S.; Royle, J.A.; Langtimm, C.A. Estimating site occupancy rates when detection probabilities are less than one. Ecology 2002, 83, 2248–2255. [Google Scholar] [CrossRef]
  77. Gelman, A. Scaling regression inputs by dividing by two standard deviations. Stat. Med. 2008, 27, 2865–2873. [Google Scholar] [CrossRef] [PubMed]
  78. Wit, E.; Heuvel, E.V.D.; Romeijn, J.W. ‘All models are wrong…’: An introduction to model uncertainty. Stat. Neerl. 2012, 66, 217–236. [Google Scholar] [CrossRef]
  79. Bürkner, P.C.; Scholz, M.; Radev, S.T. Some models are useful, but how do we know which ones? Towards a unified Bayesian model taxonomy. Statist. Surv. 2023, 17, 216–310. [Google Scholar] [CrossRef]
  80. Newling, J.; Bassett, B.; Hlozek, R.; Kunz, M.; Smith, M.; Varughese, M. Parameter estimation with Bayesian estimation applied to multiple species in the presence of biases and correlations. Mon. Not. R. Astron. Soc. 2012, 421, 913–925. [Google Scholar] [CrossRef]
  81. Kim, J.H. Multicollinearity and misleading statistical results. Korean J. Anesthesiol. 2019, 72, 558–569. [Google Scholar] [CrossRef]
  82. Herwig, B.R.; Schroeder, L.W.; Zimmer, K.D.; Hanson, M.A.; Staples, D.F.; Wright, R.G.; Younk, J.A. Fish influences on amphibian presence and abundance in prairie and parkland landscapes of Minnesota, USA. J. Herpetol. 2013, 47, 489–497. [Google Scholar] [CrossRef]
  83. Hamer, A.J.; Horányi, J. Improving inference within freshwater community studies: Accounting for variable detection rates of amphibians and fish. Ecol. Evol. 2024, 14, e70383. [Google Scholar] [CrossRef]
  84. Kéry, M.; Schaub, M. Estimation of occupancy and species distributions from detection/nondetection data in metapopulation designs using site-occupancy models. In Bayesian Population Analysis Using WinBUGS: A Hierarchical Perspective; Academic Press: Cambridge, MA, USA, 2012; pp. 413–461. [Google Scholar]
  85. MacKenzie, D.I. Modeling the probability of resource use: The effect of, and dealing with, detecting a species imperfectly. J. Wildl. Manag. 2006, 70, 367–374. [Google Scholar] [CrossRef]
  86. Kéry, M.; Royle, J.A. Hierarchical Bayes estimation of species richness and occupancy in spatially replicated surveys. J. Appl. Ecol. 2008, 45, 589–598. [Google Scholar] [CrossRef]
  87. Latif, Q.S.; Valente, J.J.; Johnston, A.; Davis, K.L.; Fogarty, F.A.; Green, A.W.; Zhao, Q. Designing count-based studies in a world of hierarchical models. J. Wildl. Manag. 2024, 88, e22622. [Google Scholar] [CrossRef]
  88. Royle, J.A. N-mixture models for estimating population size from spatially replicated counts. Biometrics 2004, 60, 108–115. [Google Scholar] [CrossRef] [PubMed]
  89. Royle, J.A.; Nichols, J.D.; Kéry, M. Modelling occurrence and abundance of species when detection is imperfect. Oikos 2005, 110, 353–359. [Google Scholar] [CrossRef]
  90. Kéry, M.; Dorazio, R.M.; Soldaat, L.; Van Strien, A.; Zuiderwijk, A.; Royle, J.A. Trend estimation in populations with imperfect detection. J. Appl. Ecol. 2009, 46, 1163–1172. [Google Scholar] [CrossRef]
  91. Knape, J.; Arlt, D.; Barraquand, F.; Berg, Å.; Chevalier, M.; Pärt, T.; Żmihorski, M. Sensitivity of binomial N-mixture models to overdispersion: The importance of assessing model fit. Methods Ecol. Evol. 2018, 9, 2102–2114. [Google Scholar] [CrossRef]
  92. Link, W.A.; Schofield, M.R.; Barker, R.J.; Sauer, J.R. On the robustness of N-mixture models. Ecology 2018, 99, 1547–1551. [Google Scholar] [CrossRef]
  93. Williams, P.J.; Robb, J.R.; Karns, D.R. Occupancy dynamics of breeding Crawfish Frogs in southeastern Indiana. Wildl. Soc. Bull. 2012, 36, 350–357. [Google Scholar] [CrossRef]
  94. Hartel, T.; Nemes, S.; Cogălniceanu, D.; Öllerer, K.; Schweiger, O.; Moga, C.I.; Demeter, L. The effect of fish and aquatic habitat complexity on amphibians. Hydrobiologia 2007, 583, 173–182. [Google Scholar] [CrossRef]
  95. Lewis, T. Environmental Influences on the Population Ecology of Sixteen Anuran Amphibians in a Seasonally Flooded Neotropical Forest. Ph.D. Thesis, Farnborough College of Technology, Farnborough, UK, 2009. [Google Scholar]
  96. Hamer, A.J.; Parris, K.M. Predation modifies larval amphibian communities in urban wetlands. Wetlands 2013, 33, 641–652. [Google Scholar] [CrossRef]
  97. Jeffries, M.J.; Epele, L.B.; Studinski, J.M.; Vad, C.F. Invertebrates in temporary wetland ponds of the temperate biomes. In Invertebrates in Freshwater Wetlands: An International Perspective on Their Ecology; Springer: Dordrecht, The Netherlands, 2016; pp. 105–139. [Google Scholar]
  98. Pacifici, K.; Zipkin, E.F.; Collazo, J.A.; Irizarry, J.I.; DeWan, A. Guidelines for a priori grouping of species in hierarchical community models. Ecol. Evol. 2014, 4, 877–888. [Google Scholar] [CrossRef]
  99. Beasley, E.M. Ecologically informed priors improve Bayesian model estimates of species richness and occupancy for undetected species. Ecol. Appl. 2024, 34, e2941. [Google Scholar] [CrossRef]
  100. Anholt, B.R.; Skelly, D.K.; Werner, E.E. Factors modifying antipredator behavior in larval toads. Herpetologica 1996, 52, 301–313. [Google Scholar]
  101. Nicieza, A.G. Interacting effects of predation risk and food availability on larval anuran behaviour and development. Oecologia 2000, 123, 497–505. [Google Scholar] [CrossRef] [PubMed]
  102. Oakley, J.E.; O’Hagan, A. Probabilistic sensitivity analysis of complex models: A Bayesian approach. J. R. Stat. Soc. B 2004, 66, 751–769. [Google Scholar] [CrossRef]
  103. Conn, P.B.; Johnson, D.S.; Williams, P.J.; Melin, S.R.; Hooten, M.B. A guide to Bayesian model checking for ecologists. Ecol. Monogr. 2018, 88, 526–542. [Google Scholar] [CrossRef]
  104. Schaub, M.; Kéry, M. Integrated Population Models: Theory and Ecological Applications with R and JAGS; Academic Press: London, UK, 2021. [Google Scholar]
  105. Cumming, G.; Finch, S. Inference by eye: Confidence intervals and how to read pictures of data. Am. Psychol. 2005, 60, 170. [Google Scholar] [CrossRef] [PubMed]
  106. Rota, C.T.; Ferreira, M.A.; Kays, R.W.; Forrester, T.D.; Kalies, E.L.; McShea, W.J.; Millspaugh, J.J. A multispecies occupancy model for two or more interacting species. Methods Ecol. Evol. 2016, 7, 1164–1173. [Google Scholar] [CrossRef]
  107. Plummer, M. JAGS Version 3.4.0 User Manual. Available online: https://sourceforge.net/projects/mcmc-jags/files/Manuals/ (accessed on 29 January 2025).
  108. Su, Y.S.; Yajima, M. R2jags: Using R to Run ‘JAGS’. R Package Version 0.5-7. Available online: https://cran.r-project.org/web/packages/R2jags/ (accessed on 29 March 2025).
  109. R Core Team. R: A Language and Environment for Statistical Computing; R Foundation for Statistical Computing: Vienna, Austria, 2020. [Google Scholar]
  110. Gelman, A.; Rubin, D.B. Inference from iterative simulation using multiple sequences. Stat. Sci. 1992, 7, 457–472. [Google Scholar] [CrossRef]
  111. Brooks, S.P.; Gelman, A. General methods for monitoring convergence of iterative simulations. J. Comput. Graph. Stat. 1998, 7, 434–455. [Google Scholar] [CrossRef]
  112. Olson, G.S.; Anthony, R.G.; Forsman, E.D.; Ackers, S.H.; Loschl, P.J.; Reid, J.A.; Ripple, W.J. Modeling of site occupancy dynamics for northern spotted owls, with emphasis on the effects of barred owls. J. Wildl. Manag. 2005, 69, 918–932. [Google Scholar] [CrossRef]
  113. Roloff, G.J.; Grazia, T.E.; Millenbah, K.F.; Kroll, A.J. Factors associated with amphibian detection and occupancy in southern Michigan forests. J. Herpetol. 2011, 45, 15–22. [Google Scholar] [CrossRef]
  114. Gelman, A.; Meng, X.L.; Stern, H. Posterior predictive assessment of model fitness via realized discrepancies. Stat. Sin. 1996, 6, 733–760. [Google Scholar]
  115. Stolen, E.D.; Oddy, D.M.; Gann, S.L.; Holloway-Adkins, K.G.; Legare, S.A.; Weiss, S.K.; Breininger, D.R. Accounting for heterogeneity in false-positive detection rate in southeastern beach mouse habitat occupancy models. Ecosphere 2019, 10, e02893. [Google Scholar] [CrossRef]
  116. Spiegelhalter, D.J.; Best, N.G.; Carlin, B.P.; Van Der Linde, A. Bayesian measures of model complexity and fit. J. R. Stat. Soc. B 2002, 64, 583–639. [Google Scholar] [CrossRef]
  117. Hooten, M.B.; Hobbs, N.T. A guide to Bayesian model selection for ecologists. Ecol. Monogr. 2015, 85, 3–28. [Google Scholar] [CrossRef]
  118. Stretz, P.; Anderson, T.L.; Burkhart, J.J. Macroinvertebrate foraging on larval Ambystoma maculatum across ontogeny. Copeia 2019, 107, 244–249. [Google Scholar] [CrossRef]
  119. Pilliod, D.S.; Hossack, B.R.; Bahls, P.F.; Bull, E.L.; Corn, P.S.; Hokit, G.; Wyrick, A. Non-native salmonids affect amphibian occupancy at multiple spatial scales. Divers. Distrib. 2010, 16, 959–974. [Google Scholar] [CrossRef]
  120. Gehlbach, F.R.; Kennedy, S.E. Population ecology of a highly productive aquatic salamander Siren intermedia. Southwest. Nat. 1978, 23, 423–430. [Google Scholar] [CrossRef]
  121. Raymond, L.R. Seasonal activity of Siren intermedia in northwestern Louisiana (Amphibia: Sirenidae). Southwest. Nat. 1991, 36, 144–147. [Google Scholar] [CrossRef]
  122. Jackson, M.E.; Semlitsch, R.D. Paedomorphosis in the salamander Ambystoma talpoideum: Effects of a fish predator. Ecology 1993, 74, 342–350. [Google Scholar] [CrossRef]
  123. Frese, P.W.; Mathis, A.; Wilkinson, R. Population characteristics, growth, and spatial activity of Siren intermedia in an intensively managed wetland. Southwest. Nat. 2003, 48, 534–542. [Google Scholar] [CrossRef]
  124. Sawyer, J.A.; Trauth, S.E. Seasonal activity, population characteristics, and age estimation in the aquatic salamander Siren intermedia nettingi (Goin). J. Ark. Acad. Sci. 2011, 65, 117–125. [Google Scholar] [CrossRef]
  125. Thornton, B. Population characteristics of the lesser siren (Siren intermedia) in central Illinois. Ill. State Acad. Sci. Trans. 2023, 116, 7–11. [Google Scholar]
  126. Semlitsch, R.D. Reproductive strategy of a facultatively paedomorphic salamander Ambystoma talpoideum. Oecologia 1985, 65, 305–313. [Google Scholar] [CrossRef]
  127. Semlitsch, R.D.; Harris, R.N.; Wilbur, H.M. Paedomorphosis in Ambystoma talpoideum: Maintenance of population variation and alternative life-history pathways. Evolution 1990, 44, 1604–1613. [Google Scholar] [PubMed]
  128. Baker, J.; Beebee, T.; Buckley, J.; Gent, T.; Orchard, D. Amphibian Habitat Management Handbook; Amphibian and Reptile Conservation: Bournemouth, UK, 2011; p. 39. [Google Scholar]
  129. Tscharntke, T.; Tylianakis, J.M.; Rand, T.A.; Didham, R.K.; Fahrig, L.; Batáry, P.; Westphal, C. Landscape moderation of biodiversity patterns and processes—Eight hypotheses. Biol. Rev. 2012, 87, 661–685. [Google Scholar] [CrossRef]
  130. Baldwin, R.F.; Calhoun, A.J.K.; deMaynadier, P.G. The significance of hydroperiod and stand maturity for pool-breeding amphibians in forested landscapes. Can. J. Zool. 2006, 84, 1604–1615. [Google Scholar] [CrossRef]
  131. Earl, J.E.; Luhring, T.M.; Williams, B.K.; Semlitsch, R.D. Biomass export of salamanders and anurans from ponds is affected differentially by changes in canopy cover. Freshw. Biol. 2011, 56, 2473–2482. [Google Scholar] [CrossRef]
  132. Peterman, W.E.; Rittenhouse, T.A.; Earl, J.E.; Semlitsch, R.D. Demographic network and multi-season occupancy modeling of Rana sylvatica reveal spatial and temporal patterns of population connectivity and persistence. Landsc. Ecol. 2013, 28, 1601–1613. [Google Scholar] [CrossRef]
  133. Burrow, A.K.; Maerz, J.C. Experimental confirmation of effects of leaf litter type and light on tadpole performance for two priority amphibians. Ecosphere 2021, 12, e03729. [Google Scholar] [CrossRef]
  134. Stephens, J.P.; Berven, K.A.; Tiegs, S.D. Anthropogenic changes to leaf litter input affect the fitness of a larval amphibian. Freshw. Biol. 2013, 58, 1631–1646. [Google Scholar] [CrossRef]
  135. Curtis, A.E.; Paton, P.W. Assessing detection probabilities of larval amphibians and macroinvertebrates in isolated ponds. Wetlands 2010, 30, 901–914. [Google Scholar] [CrossRef]
  136. Skelly, D.K.; Richardson, J.L. Larval sampling. In Amphibian Ecology and Conservation: A Handbook of Techniques; Oxford University Press: Oxford, UK, 2010; pp. 55–70. [Google Scholar]
  137. Twining, J.P.; Fuller, A.K.; Sun, C.C.; Calderón-Acevedo, C.A.; Schlesinger, M.D.; Berger, M.; Frair, J.L. Integrating presence-only and detection/non-detection data to estimate distributions and expected abundance of difficult-to-monitor species on a landscape-scale. J. Appl. Ecol. 2024, 61, 1441–1459. [Google Scholar] [CrossRef]
  138. Albecker, M.; Vance-Chalcraft, H.D. Mismatched anti-predator behavioral responses in predator-naïve larval anurans. PeerJ 2015, 3, e1472. [Google Scholar] [CrossRef]
  139. Brown, T.A.; Fraker, M.E.; Ludsin, S.A. Space use of predatory larval dragonflies and tadpole prey in response to chemical cues of predation. Am. Midl. Nat. 2019, 181, 53–62. [Google Scholar] [CrossRef]
  140. Flores, C.A.; Crossland, M.R.; Arreortúa, M.; González-Bernal, E. Responses of Showy Leopard Frog Larvae (Lithobates spectabilis) to the Presence of Introduced Rainbow Trout in Mexico. Aquat. Conserv. Mar. Freshw. Ecosyst. 2024, 34, e4254. [Google Scholar] [CrossRef]
  141. Relyea, R.A. Fine-tuned phenotypes: Tadpole plasticity under 16 combinations of predators and competitors. Ecology 2004, 85, 172–179. [Google Scholar] [CrossRef]
  142. Wilson, R.S.; Kraft, P.G.; Van Damme, R. Predator-specific changes in the morphology and swimming performance of larval Rana lessonae. Funct. Ecol. 2005, 19, 238–244. [Google Scholar] [CrossRef]
  143. Schmidt, B.R.; Băncilă, R.I.; Hartel, T.; Grossenbacher, K.; Schaub, M. Shifts in amphibian population dynamics in response to a change in the predator community. Ecosphere 2021, 12, e03528. [Google Scholar] [CrossRef]
  144. Bennett, S.H.; Waldron, J.L.; Welch, S.M. Light bait improves capture success of aquatic funnel-trap sampling for larval amphibians. Southeast. Nat. 2012, 11, 49–58. [Google Scholar] [CrossRef]
  145. Petitot, M.; Manceau, N.; Geniez, P.; Besnard, A. Optimizing occupancy surveys by maximizing detection probability: Application to amphibian monitoring in the Mediterranean region. Ecol. Evol. 2014, 4, 3538–3549. [Google Scholar] [CrossRef]
  146. Arntzen, J.W.; Zuiderwijk, A. Sampling efficiency, bias and shyness in funnel trapping aquatic newts. Amphibia-Reptilia 2020, 41, 413–420. [Google Scholar] [CrossRef]
  147. Baumgardt, J.A.; Morrison, M.L.; Brennan, L.A.; Thornley, M.; Campbell, T.A. Variation in herpetofauna detection probabilities: Implications for study design. Environ. Monit. Assess. 2021, 193, 658. [Google Scholar] [CrossRef] [PubMed]
  148. Lebreton, J.D.; Gimenez, O. Detecting and estimating density dependence in wildlife populations. J. Wildl. Manag. 2013, 77, 12–23. [Google Scholar] [CrossRef]
  149. Sih, A.; Crowley, P.; McPeek, M.; Petranka, J.; Strohmeier, K. Predation, competition, and prey communities: A review of field experiments. Annu. Rev. Ecol. Syst. 1985, 16, 269–311. [Google Scholar] [CrossRef]
  150. Amir, Z.; Sovie, A.; Luskin, M.S. Inferring predator–prey interactions from camera traps: A Bayesian co-abundance modeling approach. Ecol. Evol. 2022, 12, e9627. [Google Scholar] [CrossRef]
  151. Crane, A.L.; Bryshun, R.; McCormack, M.; Achtymichuk, G.H.; Rivera-Hernández, I.A.; Ferrari, M.C. Evidence for the Predator Attraction Hypothesis in an amphibian predator–prey system. J. Evol. Bio. 2023, 36, 57–66. [Google Scholar] [CrossRef]
  152. Wizen, G.; Gasith, A. An unprecedented role reversal: Ground beetle larvae (Coleoptera: Carabidae) lure amphibians and prey upon them. PLoS ONE 2011, 6, e25161. [Google Scholar] [CrossRef]
  153. Legendre, P.; Fortin, M.J. Spatial pattern and ecological analysis. Vegetatio 1989, 80, 107–138. [Google Scholar] [CrossRef]
  154. Guzy, J.C.; Halloran, K.M.; Homyack, J.A.; Thornton-Frost, J.E.; Willson, J.D. Differential responses of amphibian and reptile assemblages to size of riparian buffers within managed forests. Ecol. Appl. 2019, 29, e01995. [Google Scholar] [CrossRef]
Figure 1. Conceptual model depicting hypothesized positive (+) and negative (−) relationships between habitat features, predators, and amphibian community/species responses.
Hydrobiology 04 00015 g001
Figure 2. Estimates of occupancy (ψ), abundance (λ), and detection (p) intercept parameters (ψ0, λ0, p0) and site/survey covariate effects for a larval amphibian community of six spring-breeding species in a remnant Tupelo-Cypress swamp in southern Illinois. Estimates were derived from the initial full models with uncorrelated covariates for each sub-model and from the top-supported model identified through model selection. Points represent posterior parameter means; thick bands represent the central 50% Bayesian credible interval (CI); thin bands represent the central 95% CI (2.5th and 97.5th percentiles). Parameters with means or 95% CIs overlapping zero are shown in gray. Covariates: Area = wetted pond area, Backswimmers = number of predatory backswimmer invertebrates, Beetles = number of predatory beetles, Canopy = average % canopy cover, Comp = number of larval amphibians competing for resources, Crayfish = number of predatory crayfish, Depth = maximum pond depth, Dragonfly = number of predatory dragonfly larvae, Effort = number of dipnet sweeps, Fish = predatory fish presence (1) or absence (0), JD = survey Julian Date (days since 1 January 2023), Leaf = % leaf litter, Perm = wetted pond perimeter, Salapred = number of larval salamander predators. Species abbreviations: A.mac = Ambystoma maculatum; A.tal = A. talpoideum; A.tex = A. texanum; L.s = Lithobates sphenocephalus; P. spp = Pseudacris spp.; S.i = Siren intermedia.
Hydrobiology 04 00015 g002
Figure 3. Estimated mean community- and species-specific occupancy probability (ψ), abundance (λ), and detection probability (p) for a larval amphibian community of six spring-breeding species in a remnant Tupelo-Cypress swamp in southern Illinois. Points represent posterior parameter means; thick bands represent the central 50% Bayesian credible interval (CI); thin bands represent the central 95% CI (2.5th and 97.5th percentiles). Species abbreviations: A.mac = Ambystoma maculatum; A.tal = A. talpoideum; A.tex = A. texanum; L.s = Lithobates sphenocephalus; P. spp = Pseudacris spp.; S.i = Siren intermedia.
Hydrobiology 04 00015 g003
Figure 4. Mean estimates of larval occupancy (ψ), abundance (λ), and detection probability (p) for a community of six spring-breeding amphibian species in response to occupancy effects on (A) the number predatory backswimmers, (B) average canopy cover above the pond, and (C) predatory fish presence, abundance effects on (D) canopy cover, (E) average leaf litter concentration, and (F) wetted pond perimeter, and detection effects on (G) the number of predatory backswimmers, (H) predatory dragonfly larvae, and (I) predatory fish presence in a remnant Tupelo-Cypress swamp in southern Illinois. Black lines represent mean posterior estimates and gray shaded areas represent 95% Bayesian credible intervals.
Hydrobiology 04 00015 g004
Figure 5. Mean species-specific estimates of larval occupancy (ψ), abundance (λ), and detection probability (p) for six spring-breeding amphibian species in response to occupancy effects on (A) the number predatory backswimmers, (B) average canopy cover above the pond, and (C) predatory fish presence, abundance effects on (D) canopy cover, (E) average leaf litter concentration, and (F) wetted pond perimeter, and detection effects on (G) the number of predatory backswimmers, (H) predatory dragonfly larvae, and (I) predatory fish presence in a remnant Tupelo-Cypress swamp in southern Illinois. Note: 95% credible intervals are omitted to improve visual clarity and reduce overlap across species-level prediction lines. Full uncertainty estimates are presented in the main text and in Supplemental Tables S4 and S5. Species abbreviations: A. maculatum = Ambystoma maculatum; A. talpoideum = Ambystoma talpoideum; A. texanum = Ambystoma texanum; L. sphenocephalus = Lithobates sphenocephalus; Pseudacris spp. = Pseudacris spp.; S. intermedia = Siren intermedia.
Hydrobiology 04 00015 g005
Disclaimer/Publisher’s Note: The statements, opinions and data contained in all publications are solely those of the individual author(s) and contributor(s) and not of MDPI and/or the editor(s). MDPI and/or the editor(s) disclaim responsibility for any injury to people or property resulting from any ideas, methods, instructions or products referred to in the content.

