Article

Hatchery-Imposed Selection Does Not Impact the Genetic Diversity of Australian Farmed Blue Mussels (Mytilus spp.)

1
School of Life and Environmental Sciences, Deakin University, Waurn Ponds, Geelong, VIC 3126, Australia
2
School of Biological Science, Universiti Sains Malaysia, Georgetown 11800, Penang, Malaysia
3
Centre for Ecological and Evolutionary Research on Cancer (CREEC), UMR IRD 224-CNRS 5290, Université de Montpellier, 34090 Montpellier, France
4
Queenscliff Marine Research Facility and Shellfish Hatchery, Victorian Fisheries Australia, Melbourne, VIC 3225, Australia
*
Author to whom correspondence should be addressed.
These authors contributed equally to this work.
Hydrobiology 2024, 3(1), 51-62; https://doi.org/10.3390/hydrobiology3010004
Submission received: 26 January 2024 / Revised: 26 February 2024 / Accepted: 28 February 2024 / Published: 2 March 2024

Abstract

:
Australian blue mussels (Mytilus spp.) are an increasingly important sustainable product of the Australian aquaculture industry. Although important for commercial fisheries, aquaculture may have adverse environmental and ecological impacts. This study assessed the impact of standard hatchery-imposed selection practices on the genetic diversity of farmed blue mussels. Using microsatellite markers, relatedness and genetic structure analyses showed that hatchery-reared larvae have high levels of genetic diversity without a significant decline as they move through the hatchery rearing process. Selection and/or genetic drift does appear to be operating during the hatchery rearing process, however, evidenced by an increase in relatedness among larvae over time. Significant shifts in allele frequency as well as genetic clusters provides further evidence that selection is acting on larvae due to the selection practice applied at the hatchery. Comparison of the level of genetic diversity and genetic differentiation of adults from wild and farmed populations provided no evidence that farmed mussels have lower diversity, or that they are genetically swamping local natural populations. The data suggest that careful design and implementation of mussel breeding programs can maintain high genetic diversity among larvae that does not lead to genetic swamping of natural mussel populations in the surrounding area.

1. Introduction

Aquaculture is one of the fastest growing food production industries in the world [1]. It is an increasingly important sustainable food source, with marine bivalves production generating USD 29.8 billion worldwide [2]. Bivalves (commonly separated as clam, oyster, mussel and scallop) account for approximately 14% of global marine seafood production with 89% coming from aquaculture [3]. Asia is the largest contributor to bivalve production (85%) followed by the Americas (9%) and Europe (5.5%) [3]. Africa and Oceania produce less than 1% of global bivalve populations [3]. Although the fishery of marine bivalves is more limited in Oceania, mussels are one of the most important commercially produced bivalve species in this region [4].
Aquaculture plays a crucial role in providing food globally and this is likely to become more important as the world’s population continues to grow. Aquaculture helps meet the increasing demand for seafood and helps reduce the impacts of harvesting wild populations, which is becoming progressively unsustainable [5]. Unfortunately, some aspects of aquaculture can also have potential negative genetic impacts on natural populations if not carefully considered during the design and implementation of breeding programs. The choice of broodstock needs to be carefully designed in aquaculture as it can have important implications for the level of genetic diversity of animals produced. Many highly related individuals (full and half siblings) may be present under industrial scale husbandry, and subsequent selection in aquaculture systems may further erode diversity and increase relatedness [6]. Thus, when animals are released back into the natural environment (either intentionally for restocking or growing out, or unintentionally through escapees), they have the potential to cause higher levels of inbreeding and genetic swamping in the wild (frequency of alleles from a farmed population to increase in the surrounding natural population) [7,8,9]. For example, although selective breeding can have positive effects such as faster growth, better utilization of farming resources and disease resilience [10,11,12], there have been many cases where the release of cultured marine species resulted in genetic swamping when they hybridized with natural populations (e.g., the impact of cultured eastern oysters Crassostrea virginica [13] and European flat oysters Ostrea edulis [14] on their wild counterparts). The aquaculture process could also increase the frequency of maladaptive traits in natural populations. For example, multiple maladaptive traits have been linked to the release of salmon into natural populations including reduced developmental rate [15] and smaller egg size [16] resulting in higher mortality rates in the wild.
The taxonomic status of blue mussels around Australia remains unclear and is an active area of research [7,9,17,18,19]. Thus, in this study we use the term Mytilus spp. when talking about the study species. The Australian blue mussel (Mytilus sp.) forms the basis of an important aquaculture industry on the south coast of Australia. In 2017, the state of Victoria produced 45% of Australia’s total mussel stock, worth AUD 5.2 m [20]. In Victoria, the historical farming approach relied on the collection of wild spat from natural spawning grounds, which were then grown out on suspended ropes [21]. However, due to high variability in spat supply from year to year, a commercial hatchery was established in 2008 to produce a more consistent and reliable spat supply for the mussel industry [21]. In the commercial system, the adults are spawned, and the larvae are reared within a closed hatchery system. One potential consequence of the hatchery spawning process is that large numbers of highly related individuals are produced. This combined with selection within the hatchery (e.g., selection for larger, faster growing individuals) may favour certain family lineages and cause an overall decrease in the genetic diversity of farmed mussels [22]. Once the larvae reach the settlement stage [21], they are settled onto ropes which are then hung from lines in the local environment for growing out to market size. It is during this phase that hatchery-produced and reared mussels have the potential to interbreed with surrounding natural populations.
To assess the potential impact of the hatchery process on levels of genetic diversity and relatedness of hatchery-produced larvae, microsatellite markers were used to conduct a genetic analysis of larvae throughout the hatchery rearing process. It was predicted that, due to the selection for larger larvae, genetic diversity will decrease, and the level of relatedness will increase among larvae as they move through the hatchery rearing process. Genetic diversity of mussels collected from farmed adult mussel lines in the natural environment were also established and compared to those from surrounding natural populations to identify if there was any evidence of hybridization of natural populations with farmed mussels that could lead to genetic swamping and loss of fitness in natural populations.

2. Methodology

2.1. Sample Collection

Adult blue mussel broodstock for spawning within the hatchery were collected (N = 200) from a wild population in 2014 from the vicinity of Werribee town (Victoria, Australia 38.010 S, 144.680 E) and transported back to the Victorian Shellfish Hatchery (VSH) facilities in Queenscliff. The adult mussels were spawned using standard hatchery protocols [21,23]. All animals were cleaned of epiphytes and used for spawning within 24 h of collection. In total, 200 mussels were placed on a spawning table in approximately 6 cm of seawater and spawning was induced using thermal cycling. This involved progressively increasing seawater temperature from 16 to 24 °C using a water heating system over 20 min, then draining the water and repeating the procedure until the release of gametes was triggered. Males and females can readily be distinguished at the time of gamete release with females releasing orange gametes, while males release a white cloud of sperm. Individual mussels were rinsed with filtered seawater and placed into male or female communal 5 L spawning trays. Individuals were allowed to continue releasing gametes for up to 20 min. A total of 80 females were used for gamete collection, and 80 males used for sperm collection; the remaining 40 mussels failed to spawn. Egg concentrations were determined from three replicate counts using a 250 mL (5 mL eggs/245 mL sea water) sample with a coulter counter (560 micro aperture), while sperm concentrations were determined from three replicate haemocytometer counts. Fertilisations were carried out in a 5 L fertilisation chamber by adding enough eggs and sperm to achieve a final egg–sperm ratio of approximately 1:15 [21,24]. Fertilisation was allowed to proceed for approximately 2 h, after which eggs were rinsed with filtered seawater onto a 30 μm mesh to remove excess sperm and prevent polyspermy. Fertilization was confirmed via microscopic examination before fertilised eggs were transferred to a 5000 L tank for larval development.
Larvae collection was done within the Queenscliff marine facility during a normal rearing run, thus larvae rearing followed VSH strict hatchery procedures as described above [21,23]. In a normal rearing run, larvae are screened for size selection daily for 21 days and three sampling periods (beginning, middle, end) were chosen for analysis. Larvae were stocked into 12,400 L tanks at 16–18 million larvae per tank density and sampled on screening day 2, 12 and 20 following manual size grading. On each sampling day, larvae were washed with filtered seawater (1 μm, heated and UV-sterilised) through double filter screens at different grading mesh sizes (a 60 μm filter mesh screen on Day 2, 100 μm on Day 12 and 150 μm on Day 20 respectively) and preserved in 70% ethanol. The front filter screen removed unwanted debris. Larvae smaller than the filter mesh were considered un-fit or failed to survive the hatchery environment and discarded in a disposable container to reduce the risk of gene pollution.
A random selection of 96 mussels were collected from a wild population in Werribee (Victoria, Australia 38.010 S, 144.680 E. The same location as broodstock collection) during March 2014 and 2020. A further 96 samples were purchased from mussel farms in the surrounding area that are supplied by VSH in 2020. Samples were transported live back to the facility where tissue biopsies were taken and preserved in 100% ethanol.

2.2. DNA Extraction and Microsatellite Genotyping

Individual mussel larvae were selected from the preserved larval samples under a dissection microscope using a micropipette. Each individual larva was rinsed by gently pipetting the larva into a fresh solution of 70% ethanol before being transferred into a 96-well plate (one larva per well). The PCR plate was sealed and pulse centrifuged to fix larvae to the bottom of the wells. Plates were unsealed and placed into a 56 °C incubator for approximately 30 min to remove any residual ethanol from the wells. DNA was extracted from larvae by adding 30 μL of Tween20 buffer to each well and then incubating at 56 °C for two hours followed by a 95 °C for 10 min. DNA extracts were stored at −20 °C until further use.
DNA extraction from adult tissue samples was conducted using a DNeasy Blood and Tissue Kit (Qiagen, Hilden, German) according to the manufacturer’s instructions. Six microsatellite loci were selected to assess levels of genetic diversity, relatedness, and population structure. Microsatellite loci were amplified in two PCR multiplex reactions (see Supplementary Table S1). Multiplex 1 consisted of the loci MgU2-HEX, MT203-HEX and MGE005-FAM, and Multiplex 2 consisted of the loci Med744-HEX, My048-FAM and MgU3-HEX [25,26,27,28]. For each multiplex, a 10 μL total reaction assay consisted of 0.2 mM dNTPs, 1 × PCR buffer, 0.25 mM MgCl2 buffer, 0.5 U of QIAGEN Taq, 0.3 μM of each microsatellite primers and 30 ng DNA. Thermal cycling conditions for the two multiplexes varied slightly: for multiplex 1 conditions were 94 °C for 15 min, 30 cycles of 94 °C for 30 s, 55 °C for 3 s, 72 °C for 1 min. A final extension step was held at 72 °C for 15 min. Thermal cycling conditions for multiplex 2 were 94 °C for 15 min, 30 cycles of 94 °C for 30 s, 60 °C for 3 s, 72 °C for 1 min. A final extension step was held at 72 °C for 15 min. Amplified products were analysed on an ABI3730 (Applied Biosystems, Waltham, MA, USA) at the Australian Genome Facility (AGRF, Melbourne, Australia). Fragment sizes were determined with the LIZ500-250 standard using GeneMapper software (Applied Biosystems, Waltham, MA, USA).

2.3. Statistical Analysis

Null allele frequencies were estimated with the Van Oosterhout algorithm in MICROCHECKER v2.2.3 [29]. One locus (My048) was excluded from further analysis due to low percentage of amplification. Null alleles were detected at 3 loci (MT203, MgU3, Med744). Analysis was performed with and without those loci with similar results obtained, therefore all results are presented for the 5 loci. Microsatellite data were tested for agreement with the Hardy Weinberg model in GENEPOP [30] using exact tests. All 5 loci showed significant deficits of heterozygotes for the larvae and adult samples; however, this is not surprising as a selection experiment was undertaken.
Levels of genetic diversity among larvae collected at each time point in the hatchery rearing processes were assessed as mean number of alleles and levels of expected (HE) and observed (HO) heterozygosity and were calculated using Arlequin v3.5.2.2 [31]. Significant differences in genetic diversity between sampled time points were tested using a Friedman Chi-squared test for non-independent data, followed by pairwise paired Wilcoxon tests with false discovery rate correction for multiple testing [32,33] in R [34]. To test for divergence in allele frequencies between the sampling time points, pairwise FST values were calculated in Arlequin v3.5.2.2 [35]. To further explore divergence in allele frequencies through the hatchery rearing process, a Bayesian model-based clustering analysis was used to determine the number of genetic clusters within our data set using the program STRUCTURE 2.3.4 [36]. We assessed the number of genetic clusters (K) in our data for K ranging from 1 through to 10, with a burn-in length of 500,000, and with 500,000 MCMC iterations at each level and 10 replicates for each K. Genetic structuring was tested using the admixture model with allelic frequencies correlated among time points and ignoring prior population information [37]. From the STRUCTURE output, the true number of clusters (K) was determined by looking at the optimum ΔK [38] using STRUCTURE HARVESTER [39]. Relatedness among larvae sampled at each time point was calculated with COANCESTRY v1.0 [40], using the triadic likelihood method described by [41]. This estimator was chosen as it is least biased with unrelated individuals, which is expected in wild populations [33]. Significant changes in relatedness between time periods was assessed with 10,000 permutations in COANCESTRY [40]. Inbreeding coefficients (Fis) were determined in GENEPOP (Rousset, 2008).
The same analyses were conducted on samples from farmed and adjacent wild adult mussels. Levels of genetic diversity between farmed and adjacent wild adult mussels was assessed as mean number of alleles and levels of expected heterozygosity (HE), while population structure was calculated as FST using the program Arlequin v3.5.2.2 [31].

3. Results

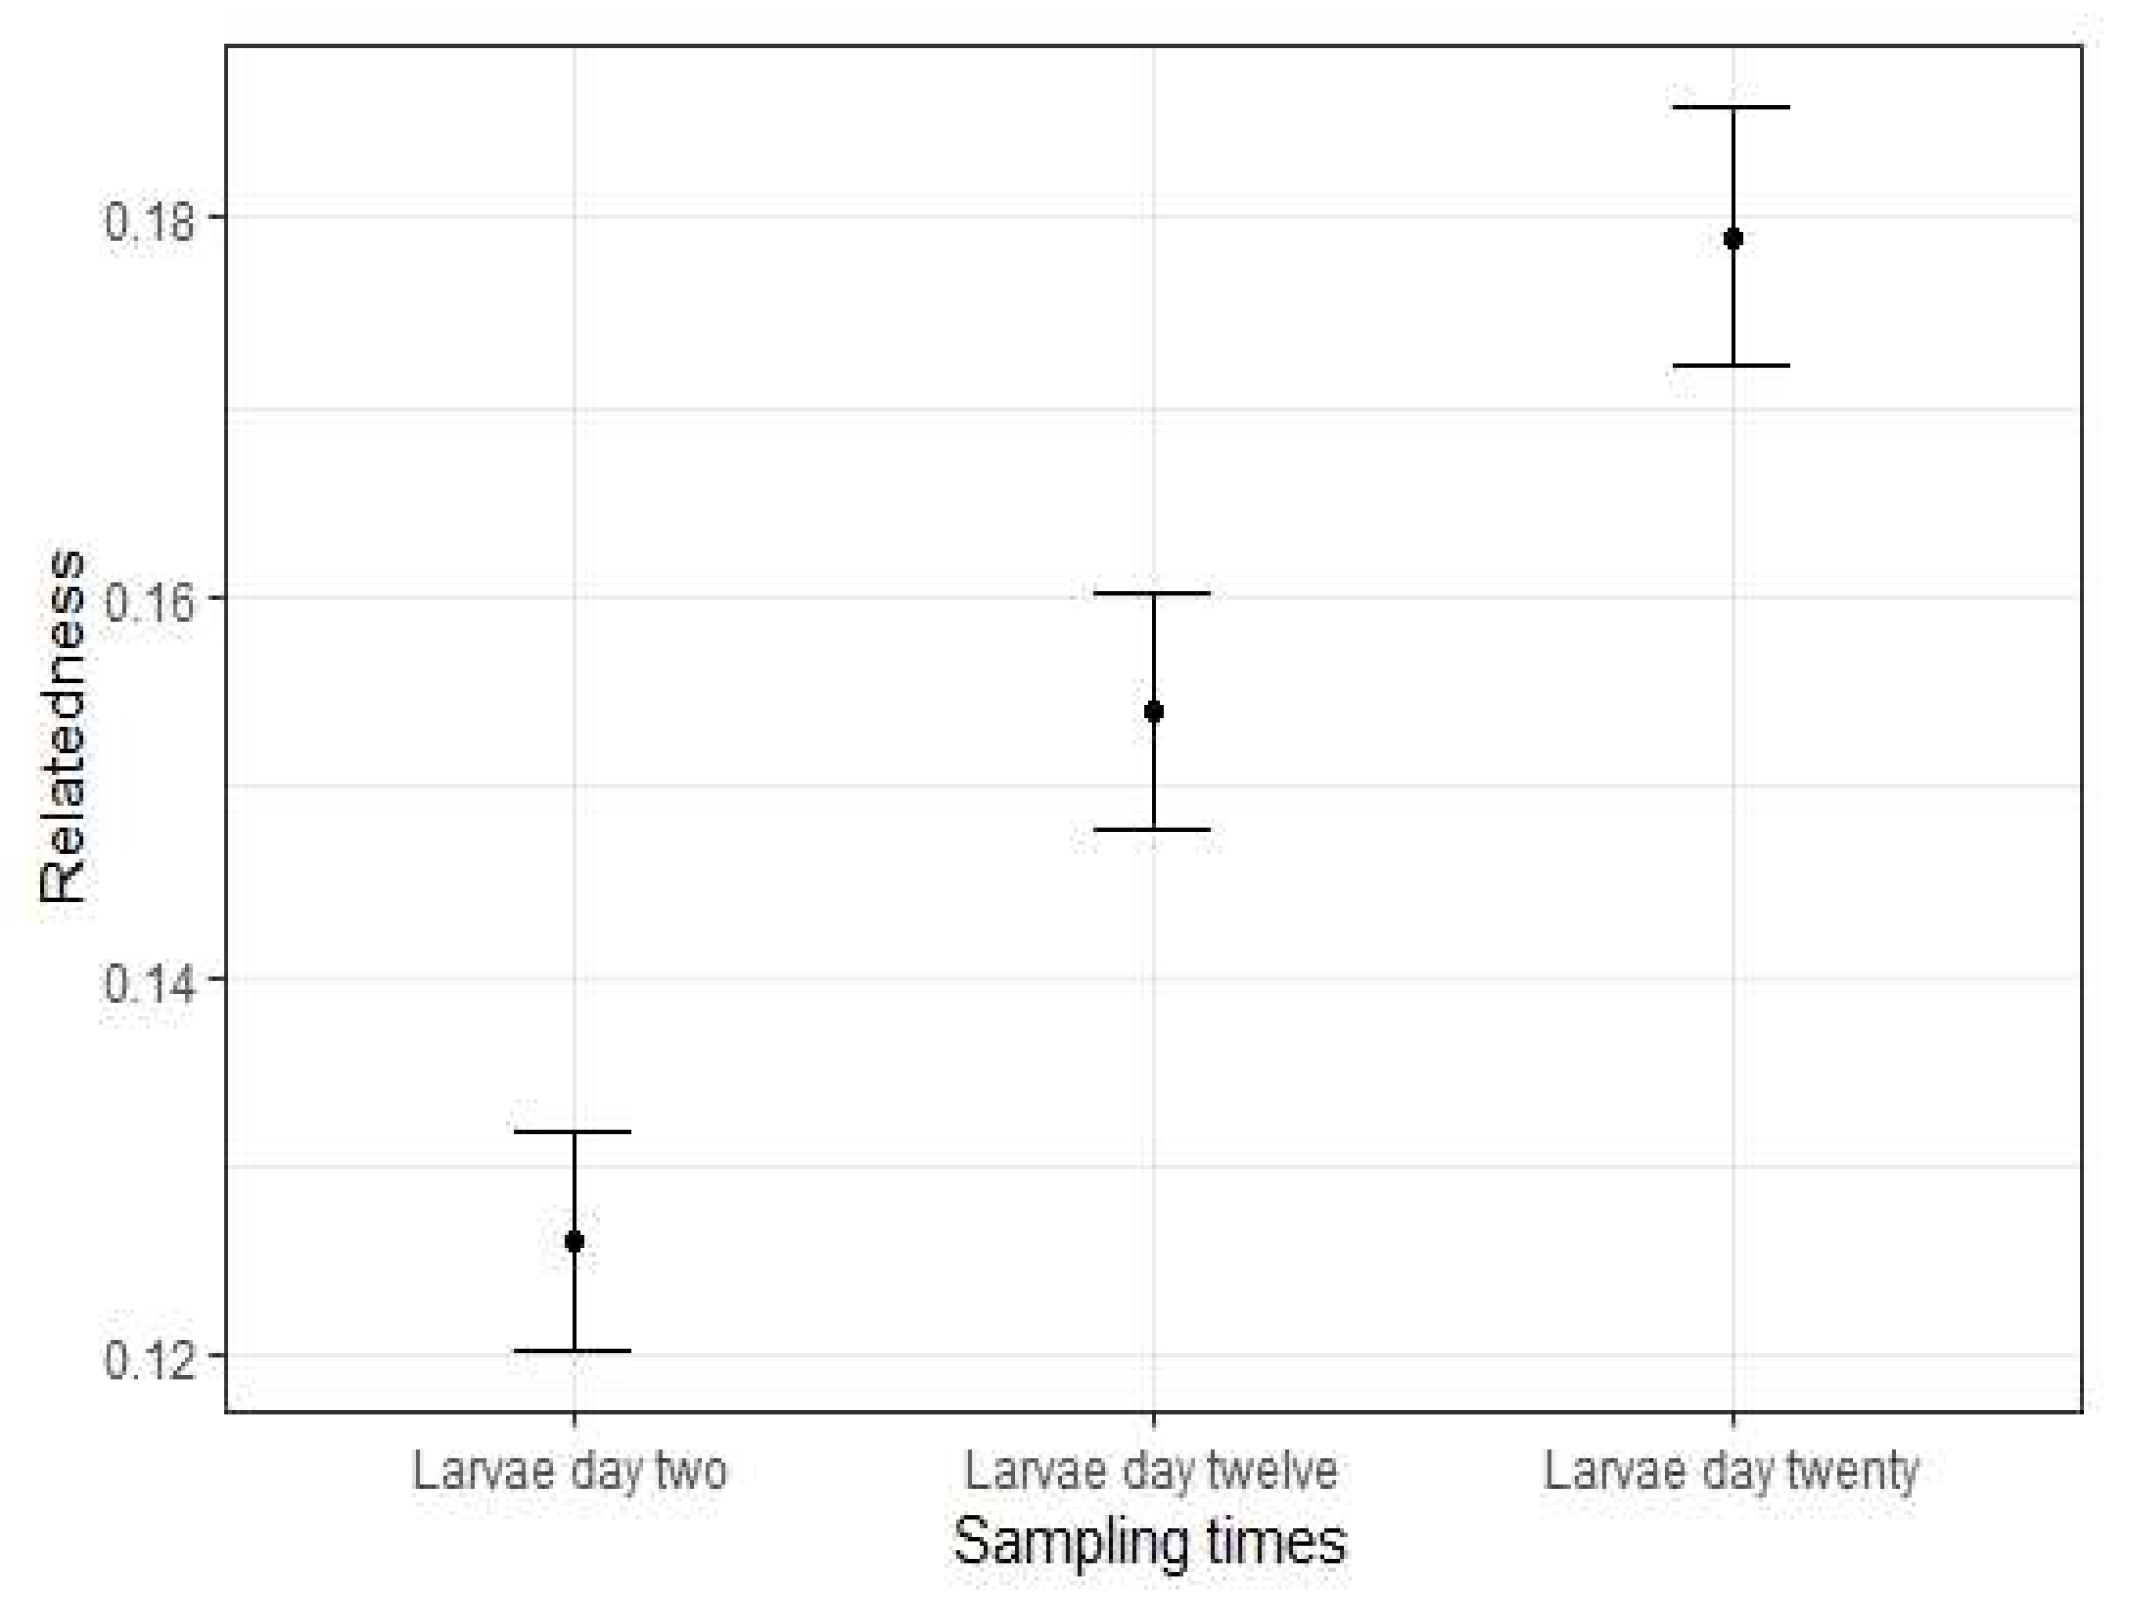
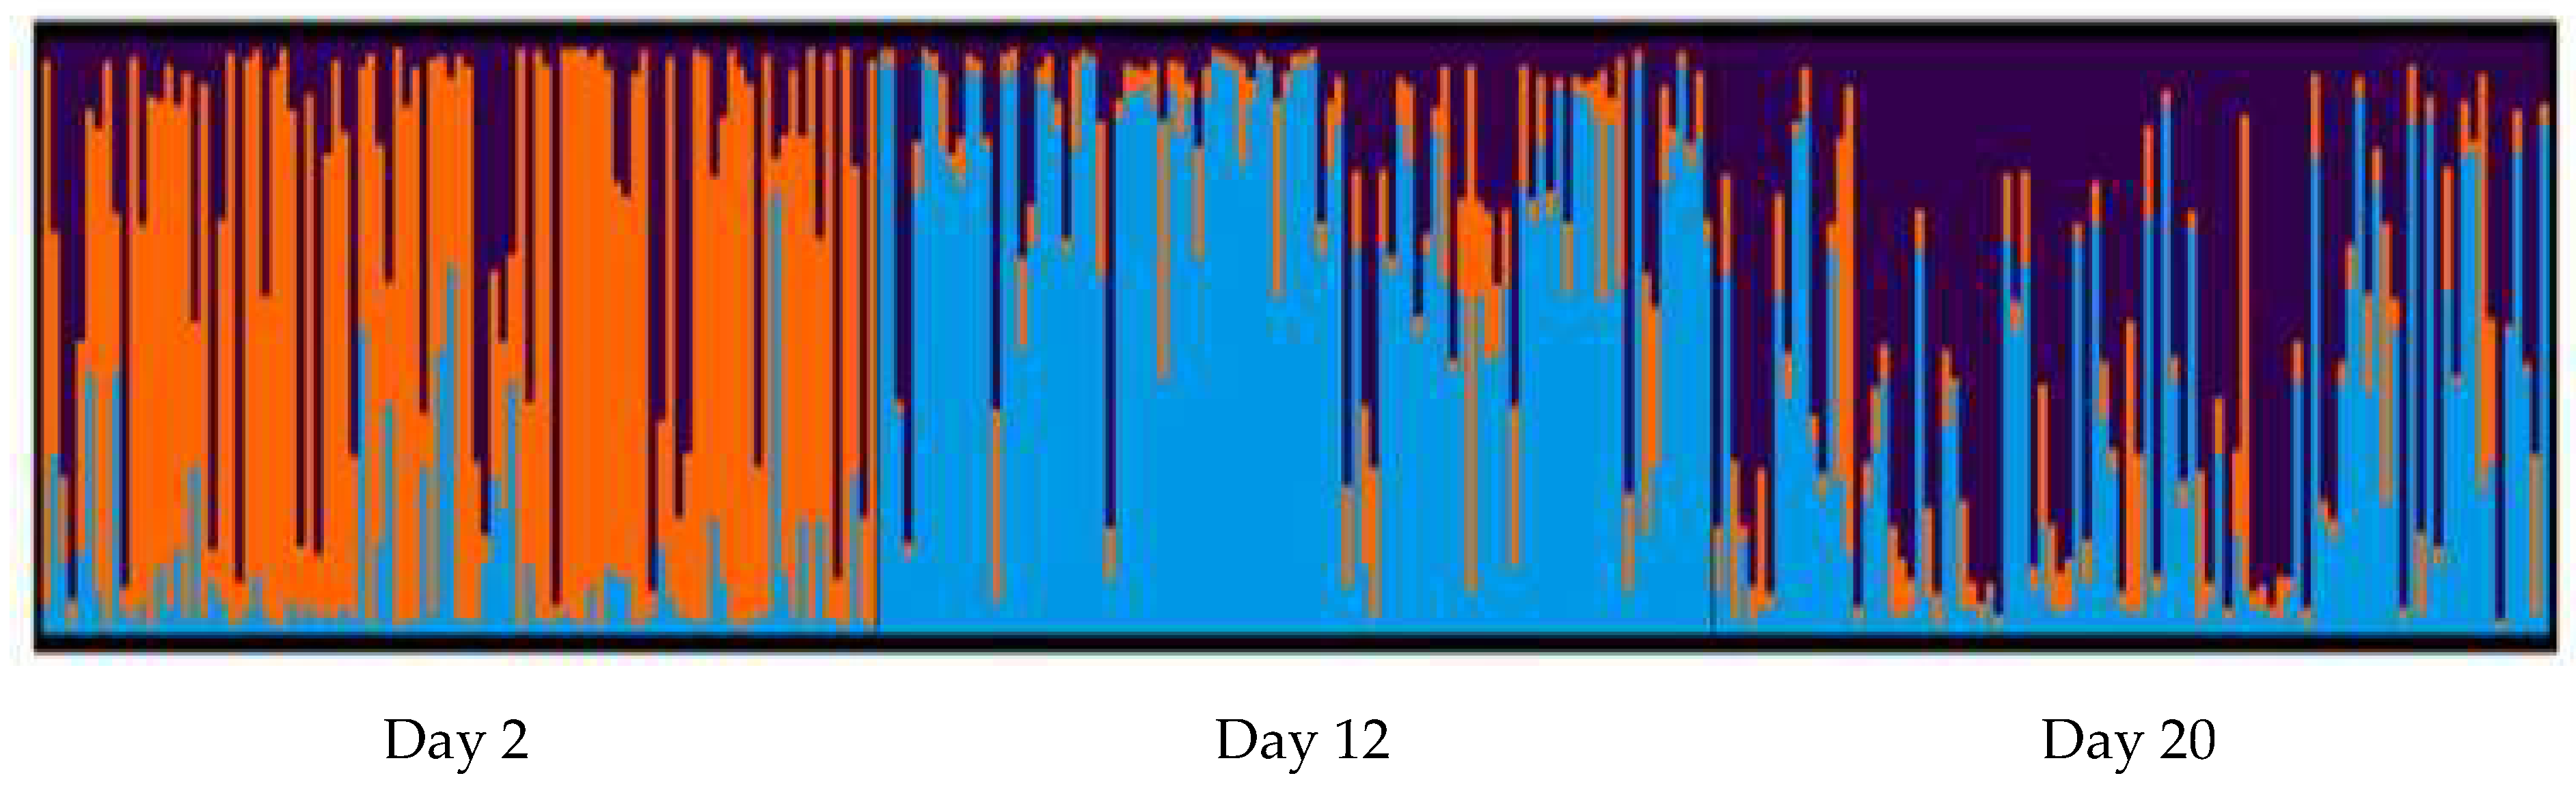
3.1. Genetic Diversity of Hatchery-Raised Larvae

No significant change was observed in genetic diversity as larvae moved through the hatchery rearing process. Mean number of alleles was not significantly different among sampled time points (Friedman Chi-squared = 1.78; df = 2; p = 0.411). Expected heterozygosity showed a similar pattern across the sampled time points with no significant difference detected (Friedman Chi-squared = 0.4; df = 2; p = 0.819). Similarly, no significant difference was seen in observed heterozygosity (Friedman Chi-squared = 3.6; df = 2; p = 0.165).
The global FST value indicated significant differentiation between larvae sampled at different time points in the hatchery rearing process (FST = 0.0434, p < 0.0001). Pairwise FST analysis revealed that this was driven by differences occurring between the Day 2 sampling period and the Day 12 and Day 20 sampling periods (Table 1). No significant genetic differentiation was observed between the Day 12 and Day 20 sampling periods (Table 1). A Bayesian STRUCTURE analyses identified three distinct genetic clusters corresponding to larvae sampled from each time point (Figure 1).
Estimates of relatedness among larvae within each time point also showed a significant trend of increasing relatedness through the hatchery rearing process (Figure 2, Table 2). Inbreeding coefficient values (FIS) were positive for time points Day 2 and Day 20, and negative for Day 12 (Table 2).

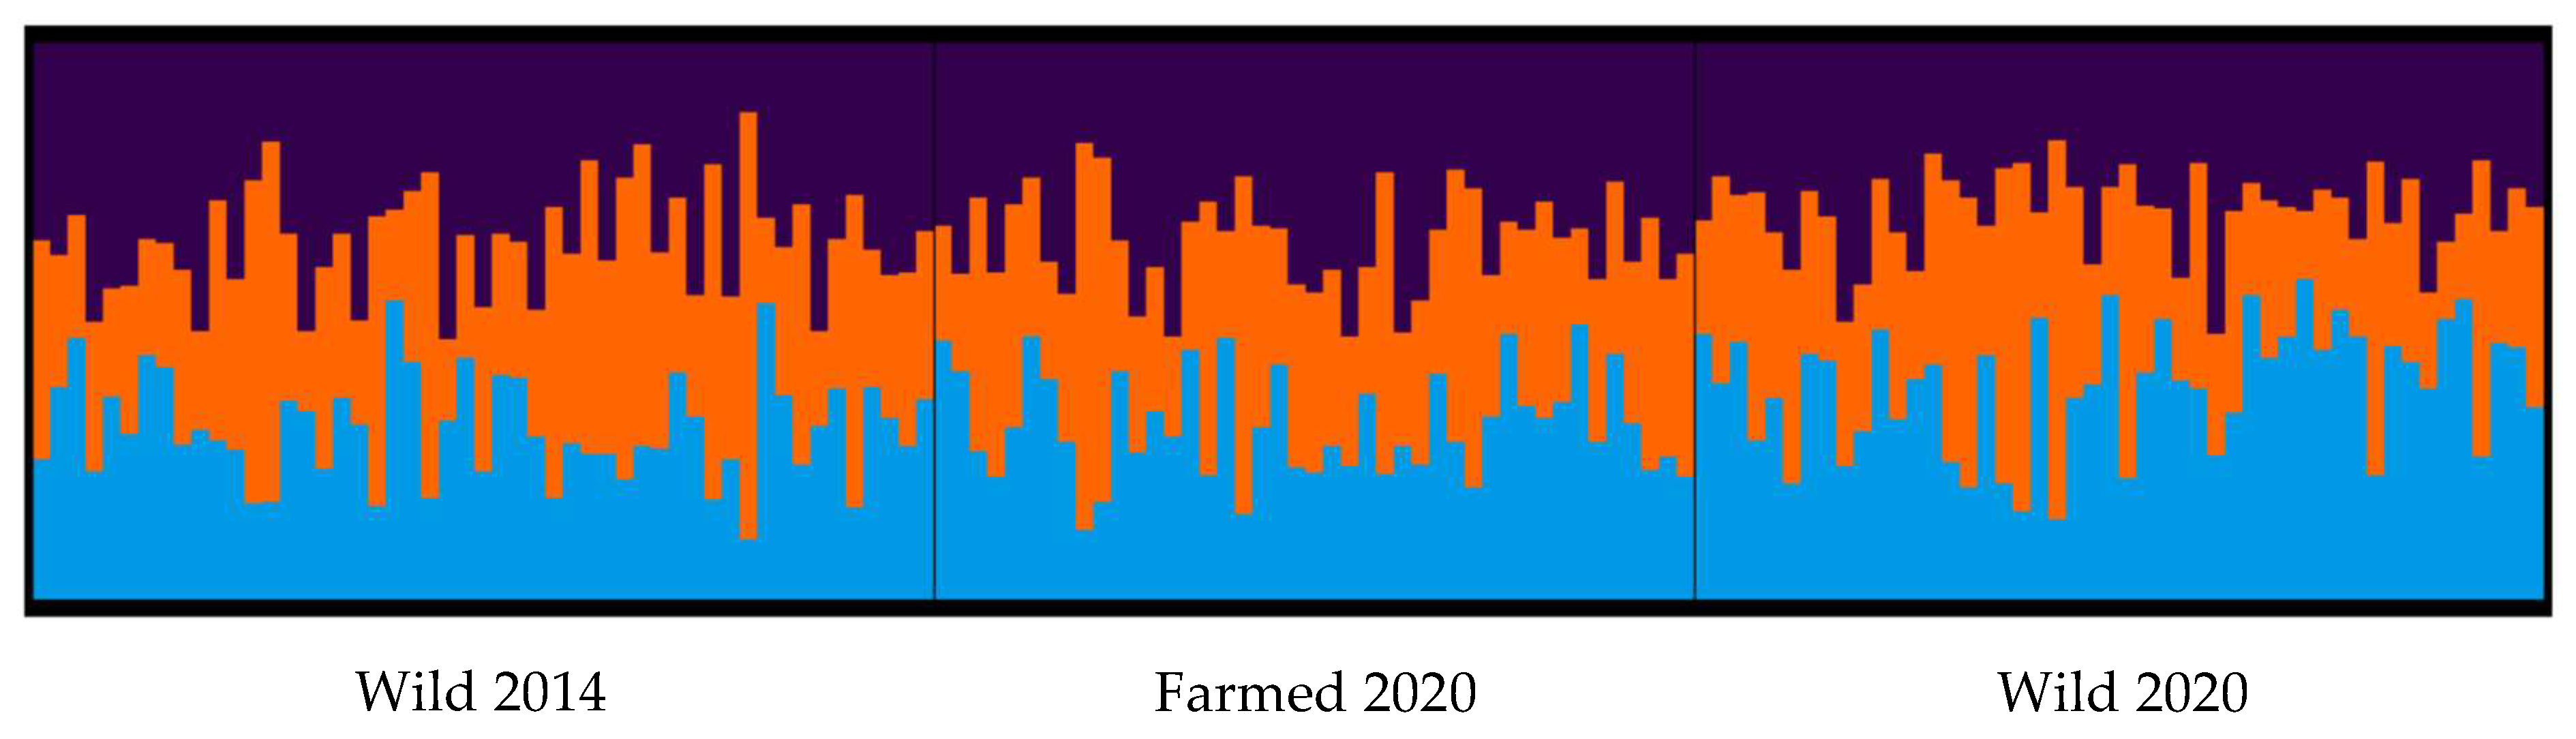
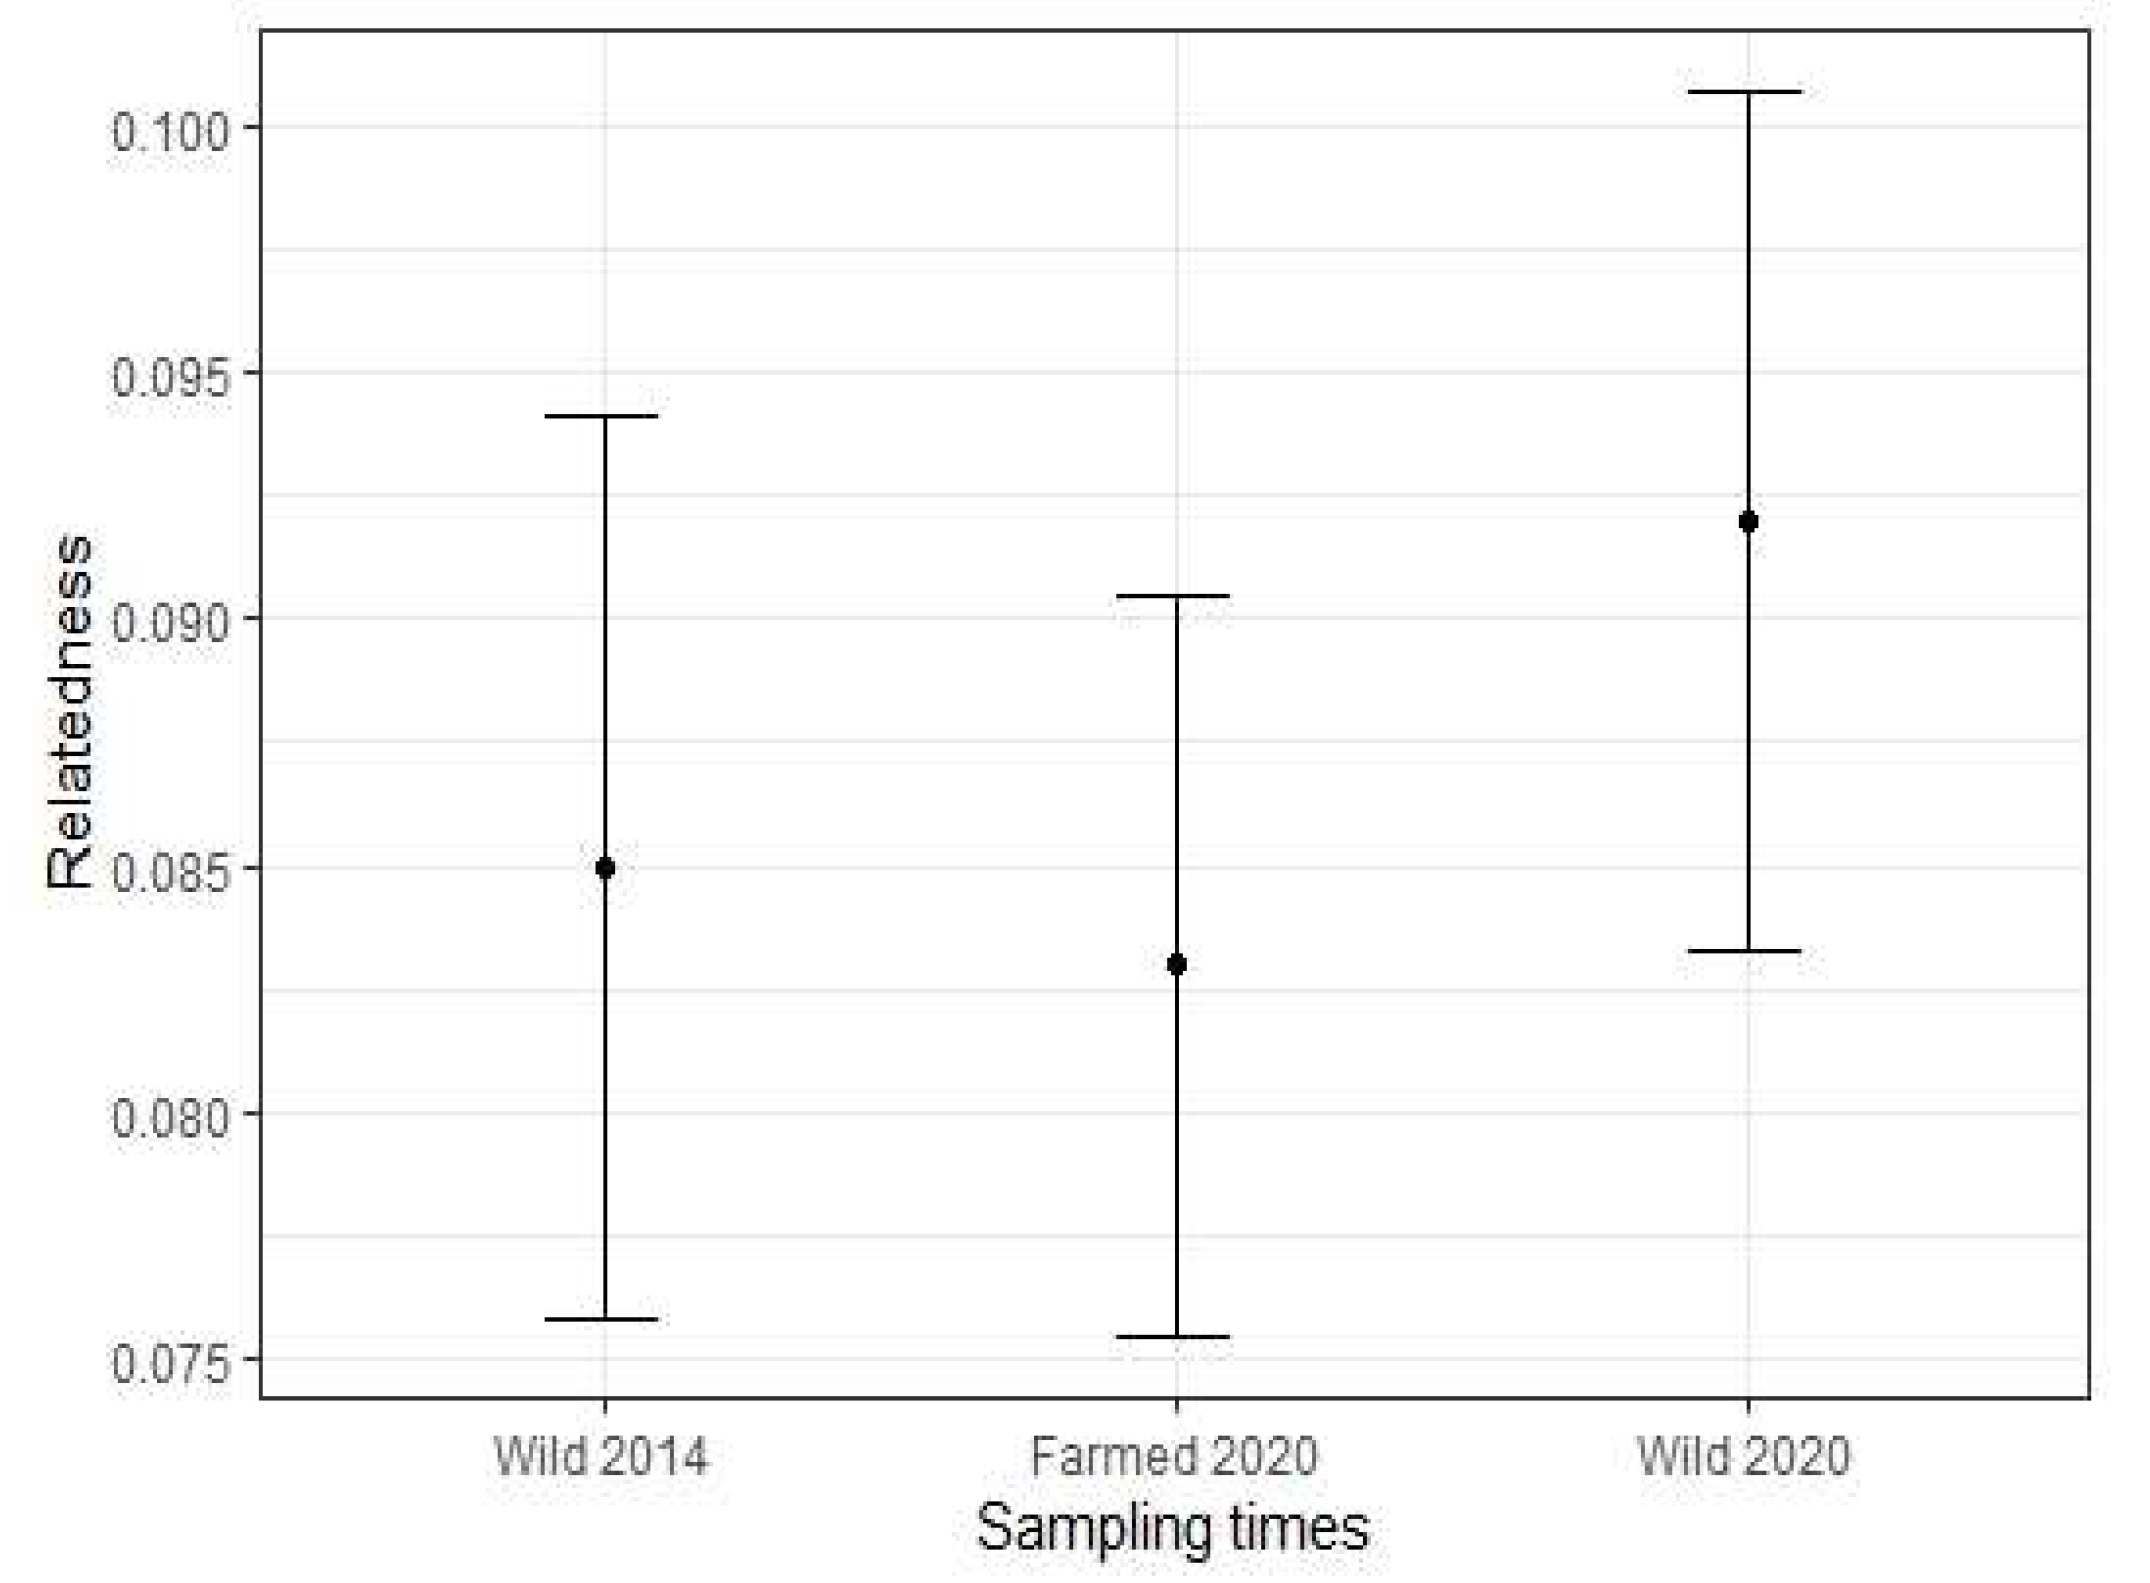
3.2. Genetic Diversity of Wild and Farmed Adult Mussel Populations

Estimates of genetic diversity including mean number of alleles (Friedman Chi-squared = 0.44; df = 2; p = 0.8) and expected heterozygosity (Friedman Chi-squared = 3.6; df = 2; p = 0.17) did not differ between sampled wild and farmed populations. However, a significant drop in observed heterozygosity was identified in the wild population (Friedman Chi-squared = 8.4; df = 2; p = 0.015).
Significant levels of genetic differentiation were detected (FST = 0.0290, p < 0.0001) between wild and farmed populations with all pairwise FST values being significantly different (Table 1). Bayesian STRUCTURE analysis of the adult populations identified three potential genetic clusters within the dataset (K = 3), however the structure plot did not indicate that these were strongly aligned with source populations (Figure 3).
Relatedness estimates among individuals within each population were low (R ranged from 0.083 to 0.092) and not significantly different between populations (Figure 4, Table 2). Inbreeding coefficient values (FIS) were positive for all adult populations (Table 2).

3.3. Genetic Diversity of Hatchery-Raised Larvae Compared to Adult Farmed and Wild Mussel Populations

Comparison of the wild and farmed populations with the hatchery-reared larvae showed that the hatchery larvae had significantly lower levels of expected heterozygosity (Friedman Chi-squared = 17.93; df = 5; p = 0.003) and mean number of alleles (Friedman Chi-squared = 17.93, p = 0.003) compared with the wild and farmed populations. The farmed and wild populations appear to have higher expected heterozygosity than the larvae (Friedman Chi-squared = 19.29; df = 5; p = 0.0017). Levels of observed heterozygosity showed a similar pattern to that seen for expected heterozygosity with the farmed and wild populations having a higher HO (Friedman Chi-squared = 12.31; df = 5; p = 0.031). Levels of genetic differentiation between larvae and adult populations were significantly different from zero (FST = 0.0782, p < 0.0001). Pairwise comparisons showed FST values being significantly different from zero between all populations (Table 1). Relatedness values of the farmed and wild populations were significantly lower than observed in larvae (Table 2).

4. Discussion

The results from this study show that larvae do not appear to lose significant levels of genetic diversity as they move through the hatchery rearing process, although selection does appear to be operating, resulting in increased relatedness among larvae. Larvae from the hatchery do appear to have lower levels of genetic diversity compared to wild and farmed adult populations of blue mussels; however, this does not appear to impact overall levels of genetic diversity and relatedness in wild and farmed adult populations. This is promising, as lower genetic diversity in adult populations can have potential fitness impacts, including increased susceptibility to pathogens such as viruses, parasites and cancer [42,43] as well as reduced reproductive success [44]. While these patterns are positive, further studies using more molecular markers would be necessary to confirm these results. The latest development of technologies (e.g., single cell sequencing) may be able to overcome the limitations of our study in which, due to a low amount of DNA, we could only use five microsatellite markers [45].
While no change in genetic diversity between time points was observed (indicating a high standing genetic variation at the start of larvae raising), the level of relatedness increased while moving through the rearing process. Interestingly, the inbreeding coefficient (FIS) drops from 0.350 for day 2 larvae to effectively zero for day 12 and day 20 larvae. This suggests a decrease in the heterozygous deficits detected at day 2, which may result from a decline in more homozygous larvae (family lineage). As it is a common practice for industries, including the Queenscliff Marine facility, to control their stock by selecting for desirable traits (e.g., size, growth rate), the observed increased relatedness may be the result of this selection process. This suggests that genetic drift and/or selection for familial linages may occur due to the artificial selection in the hatchery [46]. For example, while the industry is selecting for larger phenotypes, these may not have underlying genetic determinants, as such the genotypes are randomly selected (i.e., genetic drift). It could also be hypothesized that the larger phenotypes are due to particular genotypes that are favoured by the selection process (i.e., selection for familial linages).
Although selecting for phenotypic traits may be beneficial for the industry, in the long term, the practice could be detrimental if it reduces overall genetic diversity. Currently, the process appears beneficial as it achieves faster growing larvae (less production time) while retaining good levels of genetic diversity. If this practice is not well maintained, however, it could have negative impacts, including higher levels of inbreeding. The observed retention of genetic diversity demonstrates the importance of rotating and introducing a diversity of broodstock between different spawning runs, the practice applied at this hatchery. Despite rotating parents in some practices, however, inbreeding can still remain (or even increase) in mussel populations, as shown by [47]. The results showed similar patterns; however, this is not surprising given the many highly related individuals retained within the initial spawned larvae. While relatedness continues to increase during the rearing process, the inbreeding coefficient drops. This suggests that there is a selection for increased heterozygosity among larvae, which is known to have fitness benefits [48] and could be beneficial for both the hatchery and wild populations.
Comparison of wild and farmed adults provided no evidence that farming practices would result in a decline in genetic diversity of farmed mussels, and minimal evidence they are genetically swamping local natural populations. This was surprising as in many other bivalve species, including silver lipped pearl oysters (Pinctada maxima), eastern oyster (C. virginica), pacific oyster (C. gigas), Chinese freshwater pearl mussel (Hyriopsis cumingii) and the blue mussel (Mytilus edulis) at other locations, the artificial breeding process resulted in a significant decrease of genetic diversity (Ho, He and mean number of alleles) in the farmed populations when compared to natural ones [28,49,50,51,52]. Although the STRUCTURE analysis does not suggest any major genetic clusters relating to the populations, there is still weak (and significant) genetic differentiation based on the FST analysis but not enough for structure to distinguish different genetic clusters. This suggests that there is sufficient gene flow to prevent large amounts of genetic structuring. Levels of genetic diversity of farmed and wild populations appear high and this is likely resulting from the hatchery using a diverse set of broodstock that is changed between subsequent spawning. The use of different broodstock appears to maintain levels of diversity of the farmed mussels and there does not appear to be any evidence of genetic swamping in the wild populations. Interestingly, estimates of the inbreeding coefficient (FIS values) were higher in the natural compared to the farmed populations. In addition, when comparing the levels of heterozygosity of wild populations between 2014 and 2020, our results indicated a decline in heterozygotes in 2020 compared with 2014, potentially indicating loss of diversity in the wild populations, which may indicate some inbreeding in wild populations.
It is important to note that the farmed and wild populations reside in the same environment and hence could potentially exchange genetic materials. The observed genetic clustering in the STRUCTURE analyses and the significant level of genetic differentiation, however, suggests limited interbreeding between farmed and wild populations. Hatchery stocking can be beneficial and/or harmful for native populations. Breeding programs have been known to support the restoration of endangered species [53] and the release of some species into the wild has been seen to positively increase the number of spawning sites [54]. Unfortunately, the release of hatchery stock into the wild have also had negative effects, including but not limited to lower reproductive success, behavioural changes and higher vulnerability to predation [54]. Release of hatchery stock can also alter disease and parasite outcomes in wild populations, as well as cause hybridisation events. Farming involves a high density of individuals which can increase disease and parasite prevalence and risk, as seen in multiple salmonid species and their ectoparasites, sea lice [55]. The use of farmed populations placed in a wild environment has also been known to decrease disease prevalence if handled correctly [56]. For example, intensive oyster aquaculture (Crassostrea virginica) has been shown to reduce disease impacts by the protozoan parasite Perkinsus marinus on sympatric wild oysters [56].
The introduction of farmed animals into wild populations has been known to result in hybridisation [57], leading to genetic and phenotypic changes including epigenetic changes (DNA methylation) and the formation of maladaptive traits as seen in many salmonids [58,59,60] and mussels [57]. As mentioned above, limited or no gene flow was detected between the wild and farmed populations in our study. The presence of these independent clusters may be due to the geographic distance between farmed and natural populations within the bay, or that the time to harvest does not allow for the hatchery populations to complete a full spawning cycle, as they are usually harvested at this time [61,62].
The observed low relatedness levels in the adult populations are also confirmed by the high genetic diversity of both the farmed and the natural populations, as all three populations (wild and farmed) contained mainly unrelated individuals, which decreases the risk of adverse effects of inbreeding. Interestingly, the farmed populations had a lower inbreeding coefficient than the wild ones. This may be the result of the hatchery practice where new specimens are used in each induced spawning run, while spawning in wild populations occurs en masse. Mass spawning is unpredictable and can result in the domination of certain family lineages [13,52]. Induced spawning has been seen to improve reproductive success and decrease the risk of inbreeding and genetic bottleneck [13,52,63,64].

5. Management Implications and Conclusions

This study demonstrated the need for well-designed and carefully implemented mussel breeding programs to ensure that high levels of genetic diversity are maintained, and that genetic swamping of natural populations does not occur because of aquaculture practices. It is important to consider both the genetic implications of the larvae reared and how the farmed populations may interact and influence natural populations. The current evidence suggests that the larvae raising process at the hatchery where the study was conducted does not appear to have any associated negative effects on the natural populations or on stocks at the farms associated with their breeding program, as high levels of genetic diversity are maintained among their farmed mussels. The development of standardised breeding and rearing protocols is encouraged to ensure best practices that take into consideration the need to maintain high levels of genetic diversity of brood stocks, reared larvae and farmed adult populations. This not only provides increased resilience to future impacts such as climate change or the emergence of new pathogens, but also reduces the potential for adversely effecting and swamping natural populations. Further research should focus on investigating the effects of manual size selection and its effects on larvae phenotypic traits (growth rates, shell, and meat quality) in relation to their genotypes and genetic diversity.

Supplementary Materials

The following supporting information can be downloaded at: https://www.mdpi.com/article/10.3390/hydrobiology3010004/s1, Supplementary Table S1: A summary of all microsatellite markers used within this study. Markers were obtained from [25].

Author Contributions

Conceptualization, G.B., A.G.S., A.M.D., B.U. and C.D.H.S.; Methodology, G.B., A.G.S., A.M.D., K.W., B.A.I., S.J., B.U. and C.D.H.S.; Software, G.B. and A.M.D.; Validation, G.B., K.W., B.A.I., S.J., B.U. and C.D.H.S.; Formal Analysis, G.B., B.U. and C.D.H.S.; Investigation, G.B., B.U., C.D.H.S. and E.S.A.R.; Resources, F.T., K.W., B.A.I., S.J., B.U. and C.D.H.S.; Data Curation, G.B., B.U., C.D.H.S. and E.S.A.R.; Writing—Original Draft Preparation, G.B., B.U. and C.D.H.S.; Writing—Review and Editing, G.B., E.S.A.R., A.G.S., A.M.D., K.W., B.A.I., S.J., F.T., B.U. and C.D.H.S.; Visualization, G.B., B.U. and C.D.H.S.; Supervision, B.U., A.G.S. and C.D.H.S.; Project Administration, G.B., B.U. and C.D.H.S.; Funding Acquisition, B.U., C.D.H.S. and F.T. All authors have read and agreed to the published version of the manuscript.

Funding

This work was supported by an Ecological Society of Australia ‘Holsworth Wildlife Research Endowment’, a Deakin SEBE_RGS_2019, an ANR TRANSCAN (ANR-18-CE35-0009) and a CNRS ‘International Associated Laboratory Grant’.

Data Availability Statement

Data files have been uploaded as Supplementary Material.

Conflicts of Interest

The authors declare no conflicts of interest.

References

  1. Lehane, S. Fish for the Future: Aquaculture and Food Security; Future Directions International Pty Ltd.: Nedlands, Australia, 2013; Available online: www.futuredirections.org.au/publication/fish-for-the-future-aquaculture-andfoodsecurity (accessed on 1 March 2024).
  2. Fisheries, F. The State of World Fisheries and Aquaculture—Towards Blue Transformation; FAO: Rome, Italy, 2022. [Google Scholar]
  3. Wijsman, J.W.M.; Troost, K.; Fang, J.; Roncarati, A. Global Production of Marine Bivalves. Trends and Challenges. In Goods and Services of Marine Bivalves; Smaal, A.C., Ferreira, J.G., Grant, J., Petersen, J.K., Strand, Ø., Eds.; Springer International Publishing: Cham, Switzerland, 2019; pp. 7–26. [Google Scholar]
  4. Costelloe, T. Regional Report for Oceania; CMS: Bonn, Germany, 2022; Volume 682, p. 181. [Google Scholar]
  5. Boyd, C.E.; D’Abramo, L.R.; Glencross, B.D.; Huyben, D.C.; Juarez, L.M.; Lockwood, G.S.; McNevin, A.A.; Tacon, A.G.J.; Teletchea, F.; Tomasso, J.R., Jr.; et al. Achieving sustainable aquaculture: Historical and current perspectives and future needs and challenges. J. World Aquac. Soc. 2020, 51, 578–633. [Google Scholar] [CrossRef]
  6. Waples, R.S.; Hindar, K.; Hard, J.J. Genetic Risks Associated with Marine Aquaculture; U.S. Department of Commerce: Washington, DC, USA, 2012. [Google Scholar]
  7. Popovic, I.; Matias, A.M.A.; Bierne, N.; Riginos, C. Twin introductions by independent invader mussel lineages are both associated with recent admixture with a native congener in Australia. Evol. Appl. 2020, 13, 515–532. [Google Scholar] [CrossRef]
  8. Roodt-Wilding, R. Abalone ranching: A review on genetic considerations. Aquac. Res. 2007, 38, 1229–1241. [Google Scholar] [CrossRef]
  9. Zbawicka, M.; Wenne, R.; Dias, P.J.; Gardner, J.P.A. Combined threats to native smooth-shelled mussels (genus Mytilus) in Australia: Bioinvasions and hybridization. Zool. J. Linn. Soc. 2021, 194, 1194–1211. [Google Scholar] [CrossRef]
  10. Gjedrem, T.; Robinson, N.; Rye, M. The importance of selective breeding in aquaculture to meet future demands for animal protein: A review. Aquaculture 2012, 350–353, 117–129. [Google Scholar] [CrossRef]
  11. Argue, B.J.; Arce, S.M.; Lotz, J.M.; Moss, S.M. Selective breeding of Pacific white shrimp (Litopenaeus vannamei) for growth and resistance to Taura Syndrome Virus. Aquaculture 2002, 204, 447–460. [Google Scholar] [CrossRef]
  12. Moss, S.M.; Moss, D.R.; Arce, S.M.; Lightner, D.V.; Lotz, J.M. The role of selective breeding and biosecurity in the prevention of disease in penaeid shrimp aquaculture. J. Invertebr. Pathol. 2012, 110, 247–250. [Google Scholar] [CrossRef]
  13. Jaris, H.; Brown, D.S.; Proestou, D.A. Assessing the contribution of aquaculture and restoration to wild oyster populations in a Rhode Island coastal lagoon. Conserv. Genet. 2019, 20, 503–516. [Google Scholar] [CrossRef]
  14. Šegvić-Bubić, T.; Žužul, I.; Talijančić, I.; Ugrin, N.; Lepen Pleić, I.; Žuvić, L.; Stagličić, N.; Grubišić, L. Translocation and aquaculture impact on genetic diversity and composition of wild self-sustainable Ostrea edulis populations in the Adriatic sea. Front. Mar. Sci. 2020, 7, 84. [Google Scholar] [CrossRef]
  15. Taylor, E.; Fraser, D.J.; Minto, C.; Calvert, A.M.; Eddington, J.D.; Hutchings, J.A. Potential for domesticated–wild interbreeding to induce maladaptive phenology across multiple populations of wild Atlantic salmon (Salmo salar). Can. J. Fish. Aquat. Sci. 2010, 67, 1768–1775. [Google Scholar] [CrossRef]
  16. Heath, D.D.; Heath, J.W.; Bryden, C.A.; Johnson, R.M.; Fox, C.W. Rapid Evolution of Egg Size in Captive Salmon. Science 2003, 299, 1738. [Google Scholar] [CrossRef] [PubMed]
  17. Bramwell, G.; Schultz, A.G.; Jennings, G.; Nini, U.N.; Vanbeek, C.; Biro, P.A.; Beckmann, C.; Dujon, A.M.; Thomas, F.; Sherman, C.D. The effect of mitochondrial recombination on fertilization success in blue mussels. Sci. Total Environ. 2024, 913, 169491. [Google Scholar] [CrossRef] [PubMed]
  18. Larraín, M.A.; Díaz, N.F.; Lamas, C.; Uribe, C.; Jilberto, F.; Araneda, C. Heterologous microsatellite-based genetic diversity in blue mussel (Mytilus chilensis) and differentiation among localities in southern Chile. Lat. Am. J. Aquat. Res. 2015, 43, 998–1010. [Google Scholar] [CrossRef]
  19. Zbawicka, M.; Trucco, M.I.; Wenne, R. Single nucleotide polymorphisms in native South American Atlantic coast populations of smooth shelled mussels: Hybridization with invasive European Mytilus galloprovincialis. Genet. Sel. Evol. 2018, 50, 5. [Google Scholar] [CrossRef]
  20. ABARE. Australian Fisheries and Aquaculture Statistics 2018; ABARE: Canberra, Australia, 2019. [Google Scholar]
  21. Jahangard, S.; Williams, M.; Mercer, J.; Ab Rahim, E.; Ingram, B. A technical report on hatchery production of blue mussel Mytilus galloprovincialis at the Victoria Shellfish Hatchery (VSH), Queenscliff-2008. Fish. Vic. Tech. Rep. 2010, 112, 42. [Google Scholar]
  22. Beaumont, A.R. Genetic considerations in hatchery culture of bivalve shellfish. Recent Adv. Mar. Biotechnol. 2000, 4, 87–109. [Google Scholar]
  23. Pettersen, A.K.; Turchini, G.M.; Jahangard, S.; Ingram, B.A.; Sherman, C.D. Effects of different dietary microalgae on survival, growth, settlement and fatty acid composition of blue mussel (Mytilus galloprovincialis) larvae. Aquaculture 2010, 309, 115–124. [Google Scholar] [CrossRef]
  24. Sherman, C.D.; Ab Rahim, E.S.; Olsson, M.; Careau, V. The more pieces, the better the puzzle: Sperm concentration increases gametic compatibility. Ecol. Evol. 2015, 5, 4354–4364. [Google Scholar] [CrossRef]
  25. Nguyen, T.; Hayes, B.; Guthridge, K.; Ab Rahim, E.; Ingram, B. Use of a microsatellite-based pedigree in estimation of heritabilities for economic traits in Australian blue mussel, Mytilus galloprovincialis. J. Anim. Breed. Genet. 2011, 128, 482–490. [Google Scholar] [CrossRef]
  26. Lallias, D.; Stockdale, R.; Boudry, P.; Lapègue, S.; Beaumont, A.R. Characterization of ten microsatellite loci in the blue mussel Mytilus edulis. J. Shellfish Res. 2009, 28, 547–551. [Google Scholar] [CrossRef]
  27. Presa, P.; Pérez, M.; Pérez Diz, Á. Polymorphic microsatellite markers for blue mussels (Mytilus spp.). Conserv. Genet. 2002, 3, 441–443. [Google Scholar] [CrossRef]
  28. Li, J.; Wang, G.; Bai, Z. Genetic variability in four wild and two farmed stocks of the Chinese freshwater pearl mussel (Hyriopsis cumingii) estimated by microsatellite DNA markers. Aquaculture 2009, 287, 286–291. [Google Scholar] [CrossRef]
  29. Van Oosterhout, C.; Hutchinson, W.F.; Wills, D.P.M.; Shipley, P. micro-checker: Software for identifying and correcting genotyping errors in microsatellite data. Mol. Ecol. Notes 2004, 4, 535–538. [Google Scholar] [CrossRef]
  30. Rousset, F. genepop’007: A complete re-implementation of the genepop software for Windows and Linux. Mol. Ecol. Resour. 2008, 8, 103–106. [Google Scholar] [CrossRef] [PubMed]
  31. Excoffier, L.; Laval, G.; Schneider, S. Arlequin (version 3.0): An integrated software package for population genetics data analysis. Evol. Bioinform. 2005, 1, 117693430500100003. [Google Scholar] [CrossRef]
  32. Benjamini, Y.; Hochberg, Y. Controlling the false discovery rate: A practical and powerful approach to multiple testing. J. R. Stat. Soc. Ser. B 1995, 57, 289–300. [Google Scholar] [CrossRef]
  33. Morvezen, R.; Boudry, P.; Laroche, J.; Charrier, G. Stock enhancement or sea ranching? Insights from monitoring the genetic diversity, relatedness and effective population size in a seeded great scallop population (Pecten maximus). Heredity 2016, 117, 142–148. [Google Scholar] [CrossRef] [PubMed]
  34. Rizzo, M.L. Statistical Computing with R, 2nd, ed.; Chapman and Hall/CRC: New York, NY, USA, 2019. [Google Scholar]
  35. Weir, B.S.; Cockerham, C.C. Estimating F-statistics for the analysis of population structure. Evolution 1984, 38, 1358–1370. [Google Scholar]
  36. Pritchard, J.K.; Stephens, M.; Donnelly, P. Inference of population structure using multilocus genotype data. Genetics 2000, 155, 945–959. [Google Scholar] [CrossRef]
  37. Hubisz, M.J.; Falush, D.; Stephens, M.; Pritchard, J.K. Inferring weak population structure with the assistance of sample group information. Mol. Ecol. Resour. 2009, 9, 1322–1332. [Google Scholar] [CrossRef] [PubMed]
  38. Evanno, G.; Regnaut, S.; Goudet, J. Detecting the number of clusters of individuals using the software STRUCTURE: A simulation study. Mol. Ecol. 2005, 14, 2611–2620. [Google Scholar] [CrossRef] [PubMed]
  39. Earl, D.A.; vonHoldt, B.M. Structure harvester: A website and program for visualizing structure output and implementing the Evanno method. Conserv. Genet. Resour. 2012, 4, 359–361. [Google Scholar] [CrossRef]
  40. Wang, J. COANCESTRY: A program for simulating, estimating and analysing relatedness and inbreeding coefficients. Mol. Ecol. Resour. 2011, 11, 141–145. [Google Scholar] [CrossRef] [PubMed]
  41. Wang, J. Triadic IBD coefficients and applications to estimating pairwise relatedness. Genet. Res. 2007, 89, 135–153. [Google Scholar] [CrossRef]
  42. Hughes, A.R.; Inouye, B.D.; Johnson, M.T.J.; Underwood, N.; Vellend, M. Ecological consequences of genetic diversity. Ecol. Lett. 2008, 11, 609–623. [Google Scholar] [CrossRef]
  43. Ujvari, B.; Klaassen, M.; Raven, N.; Russell, T.; Vittecoq, M.; Hamede, R.; Thomas, F.; Madsen, T. Genetic diversity, inbreeding and cancer. Proc. R. Soc. B Biol. Sci. 2018, 285, 20172589. [Google Scholar] [CrossRef]
  44. de Boer, R.A.; Eens, M.; Müller, W. Sex-specific effects of inbreeding on reproductive senescence. Proc. R. Soc. B Biol. Sci. 2018, 285, 20180231. [Google Scholar] [CrossRef]
  45. Sumida, T.S.; Hafler, D.A. Population genetics meets single-cell sequencing. Science 2022, 376, 134–135. [Google Scholar] [CrossRef]
  46. Gwak, W.; Nakayama, K. Genetic variation of hatchery and wild stocks of the pearl oyster Pinctada fucata martensii (Dunker, 1872), assessed by mitochondrial DNA analysis. Aquac. Int. 2011, 19, 585–591. [Google Scholar] [CrossRef]
  47. Fang, J.; Han, Z.; Li, Q. Effect of inbreeding on performance and genetic parameters of growth and survival traits in the Pacific oyster Crassostrea gigas at larval stage. Aquac. Rep. 2021, 19, 100590. [Google Scholar] [CrossRef]
  48. Turelli, M.; Ginzburg, L.R. Should individual fitness increase with heterozygosity? Genetics 1983, 104, 191–209. [Google Scholar] [CrossRef] [PubMed]
  49. Carlsson, J.; Morrison, C.L.; Reece, K.S. Wild and aquaculture populations of the eastern oyster compared using microsatellites. J. Hered. 2006, 97, 595–598. [Google Scholar] [CrossRef] [PubMed]
  50. Gurney-Smith, H.J.; Wade, A.J.; Abbott, C.L. Species composition and genetic diversity of farmed mussels in British Columbia, Canada. Aquaculture 2017, 466, 33–40. [Google Scholar] [CrossRef]
  51. Kochmann, J.; Carlsson, J.; Crowe, T.P.; Mariani, S. Genetic evidence for the uncoupling of local aquaculture activities and a population of an invasive species—A case study of Pacific oysters (Crassostrea gigas). J. Hered. 2012, 103, 661–671. [Google Scholar] [CrossRef]
  52. Lind, C.E.; Evans, B.S.; Knauer, J.; Taylor, J.J.; Jerry, D.R. Decreased genetic diversity and a reduced effective population size in cultured silver-lipped pearl oysters (Pinctada maxima). Aquaculture 2009, 286, 12–19. [Google Scholar] [CrossRef]
  53. Geist, J.; Bayerl, H.; Stoeckle, B.C.; Kuehn, R. Securing genetic integrity in freshwater pearl mussel propagation and captive breeding. Sci. Rep. 2021, 11, 16019. [Google Scholar] [CrossRef] [PubMed]
  54. Araki, H.; Schmid, C. Is hatchery stocking a help or harm?: Evidence, limitations and future directions in ecological and genetic surveys. Aquaculture 2010, 308, S2–S11. [Google Scholar] [CrossRef]
  55. Jansen, P.A.; Kristoffersen, A.B.; Viljugrein, H.; Jimenez, D.; Aldrin, M.; Stien, A. Sea lice as a density-dependent constraint to salmonid farming. Proc. R. Soc. B Biol. Sci. 2012, 279, 2330–2338. [Google Scholar] [CrossRef]
  56. Ben-Horin, T.; Burge, C.A.; Bushek, D.; Groner, M.L.; Proestou, D.A.; Huey, L.I.; Bidegain, G.; Carnegie, R.B. Intensive oyster aquaculture can reduce disease impacts on sympatric wild oysters. Aquac. Environ. Interact. 2018, 10, 557–567. [Google Scholar] [CrossRef]
  57. Michalek, K.; Ventura, A.; Sanders, T. Mytilus hybridisation and impact on aquaculture: A minireview. Mar. Genom. 2016, 27, 3–7. [Google Scholar] [CrossRef] [PubMed]
  58. Nilsson, E.; Sadler-Riggleman, I.; Beck, D.; Skinner, M.K. Differential DNA methylation in somatic and sperm cells of hatchery vs wild (natural-origin) steelhead trout populations. Environ. Epigenetics 2021, 7, dvab002. [Google Scholar] [CrossRef] [PubMed]
  59. Rodriguez Barreto, D.; Garcia de Leaniz, C.; Verspoor, E.; Sobolewska, H.; Coulson, M.; Consuegra, S. DNA methylation changes in the sperm of captive-reared fish: A route to epigenetic introgression in wild populations. Mol. Biol. Evol. 2019, 36, 2205–2211. [Google Scholar] [CrossRef] [PubMed]
  60. Schenekar, T.; Weiss, S. Selection and genetic drift in captive versus wild populations: An assessment of neutral and adaptive (MHC-linked) genetic variation in wild and hatchery brown trout (Salmo trutta) populations. Conserv. Genet. 2017, 18, 1011–1022. [Google Scholar] [CrossRef]
  61. Maine, U.O. Maine Seafood Guide—Mussels. Available online: https://seagrant.umaine.edu/maine-seafood-guide/mussels/ (accessed on 1 March 2024).
  62. Carroll, A. The Great Mussel and Clam Cookbook; R&R Publications Marketing Pty. Ltd.: Brunswick, Australia, 2004. [Google Scholar]
  63. Schagerström, E.; Christophersen, G.; Sunde, J.; Bakke, S.; Matusse, N.R.; Dupont, S.; Sundell, K.S. Controlled spawning and rearing of the sea cucumber, Parastichopus tremulus. J. World Aquac. Soc. 2022, 53, 224–240. [Google Scholar] [CrossRef]
  64. Smith, T.I.; Denson, M.R. Controlled spawning of Southern flounder Paralichthys lethostigma: Issues and progress. In Spawning and Maturation of Aquaculture Species, Proceedings of the 28th US-Japan Natural Resources Aquaculture Panel, Kihei, HI, USA, 10–12 November 1999; South Carolina Department of Natural Resources: Charleston, SC, USA, 10–12 November 2000. [Google Scholar]
Figure 1. The population genetic STRUCTURE analysis of the three larval sampling time periods (Day 2, Day 12 and Day 20) of Australian blue mussels (Mytilus spp.). Each vertical line represents a single individual and colours indicate deferred ancestry. Bar plot of K = 3, which is the most probable value based on deltaK methods. Image from CLUMPAK Server.
Hydrobiology 03 00004 g001
Figure 2. Levels of relatedness among blue mussel larvae (Mytilus spp.) reared from three time points in the hatchery rearing process. Error bars represent 95% confidence interval. N = 96 at each time point.
Hydrobiology 03 00004 g002
Figure 3. The population genetic STRUCTURE analysis of three adult Australian blue mussels (Mytilus spp.) (Wild 2014, Farmed 2020, Wild 2020). Each vertical line represents a single individual and colours indicate deferred ancestry. Bar plot of K = 3, which is the most probable value based on deltaK methods. Image from CLUMPAK Server.
Hydrobiology 03 00004 g003
Figure 4. Relatedness tests of adult blue mussel (Mytilus spp.) populations. Error bars represent 95% confidence interval. N = 96 at each time point.
Hydrobiology 03 00004 g004
Table 1. Pairwise FST between mussel larvae sampled at different times in the hatchery rearing process and adult populations. Significance is indicated as ** p < 0.01, *** p < 0.0001.
Larvae
Day 2
Larvae
Day 12
Larvae
Day 20
Wild 2014Farmed 2020Wild 2020
Larvae Day 20.000
Larvae Day 120.053 ***0.000
Larvae Day 200.055 ***0.0000.000
Wild 20140.100 ***0.111 ***0.108 ***0.000
Farmed 20200.123 ***0.112 ***0.122 ***0.023 ***0.000
Wild 20200.130 ***0.105 ***0.095 ***0.040 ***0.026 **0.000
Table 2. Summary of genetic diversity measures for larvae and adult mussels collected within this study. N = sample size, A x = mean number of alleles, HO = observed heterozygosity, HE = expected heterozygosity, FIS = inbreeding coefficient. * indicates significant difference at 95% confidence.
N A x HOHEFISRelatedness
Larvae Day 2966.5000.3980.6130.3500.126 *
Larvae Day 12965.8330.6070.597−0.0350.155 *
Larvae Day 20965.5000.5500.5810.0130.179 *
Wild 2014529.5000.6090.7080.1460.085
Farmed 2020429.6670.6570.7610.1240.083
Wild 20204710.8000.4890.7540.3460.092
Disclaimer/Publisher’s Note: The statements, opinions and data contained in all publications are solely those of the individual author(s) and contributor(s) and not of MDPI and/or the editor(s). MDPI and/or the editor(s) disclaim responsibility for any injury to people or property resulting from any ideas, methods, instructions or products referred to in the content.

