
Effect of pH on Photosynthesis of Euglena mutabilis Schmitz, an Acidophilic Benthic Flagellate


Faculty of Environmental Engineering, The University of Kitakyushu, Kitakyushu 808-0135, Japan
*
Author to whom correspondence should be addressed.
Hydrobiology 2022, 1(1), 2-9; https://doi.org/10.3390/hydrobiology1010002
Submission received: 10 September 2021
/
Revised: 27 September 2021
/
Accepted: 1 October 2021
/
Published: 5 October 2021
Abstract
:The dependence of the photosynthetic rate of Euglena mutabilis Schmitz on pH across a range of 2.0–10.0 was investigated. Populations of E. mutabilis isolated from sediments of acidic mine drainage in Sensui (pH = 3.95) and a volcanic cold spring in Bougatsuru (pH = 5.32) were cultured in a pH-adjusted growth media for 96 h, and photosynthetic rate and dark respiration rate were measured. The maximum gross photosynthetic rate of E. mutabilis cells from the Sensui drainage population did not vary significantly over the pH range of 2.0–7.0, and their dark respiration rate showed high values at pH = 7.0. The maximum gross photosynthetic rate of E. mutabilis cells from the Bougatsuru spring population did not vary significantly within the pH range of 2.0–6.0, and their dark respiration rate tended to show high values at pH = 7.0. E. mutabilis can colonize under circumneutral conditions up to and including pH = 6.0.
1. Introduction
The flagellate Euglena mutabilis Schmitz is distributed in acidic drainage water streams of coal or metal mining sites [1]. Mine drainage with the colonization of E. mutabilis is usually characterized by a low pH and high concentrations of heavy metals and sulfate, and E. mutabilis can tolerate these conditions [2]. Hargreaves and Whitton [3] reported that the maximum growth of E. mutabilis, evaluated by the chlorophyll concentration, occurs at pH 2.0, and that the growth rate significantly decreases at pH < 2.0. The growth rate was almost constant within the pH range of 2.0–5.0 and decreased at pH 6.0–7.0. However, the growth rate at pH 7.0 was approximately 50% of the rate at pH 2.0. Nakatsu and Hutchinson [4] reported that the E. mutabilis population growth in the pH range of 3.0–6.0 had a maximum growth rate at pH 4.0, and had a limited growth at pH = 2.0. Olaveson and Stokes [5] investigated the population growth of E. mutabilis in the pH range of 1.5–9.0 and found intensive growth at pH < 5.5, with maximum growth at pH 3–4. Olaveson and Nalewajko [6] investigated growth within the pH range of 1.5–9.0 and showed constant growth rates between pH 2.5–6.0, with limited growth at pH 2.0 and 7.0 and total inhibition of growth at pH 8.0. These studies demonstrated that the growth of E. mutabilis was inhibited at pH > 6.0, whereas the optimum pH for population growth was between 2.0 and 4.0. However, the physiological requirement of E. mutabilis for growth along the pH gradient of the environment have not been fully reported.
The objective of the present study was to clarify the optimal pH for photosynthesis of E. mutabilis. We hypothesized that the maximum photosynthetic rate of E. mutabilis is obtained under highly acidic conditions, within a pH range of 2.0–4.0, and that the photosynthetic activity is inhibited at pH > 5.0. Understanding the short-term response of the photosynthetic activity to pH clarifies the physiological requirements of E. mutabilis for the colonization of natural habitats and the results are useful for determining the optimal culturing condition of the species.
2. Materials and Methods
2.1. Collection and Isolation of E. mutabilis
E. mutabilis, used for culturing and measurements of photosynthesis, were isolated from coal mine drainage in Sensui, Kurate, Fukuoka, southwestern Japan (33.78264° N, 130.65363° E, 16 m a.s.l.: Sensui drainage population) and from volcanic cold spring water in Bougatsuru, Oita, southwestern Japan (33.09602° N, 131.25940° E, 1238 m a.s.l.: Bougatsuru spring population). The samples, collected from the surface of sediments in the Sensui drainage on 2 February 2017 and Bougatsuru spring on 20 October 2016, were predominated by E. mutabilis. Water chemistry at the sampling sites was determined by the method appearing in Yanagawa et al. [7] and chemical variables at the sample collection are summarized in Table 1. The benthic Euglena cells in Sensui and Bougatsuru were identified as Euglena mutabilis Schmitz by the sequences of chloroplast SSU (16S) rRNA gene (accession numbers: LC613032, LC613033) and nuclear SSU (18S) rRNA gene (accession numbers: LC613035, LC613036) [7].
The samples contained both water and suspended sediment materials, from which the E. mutabilis population was carefully selected. Bottles with the E. mutabilis biofilms and sediments collected from mine drainage or volcanic spring were stirred lightly, and the sediment was allowed to precipitate. E. mutabilis in the resulting supernatant was used for culture. The purification of the E. mutabilis population followed the method of Zheng and Haraguchi [8]. After removal of visible contaminants by a needle, the supernatant containing E. mutabilis was cultured in Hoagland solution without ammonium, and then transferred to an ammonium-sulfate-enriched Hoagland solution (containing 1000 mg L−1 ammonium sulfate). After centrifugation at 600 rpm for 10 min, E. mutabilis cells without other microscopic visible species were precipitated. The E. mutabilis cells were transferred to sterile plastic Petri dishes (4.0 cm diameter, 1.0 cm depth) containing 20 mL of ammonium-sulfate-enriched Hoagland solution (pH = 3.07). The cells were cultured under illumination of photosynthetic photon flux density (PPFD) = 185 μmol s−1 m−2 in a growth chamber (25 °C) with stirring at 65 rpm for 18 days, and the culture medium containing E. mutabilis was used for experiments. No visible contamination by other species was observed by microscopic observation in the culture solution used for the experiments.
2.2. Photosynthesis Measurement
Ammonium-sulfate-enriched Hoagland solution was used as the growth media for photosynthesis measurements, and the pH was adjusted to 2.0, 3.0, 4.0, 5.0, 6.0, 7.0, 8.0, 9.0, and 10.0 by the addition of 0.1 N H2SO4 and/or 0.1 N NaOH solutions. A buffer solution was not used for adjusting the pH to avoid any effects the buffer compounds may have had on the physiological properties of E. mutabilis. Cell density was determined by counting the total number of cells in 20 μL of growth media using an upright light microscope (Nikon ECLIPSE 80i, Tokyo, Japan). The growth media was centrifuged at 600 rpm for 10 min, and 3.0 mL of ammonium-sulfate-enriched Hoagland solution was added. Initial cell densities of E. mutabilis were 2.19 ± 0.89 × 10⁵ individuals mL−1 for Sensui drainage population and 8.72 ± 0.46 × 10⁵ individuals mL−1 for Bougatsuru spring population. The pH was then adjusted to the respective values. Cultures were placed in a growth chamber at 25 °C and incubated under constant illumination (PPFD = 185 μmol m−2 s−1). Four tubes of each pH treatment were prepared, and the photosynthetic and respiration rates were measured at 0, 48, 72, and 96 h after pH adjustment of the culture solution using one tube of each pH treatment at each measurement time. The culture medium was adjusted to the initial pH (±0.02) just before each photosynthesis measurement. The population density of E. mutabilis was determined both before and after each pH adjustment.
Photosynthesis and respiration rates were determined by measuring the rate of change of the dissolved oxygen (DO) concentration in the medium using a DO probe (Oxygraph, Hansatech, Germany) at 25 °C. E. mutabilis cultures prepared as described above were irradiated using LED lamps at a maximum PPFD of 1080 μmol m−2 s−1. The oxygen exchange rate was measured by the light step of percentage of the maximum PPFD of an irradiation lamp for 1 min for each light step, including dark acclimation for 1 min between irradiation steps: 0, 2, 0, 4, 0, 6, 0, 8, 0, 10, 0, 20, 0, 40, 0, 60, 0, 80, 0, 100 (% of maximum PPFD). Photosynthesis and dark respiration rates were measured by the change in DO concentration after reaching a constant rate of DO change.
Eight cultures from the Sensui drainage population and six cultures from the Bougatsuru spring population in the pH range of 2.0–10.0 were used for photosynthesis measurements. The nonrectangular hyperbola model proposed by Marshall and Biscoe [9] was used for the fitting of the photosynthetic response curves:
where Ps is the net O2 production rate (μmol O2 mL−1 s−1), I is the light intensity (measured as PPFD, μmol photon m−2 s−1), Rd is the dark respiration rate (expressed as O2 absorption, μmol O2 mL−1 s−1), Pmax is the light-saturated rate of gross photosynthesis (net rate of O2 production plus dark respiration, μmol O2 mL−1 s−1), and θ and α are constants determining curvature at the shoulder and initial slope at zero irradiance of the light–photosynthetic rate relationship curve, respectively.
θPs2 − (Pmax + αI − θRd) Ps + αI (Pmax − (1 − θ) Rd) − RdPs = 0
Photosynthetic response curves were analyzed by regression using the nonrectangular hyperbola model, and only those which were statistically significant (p < 0.05) were selected. Significant differences between the mean values of Pmax and Rd for the different pH conditions were tested with the Kruskal–Wallis test (R software, version 4.0.4, R Development Core Team, Vienna, Austria, 2021). If the differences were significant by the Kruskal–Wallis test, a multiple comparison test was performed using Mann–Whitney’s U-test with Bonferroni correction.
2.3. Statistical Analysis
The gross photosynthetic rate at the light-saturation point and dark respiration rate were estimated by the regression of photosynthetic response curves using the nonrectangular hyperbola equation, and only the regressions that showed statistical significance (p < 0.05) were used for further analysis. Significant differences between the mean values of photosynthesis and respiration rates for the different pH cultures were tested using the Kruskal–Wallis test, and Mann–Whitney’s U-test with Bonferroni correction was used for multiple comparisons. Only a small number of photosynthetic response curves were significant at pH 8.0, 9.0, and 10.0; statistical tests were then performed on response curves collected at pH 2.0–7.0.
3. Results
The culture density of E. mutabilis before every photosynthesis measurement relative to the initial density is presented in Figure 1. The density of E. mutabilis from Sensui drainage significantly decreased at pH = 7.0, 8.0, 9.0, and 10.0 over the 96 h of culture experiment, whereas the cell density measured at pH = 2.0, 3.0, 4.0, 5.0, and 6.0 did not show significant change (Figure 1a). The cultures obtained at pH = 8.0, 9.0, and 10.0 showed nearly zero cells. E. mutabilis cells without chlorophyll (white-colored cells) were found in culture solutions with pH > 7.0 after 48 h of culture. Preliminary experiments demonstrated that the population densities at pH = 2.0–6.0 remained almost constant until 288 h following inoculation (data not shown). The population density of E. mutabilis cultured at pH = 7.0 significantly decreased to approximately 25% over 96 h.
The population density of E. mutabilis of the Bougatsuru spring population significantly increased at pH = 2.0, 3.0, 4.0, 5.0, and 6.0, whereas the population density cultured at pH = 7.0, 8.0, 9.0, and 10.0 significantly decreased during 96 h of culture (Figure 1b).
Changes in culture solution pH during the photosynthesis measurements were within 0.1, except the treatment at pH = 6.0, which showed a change of <0.4. The regression of photosynthetic response curves using the nonrectangular hyperbola model showed little significance for the treatments with pH = 8.0, 9.0, and 10.0; further statistical tests were performed for treatments within the pH range of 2.0–7.0. The maximum gross photosynthetic rate of E. mutabilis of the Sensui drainage population at the light-saturation point within the pH range of 2.0–7.0 showed no significant differences throughout the culturing period, excepting the significant difference between pH = 5.0 and 7.0 at 0 h (Figure 2). The dark respiration rate of E. mutabilis of the Sensui drainage population at 0 h following culture inoculation showed no significant differences among pH classes of culture solutions, whereas the dark respiration rate at pH = 7.0 was significantly higher than those at pH = 2.0 and 5.0 (48 h) and at pH = 2.0 and 3.0 (72 h and 96 h) (Figure 2). The maximum gross photosynthetic rate of E. mutabilis of the Bougatsuru spring population at the light-saturation point within the pH range of 2.0–6.0 showed no significant differences throughout the culturing period (Figure 3). The dark respiration rate of E. mutabilis of the Bougatsuru spring population at 0–72 h following culture inoculation showed no significant differences among pH classes of culture solutions, whereas the dark respiration rate at pH = 7.0 was significantly higher than those at pH = 2.0 at 96 h following culture inoculation (Figure 3).
4. Discussion
In the present study, the gross photosynthetic rate of E. mutabilis showed no significant differences within the pH range of 2.0–7.0 for the Sensui drainage population and within the pH range of 2.0–6.0 for the Bougatsuru spring population during the 48–96-h incubation (Figure 1 and Figure 2). Colman and Balkos [10] reported that E. mutabilis cultured at pH 3.5 and 6.8 showed no significant differences in the maximum O2 production rate at pH 7.5. This result was similar to the present measurements, wherein E. mutabilis photosynthetic activity remained high up to a pH of 7.0. The highest pH of culture solution at which E. mutabilis population retains photosynthetic capacity was 1 unit pH lower for the Bougatsuru spring population than the Sensui drainage population. The habitat pH of the Bougatsuru spring was ca. 1.4 pH unit higher than the habitat of Sensui drainage, implying the habitat pH is not the determinant factor of the pH range of E. mutabilis population retaining photosynthetic activity.
Although photosynthetic data at pH < 2.0 were not available in our study, the photosynthetic rate at pH = 2.0 was comparable to the rate at pH = 3.0–4.0, demonstrating that E. mutabilis is tolerant of extremely acidic conditions by preserving photosynthetic activity. The lower pH limit of E. mutabilis habitats reported by Geller et al. [11] is 0.5–2.6 in Volcan Copahue, Argentina (distribution not shown). Other examples of the low-pH tolerance of E. mutabilis include pH 1.5–3.0 reported by Hargreaves et al. [12] in coal mining sites in England; pH 1.5–2.5 in the Río Tinto river in southwestern Spain [13]; and pH 1.8–3.6 in tundra ponds in the Smoking Hills, Northwest Territories, Canada [14]. These studies demonstrated that E. mutabilis is not dominant in extremely acidic streams (pH < 2.0) but is stable in highly acidic habitats (pH 2.0–4.0). The upper pH limit was reported to be 3.1–4.6 by Brake et al. [1] in a Green Valley coal mining site in Indiana, USA, and 2.5–4.7 by Casiot et al. [2] in acidic mine drainage in Carnoulès, France. Bray et al. [15] reported that E. mutabilis can be found at a pH range of 2.7–6.5 (data not shown) in the Southern Island of New Zealand, whereas Baffico [16] showed that E. mutabilis is distributed within a range of pH = 2.0–3.5 and does not extend to areas with a pH > 5.0 in natural acidic streams in Patagonia. Baffico [16] also reported that E. mutabilis colonized at pH > 3.0; however, besides E. mutabilis, filamentous green algae or other competitors dominated in the algal community.
The photosynthetic activity of E. mutabilis within the pH range of 2.0–7.0 for the Sensui drainage population and the range of 2.0–6.0 for the Bougatsuru spring population explain the reported distribution range of its natural populations. E. mutabilis has also been found in Sphagnum plants [17,18]. We have obtained E. mutabilis from Sphagnum capillifolium, S. palustre, and S. fimbriatum plants in several mires in Japan and the pH of water extracted from the Sphagnum plants ranged 3.1–4.4 (n = 28; Haraguchi, unpublished data). Although E. mutabilis has been reported to prefer highly acidic habitats, it was found in the present study, even in the circumneutral water from hot spring drainage (Nagayu, pH = 7.73; Haraguchi unpublished data). The distribution sites of E. mutabilis suggest that it is well adapted to circumneutral, as well as acidic environments. Lane and Burris [19] showed that internal pH of E. mutabilis cells remains constant within the environmental pH range between 2.8 and 6.2 (initial setting), whereas internal pH increases when environmental pH exceeds 7.0. The constant internal pH of E. mutabilis cells up to a circumneutral environment would relate to retaining a constant photosynthetic rate up to ca. pH 6.0. The dark respiration rates of E. mutabilis cells sometimes show extremely high values when cultured above pH 7.0, although the rate was not always significantly different from the rate at pH < 6.0 (Figure 2). A high standard error of dark respiration rates was also obtained at pH > 7.0, revealing a high variability of respiration activity between cells. Populations of E. mutabilis in circumneutral streams may be selected from such a high-variability population, which may include greater physiological adaptations for circumneutral environments. The decrease in population density of E. mutabilis cells at pH = 7.0 would be due to the excess dark respiration rate at pH > 7.0, although photosynthetic rate was kept constant up to pH = 7.0.
Our hypothesis that the maximum photosynthetic rate of E. mutabilis is obtained under conditions of high acidity, within a pH range of 2.0–4.0, has been rejected. In conclusion, the experiments show that low pH is not required for the colonization of E. mutabilis, and they suggest that E. mutabilis can colonize circumneutral streams. The photosynthetic activity of E. mutabilis is stable within the range of at least pH = 2.0–6.0. There are few competitors under low pH conditions; hence, E. mutabilis maintains a stable population in highly acidic natural environments.
Author Contributions
Conceptualization, A.H.; methodology, A.H.; validation, A.H. and J.Z.; formal analysis, A.H. and J.Z.; investigation, A.H. and J.Z.; resources, A.H. and J.Z.; data curation, A.H. and J.Z.; writing—original draft preparation, A.H.; writing—review and editing, A.H.; visualization, A.H.; funding acquisition, A.H. All authors have read and agreed to the published version of the manuscript.
Funding
This work was partly funded by JSPS (Japan Society for the Promotion of Science; 16K07784).
Institutional Review Board Statement
Not applicable.
Informed Consent Statement
Not applicable.
Data Availability Statement
Data are contained within the article.
Acknowledgments
We thank the member of the Faculty of Environmental Engineering, The University of Kitakyushu for supporting the investigation. We also thank two anonymous reviewers for their helpful comments on this paper.
Conflicts of Interest
The authors declare no conflict of interest.
References
- Brake, S.S.; Dannelly, H.K.; Connors, K.A.; Hasiotis, S.T. Influence of water chemistry on the distribution of an acidophilic protozoan in an acid mine drainage system at the abandoned Green Valley coal mine, Indiana, USA. Appl. Geochem. 2001, 16, 1641–1652. [Google Scholar] [CrossRef]
- Casiot, C.; Bruneel, O.; Personné, J.-C.; Leblanc, M.; Elbaz-Poulichet, F. Arsenic oxidation and bioaccumulation by the aci-dophilic protozoan, Euglena mutabilis, in acid mine drainage (Carnoulès, France). Sci. Total. Environ. 2004, 320, 259–267. [Google Scholar] [CrossRef] [PubMed]
- Hargreaves, J.W.; Whitton, B.A. Effect of pH on growth of acid stream algae. Br. Phycol. J. 1976, 11, 215–223. [Google Scholar] [CrossRef] [Green Version]
- Nakatsu, C.; Hutchinson, T.C. Extreme metal and acid tolerance of Euglena mutabilis and an associated yeast from Smoking Hills, Northwest Territories, and their apparent mutualism. Microb. Ecol. 1988, 16, 213–231. [Google Scholar] [CrossRef] [PubMed]
- Olaveson, M.M.; Stokes, P.M. Responses of the acidophilic alga Euglena mutabilis (Euglenophyceae) to carbon enrichment at pH 3. J. Phycol. 1989, 25, 529–539. [Google Scholar] [CrossRef]
- Olaveson, M.M.; Nalewajko, C. Effects of acidity on the growth of two Euglena species. Hydrobiologia 2000, 433, 39–56. [Google Scholar] [CrossRef]
- Yanagawa, K.; Haraguchi, A.; Yoshitake, K.; Asamatsu, K.; Harano, M.; Yamashita, K.; Ishibashi, J.-I. Ubiquity of Euglena mutabilis population in three ecologically distinct acidic habitats in southwestern Japan. Water 2021, 13, 1570. [Google Scholar] [CrossRef]
- Zheng, J.; Haraguchi, A. Inorganic nitrogen source for autotrophic growth of Euglena mutabilis Schmitz. Phycol. Res. 2018, 66, 155–158. [Google Scholar] [CrossRef]
- Marshall, B.; Biscoe, P.V. A model for C3 leaves describing the dependence of net photosynthesis on irradiance. J. Exp. Bot. 1980, 31, 29–39. [Google Scholar] [CrossRef]
- Colman, B.; Balkos, K.D. Mechanisms of inorganic carbon acquisition in two Euglena species. Can. J. Bot. 2005, 83, 865–871. [Google Scholar] [CrossRef]
- Geller, W.; Baffico, G.; Diaz, M.; Friese, K.; Koschorreck, M.; Kringel, R.; Pedrozo, F.; Schimmele, M.; Temporetti, P.; Wendt-Potthoff, K.; et al. The acidic waters of Rio Agrio and Lago Caviahue at Volcan Copahue, Argentina. SIL Proc. 1922-2010 2006, 29, 1583–1586. [Google Scholar] [CrossRef]
- Hargreaves, J.W.; Lloyd, E.J.H.; Whitton, B.A. Chemistry and vegetation of highly acidic streams. Freshw. Biol. 1975, 5, 563–576. [Google Scholar] [CrossRef]
- Sabater, S.; Buchaca, T.; Cambra, J.; Catalan, J.; Guasch, H.; Ivorra, N.; Muñoz, I.; Navarro, E.; Real, M.; Romaní, A. Structure and function of benthic algal communities in an extremely acid river. J. Phycol. 2003, 39, 481–489. [Google Scholar] [CrossRef] [Green Version]
- Sheath, R.G.; Havas, M.; Hellebust, J.A.; Hutchinson, T.C. Effects of long-term natural acidification on the algal communities of tundra ponds at the Smoking Hills, N.W.T., Canada. Can. J. Bot. 1982, 60, 58–72. [Google Scholar] [CrossRef]
- Bray, J.P.; Broady, P.A.; Niyogi, D.K.; Harding, J.S. Periphyton communities in New Zealand streams impacted by acid mine drainage. Mar. Freshw. Res. 2008, 59, 1084–1091. [Google Scholar] [CrossRef]
- Baffico, G.D. Epilithic algae distribution along a chemical gradient in a naturally acidic river, Río Agrio (Patagonia, Argentina). Microb. Ecol. 2010, 59, 533–545. [Google Scholar] [CrossRef] [PubMed]
- Pentecost, A. The distribution of Euglena mutabilis in Sphagna, with reference to the Malham Tarn North Fen. Field Stud. 1982, 5, 591–606. [Google Scholar]
- Searles, P.S.; Kropp, B.R.; Flint, S.D.; Caldwell, M.M. Influence of solar UV-B radiation on peatland microbial communities of southern Argentina. New Phytol. 2001, 152, 213–221. [Google Scholar] [CrossRef]
- Lane, A.E.; Burris, J.E. Effects of environmental pH on the internal pH of Chlorella pyrenoidosa, Scenedesmus quadricauda, and Euglena mutabilis. Plant. Physiol. 1981, 68, 439–442. [Google Scholar] [CrossRef] [PubMed] [Green Version]
Figure 1.
Population density relative to the initial density of Euglena mutabilis in (a) Sensui, Kurate, Fukuoka, Japan and (b) Bougatsuru, Oita, Japan, in pH-adjusted culture solutions. Means and standard error (error bars) are shown. Significant differences in the population density among different pH cultures (at each incubation time; shown over the plot) and differences within the incubation period (at every pH treatment; shown beside line symbols) were tested using the Kruskal–Wallis test. Significance level: **: p < 0.01, ***: p < 0.001, NS: not significant p > 0.05.
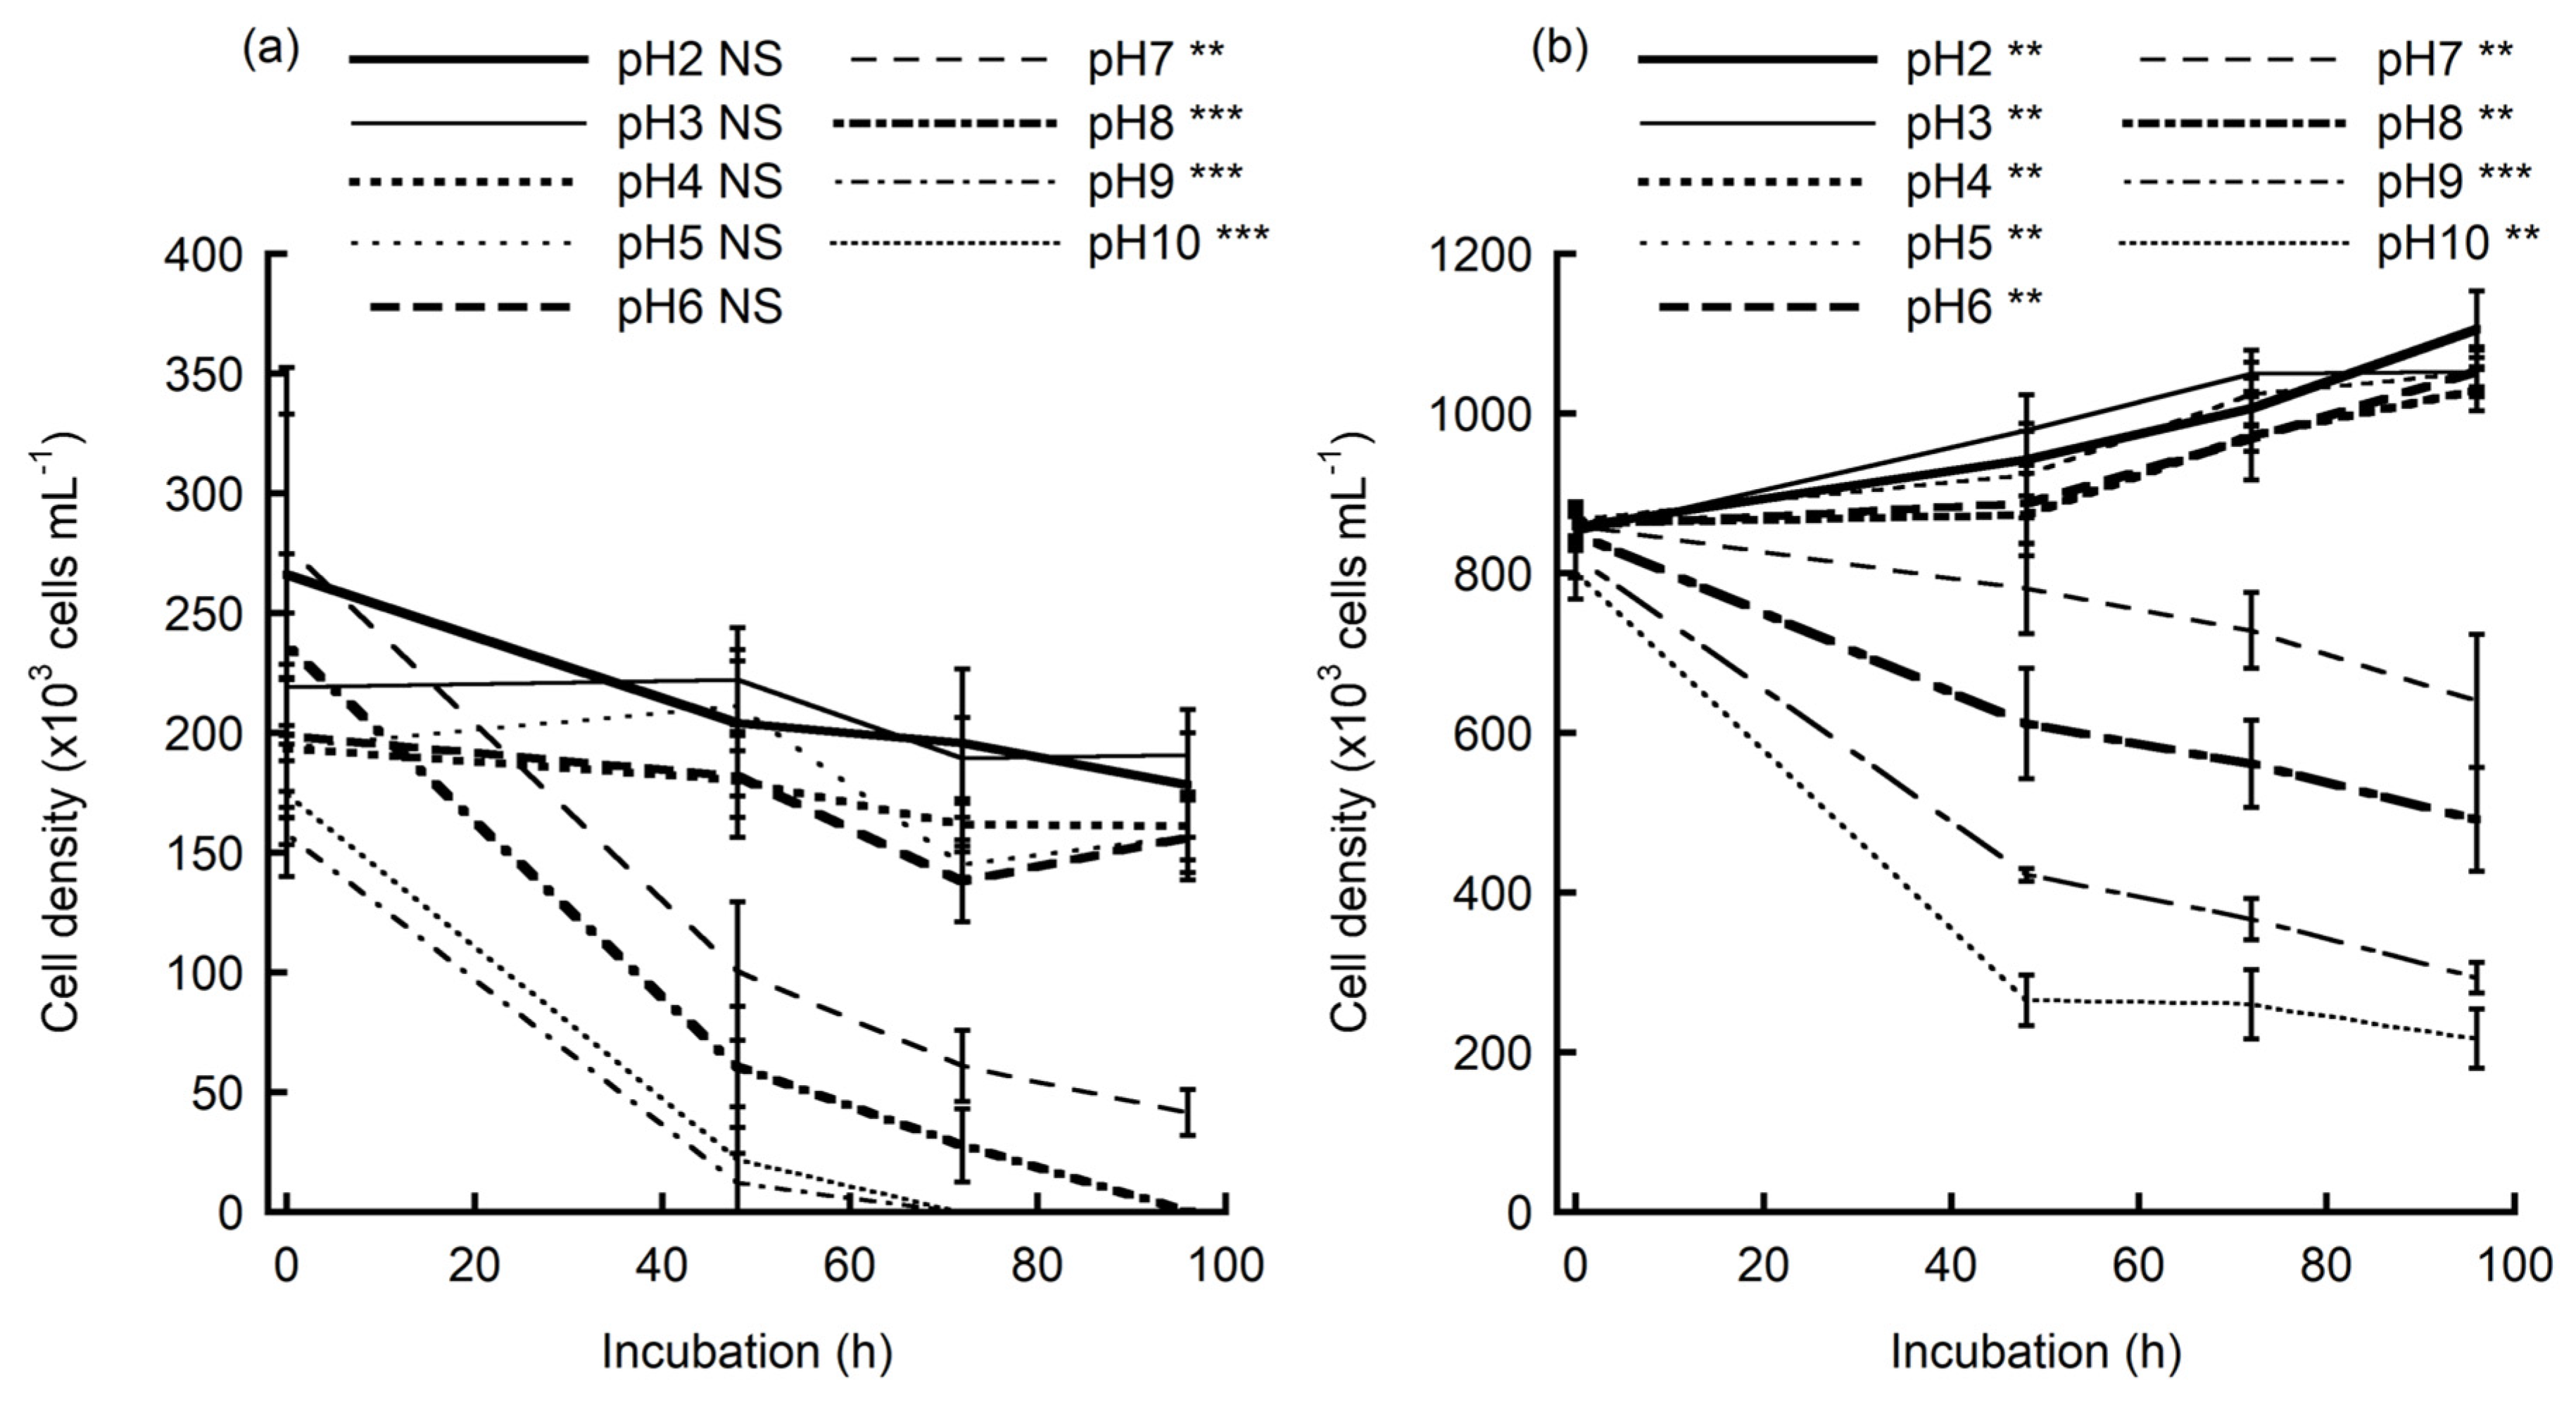
Figure 2.
Gross photosynthetic rate at the light-saturation point (Pmax) and dark respiration rate (Rd) of Euglena mutabilis of Sensui drainage population in pH-adjusted culture solutions at 0, 48, 72, and 96 h (a–d) after culture inoculation. Means and SD (error bars) are shown. Means sharing the same letter within the same culture period are not significantly different (α < 0.05) among pH treatments.

Figure 3.
Gross photosynthetic rate at the light-saturation point (Pmax) and dark respiration rate (Rd) of Euglena mutabilis of Bougatsuru spring population in pH-adjusted culture solutions at 0, 48, 72, and 96 h (a–d) after culture inoculation. Means and SD (error bars) are shown. Means sharing the same letter within the same culture period are not significantly different (α < 0.05) among pH treatments.


Table 1.
Water quality of stream water at the habitats of Euglena mutabilis in Sensui and Bougatsuru.
Table 1.
Water quality of stream water at the habitats of Euglena mutabilis in Sensui and Bougatsuru.
| Location | Sensui | Bougatsuru | |
|---|---|---|---|
| 33.78264 °N | 33.09602 °N | ||
| 130.65363 °E | 131.25940 °E | ||
| 16 m a.s.l. | 1238 m a.s.l. | ||
| (2 February 2017) | (20 October 2016) | ||
| Water temperature | °C | 21.9 | 12.0 |
| pH | 3.95 | 5.32 | |
| EC | mS/m | 209.0 | 23.6 |
| TOC | mg/L | 40.4 | 34.2 |
| Cl− | mg/L | 22.1 | 4.4 |
| NO2− | mg/L | n.d. | n.d. |
| NO3− | mg/L | n.d. | 1.6 |
| PO43− | mg/L | n.d. | 2.0 |
| SO42− | mg/L | 1359.6 | 79.7 |
| Na+ | mg/L | 64.5 | 8.1 |
| NH4+ | mg/L | 1.3 | 0.1 |
| K+ | mg/L | 9.1 | 2.3 |
| Mg2+ | mg/L | 16.6 | 6.4 |
| Ca2+ | mg/L | 345.2 | 21.5 |
| Al | mg/L | 21.0 | n.d. |
| Fe | mg/L | 91.5 | 0.6 |
| Mn | mg/L | 5.2 | 0.3 |
| Pb | mg/L | 2.1 | n.d. |
| Zn | mg/L | 1.5 | n.d. |
n.d.: under detection limit; EC: electric conductivity; TOC: total organic carbon.
Publisher’s Note: MDPI stays neutral with regard to jurisdictional claims in published maps and institutional affiliations. |
© 2021 by the authors. Licensee MDPI, Basel, Switzerland. This article is an open access article distributed under the terms and conditions of the Creative Commons Attribution (CC BY) license (https://creativecommons.org/licenses/by/4.0/).
Share and Cite
MDPI and ACS Style
Haraguchi, A.; Zheng, J. Effect of pH on Photosynthesis of Euglena mutabilis Schmitz, an Acidophilic Benthic Flagellate. Hydrobiology 2022, 1, 2-9. https://doi.org/10.3390/hydrobiology1010002
AMA Style
Haraguchi A, Zheng J. Effect of pH on Photosynthesis of Euglena mutabilis Schmitz, an Acidophilic Benthic Flagellate. Hydrobiology. 2022; 1(1):2-9. https://doi.org/10.3390/hydrobiology1010002
Chicago/Turabian StyleHaraguchi, Akira, and Jiaojiao Zheng. 2022. "Effect of pH on Photosynthesis of Euglena mutabilis Schmitz, an Acidophilic Benthic Flagellate" Hydrobiology 1, no. 1: 2-9. https://doi.org/10.3390/hydrobiology1010002