


Abstract
Mesophotic kelp habitats may contribute to marine carbon cycling, yet their productivity and long-term carbon retention remain poorly constrained. We assessed a depth-constrained analytical support domain for the endemic and endangered Brazilian kelp Laminaria abyssalis across 45–70 m on the southwestern Atlantic shelf using a published species distribution model, high-resolution bathymetry, biomass observations, and literature-based productivity scenarios. Accounting for within-cell bathymetric variation yielded 12,514.60 km2 of depth-constrained analytical support within non-NA SDM coverage. The biomass dataset contained 23 observations aggregated into 19 raster cells. Leave-one-out validation showed that inverse distance weighting did not outperform a non-spatial mean (RMSE = 75.25 vs. 74.02 kg km−2; r = −0.389, p = 0.100); therefore, no regional biomass or biomass-derived productivity surface was produced. Using the only depth-overlapping Laminaria productivity analog (22.32 g C m−2 yr−1), the full-occupancy area-integrated NPP scenario was 279,326 t C yr−1, with an empirical transferability envelope of 4242–1,074,367 t C yr−1. At a long-term retention fraction of 0.11, the retained-carbon equivalent ranged from 467 to 118,180 t C yr−1. These values are assumption-dependent screening estimates, not measurements of export, burial, sequestration, or carbon-credit potential. Field measurements of occupancy, local productivity, transport, burial, and permanence are required before carbon-accounting claims can be supported.
1. Introduction
Marine ecosystems regulate carbon through primary production, consumption, remineralization, lateral transport, sedimentary burial, and exchange with deeper reservoirs [1,2]. Established coastal blue-carbon protocols apply primarily to mangroves, tidal marshes, and seagrasses, where local biomass and sediment stocks can be measured using standardized accounting methods [2,3]. Macroalgal systems differ because production is commonly detached from the eventual location of deposition or preservation [4,5,6,7,8]. Consequently, assessments of kelp-related carbon pathways should begin as source-to-fate screening exercises rather than as direct extensions of sediment-based blue-carbon accounting.
We use four terms with distinct meanings. Production is organic carbon fixed at the source habitat; export is physical transport away from that habitat; long-term retention is a scenario fraction remaining outside rapid recycling over a stated interval; and sequestration requires demonstrated transfer to a durable sink with quantified permanence. No export flux, depositional sink, burial rate, or permanence was measured in this study. Marine spatial planning is therefore justified primarily by the species’ endangered, endemic, habitat-forming status, while the carbon analysis identifies hypotheses and monitoring priorities rather than a verified mitigation asset [9,10]. Accordingly, conservation and marine spatial planning recommendations remain warranted independently of the magnitude—or even the existence—of long-term carbon retention, because they are grounded in the endangered, endemic, and habitat-forming status of L. abyssalis rather than in an assumed climate-mitigation function.
Mesophotic kelps operate under strong light limitation, and productivity at 45–70 m depends on water clarity, seasonal irradiance, nutrient supply, temperature, and hydrodynamic exposure. Along the central Brazilian margin, Brazil Current meanders, shelf-break upwelling, South Atlantic Central Water intrusions, and the Vitória–Trindade Ridge can enhance exchange across the shelf and shelf break [7,11]. These processes make lateral transport physically plausible, but they do not demonstrate that L. abyssalis detritus reaches a persistent sink. Interannual variability in these processes also means that static multi-decadal scenarios cannot be interpreted as forecasts.
Productivity research on Laminariales spans several decades and multiple temperate and polar systems [12,13,14,15,16]. However, estimates differ substantially among species, depth, method, season, and environmental setting. The global NPP dataset used here contained 133 positive Laminaria observations from seven taxa and 26 source references, with measurement years spanning 1967–2019; only one record overlapped the 45–70 m analytical interval. We therefore use the broader literature to quantify genus-level transferability, not to assume local physiological equivalence with L. abyssalis.
The currently accepted taxon Laminaria abyssalis is an endemic Brazilian habitat-forming kelp associated with rhodolith and rocky substrates [9,17]. Endemism does not imply greater or lower photosynthetic capacity; it primarily increases conservation sensitivity to regional disturbance and limits direct transferability from cosmopolitan congeners. Rhodolith calcification and kelp production have different inorganic-carbon consequences, and no net climate balance for this coupled kelp–rhodolith system is calculated here [18]. The 45–70 m interval represents the documented and modeled analytical depth range used for screening, not an absolute physiological boundary.
Projected warming may contract suitable habitat for L. abyssalis, while proposed offshore infrastructure may introduce seabed disturbance, anchoring, cable installation, sediment resuspension, and local hydrodynamic changes [9,10]. Artificial structures could also provide hard substrate, but colonization benefit cannot be assumed and would not compensate automatically for impacts on endemic natural habitat. The analysis therefore supports precautionary site-specific surveys rather than categorical claims that every development cell will destroy kelp habitat. Historical harvesting and long-term industrial alteration of baseline biomass could not be assessed because the available observations do not constitute a temporally standardized monitoring series.
We addressed four testable analytical expectations: (1) sparse positive-only observations would not support reliable regional biomass interpolation; (2) regional totals would scale directly with assumed occupied area and the selected genus-level productivity analog; (3) incorporating the broader historical Laminaria literature would produce a wide extrapolation envelope rather than a narrow local uncertainty estimate; and (4) retained-carbon equivalents would be dominated by the assumed long-term fraction and by the spatial definition of the 45–70 m support. We imported, rather than updated, the previously published SDM [9], assessed its depth-constrained support, tested IDW against a non-spatial benchmark, audited the broader productivity literature, and quantified deterministic scenarios without treating suitability or biomass observations as validated abundance.
The study is therefore an ecological screening assessment with management implications, not a policy framework or carbon-crediting protocol. Its primary outputs are the documented failure of biomass interpolation, a more conservative fractional-depth area audit, transparent scenario dependence, and a field-validation sequence. The biodiversity and conservation value of L. abyssalis remains independent of whether future measurements identify substantial, negligible, or zero long-term carbon retention.
2. Materials and Methods
2.1. Study Area and Analytical Scope
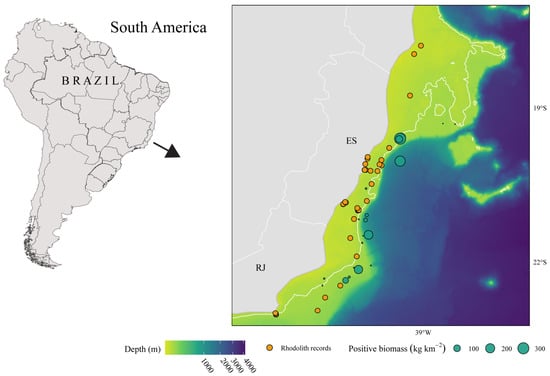
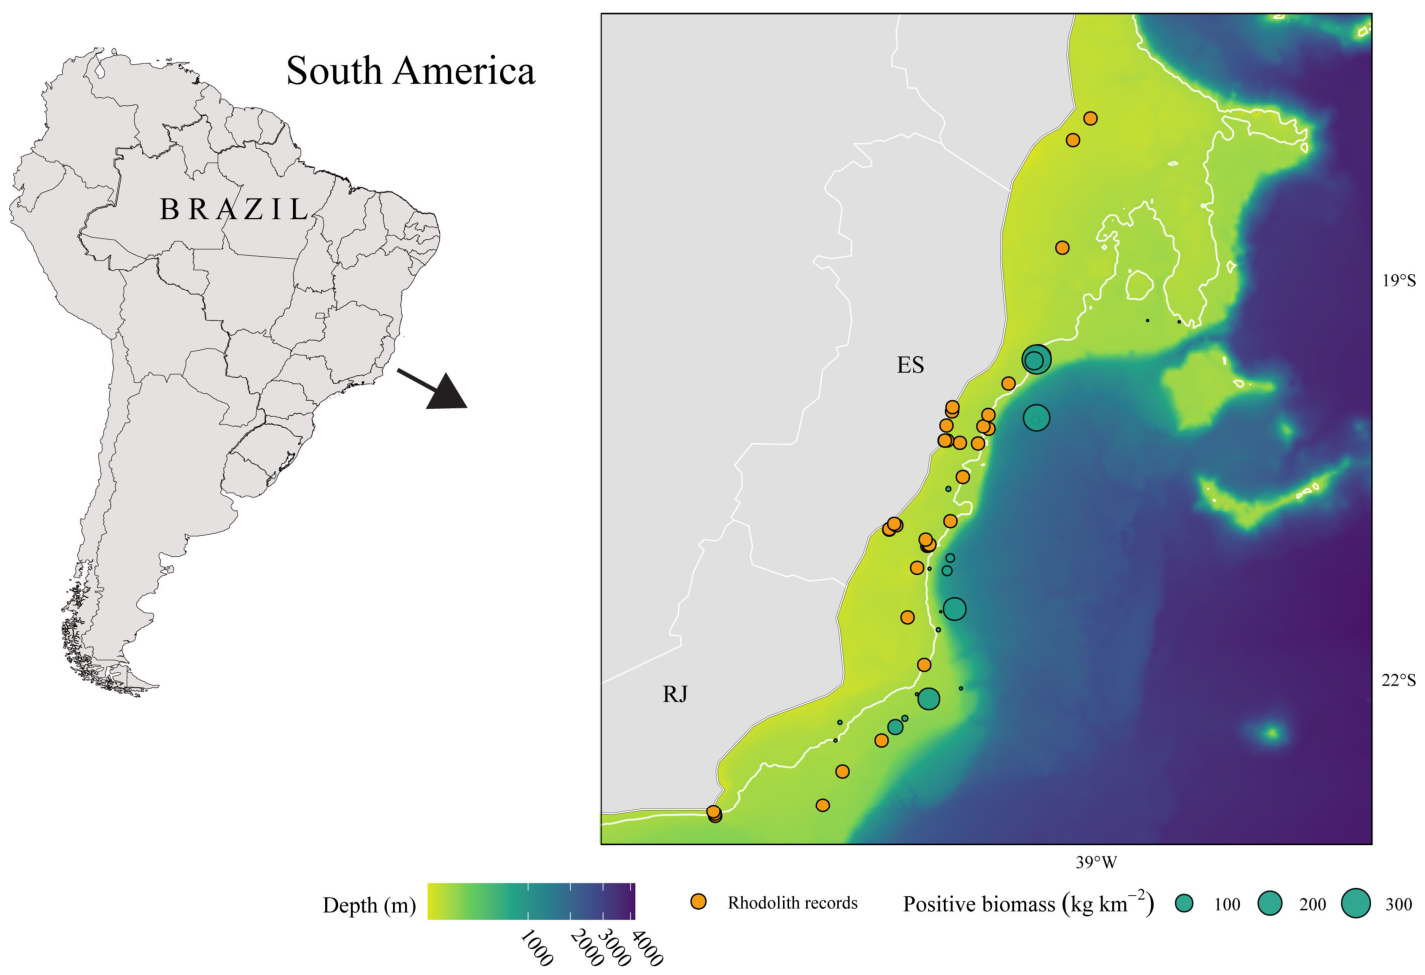
The study area extends along the central Brazilian continental shelf between the southern Abrolhos region and the Cabo Frio/Rio de Janeiro sector [9,10]. The region is influenced by the Brazil Current, cyclonic meanders, shelf-break upwelling, South Atlantic Central Water intrusions, variable shelf width, and the Vitória–Trindade Ridge [7,11]. These features provide regional context for potential transport and environmental variability; no current-meter, particle-tracking, or source-to-sink model was used to quantify kelp-detritus pathways. The study area and available observations are shown in Figure 1.
Figure 1.
Study area and available observations on the central Brazilian shelf. The South America locator shows the regional setting. In the enlarged panel, bathymetry is represented by a viridis depth gradient; orange circles with black borders indicate rhodolith records, and teal proportional circles with black borders indicate positive L. abyssalis biomass observations (kg km−2). Brazilian state abbreviations (ES, Espírito Santo State; RJ, Rio de Janeiro State) and geographic coordinates provide orientation. Symbol size represents biomass magnitude and does not represent occupied bed area.
2.2. Imported Habitat-Suitability Layer and Retained Kelp Domain
A present-day ensemble species distribution model raster for L. abyssalis was imported unchanged from Anderson et al. [9]. It was not refitted or updated in this study. The continuous suitability surface was retained for mapping and model-domain context; the analytical 45–70 m support was defined by non-NA SDM coverage intersected with the depth criterion, without applying a suitability threshold to infer occupancy [9,19]. Suitability values were not interpreted as abundance, occupied cover, biomass, productivity, export, or retained carbon. The uncropped input raster is provided as Figure S2.
The supplied SDM and bathymetric rasters had identical coordinate reference systems, extents, resolutions, dimensions, and cell alignment; therefore, no bathymetric resampling was required for the files used in the final analysis. Center-cell depths between 45 and 70 m retained 169 cells and defined a 13,520.84 km2 planimetric upper-bound audit. To address within-cell bathymetric heterogeneity, GEBCO 2025 [20] was classified at native resolution and averaged to the SDM grid to estimate the fraction of each coarse cell lying within 45–70 m. The resulting primary fractional-depth support was 12,514.60 km2, 7.44% below the center-cell upper bound. Areas are two-dimensional planimetric estimates and do not include seabed rugosity.
An earlier 0.25 suitability threshold was retained only as a reproducibility audit of the previous workflow; it did not determine the 169 cells, fractional area, NPP, or retained-carbon scenarios. Inclusion in the current analytical support was based on non-NA SDM coverage and depth, not on a suitability cut-off or inferred occupancy. A rhodolith-mask overlap retained 62 cells and 4558.23 km2 of fractional-depth area, but this result is supplementary because the available substrate raster has incomplete coverage.
The 23 positive biomass observations used in the spatial diagnostic were compiled from previously published and publicly accessible sources and retain the quantitative fields required for the present analysis: geographic coordinates and biomass values (kg km−2). The complete observation-level dataset is supplied in Supplementary Table S1a, together with raster-cell assignment, model-support status, center-cell bathymetry, and overlap with the 45–70 m analytical domain. All verifiable study- or source-level metadata documented in the cited literature—including sampling periods, reported depths, biomass measurement conventions, and collection procedures—are summarized in Supplementary Table S1b [9,10,17,21,22,23]. To preserve data provenance, these literature-derived attributes are reported at the level supported by each source and are not assigned to individual observations unless a direct record-level linkage is documented. This separation preserves the integrity of the coordinates and biomass values used in the interpolation diagnostic while preventing unsupported attribution of source-level information to specific records. Because the dataset consists of positive observations rather than a systematic presence–absence or temporally standardized survey, it was used to assess spatial interpolation and not to estimate occupied fraction or historical change; no biomass-to-carbon conversion was applied to these records.
IDW was evaluated solely to test whether the positive biomass observations supported spatial prediction [24]. Nineteen unique cells were used because all records fell within the raster extent; only seven intersected the 45–70 m center-cell domain. Distances were calculated between native SDM raster-cell centroids projected to EPSG:5880, whereas maps were displayed in EPSG:4326. Coordinate transformation affected distance calculation and display only; raster cell geometry and area calculations remained on the native aligned grid.
For each held-out biomass cell i, the IDW prediction i was the distance-weighted mean of the remaining cell means Bj, with weights wij = dij−p. The p = 0 case assigned equal weights and served as a non-spatial leave-one-out mean benchmark [24].
Candidate powers were evaluated from p = 0 to p = 3.0 in increments of 0.05. Kriging was not adopted because 19 strongly right-skewed, positive-only, spatially discontinuous cells were insufficient to estimate and validate a stable variogram; applying a more complex geostatistical model would have produced an error surface without establishing reliable ecological signal. IDW was retained only as a transparent diagnostic of the data limitation.
For each power, we calculated RMSE, MAE, mean bias, Pearson r and p, Spearman ρ and p, and the intercept and slope of observed versus leave-one-out predictions. A positive-power model was considered informative only if it reduced RMSE relative to p = 0 and produced a positive observed–predicted association. Complete results for p = 0–3.0 are supplied in Table S2.
Leave-one-out cross-validation was used as an internal interpolation diagnostic, not as independent validation or spatial-block cross-validation [24,25]. With only 19 cells and seven within the retained domain, a defensible spatial blocking design was not available. Failure to outperform p = 0 was interpreted as evidence against regional biomass interpolation; accordingly, no IDW biomass surface entered any NPP or carbon calculation.
2.3. Area-Based Productivity Analog and Deterministic Retained-Carbon Scenarios
The global seaweed productivity dataset [13] provided a reproducible audit of the broader historical evidence base. The exact-genus subset contained 133 positive Laminaria records representing seven taxa and 26 source references; reported measurement years ranged from 1967 to 2019 where year metadata were available. Records were grouped by species, reference, and site, producing 86 study groups and preventing repeatedly sampled studies from dominating the analysis. Only one positive record had a reported depth overlapping 45–70 m: Laminaria ochroleuca at approximately 55 m in the Strait of Messina, originally measured by Drew [14]. Its standardized value, 22.32 g C m−2 yr−1, remained the central illustrative analog because it was the sole depth-overlapping observation, not because the wider literature was ignored. The median NPP of each study group was divided by the median across groups and multiplied by 22.32, thereby propagating observed cross-species, cross-region, methodological, and temporal variability while retaining the depth-overlapping value as the central reference. The 2.5th and 97.5th percentiles of the resulting depth-centered anchors were 0.339 and 85.849 g C m−2 yr−1. This is a broad empirical transferability envelope, not a confidence interval for L. abyssalis.
No local biomass-to-production conversion was performed, and no carbon content was calculated from the biomass values. The supplied biomass workbook does not identify whether kg km−2 represents wet, fresh, or dry mass and does not contain collection dates, field depths, or primary sources. These records were therefore restricted to the interpolation diagnostic. The analog is applied uniformly to assumed occupied fractional area and should be replaced by in situ production measurements when available.
where AF is the high-resolution fractional 45–70 m support area in m2, q is the assumed occupied fraction, and NPPanalog is 22.32 g C m−2 yr−1. The 106 divisor converts grams to tonnes. The center-cell area and rhodolith-overlap area are reported only as alternative spatial-support audits.
Gross NPPq (t C yr−1) = AF × q × NPPanalog/106
Because the positive-only observations cannot estimate occupied fraction, q was evaluated deterministically at 0.10, 0.25, 0.50, 0.75, and 1.00. The q = 1 result is an upper-bound full-occupancy scenario, not a mapped estimate of kelp tissue. A rhodolith-mask overlap was also calculated as a supplementary audit, but it was not imposed as a hard mask because available substrate coverage is incomplete and absence in the raster may represent unmapped habitat.
Annual retained-carbon equivalents were calculated as Rq,f = Gross NPPq × f, where f is an explicitly assumed long-term fraction. We evaluated f = 0.01, 0.05, 0.11, and 0.20. The 0.11 value was retained as a literature-derived reference scenario [5], not as a regional estimate or probability distribution.
Cumulative static equivalents were calculated as
Sq,f,H = Rq,f × H for H = 1, 20, 50, and 100 years.
Production, export, retention, and sequestration were not treated as interchangeable. The calculation starts from source production; it does not isolate locally remineralized material, quantify the fraction exported off-shelf, identify bathyal versus pelagic destinations, or demonstrate burial and permanence.
Respiration, microbial remineralization, herbivory, frond erosion, particulate and dissolved pathways, changing light, climate-driven niche loss, and hydrodynamic variability were not parameterized because local rates were unavailable. Adding arbitrary physiological or climate-decay functions would increase apparent complexity without empirical support. Consequently, multi-year values are static sensitivity equivalents rather than ecological forecasts. The study does not infer that 11% leaves the shelf or remains permanently sequestered. Instead, the deterministic range shows how results change under alternative assumed fractions, including a 1% low-retention case. The 100-year values should be read as multiplication of a constant annual scenario by 100, not as a prediction that present-day kelp habitat, productivity, or retention will persist unchanged for a century.
NPP-anchor extrapolation uncertainty was propagated from the broader historical Laminaria evidence base rather than treating the single depth-overlapping analog as exact. Every occupancy, retention, and time-horizon calculation was repeated using the empirical lower anchor (0.339 g C m−2 yr−1), the central reference (22.32 g C m−2 yr−1), and the empirical upper anchor (85.849 g C m−2 yr−1). Taxonomic, source-reference, and measurement-decade coverage were audited separately. Occupancy and long-term retention remained deterministic because no regional probability distributions exist for these parameters. Consequently, the reported ranges are empirical extrapolation envelopes and scenario bounds, not Monte Carlo confidence intervals. Sensitivity was evaluated through four complementary components: (i) the historical NPP evidence audit; (ii) the empirical NPP-anchor transferability envelope; (iii) the deterministic matrix crossing occupied fractions and assumed long-term fractions; and (iv) center-cell, high-resolution fractional-depth, and rhodolith-overlap spatial-support audits [26].
These analyses quantify transferability and scenario dependence but cannot establish local confidence limits, robustness, net greenhouse-gas balance, export efficiency, or permanence.
2.4. Reproducibility and Supplementary Outputs
The supplementary workbook contains the 23 positive biomass observations and their available analytical fields (Table S1a), a source-level synthesis of verifiable sampling and biomass metadata documented in the primary literature (Table S1b), complete IDW metrics for every p = 0–3.0 candidate and selected powers (Table S2), a coordinate-basis audit documenting the primary raster-cell-centroid convention and the earlier diagnostic alternative, the 169 retained cells with centroid, center depth, fractional-depth area, suitability, and conditional scenario fields (Table S3), spatial-support audits (Table S4), deterministic occupancy–retention scenarios (Table S5), the historical Laminaria NPP audit and propagated transferability scenarios (Table S6), and a manuscript numerical-consistency audit.
The supplementary package includes in situ habitat imagery (Figure S1), the uncropped SDM (Figure S2), a two-panel audit of the empirical NPP-transferability distribution and historical study coverage by measurement decade and taxon (Figure S3), the complete IDW validation audit (Figure S4), the spatial-support audit (Figure S5), and the complete propagated scenario envelope (Figure S6). The script also records package versions at runtime and writes session information. The supplementary cell table uses conditional area-based NPP only; it does not reinstate invalid biomass-derived cell predictions or spatial NPP hotspots.
Analyses were implemented in R 4.6.0 [27] using terra [28], sf [29,30], ggplot2 [31], and viridis [32]. The pipeline records the exact package versions, package builds, R build information, and session information at runtime; these metadata are supplied in the reproducibility archive.
3. Results
3.1. Analytical Support and Biomass-Data Limitations
The center-cell 45–70 m restriction retained 169 cells covering 13,520.84 km2. High-resolution GEBCO depth fractions reduced the primary planimetric support to 12,514.60 km2, a 7.44% reduction that quantifies mixed-depth area within the coarse cells. Individual full-cell areas remained 78.82–81.46 km2. The 169 cells define depth-constrained analytical support within non-NA SDM coverage, not occupied kelp habitat.
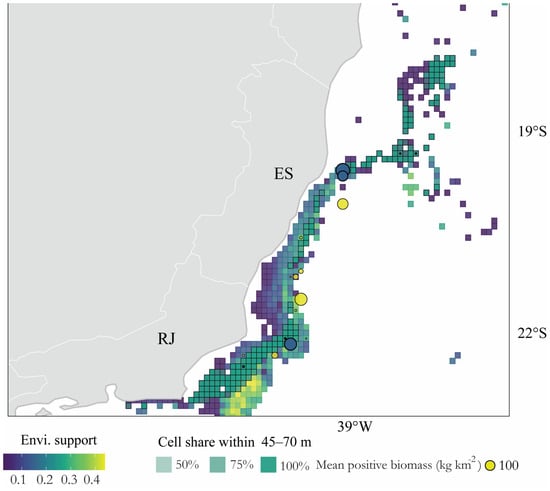
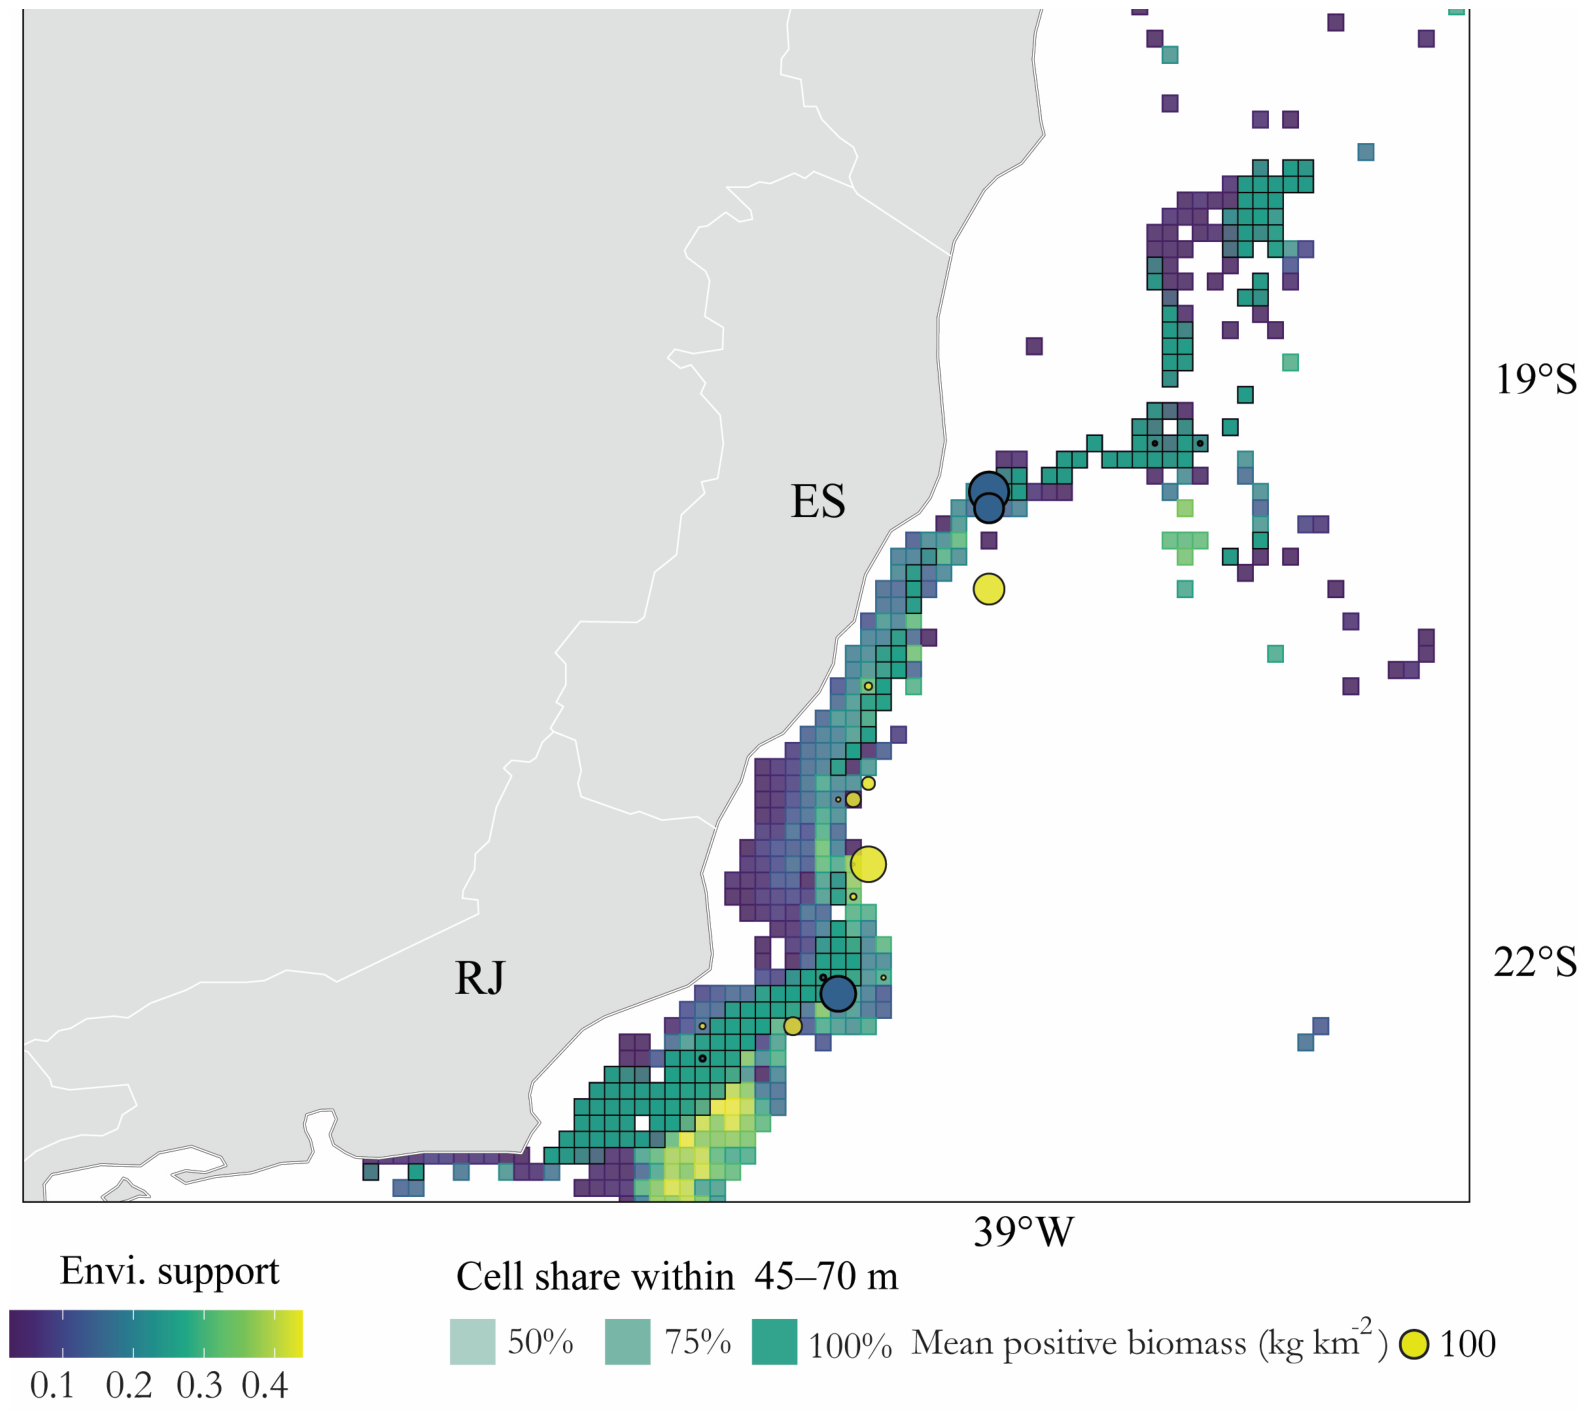
The biomass dataset contained 23 positive observations aggregated into 19 unique raster cells, of which seven intersected the retained center-cell domain (Figure 2). Cell means were strongly right-skewed (mean = 47.60 kg km−2; median = 3.20 kg km−2; SD = 72.04 kg km−2; range = 0.20–212.87 kg km−2). The geographic coordinates and biomass values were preserved exactly as supplied, and the associated source-level sampling and measurement metadata are documented in Supplementary Table S1b. Because the observations are positive-only and do not constitute a systematic presence–absence or temporally standardized monitoring survey, they support the interpolation diagnostic but not estimation of occupied fraction or historical biomass change.
Figure 2.
Relative SDM suitability, fractional 45–70 m cell coverage, and positive biomass-cell overlap. The viridis raster represents relative modeled suitability only. Square cells with black borders represent the fraction of each raster cell lying within the 45–70 m interval; opacity increases with fractional coverage (i.e., transparency decreases as the within-depth fraction increases). Proportional circles show mean positive biomass in sampled cells, with the highlighted circles identifying sampled cells that intersect the retained analytical domain. Suitability is not interpreted as abundance, occupancy, biomass, or productivity.
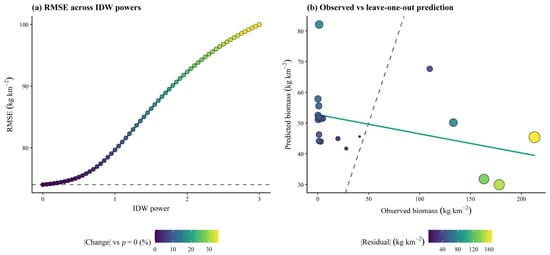
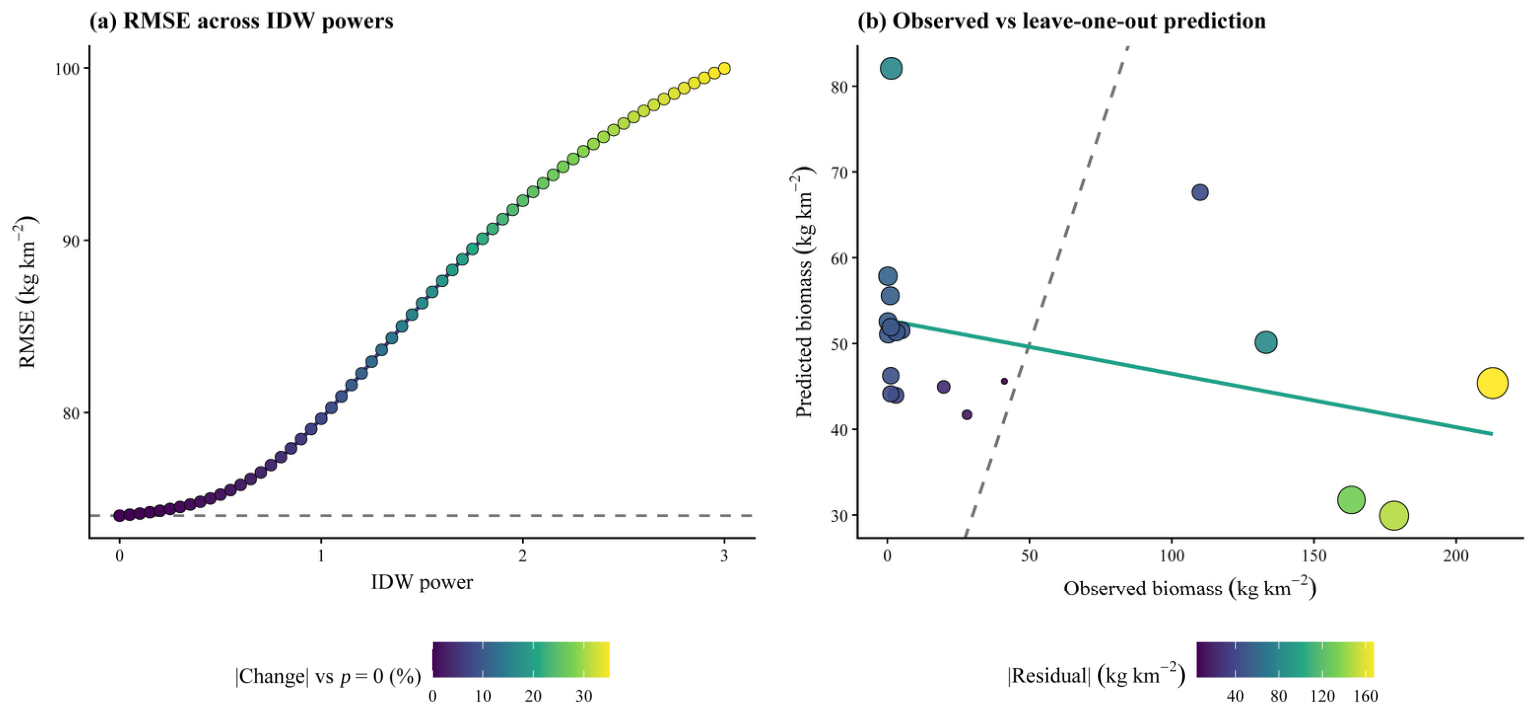
The lowest leave-one-out error occurred at p = 0 (RMSE = 74.02 kg km−2; MAE = 62.17 kg km−2). At p = 0.5, RMSE was 75.25 kg km−2, 1.66% worse than the benchmark, and the observed–predicted relationship was negative (r = −0.389, p = 0.100). RMSE increased further with larger powers. High values were systematically underpredicted and low values overpredicted; therefore, no regional biomass surface or standing-stock total was produced.
3.2. Area-Based Primary Production and Retained-Carbon Scenarios
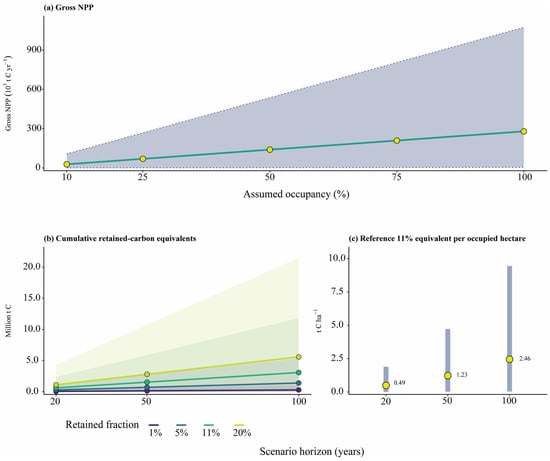
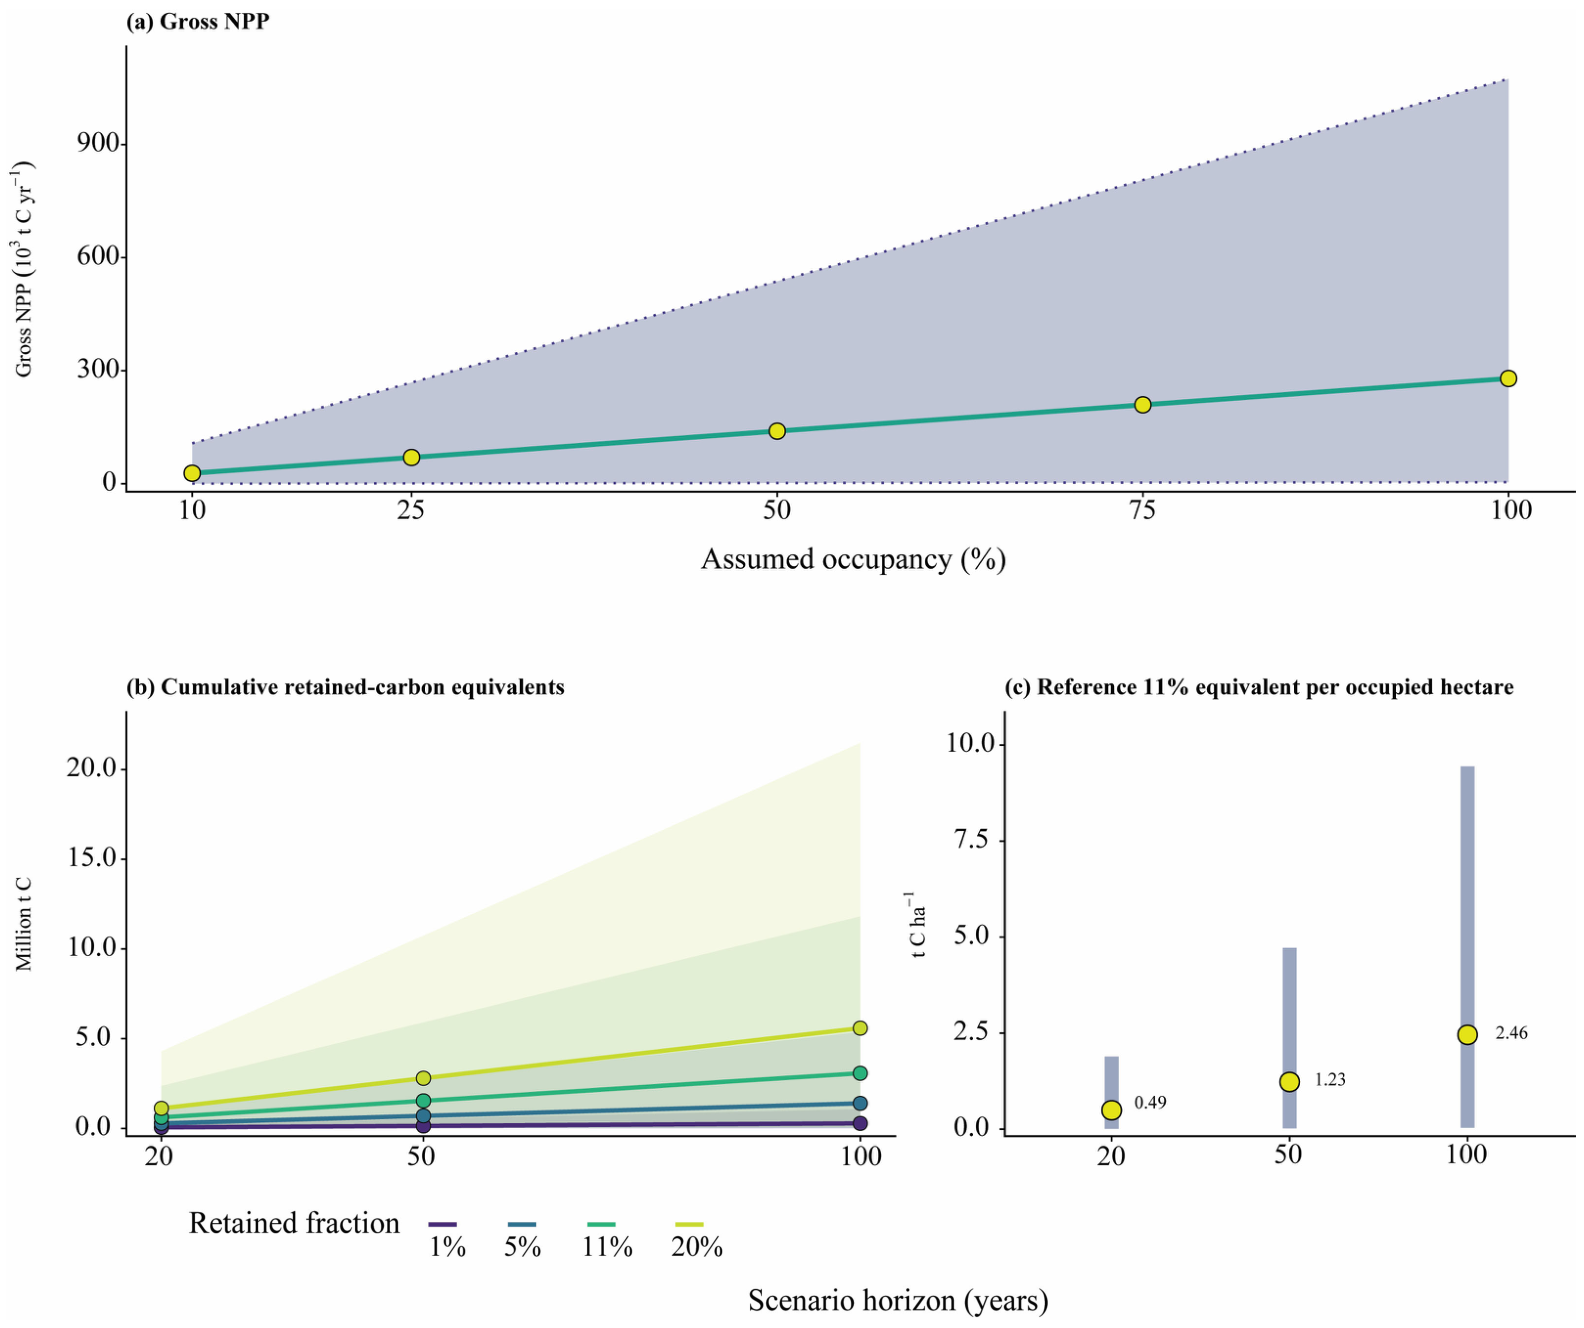
The broader exact-genus audit comprised 133 positive Laminaria records from seven taxa and 26 source references, consolidated into 86 species–reference–site groups; available measurement years spanned 1967–2019 (Figure S3; Table S6). Applying the central 22.32 g C m−2 yr−1 depth-overlapping analog to the primary 12,514.60 km2 fractional-depth area yielded a full-occupancy gross NPP scenario of 279,326 t C yr−1. The study-level genus-transferability analysis produced a 2.5–97.5% empirical anchor range of 0.339–85.849 g C m−2 yr−1, corresponding to a full-occupancy gross NPP extrapolation envelope of 4242–1,074,367 t C yr−1 (Figure 3a; Table S6). The central scenario scaled linearly to 27,933, 69,831, 139,663, and 209,494 t C yr−1 at assumed occupancies of 10%, 25%, 50%, and 75%, respectively. These values are controlled by the analog and assumed occupied area, not by local biomass.
Figure 3.
Area-based scenarios for Laminaria abyssalis with explicit NPP-anchor extrapolation uncertainty. (a) Gross annual NPP across assumed occupied fractions of the 12,514.60 km2 fractional-depth support; the central line and points use the 22.32 g C m−2 yr−1 depth-overlapping analog, and the shaded envelope represents the empirical 2.5–97.5% Laminaria transferability range. (b) Static cumulative retained-carbon equivalents at 20, 50, and 100 years under assumed long-term fractions of 1%, 5%, 11%, and 20%. (c) Central 11% retained-carbon equivalent per occupied hectare. These are conditional scenarios rather than measurements or forecasts.
The IDW validation diagnostics are summarized in Figure 4.
Figure 4.
Internal IDW diagnostics for L. abyssalis biomass. (a) Leave-one-out RMSE across IDW powers p = 0–3.0; the dashed line marks the p = 0 non-spatial mean benchmark, and point color represents the absolute percentage change from that benchmark. (b) Observed versus leave-one-out predictions at p = 0.5; the dashed line is the 1:1 relationship, the solid line is the fitted trend, and point color and size represent absolute residual magnitude. Failure to outperform p = 0 supports exclusion of regional biomass interpolation.
At complete occupancy and the assumed reference f = 0.11, the central annual retained-carbon equivalent was 30,726 t C yr−1 and the central 100-year static equivalent was 3.07 million t C. Propagating the empirical NPP-anchor envelope produced annual equivalents of 467–118,180 t C yr−1 and 100-year static equivalents of 0.047–11.82 million t C (Figure 3; Table S6). These ranges represent NPP-analog transferability only; uncertainty in actual occupied area and long-term retention remains expressed through separate deterministic scenarios. None represents measured export, burial, or sequestration.
3.3. NPP Extrapolation, Deterministic Sensitivity, and Spatial-Support Audits
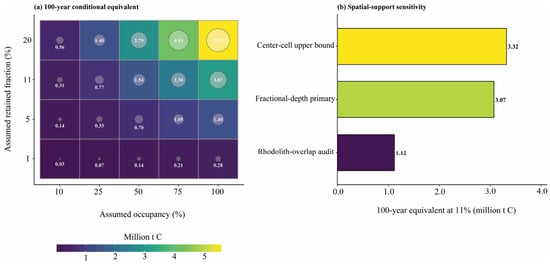
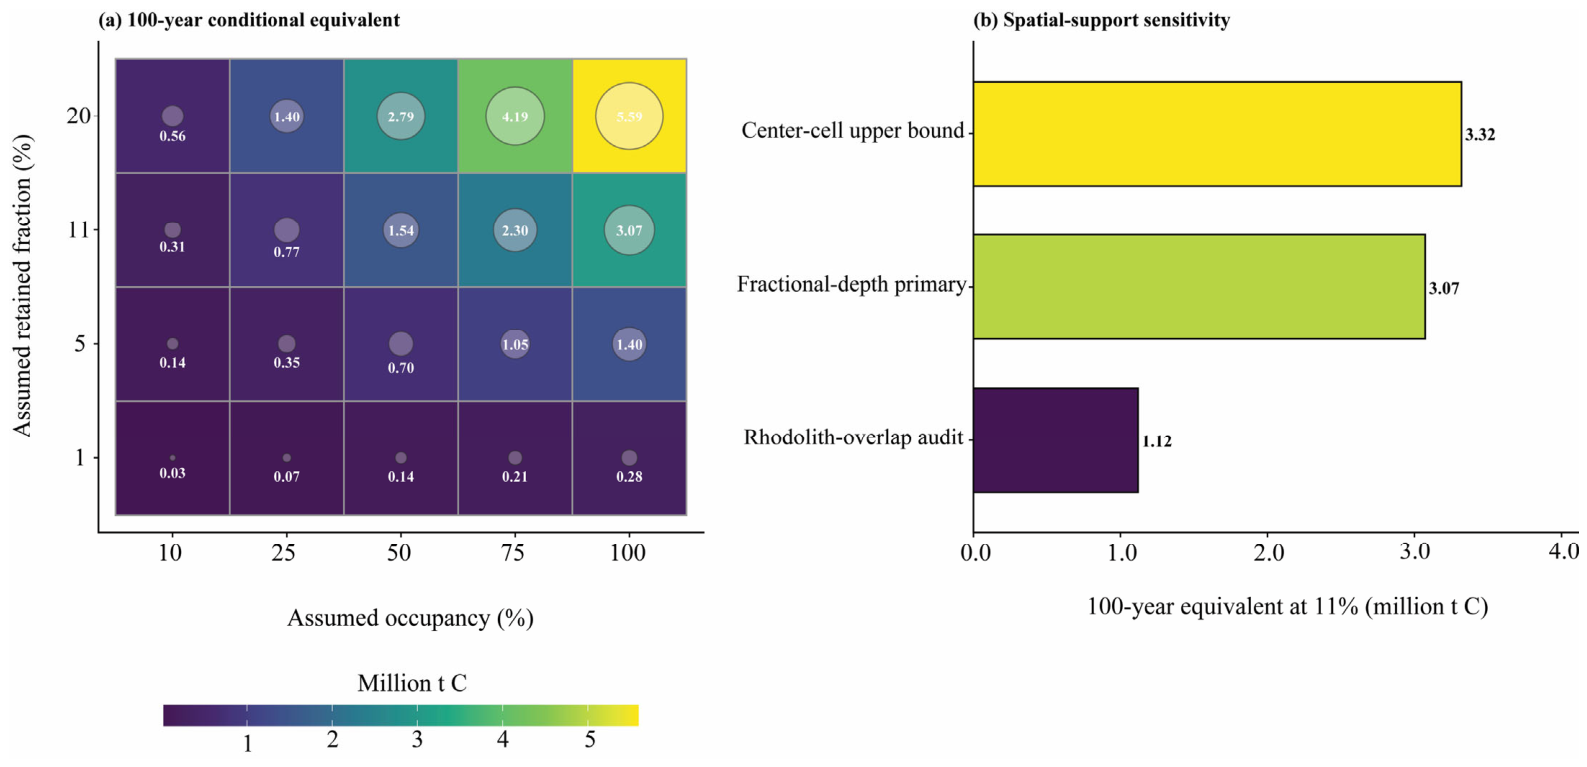
At the central 22.32 g C m−2 yr−1 anchor, crossing occupancy fractions of 10–100% with assumed long-term fractions of 1–20% produced 100-year conditional equivalents of 0.028–5.59 million t C (Figure 5a). When the empirical NPP-anchor envelope was also propagated, the complete scenario space expanded to approximately 0.0004–21.49 million t C. These are sensitivity limits, not confidence intervals or probability distributions.
Figure 5.
Deterministic sensitivity of the conditional 100-year scenario at the central 22.32 g C m−2 yr−1 analog. (a) Viridis heatmap crossing assumed occupied fractions of 10–100% with assumed long-term fractions of 1–20%; colored squares show the scenario gradient, central circles are proportional to the same values, and white labels report million tons of carbon. (b) Spatial-support sensitivity at complete occupancy and f = 0.11 for the center-cell upper bound, high-resolution fractional-depth primary support, and rhodolith-overlap audit. Values are static conditional equivalents, not confidence intervals or verified sequestration.
At full occupancy and f = 0.11, the 100-year center-cell upper bound was 3.32 million t C, the high-resolution fractional-depth primary scenario was 3.07 million t C, and the available rhodolith-overlap audit was 1.12 million t C across 62 retained cells (Figure 5b). Because the substrate mask has incomplete spatial coverage, the rhodolith value is an audit rather than a validated lower bound.
4. Discussion
The principal result is methodological: sparse positive-only observations did not support a regional biomass model, and a coarse center-cell depth mask overstated the 45–70 m planimetric support by 7.44% relative to a high-resolution fractional-depth audit. The paper therefore presents a theoretical screening workflow, not a verified estimate of standing biomass, export, burial, sequestration, or net climate value.
Suitability describes relative environmental suitability and cannot identify occupied kelp cover [9,19]. The actual proportion of the 12,514.60 km2 depth-constrained fractional support containing physical kelp tissue remains unknown. The complete-occupancy value is an upper-bound scenario, while the occupancy matrix shows how totals decline under partial cover. Abrupt northern and southern model limits reflect the imported SDM, environmental gradients, shelf configuration, and available occurrences; they are not demonstrated physiological barriers.
The IDW failure fundamentally changes interpretation. The negative p = 0.5 relationship, the 1.66% RMSE increase relative to p = 0, and the monotonic increase in RMSE at larger powers show regression toward the sample mean rather than transferable spatial structure. Therefore, any biomass-weighted NPP surface, hotspot, or spatial productivity gradient would be an interpolation artifact and is not interpreted. The former biomass total and cell-level biomass hotspots were removed. Differences among cells in Table S3 arise only from high-resolution fractional area under a uniform analog, not from predicted biomass or locally varying productivity. The seven overlapping cells are shown explicitly, and Table S2 provides the complete diagnostic record.
A kriging variance surface would not remedy the absence of a defensible variogram, systematic absences, seasonal replication, or broad spatial coverage. The appropriate response to the failed interpolation is additional sampling rather than a more complex interpolator. Future surveys should use spatially balanced or stratified-random stations across latitude, depth, substrate, irradiance, temperature, and hydrodynamic exposure, with repeated seasons and years.
The high-resolution depth-fraction audit addresses mixed shallow–deep cells but remains planimetric and does not represent 3D seabed rugosity. Rhodolith and rocky substrate are ecologically important, yet the available mask did not cover the full domain and could not be treated as confirmed absence. Multibeam backscatter, seabed video, and classified hard-bottom maps are required before substrate can be applied as a defensible hard mask.
The productivity literature for Laminariales is extensive, but its breadth does not eliminate the transferability problem. The exact-genus audit included 133 positive Laminaria records from seven taxa and 26 source references, with measurement years spanning 1967–2019, yet only one observation overlapped the 45–70 m analytical interval. The L. ochroleuca value is therefore retained only as an illustrative depth-overlapping analog, not as evidence of physiological equivalence. The study-level Laminaria envelope spans 0.339–85.849 g C m−2 yr−1 and expands the full-occupancy gross NPP scenario from 4242 to 1,074,367 t C yr−1 around the 279,326 t C yr−1 central value. The breadth of this range does not validate the central estimate; it demonstrates that cross-species, cross-region, methodological, and temporal transferability overwhelms apparent numerical precision. Mesophotic light, South Atlantic Central Water, nutrients, temperature, respiration, erosion, dissolved release, and seasonality may cause local NPP to fall outside even this envelope. Direct measurements of L. abyssalis photosynthesis and annual production remain the central data gap.
The reference 11% fraction is not a measured export efficiency, burial rate, or 100-year permanence probability. Occupancy and retention therefore remain deterministic at explicitly stated values, while NPP uncertainty is represented by the empirical genus-transferability envelope. We do not combine these components into a probability-based confidence interval because their regional distributions are unknown. This separation makes the multiplicative dependence transparent without presenting false precision.
Regional Brazil Current dynamics, shelf-break upwelling, South Atlantic Central Water intrusions, and topographic features make cross-shelf transport plausible [7,11], but no hydrodynamic model links the retained cells to bathyal or pelagic sinks. Exported material may instead subsidize herbivores and benthic food webs and be rapidly remineralized [4,16,18,33,34,35]. The study therefore does not allocate production among local consumption, bathyal deposition, pelagic transport, dissolved pathways, or permanent burial.
Regional evidence from a mesophotic rhodolith bed in the Campos Basin confirms a diverse benthic fauna, including 27 echinoderm and 24 crustacean taxa [36]. Our Dropcam imagery likewise documents mobile fauna within the L. abyssalis habitat (Figure S1), although it was not designed to estimate consumer density. However, consumer densities, kelp-detritus ingestion rates, and microbial degradation rates have not been quantified specifically within these deep kelp beds. Local grazing, detritivory, and microbial decomposition could therefore accelerate remineralization and reduce long-term retention; this uncertainty is one reason the analysis includes a 1% retention sensitivity case rather than treating 11% as a measured regional rate.
Rhodolith calcification can affect the inorganic-carbon balance, while kelp fixes organic carbon. Because calcification, dissolution, alkalinity, air–sea exchange, and sedimentary preservation were not measured, no net positive climate balance is inferred for the coupled habitat [18]. Likewise, the model provides no information on dissolved organic carbon, bicarbonate storage, or a nominal 1% burial rate; unsupported claims involving these pathways have been removed.
The conservation case does not depend on carbon accounting. L. abyssalis is endemic, habitat-forming, and projected to lose suitable habitat under warming [9,10]. Associated services include structural habitat, refuge, nursery and feeding opportunities, benthic production, trophic connectivity, and support for regional biodiversity [15,16,33,34,35,37,38,39,40]. Offshore wind, cables, anchoring, bottom-contact activities, sedimentation, and climate anomalies require project-specific risk assessment; artificial hard substrate should not be assumed to replace endemic natural habitat [10].
For marine spatial planning, an unvalidated cell should trigger a field-survey requirement rather than automatic exclusion or approval. A practical sequence is: multibeam and backscatter mapping; stratified video transects with calibrated scale; occupancy and percent-cover estimation; seasonal biomass and tissue-carbon sampling; in situ photosynthesis or oxygen-flux measurements; current meters and particle tracking; detrital tagging or biomarkers; sediment traps; sediment cores with radiometric dating and source tracers; and repeated monitoring of remineralization and permanence. Restoration at 55 m is not recommended as an assumed mitigation measure until technical feasibility is demonstrated.
5. Conclusions
We present a transparent theoretical screening workflow for mesophotic kelp habitat. The imported SDM and bathymetry identified 169 center cells, but high-resolution fractional depth reduced the primary 45–70 m planimetric support to 12,514.60 km2. The 23 positive records formed 19 cells, with only seven inside the retained domain. IDW failed leave-one-out validation (p = 0.5, r = −0.389; RMSE 1.66% above p = 0), so no regional biomass surface, biomass stock, or biomass-derived productivity estimate is supported.
Under complete occupancy, the central genus-level analog produced a conditional gross NPP scenario of 279,326 t C yr−1, while the empirical NPP-transferability envelope was 4242–1,074,367 t C yr−1. At the assumed 11% long-term fraction, the central annual and 100-year static equivalents were 30,726 t C yr−1 and 3.07 million t C; the corresponding extrapolation envelopes were 467–118,180 t C yr−1 and 0.047–11.82 million t C. These numbers are deliberately labeled as assumption-dependent screening values and must not be represented as measured export, a carbon sink, verified sequestration, or a basis for carbon credits. Climate-driven niche loss, changes in Brazil Current and upwelling dynamics, consumption, remineralization, uncertain transport destinations, and the exceptionally broad NPP transferability range could reduce or eliminate long-term retention.
The central conclusion is that field measurement must precede carbon-accounting claims. Priority data are occupied cover, seasonal biomass with documented mass basis, local NPP under mesophotic light, substrate extent, detrital transport, consumption and remineralization, depositional sinks, source attribution, burial rates, and permanence. Even if future work finds zero durable carbon retention, the endangered, endemic, habitat-forming, and biodiversity-supporting status of L. abyssalis remains unchanged. The workflow may be adapted to other deep kelps, but the Brazilian numerical scenarios are not globally transferable.
Supplementary Materials
The following supporting information can be downloaded at: https://www.mdpi.com/article/10.3390/coasts6030035/s1. Supplementary Table S1. Biomass observations and literature-based metadata. Table S1a contains the 23 positive biomass records and the quantitative and spatial fields used in the analysis, including coordinates, biomass, raster assignment, center-cell depth, model-support status, and analytical-domain overlap. Table S1b summarizes all verifiable study-level metadata documented in the cited literature, including sampling periods, reported depths, biomass measurement conventions, and collection procedures. Source-level metadata are not assigned to individual observations without a documented direct record linkage. Supplementary Table S2. Complete leave-one-out IDW diagnostics for p = 0–3.0 in 0.05 increments, selected-power summaries, observed-versus-predicted values at p = 0.5, and an explicit coordinate-basis audit. The primary analysis uses native SDM raster-cell centroids projected to EPSG:5880; mean original observation coordinates are retained only as a diagnostic record of an earlier draft convention. Supplementary Table S3. The 169 retained analytical cells, including cell centroid, center-cell depth, high-resolution fractional 45–70 m coverage, planimetric fractional area, imported SDM suitability, and conditional area-based NPP and retained-carbon fields. No biomass-interpolated NPP is included. Supplementary Table S4. Spatial-support audit comparing the center-cell 45–70 m upper bound, the high-resolution fractional-depth primary support, and the rhodolith-overlap audit. The rhodolith overlap is not treated as a validated lower bound because substrate coverage is incomplete. Supplementary Table S5. Deterministic occupancy × long-term-retention × time-horizon scenarios evaluated at the central 22.32 g C m−2 yr−1 analog. These values are conditional sensitivity scenarios, not probability distributions or forecasts. Supplementary Table S6. Historical Laminaria NPP study-group audit, empirical 2.5–97.5% depth-centered transferability envelope, coverage by taxon and measurement decade, and all propagated occupancy × retention × horizon scenarios for the lower, central, and upper NPP anchors. Supplementary Figure S1. In situ Dropcam imagery of the mesophotic L. abyssalis habitat; the images are qualitative habitat documentation and do not quantify canopy cover, biomass, occupied area, production, or carbon retention. Supplementary Figure S2. Uncropped present-day ensemble SDM input. Viridis colors represent relative suitability across the complete raster extent and are not interpreted as abundance or occupancy. Supplementary Figure S3. Historical Laminaria productivity evidence, showing the empirical depth-centered NPP transferability distribution and study-group coverage by measurement decade and taxon. Supplementary Figure S4. Complete IDW falsification and validation audit, including the p = 0 non-spatial benchmark and the primary p = 0.5 raster-cell-centroid diagnostic. Supplementary Figure S5. Spatial-support audit comparing the center-cell, high-resolution fractional-depth, and rhodolith-overlap support definitions. Supplementary Figure S6. Complete deterministic scenario envelope across occupancy, long-term-retention fraction, time horizon, and the empirical lower, central, and upper Laminaria NPP anchors.
Author Contributions
Conceptualization, A.B.A., A.V. and A.F.B.; Methodology, A.B.A. and A.F.B.; Software, A.B.A.; Validation, A.B.A., L.P.G., A.V., G.C.C. and A.F.B.; Formal analysis, A.B.A.; Investigation, A.B.A.; Resources, A.B.A.; Data curation, A.B.A.; Writing—original draft, A.B.A. and A.F.B.; Writing—review and editing, A.B.A., L.P.G., A.V., G.C.C., P.A.H., L.R.S.d.L. and A.F.B.; Visualization, A.B.A.; Supervision, A.B.A. and A.F.B.; Project administration, A.B.A. and A.F.B.; Funding acquisition, A.B.A. and A.F.B. All authors have read and agreed to the published version of the manuscript.
Funding
This research was funded by the Espírito Santo Research and Innovation Support Foundation (FAPES) through the ERA-NET Cofund BiodivRestore/RESTORESEAS project (Term of Grant No. 144/2022; Process No. 2022-F1XR8), within the BiodivRestore Joint Call of BiodivERsA and Water JPI, co-funded by the European Commission under Horizon 2020 grant agreement No. 101003777. Additional support was provided by FAPES and the National Council for Scientific and Technological Development (CNPq) through PROEX (Support Program for Centers of Excellence; 2022-VFV09) and the Long-Term Ecological Research Program (PELD; grants 441107/2020-6 and 2021-WBHJB). A.B.A. received a FAPES Profix 2025 Postdoctoral Fellowship, and A.F.B. is supported by a CNPq PQ Fellowship.
Data Availability Statement
A repository-ready archive containing the complete R pipeline, derived tables, figure-source data, package-version outputs, session information, and redistribution-permitted inputs accompanies this article. The archive is deposited in Zenodo (DOI 10.5281/zenodo.21722715).
Acknowledgments
This is a PELD-HCES production #29. During revision, the first author used OpenAI ChatGPT (GPT-5.6 Sol; accessed 1 August 2026) to assist with grammar, document formatting, and code review. All scientific interpretations, numerical choices, citations, and revisions were reviewed and approved by the authors, who take full responsibility for the final content.
Conflicts of Interest
The authors declare no conflicts of interest.
References
- Duarte, C.M.; Cebrián, J. The fate of marine autotrophic production. Limnol. Oceanogr. 1996, 41, 1758–1766. [Google Scholar] [CrossRef] [Scilit]
- McLeod, E.; Chmura, G.L.; Bouillon, S.; Salm, R.; Björk, M.; Duarte, C.M.; Lovelock, C.E.; Schlesinger, W.H.; Silliman, B.R. A blueprint for blue carbon: Toward an improved understanding of the role of vegetated coastal habitats in sequestering CO2. Front. Ecol. Environ. 2011, 9, 552–560. [Google Scholar] [CrossRef] [Scilit]
- Bernardino, A.F.; Mazzuco, A.C.A.; Costa, R.F.; Souza, F.; Owuor, M.A.; Nobrega, G.N.; Sanders, C.J.; Ferreira, T.O.; Kauffman, J.B. The inclusion of Amazon mangroves in Brazil’s REDD+ program. Nat. Commun. 2024, 15, 1549. [Google Scholar] [CrossRef] [Scilit] [PubMed]
- Krumhansl, K.A.; Scheibling, R.E. Production and fate of kelp detritus. Mar. Ecol. Prog. Ser. 2012, 467, 281–302. [Google Scholar] [CrossRef] [Scilit]
- Krause-Jensen, D.; Duarte, C.M. Substantial role of macroalgae in marine carbon sequestration. Nat. Geosci. 2016, 9, 737–742. [Google Scholar] [CrossRef] [Scilit]
- Krause-Jensen, D.; Lavery, P.; Serrano, O.; Marbà, N.; Masqué, P.; Duarte, C.M. Sequestration of macroalgal carbon: The elephant in the Blue Carbon room. Biol. Lett. 2018, 14, 20180236. [Google Scholar] [CrossRef] [Scilit] [PubMed]
- Campos, E.J.D.; Velhote, D.; da Silveira, I.C.A. Shelf break upwelling driven by Brazil Current cyclonic meanders. Geophys. Res. Lett. 2000, 27, 751–754. [Google Scholar] [CrossRef] [Scilit]
- Quintana, C.O.; Bernardino, A.F.; Moraes, P.C.; Valdemarsen, T.; Sumida, P.Y.G. Effects of coastal upwelling on the structure of macrofaunal communities in SE Brazil. J. Mar. Syst. 2015, 143, 120–129. [Google Scholar] [CrossRef] [Scilit]
- Anderson, A.B.; Assis, J.; Batista, M.B.; Serrão, E.A.; Guabiroba, H.C.; Delfino, S.D.T.; Pinheiro, H.T.; Pimentel, C.R.; Gomes, L.E.O.; Vilar, C.C.; et al. Global warming assessment suggests the endemic Brazilian kelp beds to be an endangered ecosystem. Mar. Environ. Res. 2021, 168, 105307. [Google Scholar] [CrossRef] [Scilit] [PubMed]
- Anderson, A.B.; Opsahl-Sorteberg, H.G.; Gomes, L.E.O.; Horta, P.; Serrão, E.; Chapman, A.S.; Joyeux, J.-C. Offshore wind farms threaten the endangered Brazilian kelp Laminaria abyssalis: A call for urgent nature-positive action. Ocean Coast. Manag. 2025, 267, 107737. [Google Scholar] [CrossRef] [Scilit]
- Arruda, W.Z.; da Silveira, I.C.A. Dipole-induced Central Water extrusions south of Abrolhos Bank (Brazil, 20.5°S). Cont. Shelf Res. 2019, 188, 103976. [Google Scholar] [CrossRef] [Scilit]
- Pessarrodona, A.; Assis, J.; Filbee-Dexter, K.; Burrows, M.T.; Gattuso, J.-P.; Duarte, C.M.; Krause-Jensen, D.; Moore, P.J.; Smale, D.A.; Wernberg, T. Global seaweed productivity. Sci. Adv. 2022, 8, eabn2465. [Google Scholar] [CrossRef] [Scilit] [PubMed]
- Pessarrodona, A.; Filbee-Dexter, K.; Krumhansl, K.A.; Pedersen, M.F.; Moore, P.J.; Wernberg, T. A global dataset of seaweed net primary productivity. Sci. Data 2022, 9, 484. [Google Scholar] [CrossRef] [Scilit] [PubMed]
- Drew, E.A. An ecological study of Laminaria ochroleuca Pyl. growing below 50 metres in the Straits of Messina. J. Exp. Mar. Biol. Ecol. 1974, 15, 11–24. [Google Scholar] [CrossRef] [Scilit]
- Duarte, C.M.; Gattuso, J.-P.; Hancke, K.; Gundersen, H.; Filbee-Dexter, K.; Pedersen, M.F.; Middelburg, J.J.; Burrows, M.T.; Krumhansl, K.A.; Wernberg, T.; et al. Global estimates of the extent and production of macroalgal forests. Glob. Ecol. Biogeogr. 2022, 31, 1422–1439. [Google Scholar] [CrossRef] [Scilit]
- Pedersen, M.F.; Filbee-Dexter, K.; Norderhaug, K.M.; Fredriksen, S.; Frisk, N.L.; Fagerli, C.W.; Wernberg, T. Detrital carbon production and export in high latitude kelp forests. Oecologia 2020, 192, 227–239. [Google Scholar] [CrossRef] [Scilit] [PubMed]
- Marins, B.V.; Amado-Filho, G.M.; Barreto, M.B.B.; Longo, L.L. Taxonomy of the southwestern Atlantic endemic kelp: Laminaria abyssalis and Laminaria brasiliensis (Phaeophyceae, Laminariales) are not different species. Phycol. Res. 2012, 60, 51–60. [Google Scholar] [CrossRef] [Scilit]
- Queirós, A.M.; Stephens, N.; Widdicombe, S.; Tait, K.; McCoy, S.J.; Ingels, J.; Rühl, S.; Airs, R.; Beesley, A.; Carnovale, G.; et al. Connected macroalgal–sediment systems: Blue carbon and food webs in the deep coastal ocean. Ecol. Monogr. 2019, 89, e01366. [Google Scholar] [CrossRef] [Scilit]
- Elith, J.; Leathwick, J.R. Species distribution models: Ecological explanation and prediction across space and time. Annu. Rev. Ecol. Evol. Syst. 2009, 40, 677–697. [Google Scholar] [CrossRef] [Scilit]
- GEBCO Compilation Group. GEBCO 2025 Grid; GEBCO Compilation Group: Liverpool, UK, 2025. [Google Scholar] [CrossRef]
- Rosa, B.V.M. Aspectos biológicos de Laminaria abyssalis: Taxonomia, filogenia molecular, parâmetros populacionais, composição química e flora associada. Ph.D. Thesis, Programa de Pós-Graduação em Botânica, Escola Nacional de Botânica Tropical, Instituto de Pesquisas Jardim Botânico do Rio de Janeiro, Rio de Janeiro, Brazil, 2009. [Google Scholar]
- Marins, B.V.; Amado-Filho, G.M.; Barbarino, E.; Pereira-Filho, G.H.; Longo, L.L. Seasonal changes in population structure of the tropical deep-water kelp Laminaria abyssalis. Phycol. Res. 2014, 62, 55–62. [Google Scholar] [CrossRef] [Scilit]
- Quége, N. Laminaria (Phaeophyta) No Brasil—Uma Perspectiva Econômica. Master’s Dissertation, Instituto de Biociências, Universidade de São Paulo, São Paulo, Brazil, 1988. [Google Scholar]
- Shepard, D. A two-dimensional interpolation function for irregularly-spaced data. In Proceedings of the 1968 23rd ACM National Conference, Las Vegas, NV, USA, 27–29 August 1968; pp. 517–524. [Google Scholar] [CrossRef] [Scilit]
- Roberts, D.R.; Bahn, V.; Ciuti, S.; Boyce, M.S.; Elith, J.; Guillera-Arroita, G.; Hauenstein, S.; Lahoz-Monfort, J.J.; Schröder, B.; Thuiller, W.; et al. Cross-validation strategies for data with temporal, spatial, hierarchical, or phylogenetic structure. Ecography 2017, 40, 913–929. [Google Scholar] [CrossRef] [Scilit]
- Pianosi, F.; Beven, K.; Freer, J.; Hall, J.W.; Rougier, J.; Stephenson, D.B.; Wagener, T. Sensitivity analysis of environmental models: A systematic review with practical workflow. Environ. Model. Softw. 2016, 79, 214–232. [Google Scholar] [CrossRef] [Scilit]
- R Core Team. R: A Language and Environment for Statistical Computing; R Foundation for Statistical Computing: Vienna, Austria, 2026. [Google Scholar]
- Hijmans, R.J.; Brown, A.; Barbosa, M. Terra: Spatial Data Analysis, R package version 1.9-23; The R Foundation: Vienna, Austria, 2026. [Google Scholar]
- Pebesma, E. Simple Features for R: Standardized support for spatial vector data. R J. 2018, 10, 439–446. [Google Scholar] [CrossRef] [Scilit]
- Pebesma, E.; Bivand, R. Spatial Data Science: With Applications in R; Chapman and Hall/CRC: Boca Raton, FL, USA, 2023. [Google Scholar] [CrossRef] [Scilit]
- Wickham, H. ggplot2: Elegant Graphics for Data Analysis; Springer: New York, NY, USA, 2016. [Google Scholar]
- Garnier, S.; Ross, N.; Rudis, R.; Camargo, A.P.; Sciaini, M.; Scherer, C. viridis(Lite): Colorblind-Friendly Color Maps for R, R package version 0.6.5; CRAN (Comprehensive R Archive Network): Vienna, Austria, 2026. [Google Scholar] [CrossRef] [Scilit]
- Bernardino, A.F.; Smith, C.R.; Baco, A.; Altamira, I.; Sumida, P.Y.G. Macrofaunal succession in sediments around kelp and wood falls in the deep NE Pacific and community overlap with other reducing habitats. Deep. Sea Res. Part I Oceanogr. Res. Pap. 2010, 57, 708–723. [Google Scholar] [CrossRef] [Scilit]
- Bauer, K.W.; Correa, P.V.F.; Lupin, A.; Mellon, S.; Fakhraee, M.; Savage, A.C.; Tune, A.K.; Slonimer, A.L.; Rochlin, B.; De Leo, F.C. In-situ deep ocean monitoring reveals rapid kelp degradation limits marine biomass-based carbon sequestration potential and alters benthic ecosystems. Commun. Earth Environ. 2026, 7, 367. [Google Scholar] [CrossRef] [Scilit]
- Filbee-Dexter, K.; Pessarrodona, A.; Pedersen, M.F.; Wernberg, T.; Duarte, C.M.; Assis, J.; Bekkby, T.; Burrows, M.T.; Carlson, D.F.; Gattuso, J.-P.; et al. Carbon export from seaweed forests to deep ocean sinks. Nat. Geosci. 2024, 17, 552–559. [Google Scholar] [CrossRef] [Scilit]
- Tâmega, F.T.S.; Paiva, P.C.; Spotorno, P.; Pires, D.O.; Berlandi, R.M.; Brasil, A.C.S.; Serejo, C.; Cardoso, I.A.; Ventura, C.R.R.; Granthom-Costa, L.V.; et al. Associated fauna in a mesophotic rhodolith bed in the Campos Basin, Brazil, southwestern Atlantic. Reg. Stud. Mar. Sci. 2024, 75, 103529. [Google Scholar] [CrossRef] [Scilit]
- De Leo, F.C.; Bernardino, A.F.; Sumida, P.Y.G. Continental slope and submarine canyons: Benthic biodiversity and human impacts. In Brazilian Deep-Sea Biodiversity; Sumida, P.Y.G., Bernardino, A.F., De Leo, F.C., Eds.; Springer: Cham, Switzerland, 2020. [Google Scholar] [CrossRef] [Scilit]
- Saeedi, H.; Bernardino, A.F.; Shimabukuro, M.; Falchetto, G.; Sumida, P.Y. Macrofaunal community structure and biodiversity patterns based on a wood-fall experiment in the deep South Atlantic. Deep. Sea Res. Part I 2019, 145, 73–82. [Google Scholar] [CrossRef] [Scilit]
- Franco, J.N.; Sainz Meyer, H.; Babe, O.; Martins, M.; Reis, B.; Sánchez-Gallego, A.; Lemos, M.F.L.; Dolbeth, M.; Sousa-Pinto, I.; Arenas, F. Potential blue carbon in the fringe of Southern European kelp forests. Sci. Rep. 2025, 15, 29573. [Google Scholar] [CrossRef] [Scilit] [PubMed]
- McHenry, J.; Okamoto, D.K.; Filbee-Dexter, K.; Krumhansl, K.A.; MacGregor, K.A.; Hessing-Lewis, M.; Timmer, B.; Archambault, P.; Attridge, C.M.; Cottier, D.; et al. A blueprint for national assessments of the blue carbon capacity of kelp forests applied to Canada’s coastline. npj Ocean Sustain. 2025, 4, 30. [Google Scholar] [CrossRef] [Scilit] [PubMed]
Disclaimer/Publisher’s Note: The statements, opinions and data contained in all publications are solely those of the individual author(s) and contributor(s) and not of MDPI and/or the editor(s). MDPI and/or the editor(s) disclaim responsibility for any injury to people or property resulting from any ideas, methods, instructions or products referred to in the content. |
© 2026 by the authors. Licensee MDPI, Basel, Switzerland. This article is an open access article distributed under the terms and conditions of the Creative Commons Attribution (CC BY) license.