Article

Identifying Optimal Stirrer Geometries for Aqueous Textile Suspensions Using Material Extrusion Based Rapid Prototyping


by
Doris Ostner-Kaineder
1,*,
Christoph Strasser
1,
Barbara Liedl
1,2,
Mark W. Hlawitschka
3 and
Christoph Burgstaller
1
1
School of Engineering, University of Applied Science Upper Austria, Stelzhamerstraße 23, 4600 Wels, Austria
2
Transfercenter für Kunststofftechnik GmbH, Franz-Fritsch-Straße 11, 4600 Wels, Austria
3
Institute of Process Engineering, Johannes Kepler University Linz, Altenbergerstraße 69, 4040 Linz, Austria
*
Author to whom correspondence should be addressed.
AppliedChem 2026, 6(2), 31; https://doi.org/10.3390/appliedchem6020031
Submission received: 18 February 2026 / Revised: 7 April 2026 / Accepted: 23 April 2026 / Published: 2 May 2026

Abstract

Increasing amounts of textile waste require rapid implementation of novel recycling technologies. Biocatalytic degradation via enzymatic hydrolysis can be used to separate blends, which are otherwise inaccessible. However, the complex nature of the substrate and narrow operating window of the reaction necessitates process optimization but also complicates computational approaches. The reaction is performed in aqueous suspension at ambient pressure and temperatures well below boiling. Due to the gentle process conditions, preliminary assessment of ideal stirrer geometries can be performed in water under ambient conditions, using stirrers produced from commodity plastics using material extrusion-based 3D-printing at both bench (2 L) and semi-pilot (30 L) scale. Eight geometries were assessed using suspension activity (via cloud height), mixing energy consumption, and mixing time assessment via tracer addition at the bench scale. Four of these geometries were chosen for scale-up in a 30 L conical vessel. While large, especially close-clearance mixing equipment performed well at both sizes, an increase in performance of the pitched-blade turbine was observed at 30 L. This highlights the necessity of experimental scaleup procedure as well as optimized stirrer geometries for enzymatic hydrolysis.

1. Introduction

Since textile manufacturing continually increases and garment lifetime simultaneously decreases, end-of-life solutions for the resulting waste are required [1]. Currently, the majority of textile waste is either thermally recovered or landfilled, both in official landfills and through unofficial waste dumping [2]. To avoid the resulting strain on the environment and recover the resource- and often energy-intense component materials of a garment, numerous recycling strategies have been reported [3,4]. Both the waste stream in general as well as individual garments can be highly inhomogeneous and contain both cellulose and different synthetic polymers. Therefore, purely mechanical recycling is often difficult. Chemical recycling can be used to recover pure monomers from contaminated input material, but also for targeted dissolution and separation of blended materials [4].
The most common textile blends are elastane with polyamide or polyester, and cotton with polyester. The latter consists of the two most common textile materials (approximately 25 and 50% market share) and is therefore the focus of this publication [5]. Either component can be recycled mechanically. However, the thermal degradation of the cotton and high tear resistance of the polyester render the established mono-material methods unsuitable for the blend [6]. Chemical recycling methods have been applied to both components. The cotton can be separated via dissolution and filtration, the polyester can be degraded chemically, and either material can be subjected to enzymatic hydrolysis [7,8,9,10]. The latter is especially desirable from an environmental perspective, since it does not require high pressures, temperatures, or the use of organic solvents. The reaction products are either monomers (terephthalic acid, ethylene glycol, glucose) or purified polymers (polyester, cellulose) that may be introduced into other processes [11,12]. Biocatalytic degradation is a surface process that is highly sensitive to temperature variation. Product inhibition can occur due to local maxima [13], while excessive mixing shear can lead to deactivation of the catalyst [14,15]. Efficient process design therefore requires a mixing process that promotes efficient heat transfer and creates homogenous reactant suspensions under minimum shear.
Post-consumer recycled textiles undergo size reduction before further processing. One cost-effective method is size diminution via cutting or shredding [16], as seen in open loop recycling applications such as insulation [17]. However, as shown in our previous publication [18], this leads to complex substrates. Textile shreds consist of several flexible, sometimes entangled, particle species of different sizes and morphologies. Depending on particle size, composition, and solid concentration, they can form shear-thinning networks in aqueous suspension, while still settling at the bottom of the vessel unless otherwise agitated. At a concentration of 1% (w/v), suspensions behaved more as a particle-in-water mixture, while 3 and 5% (w/v) textile suspensions behaved as networks. Stirred suspensions are commonly opaque at solid loads typical for enzymatic cellulose hydrolysis, due to the combination of coherent particles and loose fibers contained within the substrate.
Both numerical and analytical analysis of flexible particles in non-Newtonian flow is highly complex, resource-intense and often limited to specific cases such as low volume fractions and entanglements [19,20]. The aim of this paper is therefore rapid prototyping for the experimental evaluation of stirrer mixing and energy efficiency. This methodology has recently found widespread success in small-scale laboratory equipment manufacturing, allowing quick and comparatively cheap creation of custom geometries of mixing equipment [21,22].
The experiments were limited to standard geometries, since chemical textile recycling ventures still suffer from limited economic success [11,23,24]. Process optimization should therefore be considered within the context of low-investment integration of existing technology. Due to their longstanding use, much research has been conducted into the flow behavior and ideal field of use of these standard geometries [25,26]. For example, Rushton turbines are commonly used for rapid dispersion of a gas phase, while pitched-blade turbines are used to disperse solid particles [26]. When working with viscous fluids and/or shear thinning materials such as dough or biomass slurries, other shapes such as anchor and ribbon impellers are more commonly used [26]. When attempting to choose an ideal geometry for optimized biochemical textile recycling according to these guidelines, the problem of concentration-dependent behavior of these suspensions arises.
Therefore, a preliminary array of eight stirrer geometries for varying fields of application was produced and tested on a bench-scale cylindrical vessel, in both water, aqueous suspension and carboxymethyl cellulose solution as a standard, homogenous non-Newtonian fluid. Of these eight initial geometries, two promising and two poorly performing candidates (different flow patterns and viscosity application ranges) were further investigated. Semi-pilot scale experiments were performed on textile suspensions, in a conical vessel which was similar in volume and proportion to an actual hydrolysis reaction vessel used in a research project stationed at a company partner. Mixing and energy efficiency was investigated by several key performance indicators: energy consumption, cloud-height and colorimetric mixing time [27,28] assessment to determine an optimal stirrer geometry for future reaction optimization.

2. Materials and Methods

White polyester–cotton blend intended for workwear applications (65% polyester, 35% cotton; ATM Handel & Service GmbH, Winsen, Germany) was purchased from retail. The material was shredded using a ML33 cutting mill (Wittmann, Vienna, Austria) with a 15 mm sieve insert. Carboxy methyl cellulose (CMC), with a specification of achieving a viscosity of 2.5–6 Pa·s−1 in a 1% (w/v) aqueous solution at room temperature, was purchased from Sigma-Aldrich (Merck KGaA, Vienna, Austria) and used without further processing. Deionized water was produced using a DIA 4000MB ion exchange cartridge (EnviroFALK GmbH, Haimhausen, Germany).
For preliminary small-scale experiments, an Anton Paar Physica MCR 301 with a ST-24D stirrer attachment (Anton Paar, Graz, Austria) was used for relative characterization of the textile suspension and homogenous CMC solution, as well as a Brookfield LVDV II (Metrohm Inula, Vienna, Austria) viscosimeter for obtaining absolute values of the homogenous substrate. A linear rotational speed ramp from 20 to 180 rpm was used for both textile suspension and CMC solution in the MCR, and viscosity of 1% (w/v) CMC solution was confirmed using an LV 4 spindle (also from Metrohm) at 30 rpm in the Brookfield viscosimeter at standard conditions.
Stirrers were fabricated by material-extrusion-based additive manufacturing (MEX) using a conventional 3D-printer (Prusa XL, Prusa Research a.s., Prague, Czech Republic) and white polylactic acid (PLA) filament (ecoPLA, 3D-Jake niceshops GmbH, Paldau, AT, Austria). Printing was performed using a modified standard 0.2 mm layer-height printing profile, with gcode created using PrusaSlicer 2.9.4 (Prusa Research a.s., Prague, Czech Republic). The modifications included three perimeters, six solid top and bottom layers, an infill density of 25% and organic support structure if required.
Stirrer configuration is shown in Table 1 and Figure 1, with the letter D referring to diameter, H meaning height and B bottom clearance. The subscripts S and T represent stirrer and tank dimensions respectively. Dimensions were chosen from standard textbooks, producer recommendations, and scientific literature. For the 30 L experiments, bottom clearance could not be observed due to the conical bottom of the vessel; instead, a constant bottom clearance B of 163 mm was used.
The 3D-printed parts were attached to a hexagonal stainless-steel bar (d = 11 mm; Fixmetall, Wels, Austria) using stainless steel M4 grub screws. A HeiTorque 400 programmable stirrer motor with a range of 10 to 400 rpm (Roth, Vienna, Austria) was used for both flow characterization and mixing time assessments. Energy consumption of the motor was further recorded using a Voltcraft SEM 500 DUAL (1 mW resolution, 1% accuracy; Conrad electronics, Vienna, Austria).
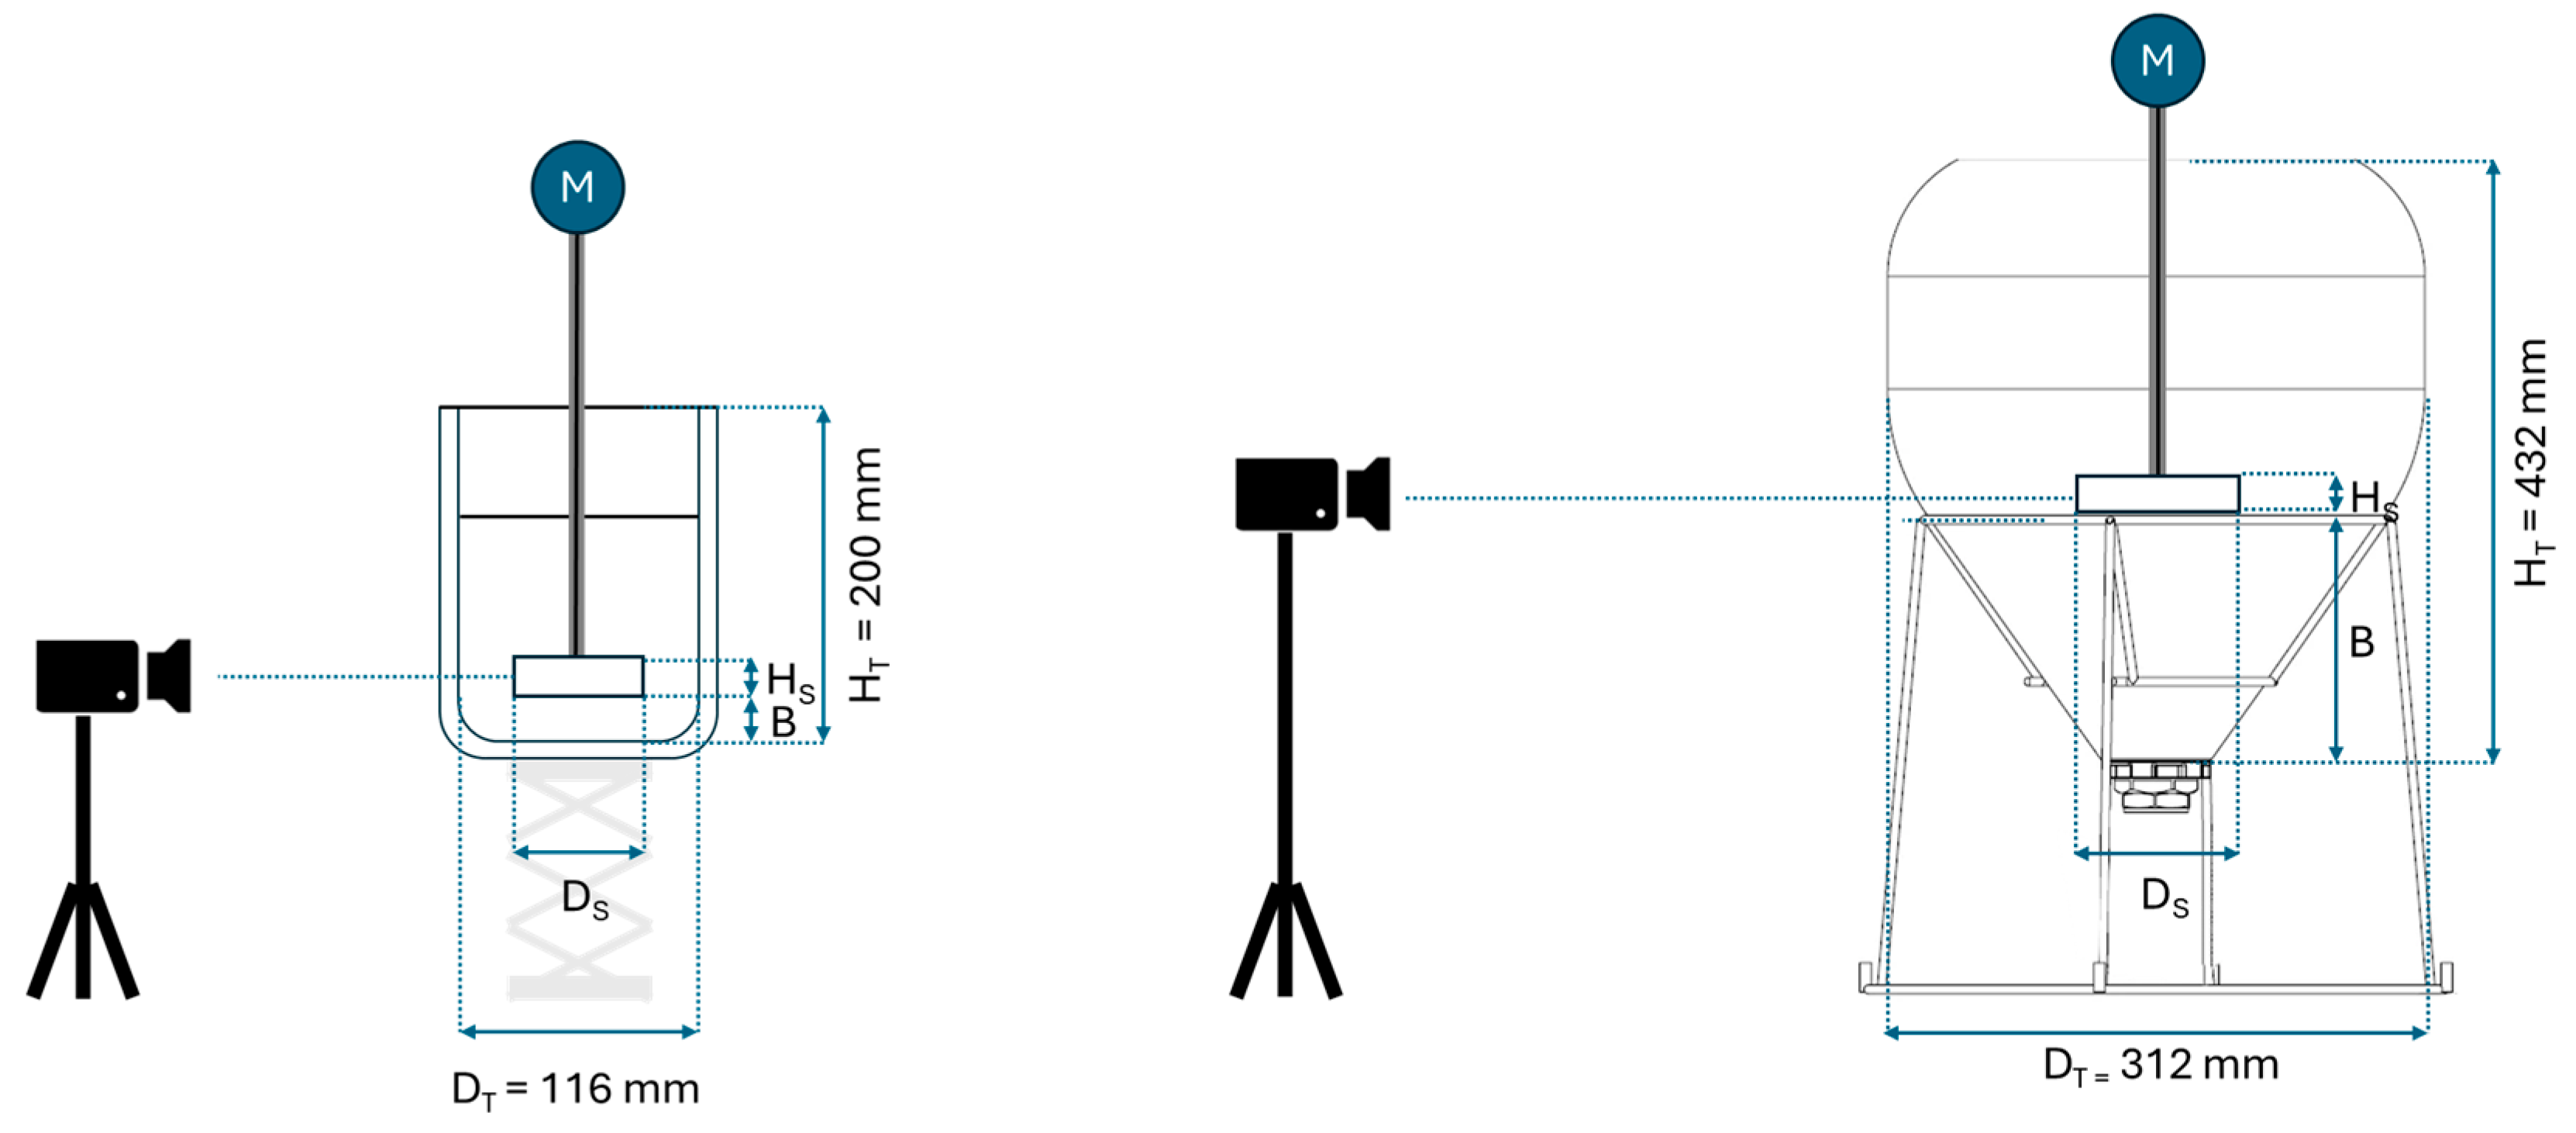
Mixing energy and time efficiency evaluation was performed in a 2 L double wall jacketed glass reactor (KGW isotherm, Ruprechter GmbH Glasbläserei—Laborbedarf, Breitenbach, Austria) and a transparent 30 L polyethylene terephthalate conical vessel (keg king unitank; MashCamp GmbH, Vienna, Austria). The wall gap of the glass reactor was filled with deionized water to prevent refractive interference of glass–air interfaces. Both vessels were filled to 75% of their maximum volume. Mixing efficiency experiments were performed at 0, 1 and 3% (w/v) of solid textile concentration, and 1% (w/v) of CMC concentration in water at room temperature. The experimental setup and tank dimensions are shown in Figure 2.
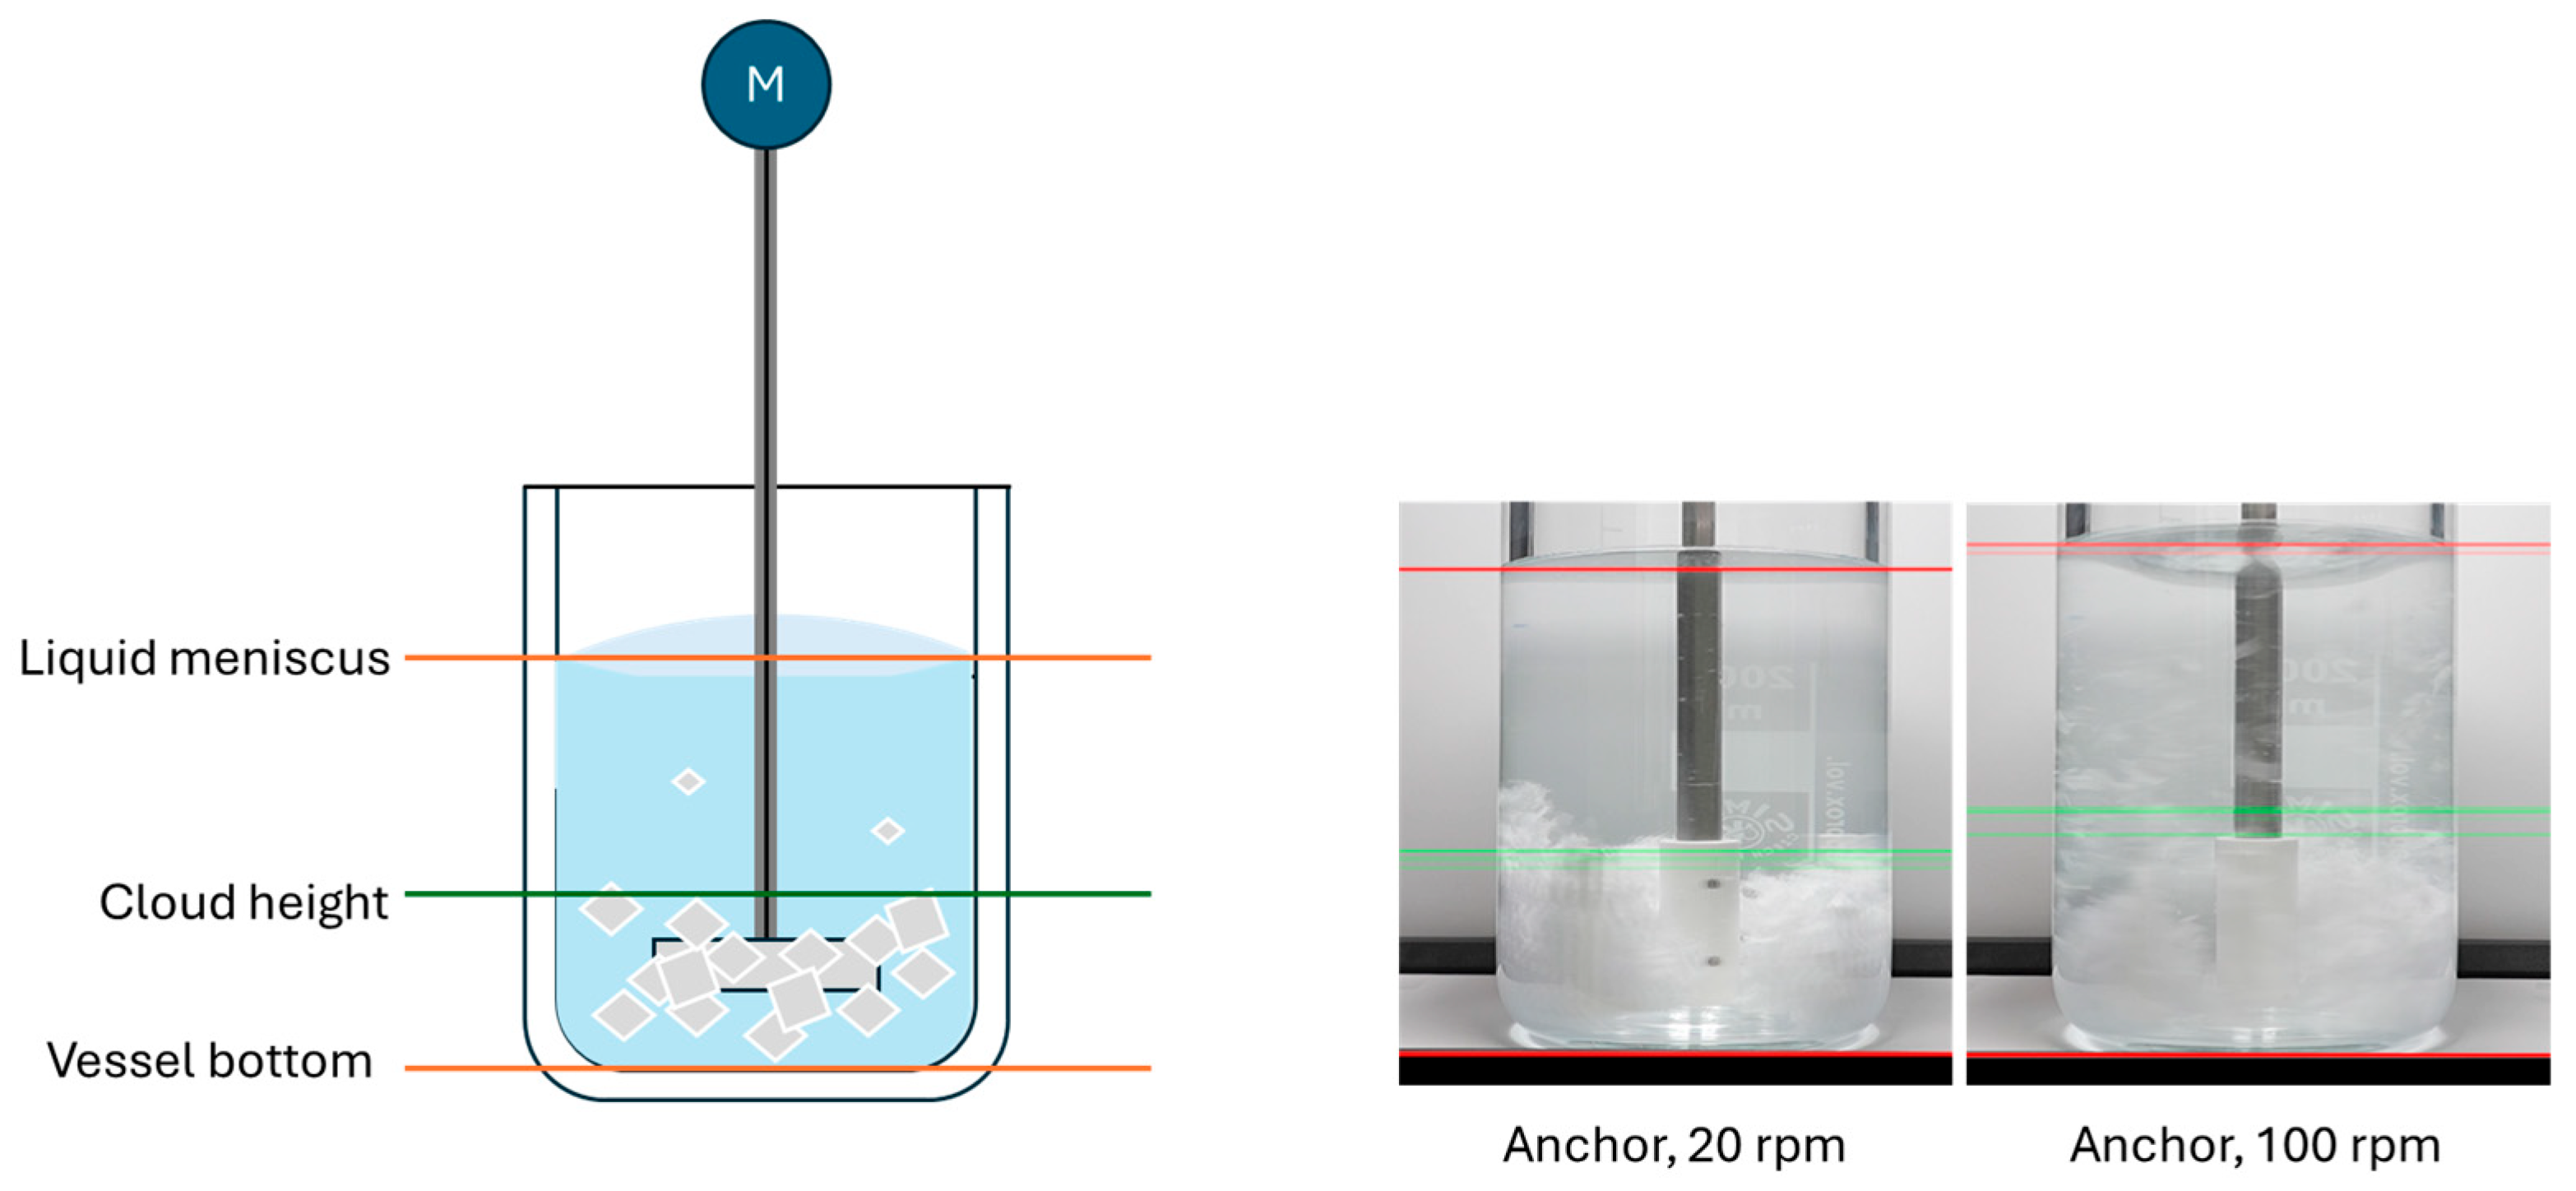
Mixing efficiency assessments were performed using a rotation speed ramp between 20 and 180 rpm for the largest subset of stirrers (DS = 0.9·DT) in 20 rpm steps, held for 2 min per step. Whenever possible, the ramp was extended to achieve equal tip speed for the smaller stirrers. For the two smallest (Rushton and pitched-blade turbines), the maximum possible speed of the motor, 400 rpm, was used instead. Images of the mixing experiments were recorded in 30 s intervals for cloud height evaluation, resulting in 4 images per motor speed. For each extracted frame, the bottom of the vessel, liquid level and cloud height were marked and average cloud height as percentage of the total liquid height was calculated. Textile shreds are inhomogeneous in size and geometry, allowing smaller particles to easily separate from the bulk. Chemical recycling requires high turnover. Limiting factors in enzymatic hydrolysis, such as local product maxima, occur in densely packed bulk regions. Therefore, for assessing the agitation effectiveness of various stirrers, cloud height was defined as the point below which the majority, but not necessarily the entirety of the material is visible. A schematic depiction as well as 2 averaged sample images can be seen in Figure 3. Energy consumption was measured for each stirrer in water and textile suspension (and CMC solution, at benchtop scale). A motor energy consumption curve was recorded at all investigated speeds without stirrer attachment and subtracted from measurements in media.
Mixing time was assessed for 3% textile suspension and 1% CMC solution, for all geometries at equal tip speed (or 400 rpm if necessary), by introducing 2.5 mL of aqueous methylene blue (4 × 10⁻⁴ and 6 × 10⁻³ mol L−1 for the 2 L and 30 L vessel respectively) into the reaction vessel. The color dispersion was filmed using a Sony alpha ZV-e10 camera (Amazon EU SARL, Munich, Germany), with a resolution of 1920 × 1080 px and a frame rate of 50 s−1. Color homogeneity of the suspension over time was assessed using a custom python script. The change in value was most distinct when observing the drop value of the opposite primary color (red). Color value-time plots were plotted in OriginPro Version 9.8.5 (OriginLab, Northampton, MA, USA). Final mixing time assessment was performed using first and second derivation of the measured curves.

3. Results and Discussion

3.1. Preliminary Characterization

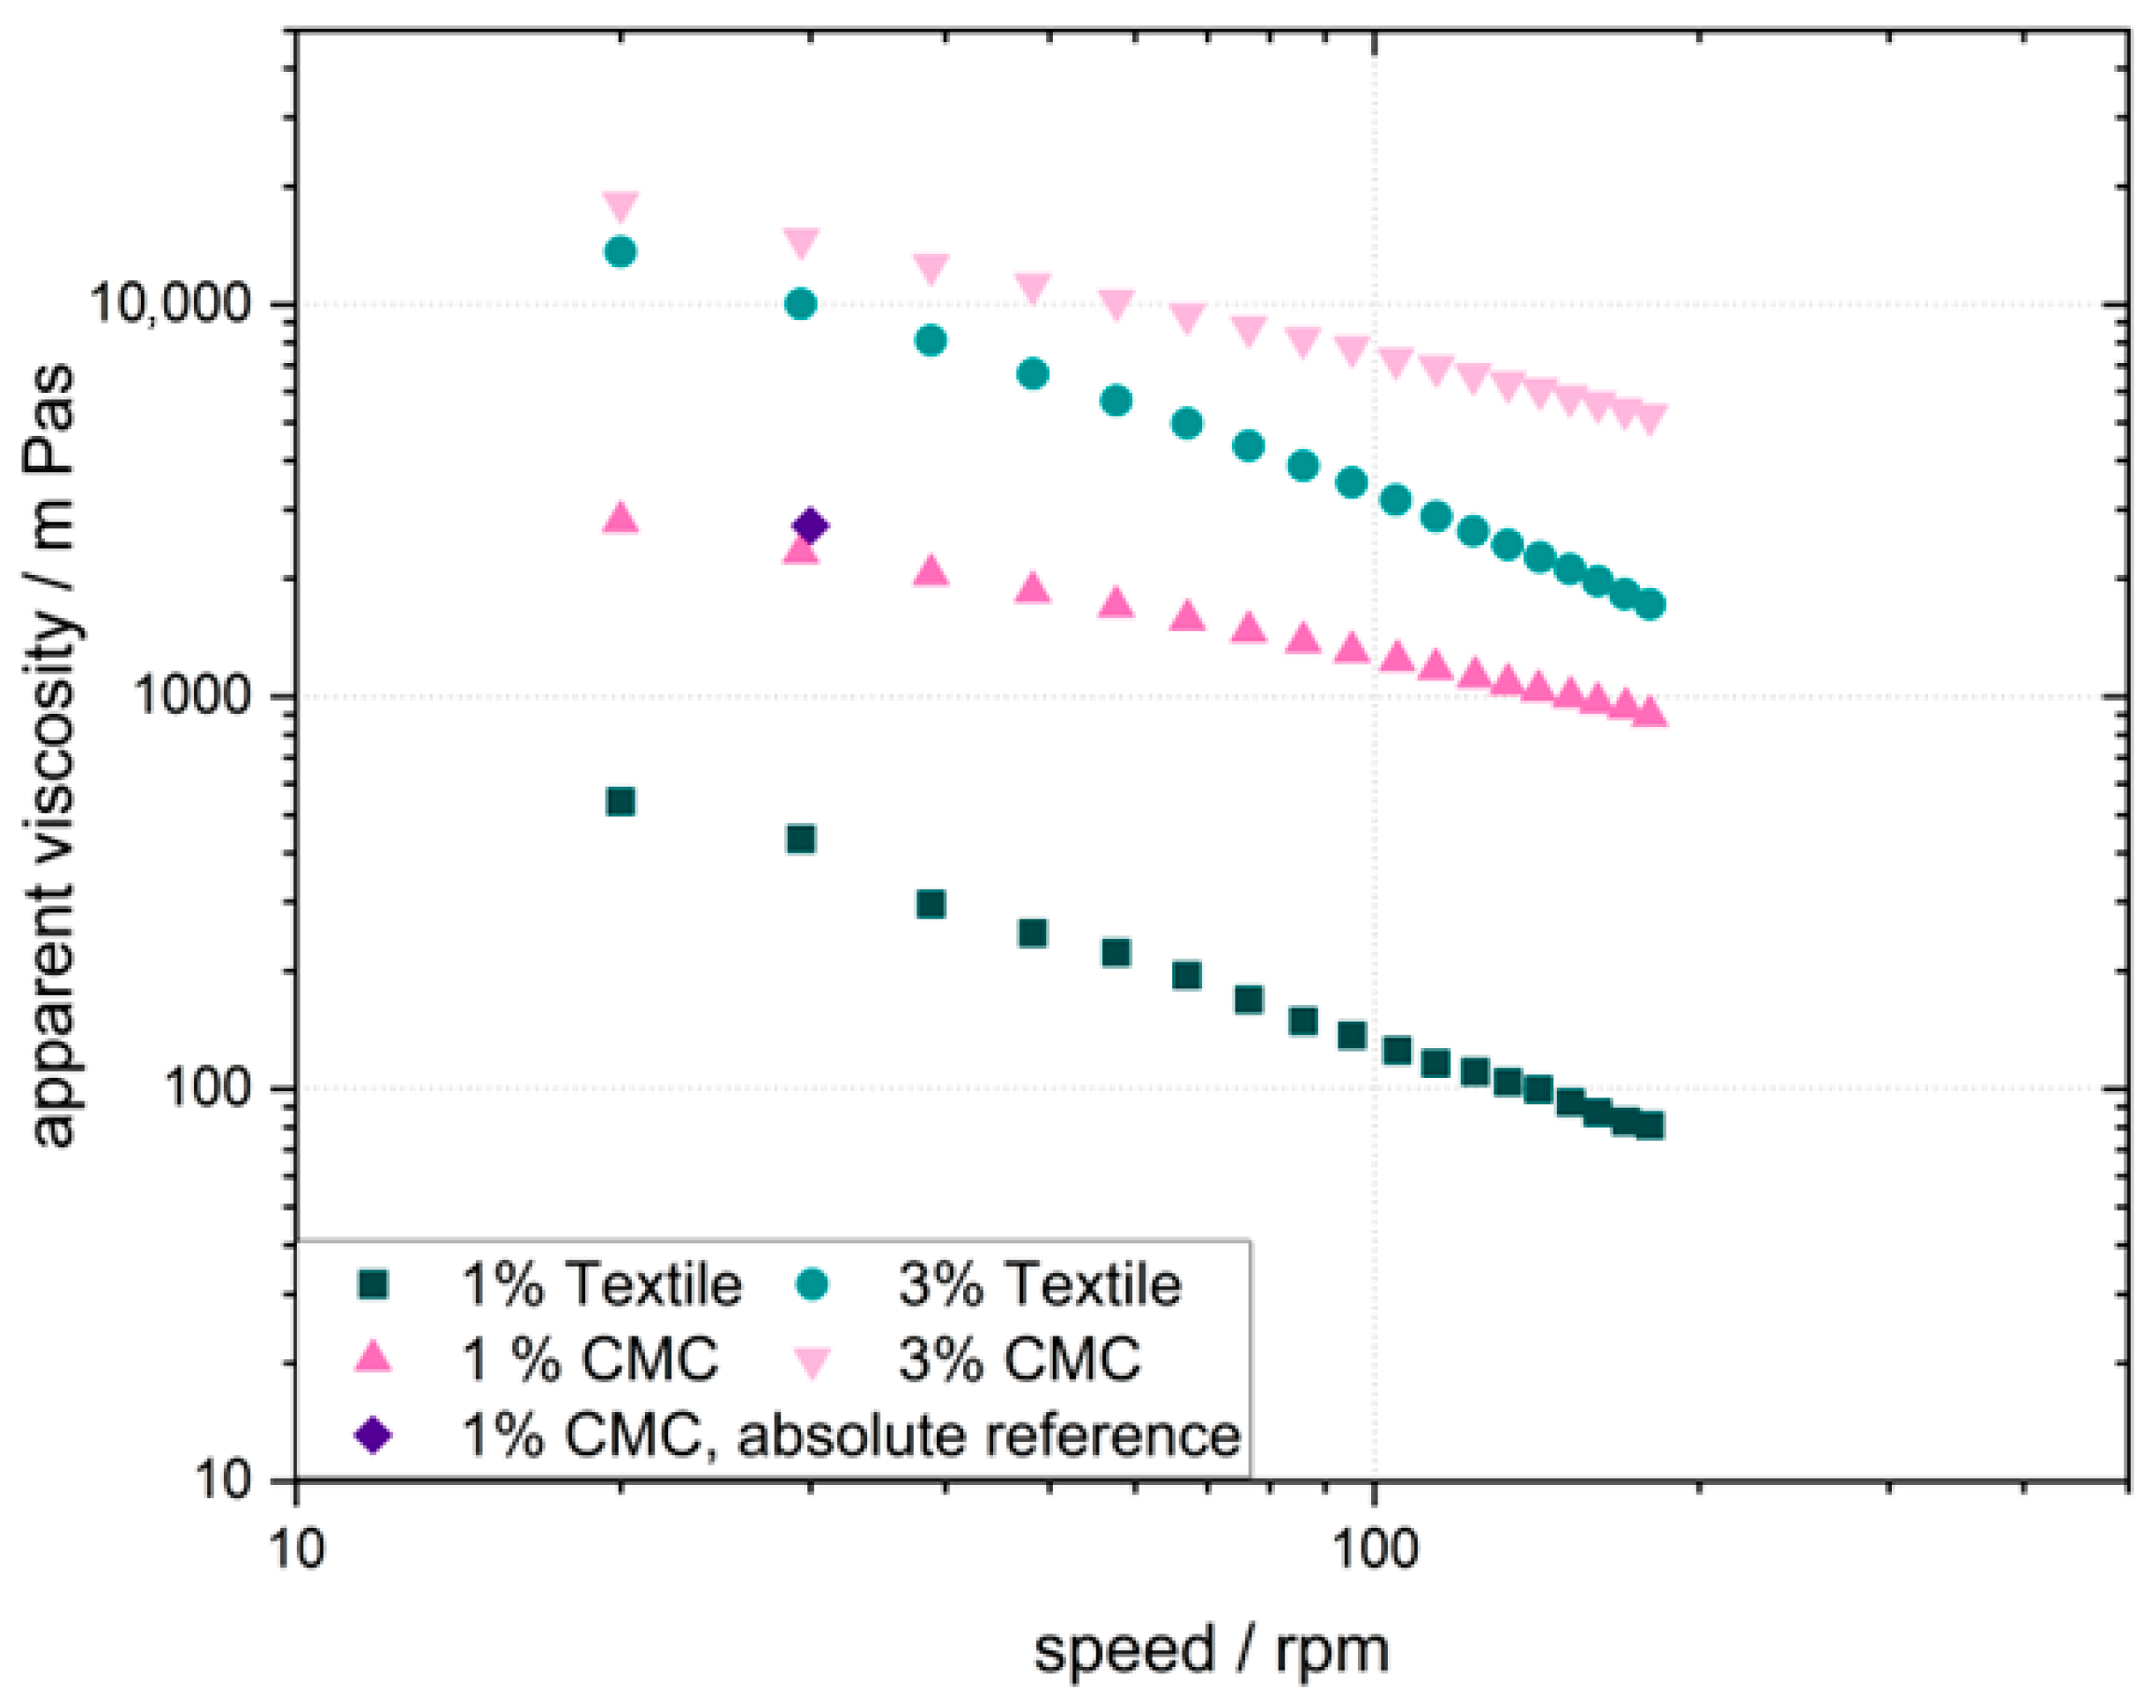
Textile shreds are both too large to use the customary cone geometry typically used for powdery cellulose substrates, and too easily settled at lower concentration for the Brookfield spindle viscosimeter. Therefore, a close-clearance multiple-blade stirrer was used to measure apparent, relative viscosity values for both textile suspension and the reference material. Flow behavior was characterized between 20 and 180 rpm due to the geometric similarity of the rheological equipment and the close-clearance stirrers used in later experiments. Due to the non-standard, non-uniform geometry of the MCR stirrer, absolute shear rates are unknown. Therefore, only an apparent viscosity value could be calculated using rotational speed as a first approximation. A reference point was measured for the homogenous shear-thinning carboxymethyl cellulose reference, showing the validity of the calculated apparent viscosity obtained via MCR in Figure 4.
Both materials are shear thinning, with the higher viscosity decrease shown by the textile material. The viscosity of the 1% CMC solution is comparable to that of both textile suspensions. Due to this, and the comparatively high preparative effort required, only this CMC concentration was used for the benchtop experiments. No CMC experiments were performed on the semi-pilot scale due to these preparative issues. Nonetheless, the rheological correlations found in these preliminary experiments form the basis for later efficiency evaluation.

3.2. Bench-Scale Experiments

3.2.1. Mixing Efficiency—Suspension Activity

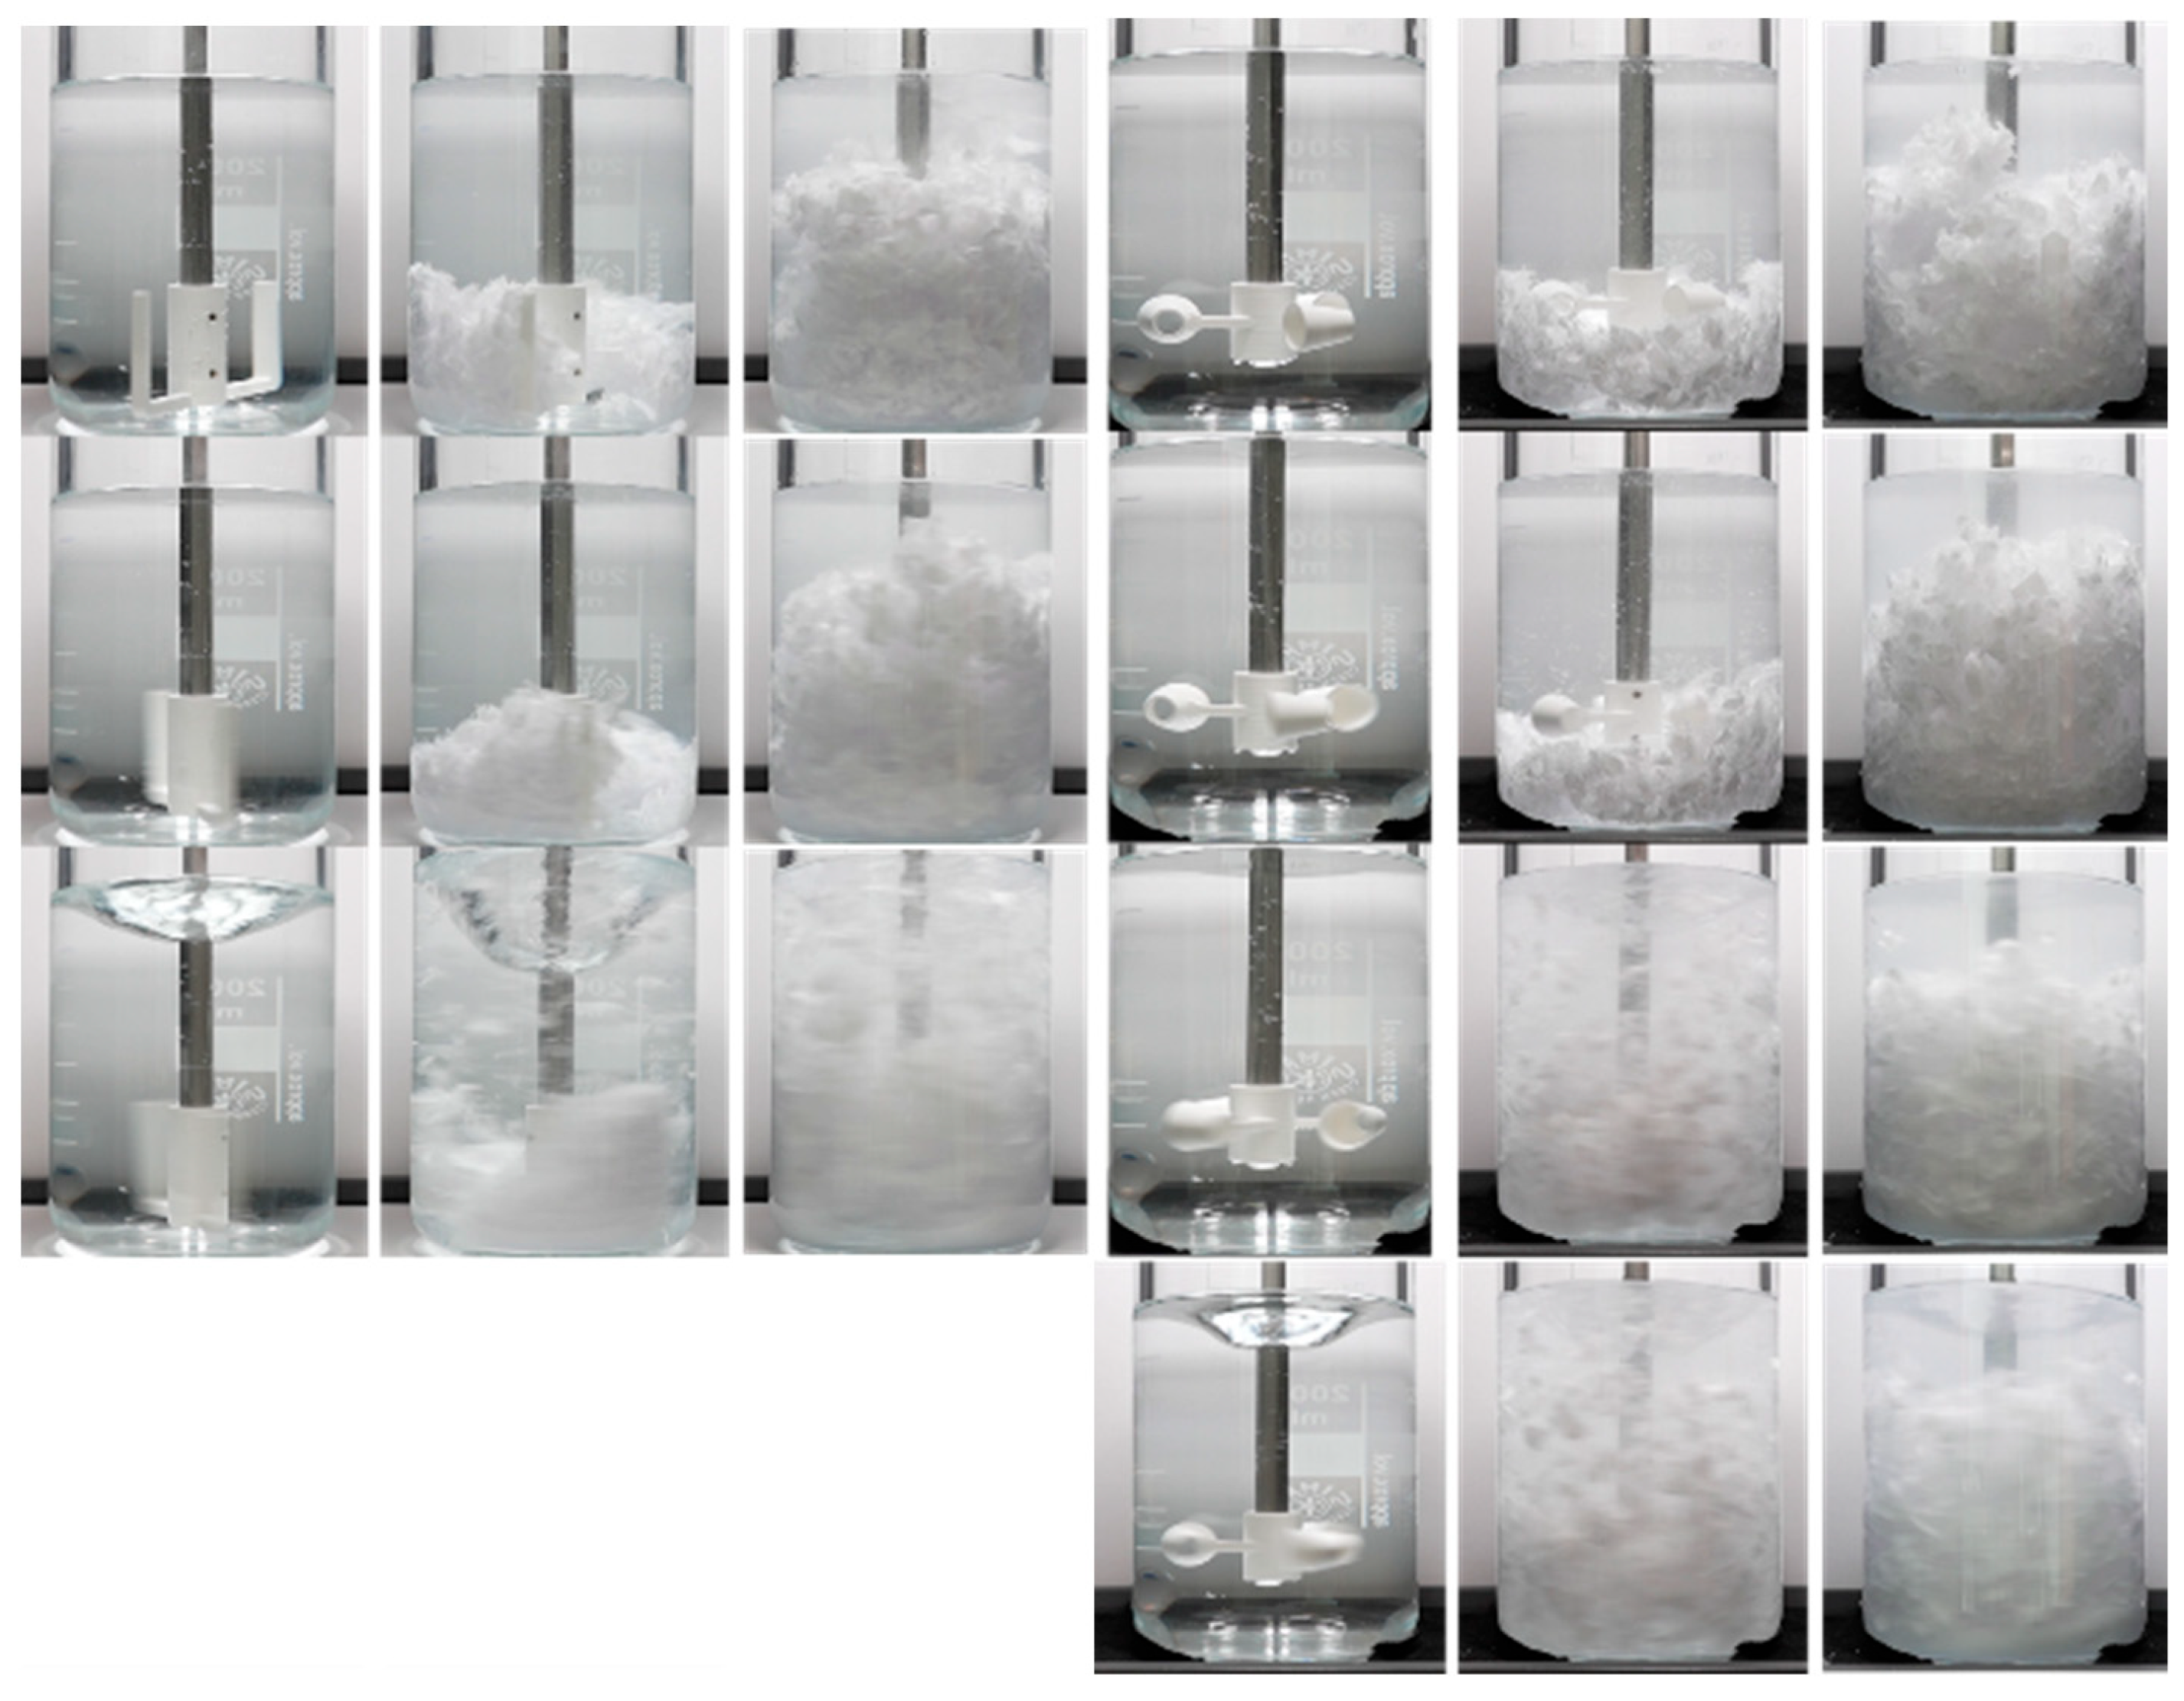
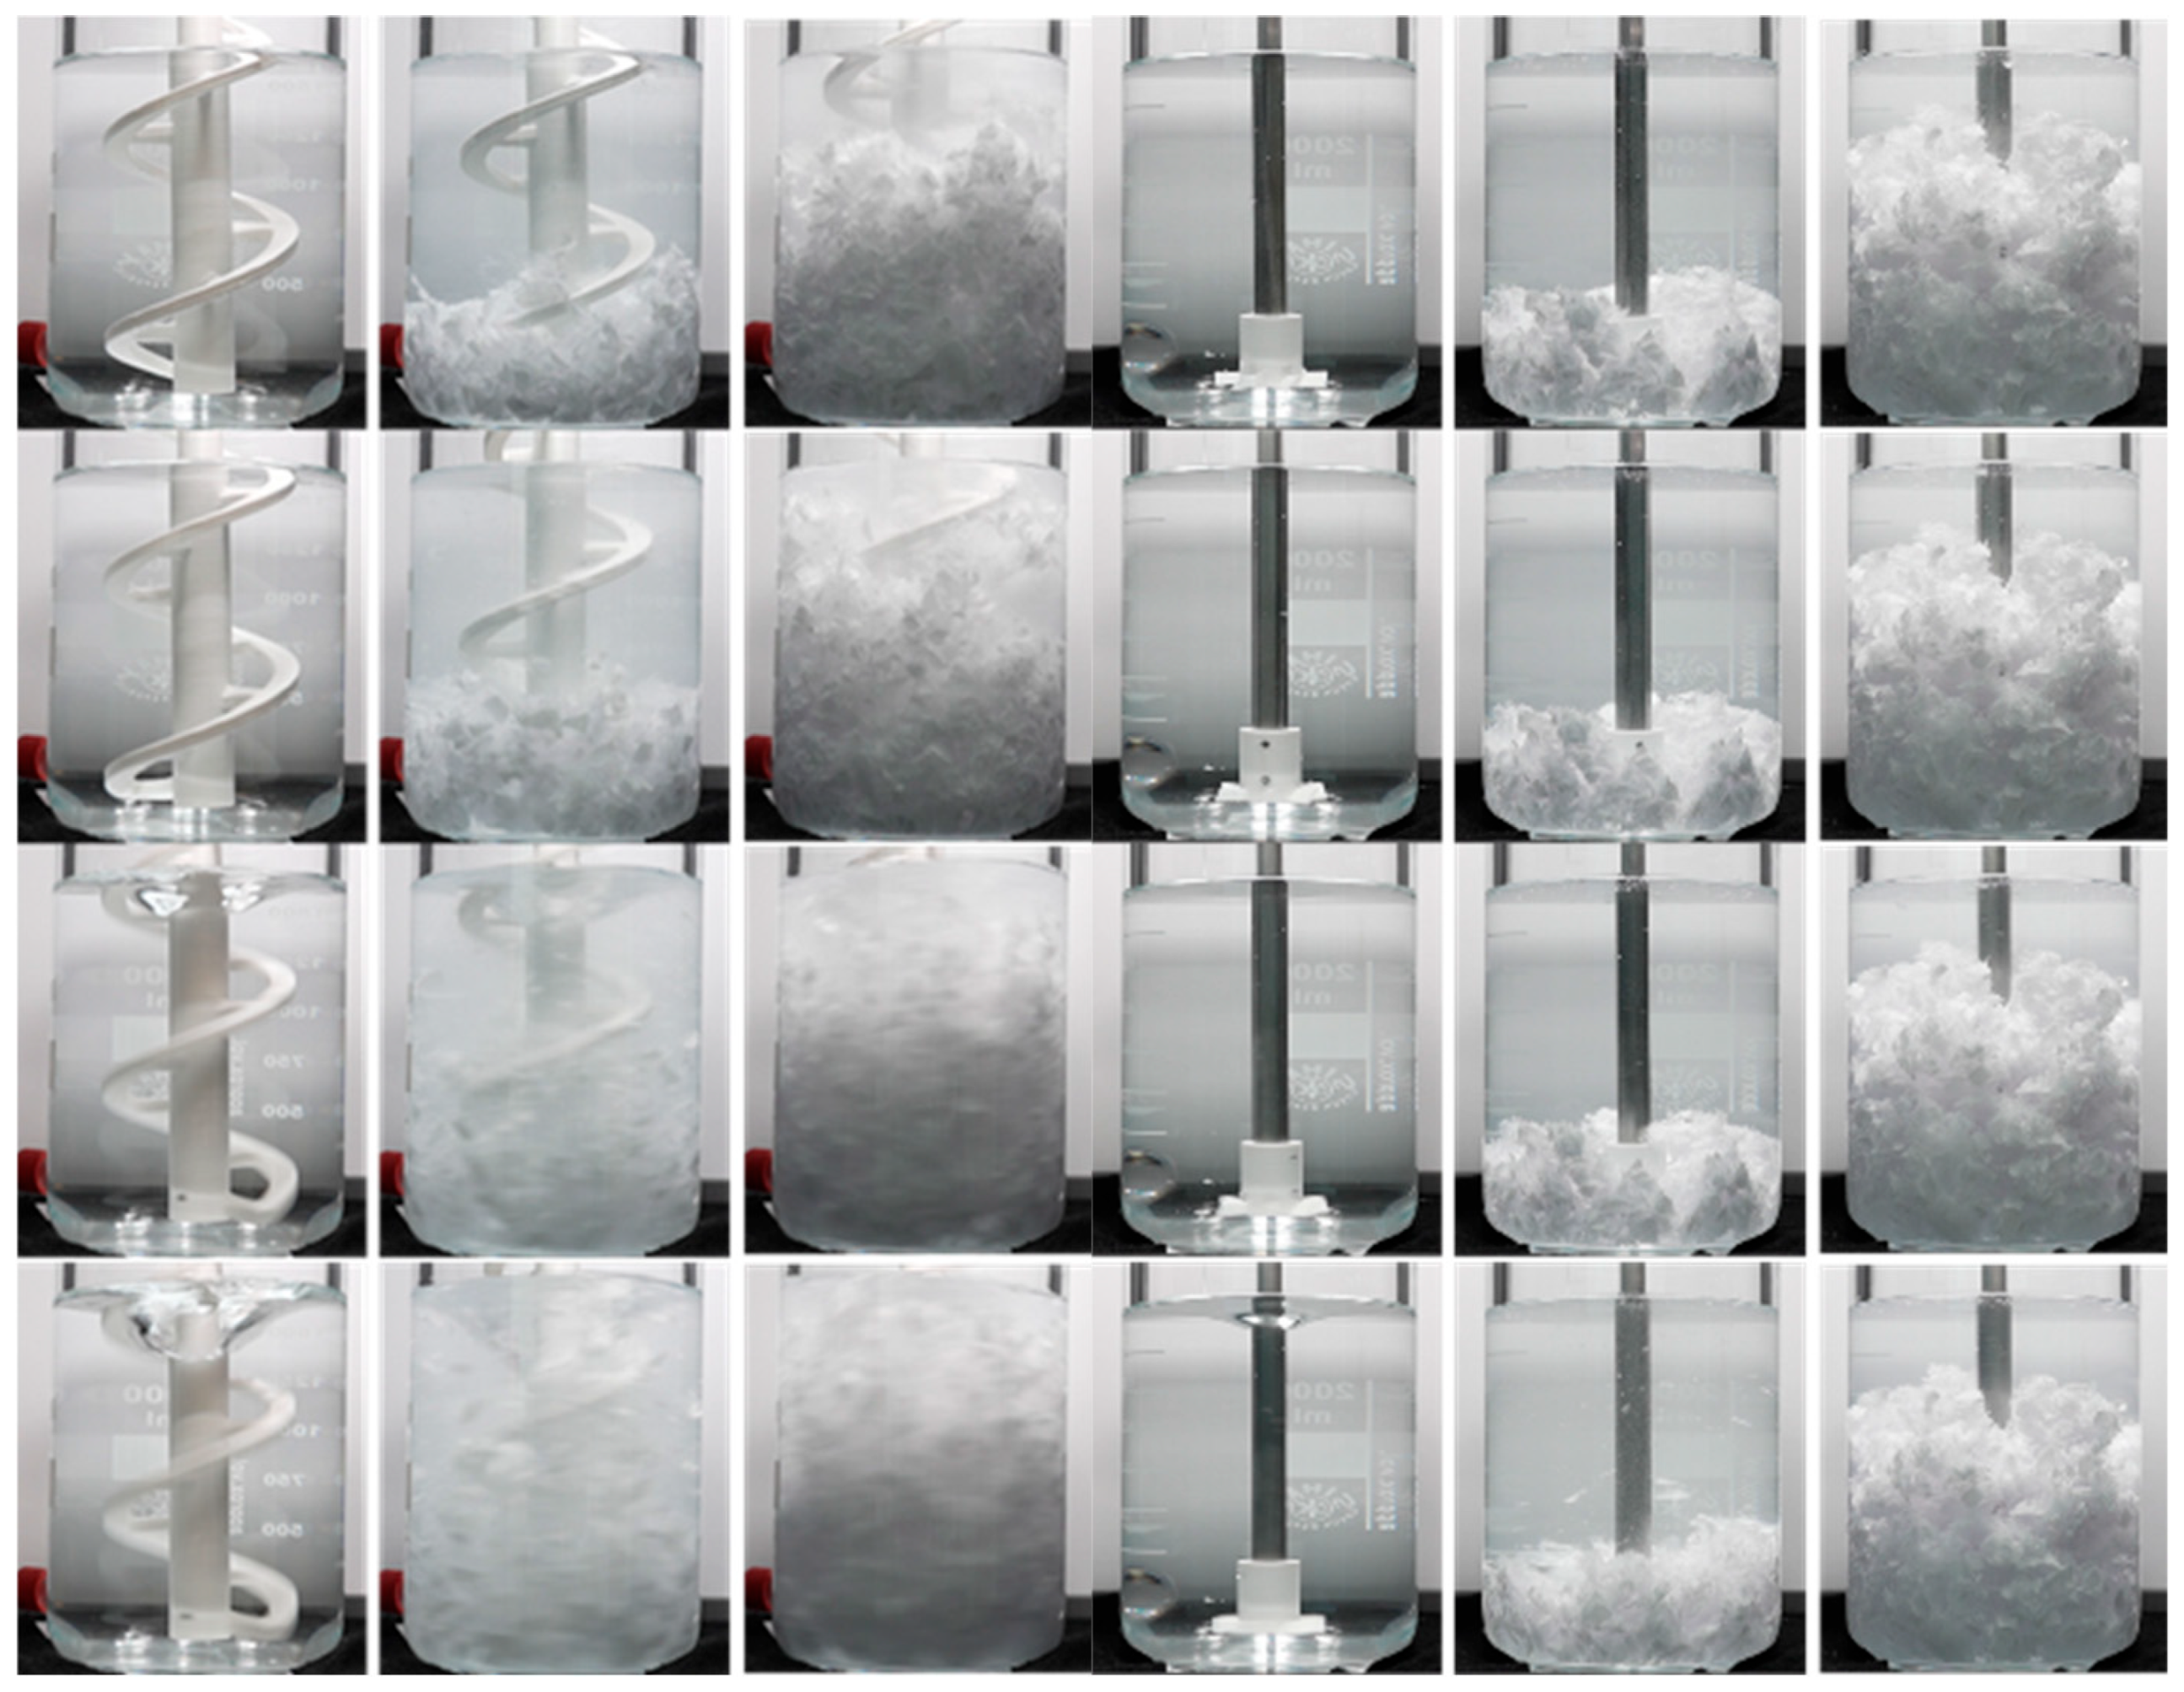
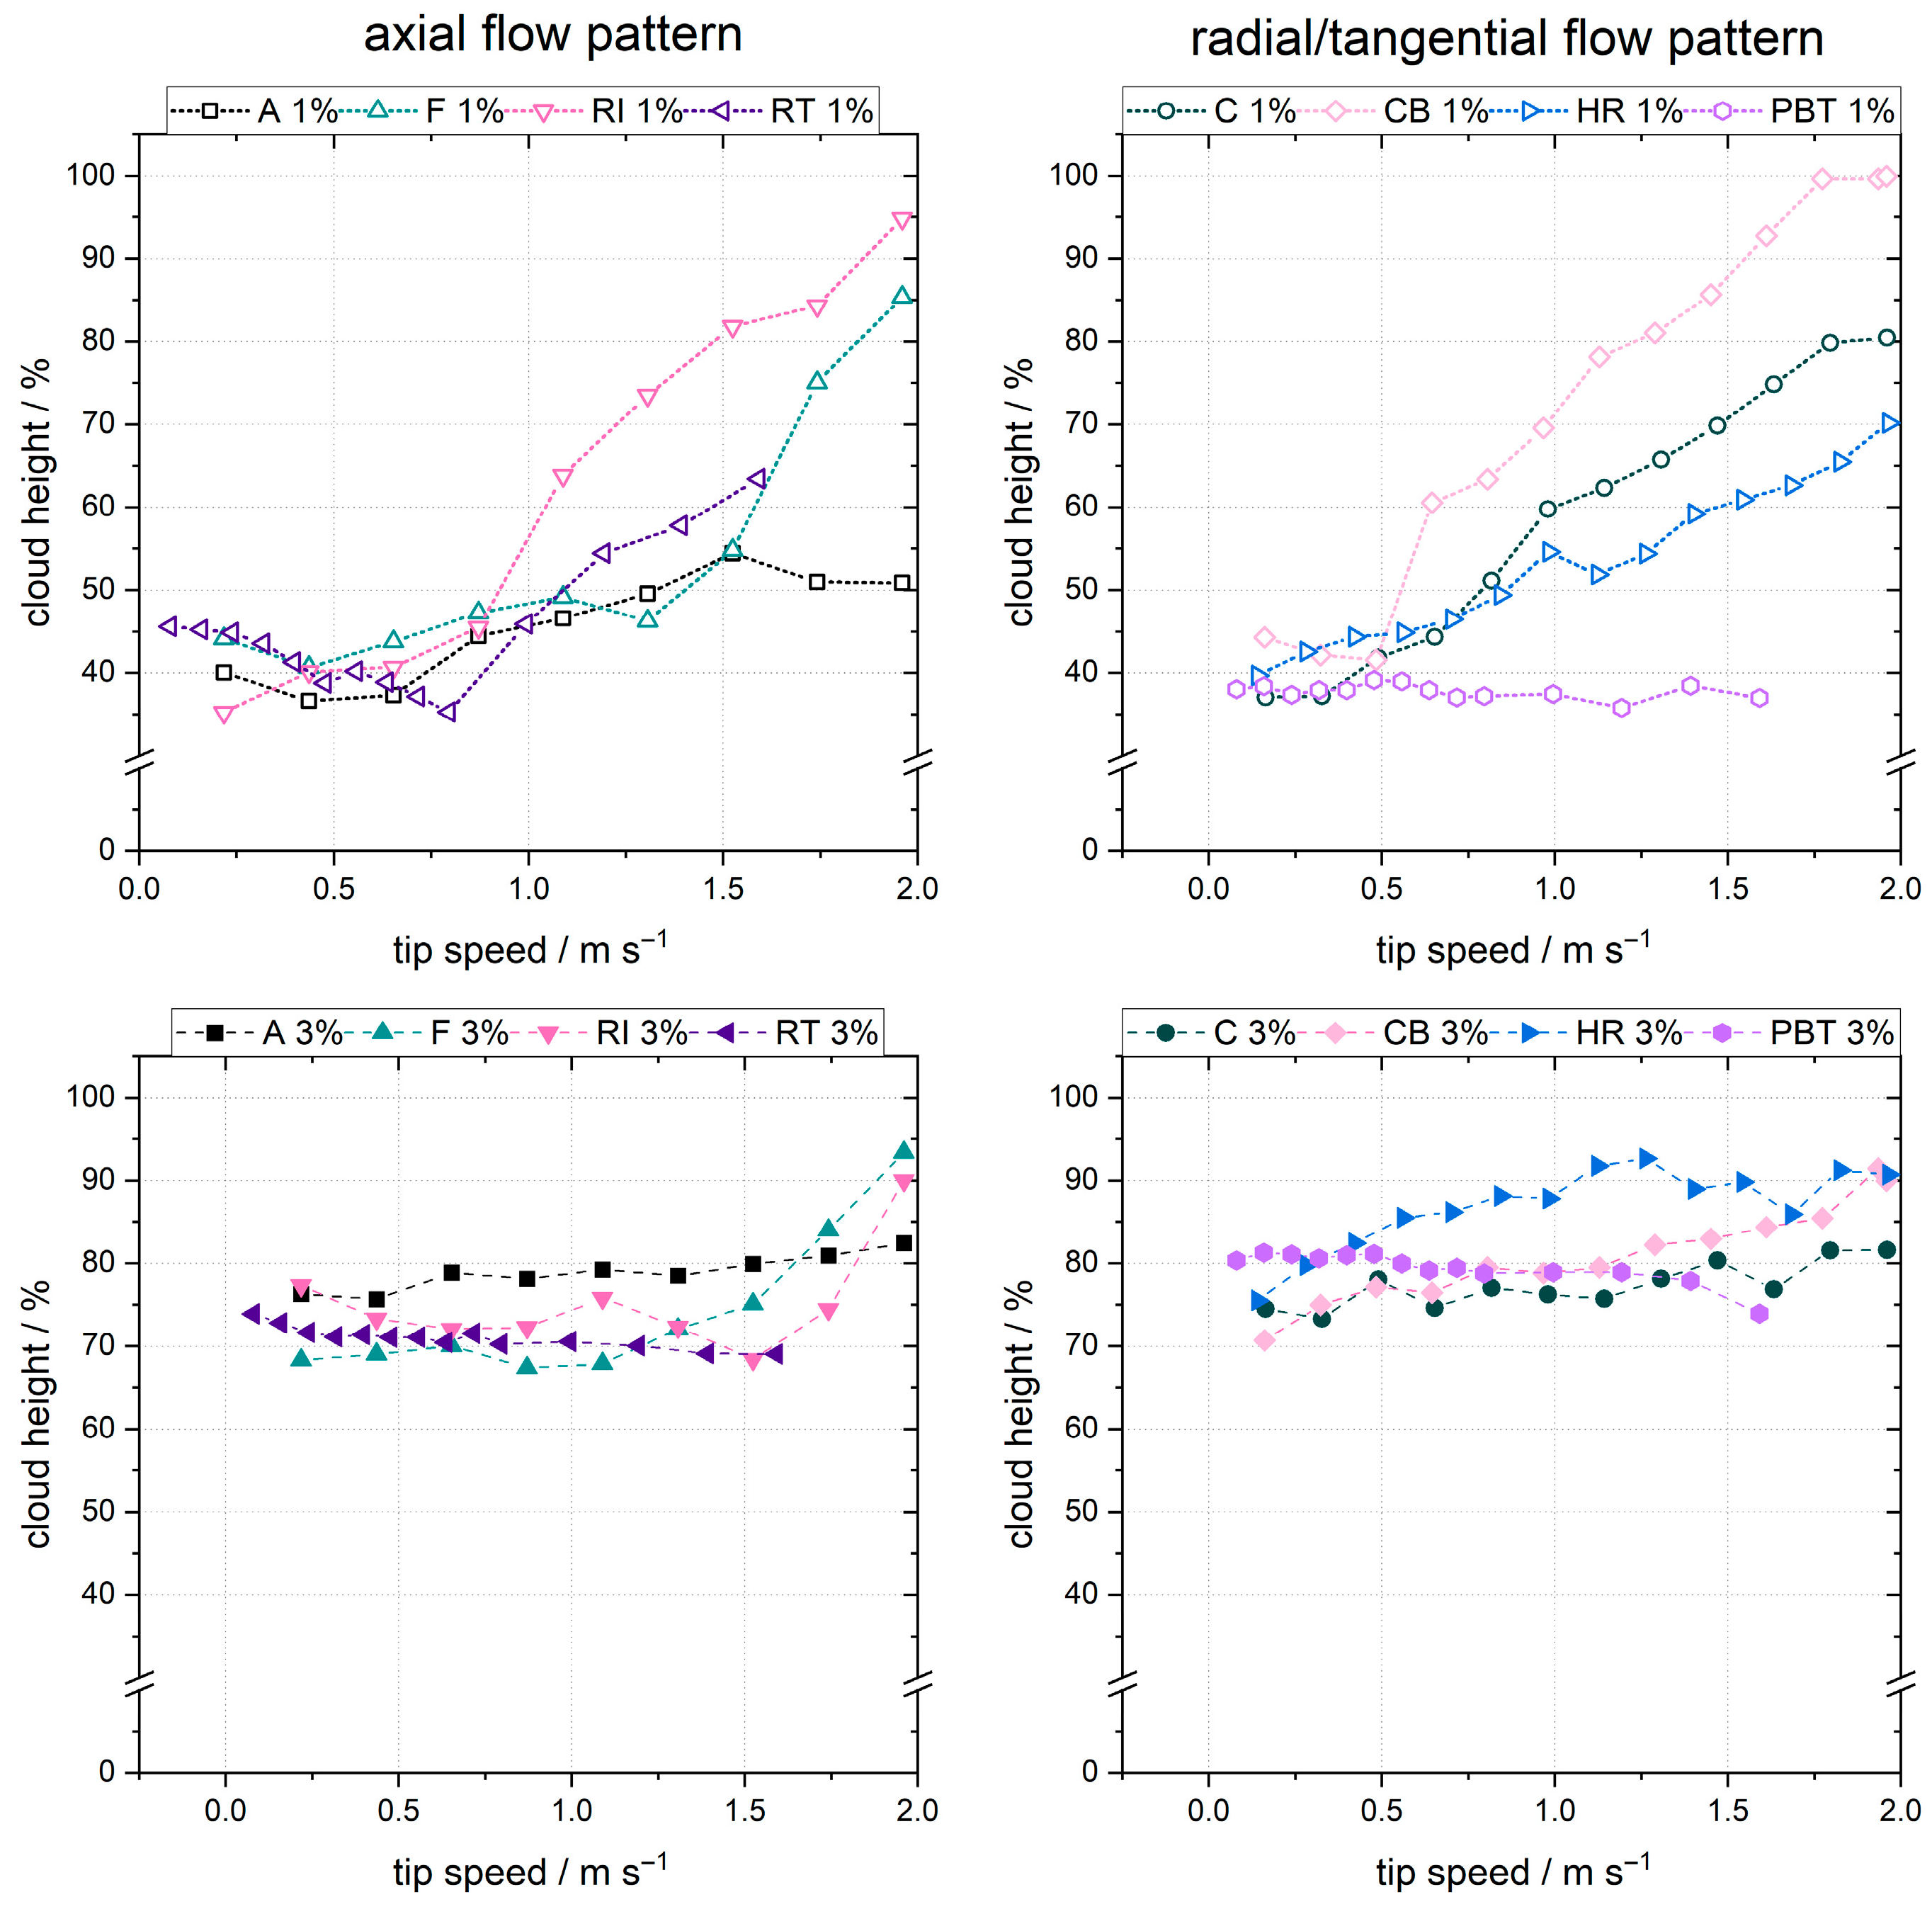
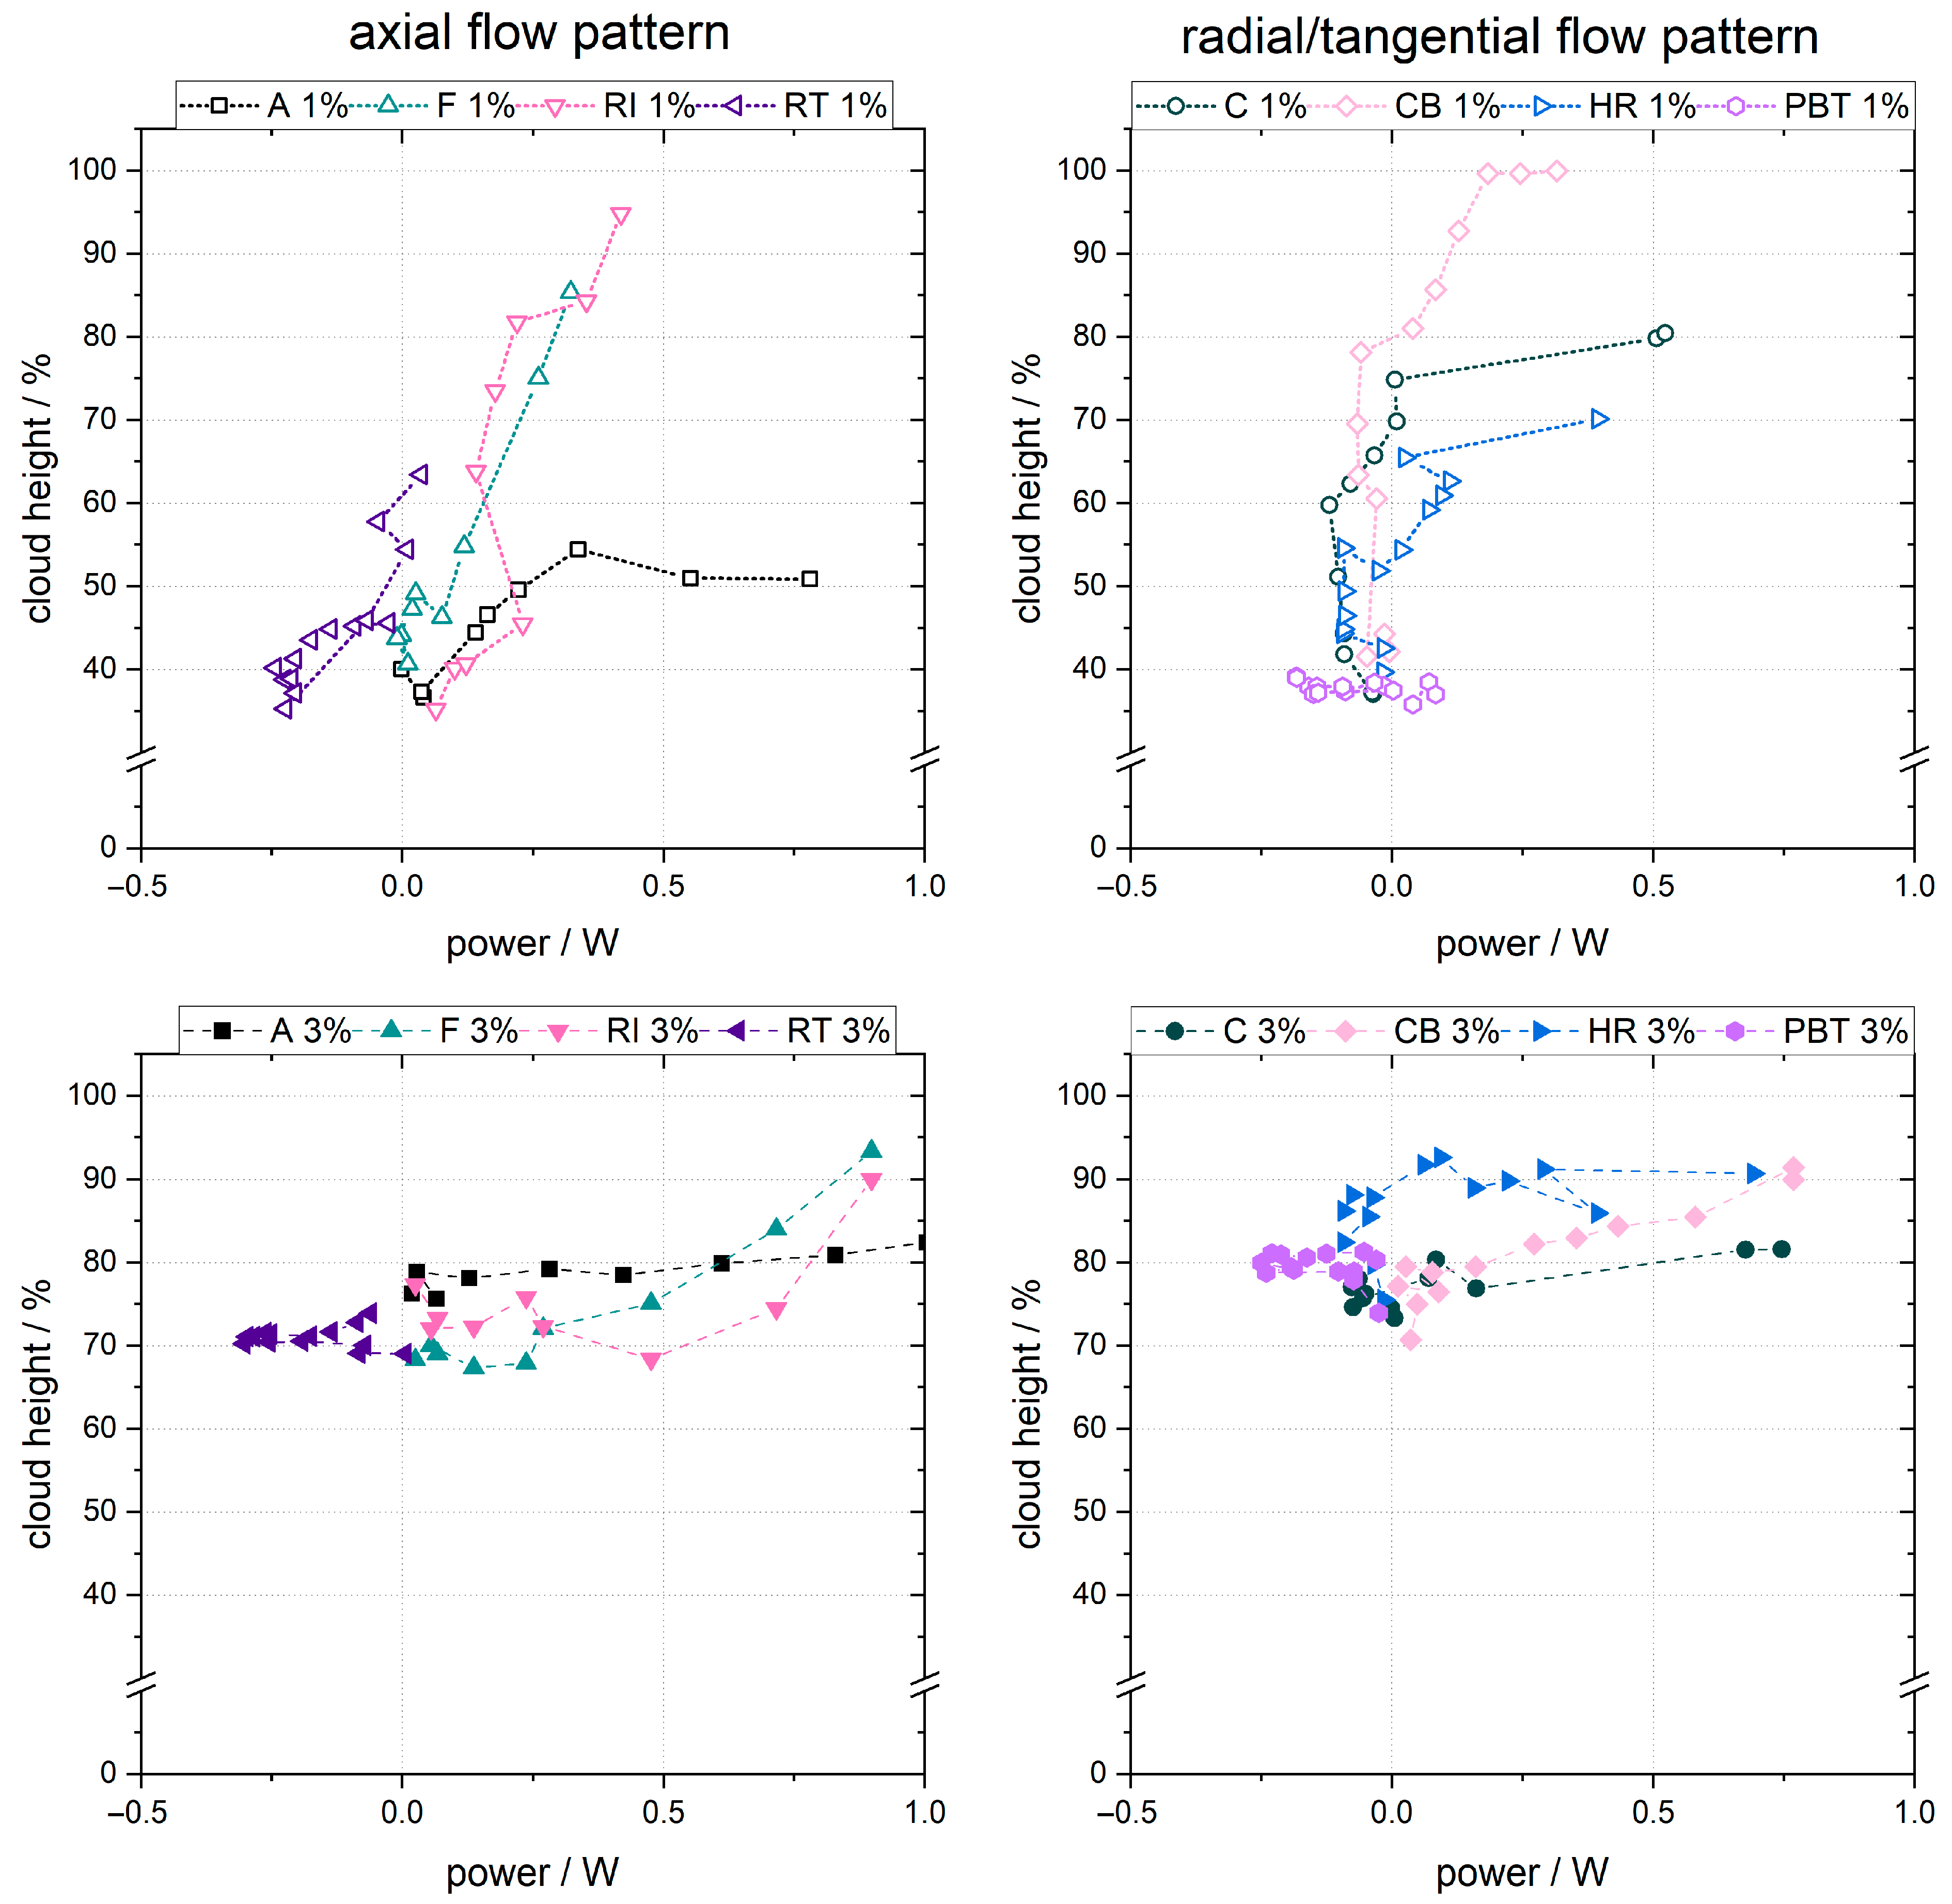
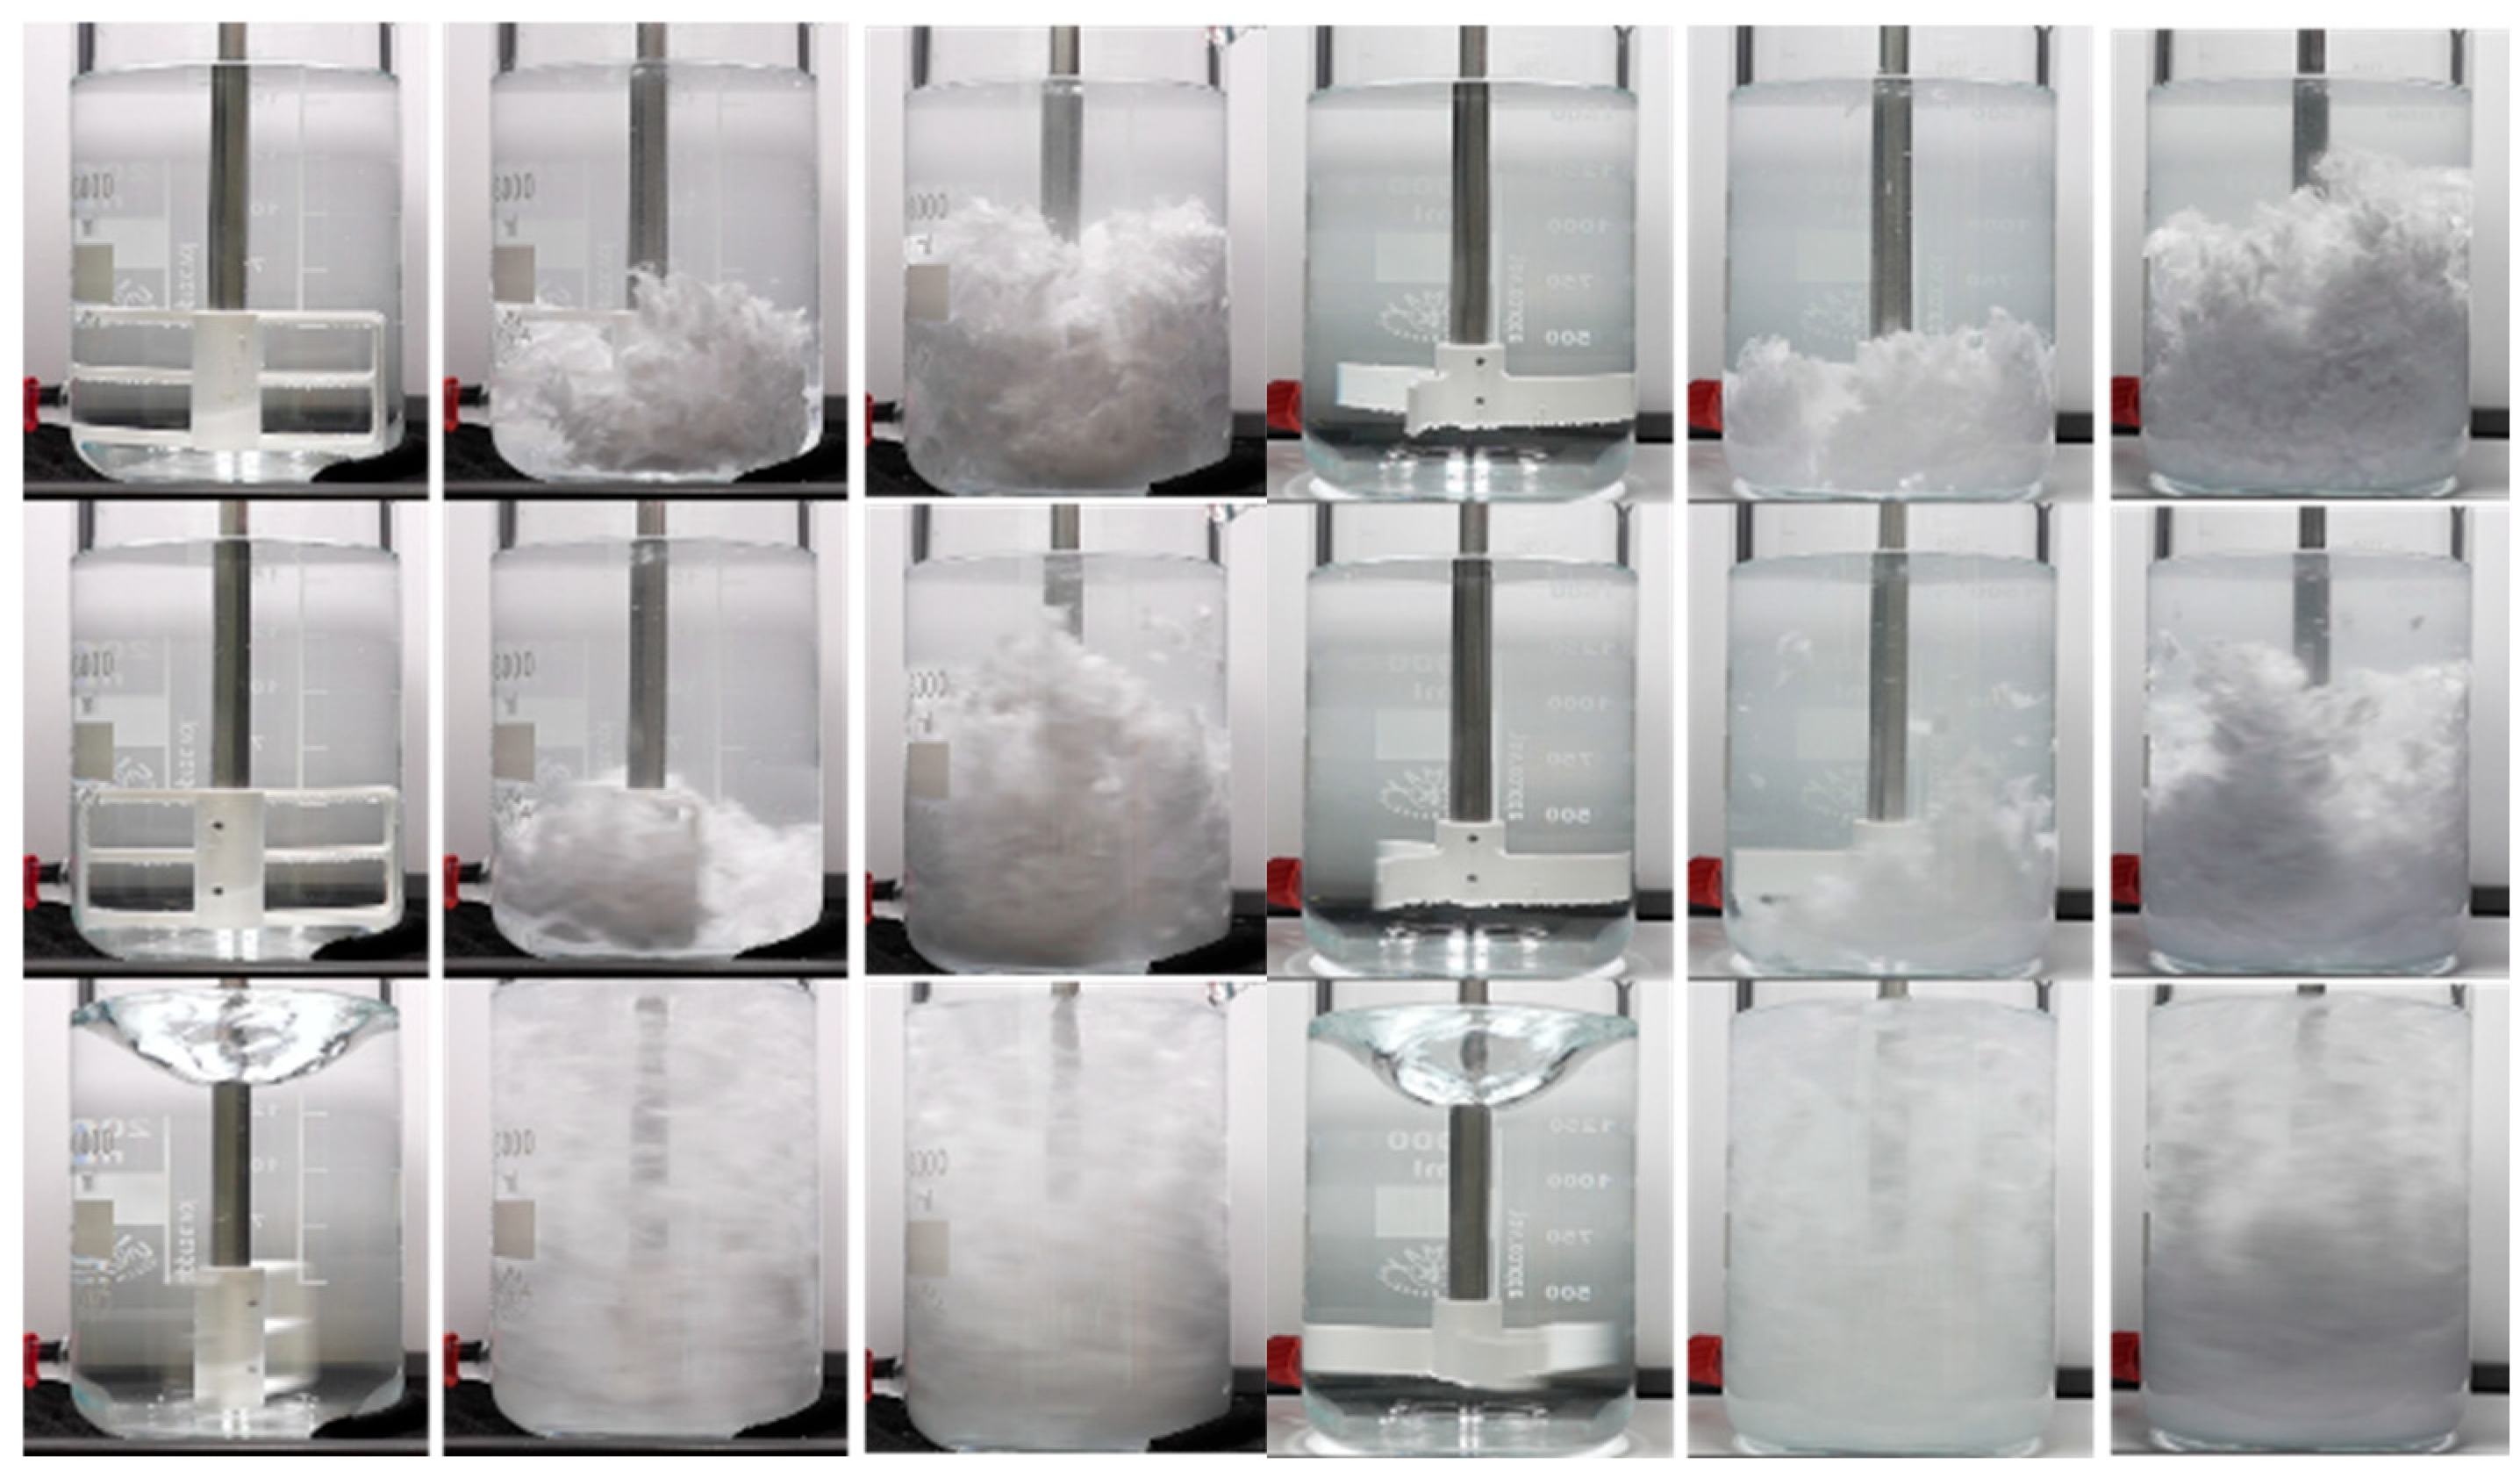
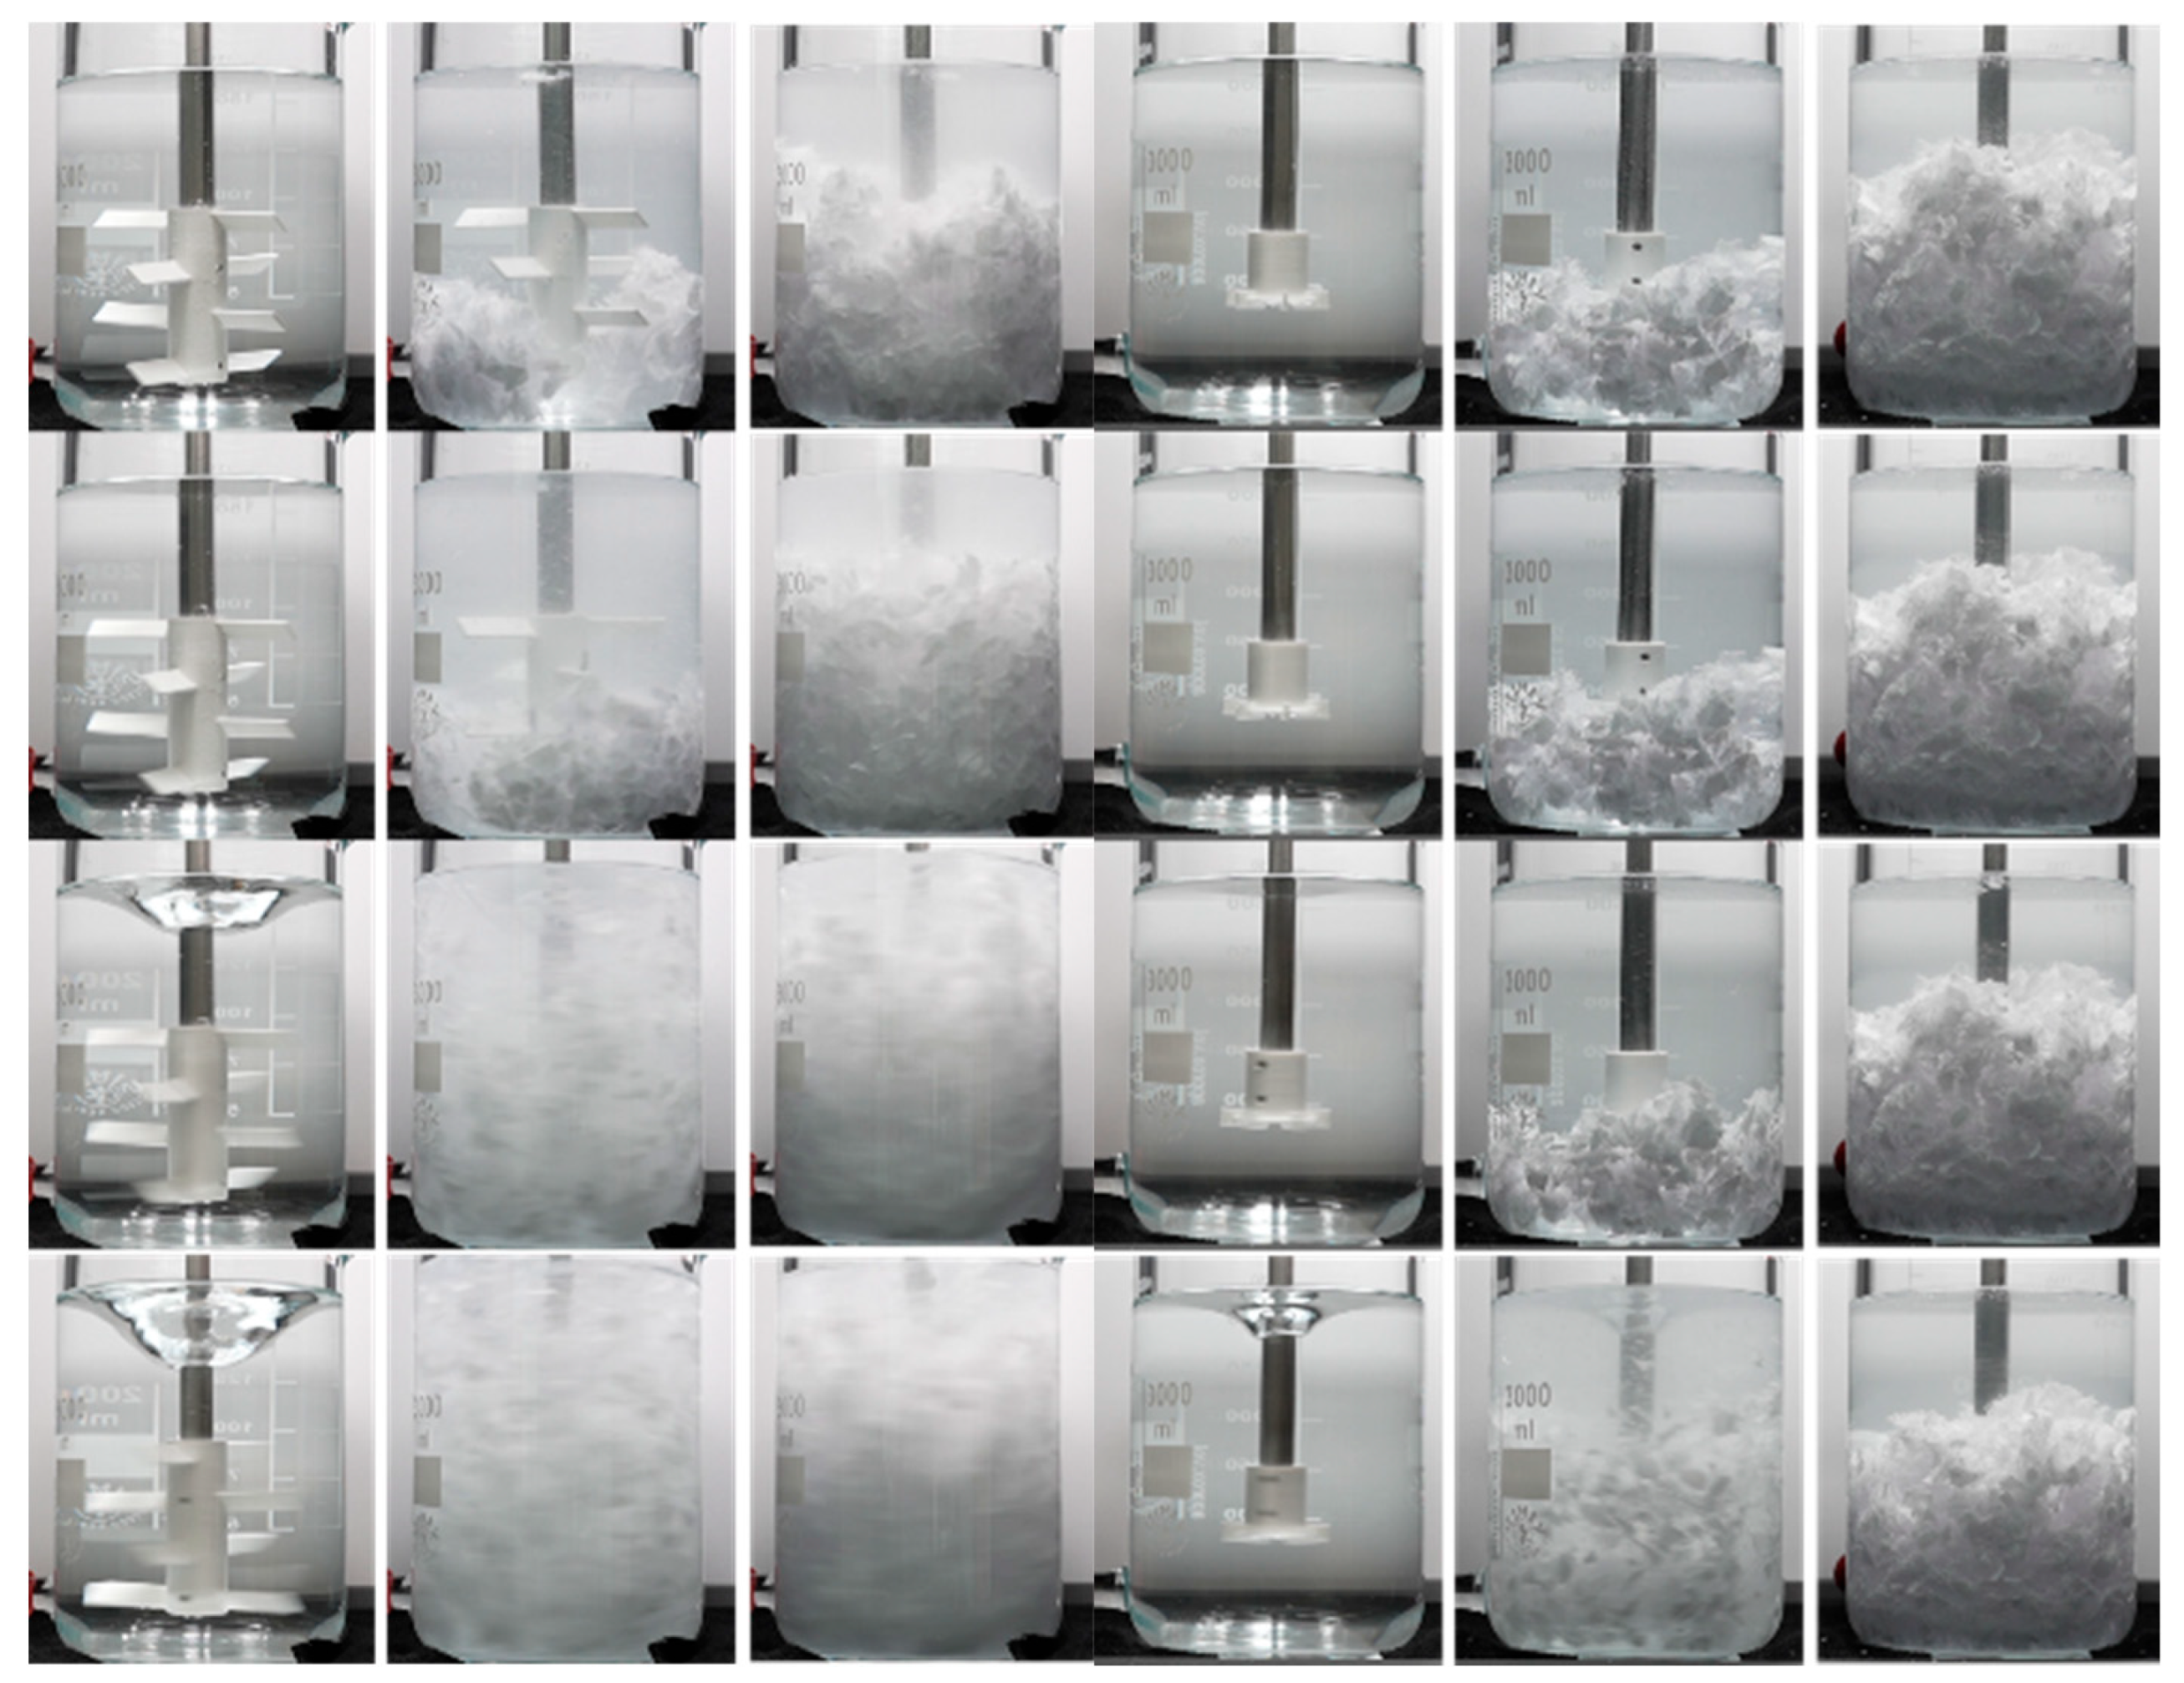
Preliminary assessment of the stirrer suspension efficiency can be performed via measurement of the cloud height. Cloud height was plotted against both impeller tip speed and power consumption in Figure 5 and Figure 6, respectively. Images taken at minimum (20 rpm), medium (60 and 180 rpm) and maximum speed (180 rpm or higher, depending on stirrer diameter) can be found in Appendix A.
At low concentration, little suspension activity is visible below 0.5 m·s−1 for either of the flow pattern groups. Above that speed, cloud formation varies; the smallest turbines (Rushton RT and pitched-blade PBT), intended for low (<500 mPa·s, [25]) viscosity applications, showed below-average suspension effectiveness. For the Rushton turbine, even an initial decrease in cloud height is visible due to material that was previously more loosely packed settling under agitation. The maximum cloud height was achieved via the two low-to-medium viscosity stirrers investigated: the radial impeller RI and crossbeam stirrer CB. Of the higher-viscosity application stirrers (anchor A, frame F, cup C, and helical ribbon HR), three showed intermediate suspension activity. The exception is the anchor A, which moved the material tangentially but did not generate significant uplift.
At the higher concentration, it is difficult to determine the mixing activity via cloud height. Frame, RI, and CB still showed a clear upwards trend above 1 m·s−1; cloud height increased semi-continuously for the HR and was constant for A and C. For further efficiency assessment, cloud height was plotted against mixing energy requirements (power consumption at any given motor speed) in Figure 4.
Due to the low mixing energy consumption (compared to the total motor energy consumption), absolute values are difficult to determine in the bench-scale experiments (see negative power values for RT and PBT); however, the standard deviation between recorded values is low, allowing relative efficiency comparisons. For the axial flow stirrers, RI and F showed similar energy-cloud height trends; however, the RI achieved higher total cloud height. The anchor continued to show the lowest efficiency at low suspension activity and high power requirements. In the radial/tangential flow stirrer diagrams, the crossbeam continues to show high efficiency. The PBT did not consume high energy amounts, but also failed to suspend the material, while C and HR were shown to be less efficient than the crossbeam at similar suspension activity.

3.2.2. Energy Efficiency

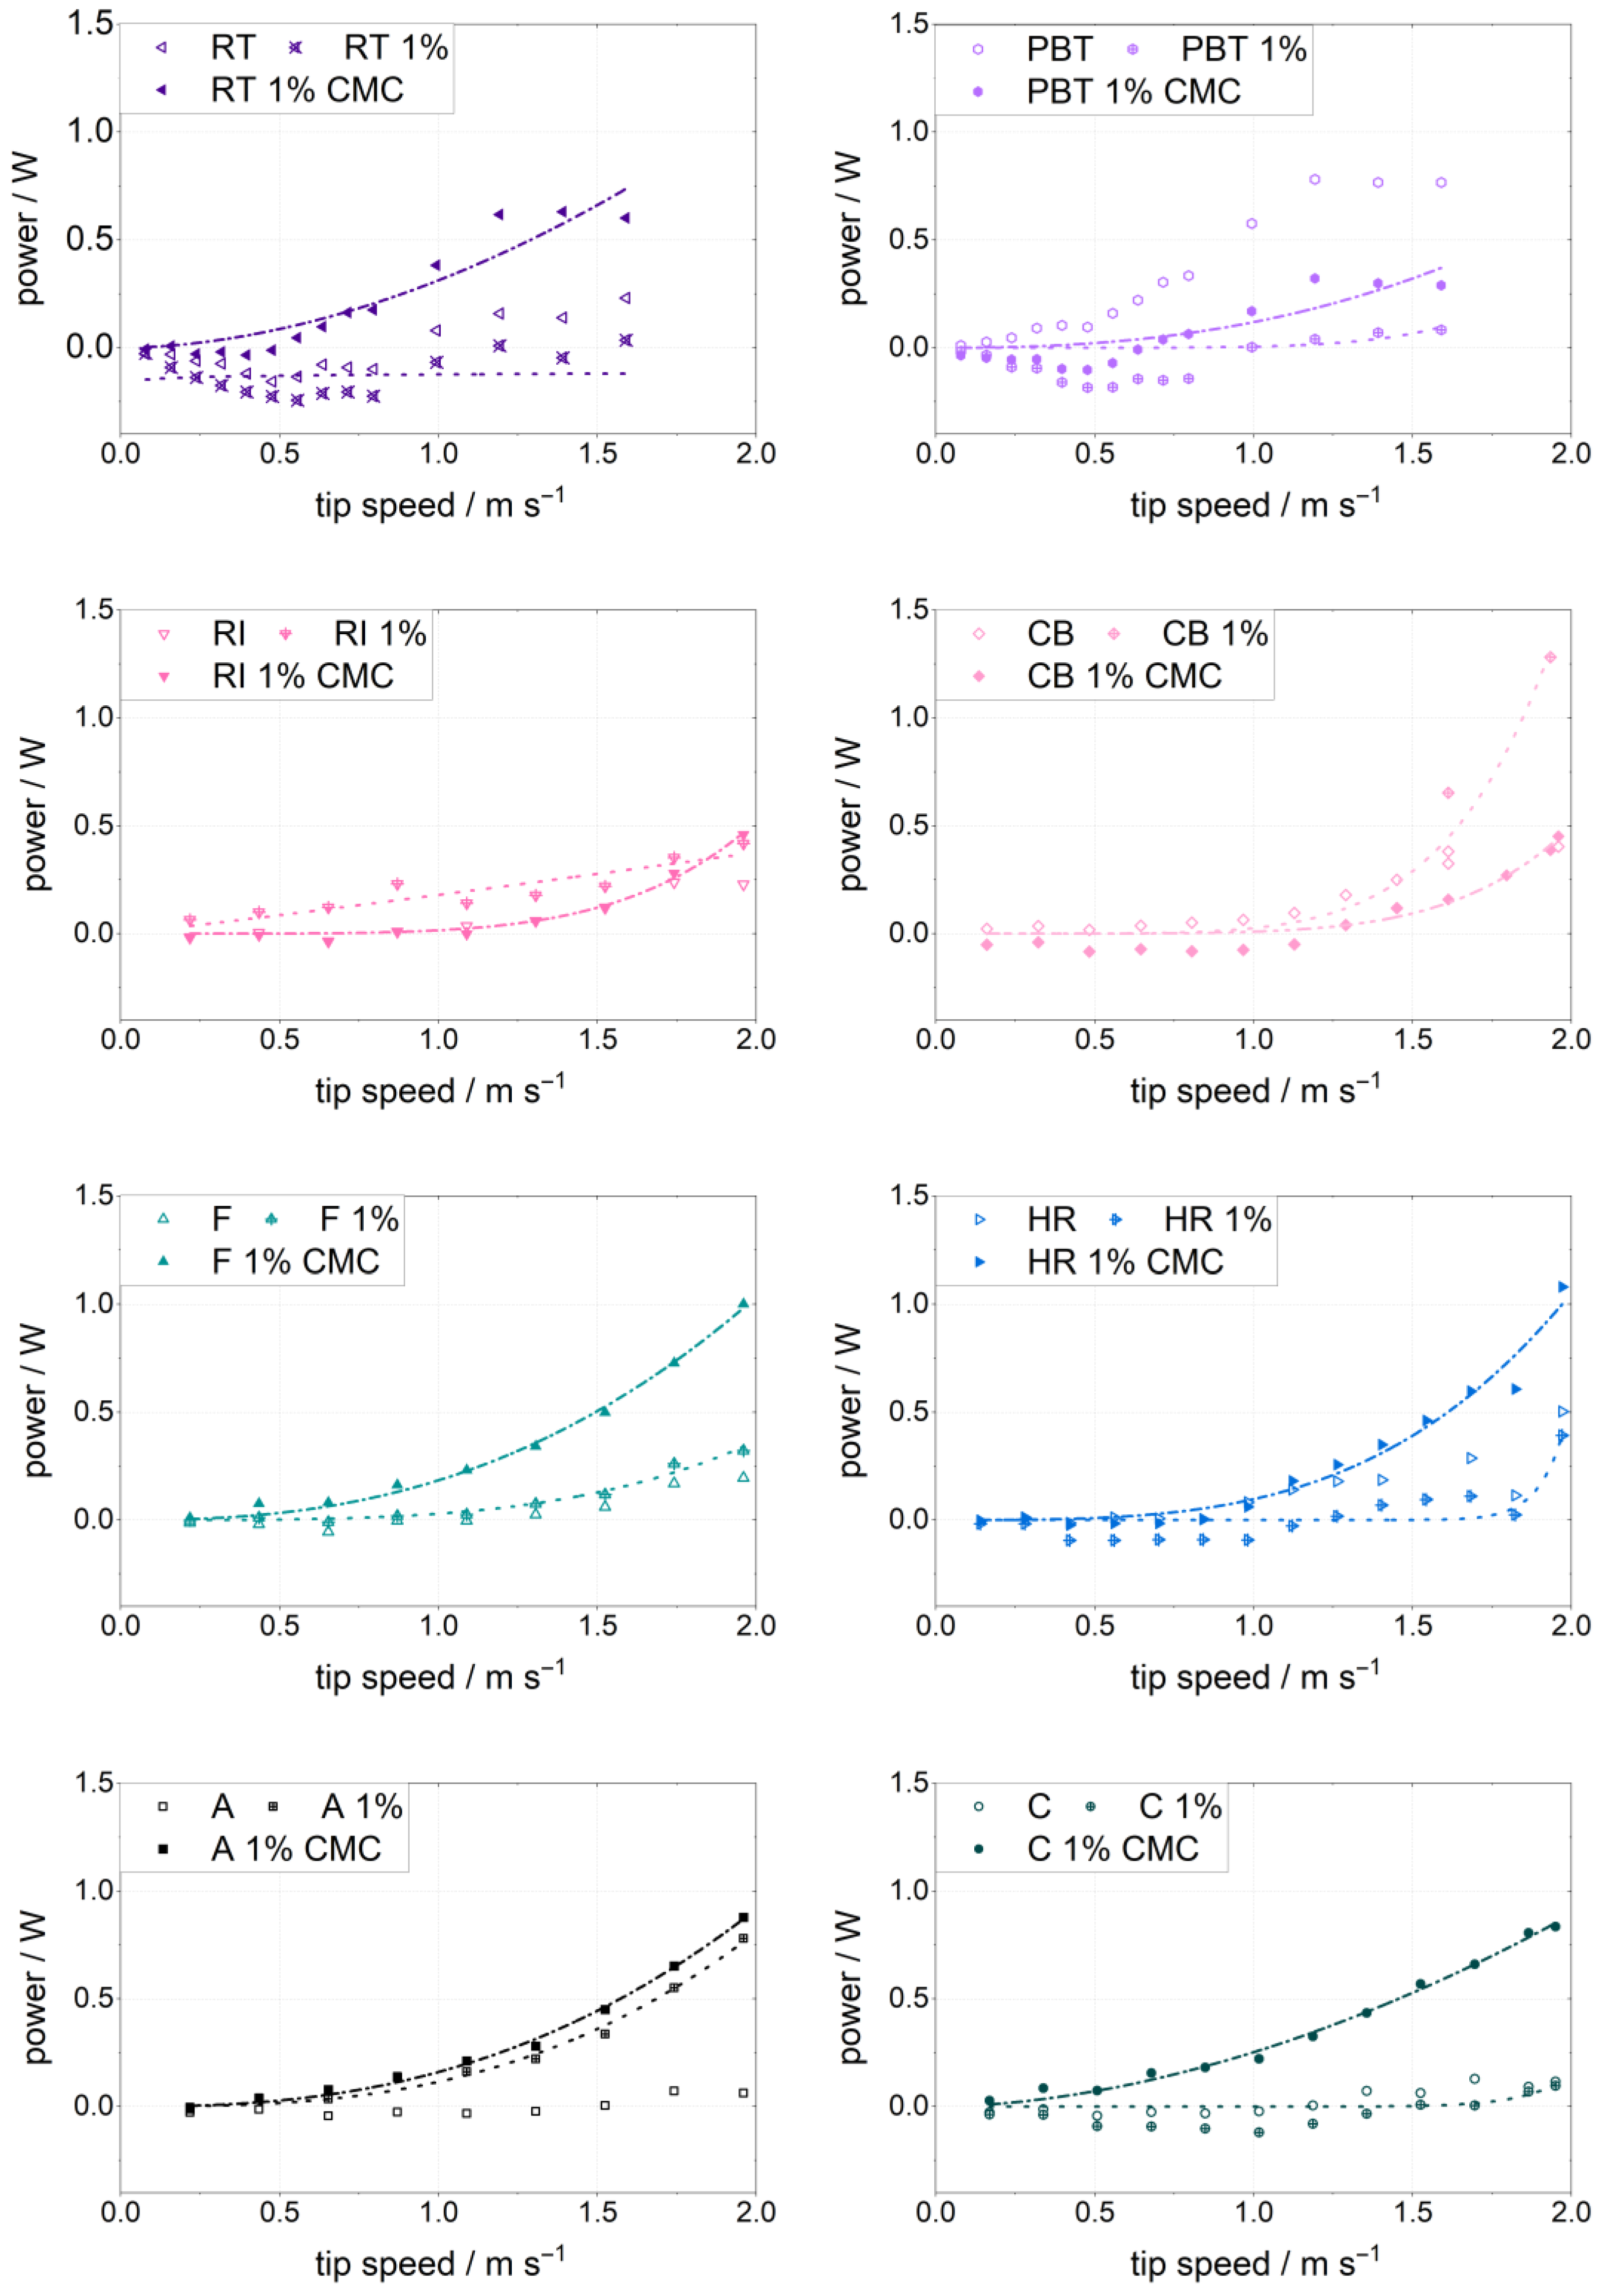
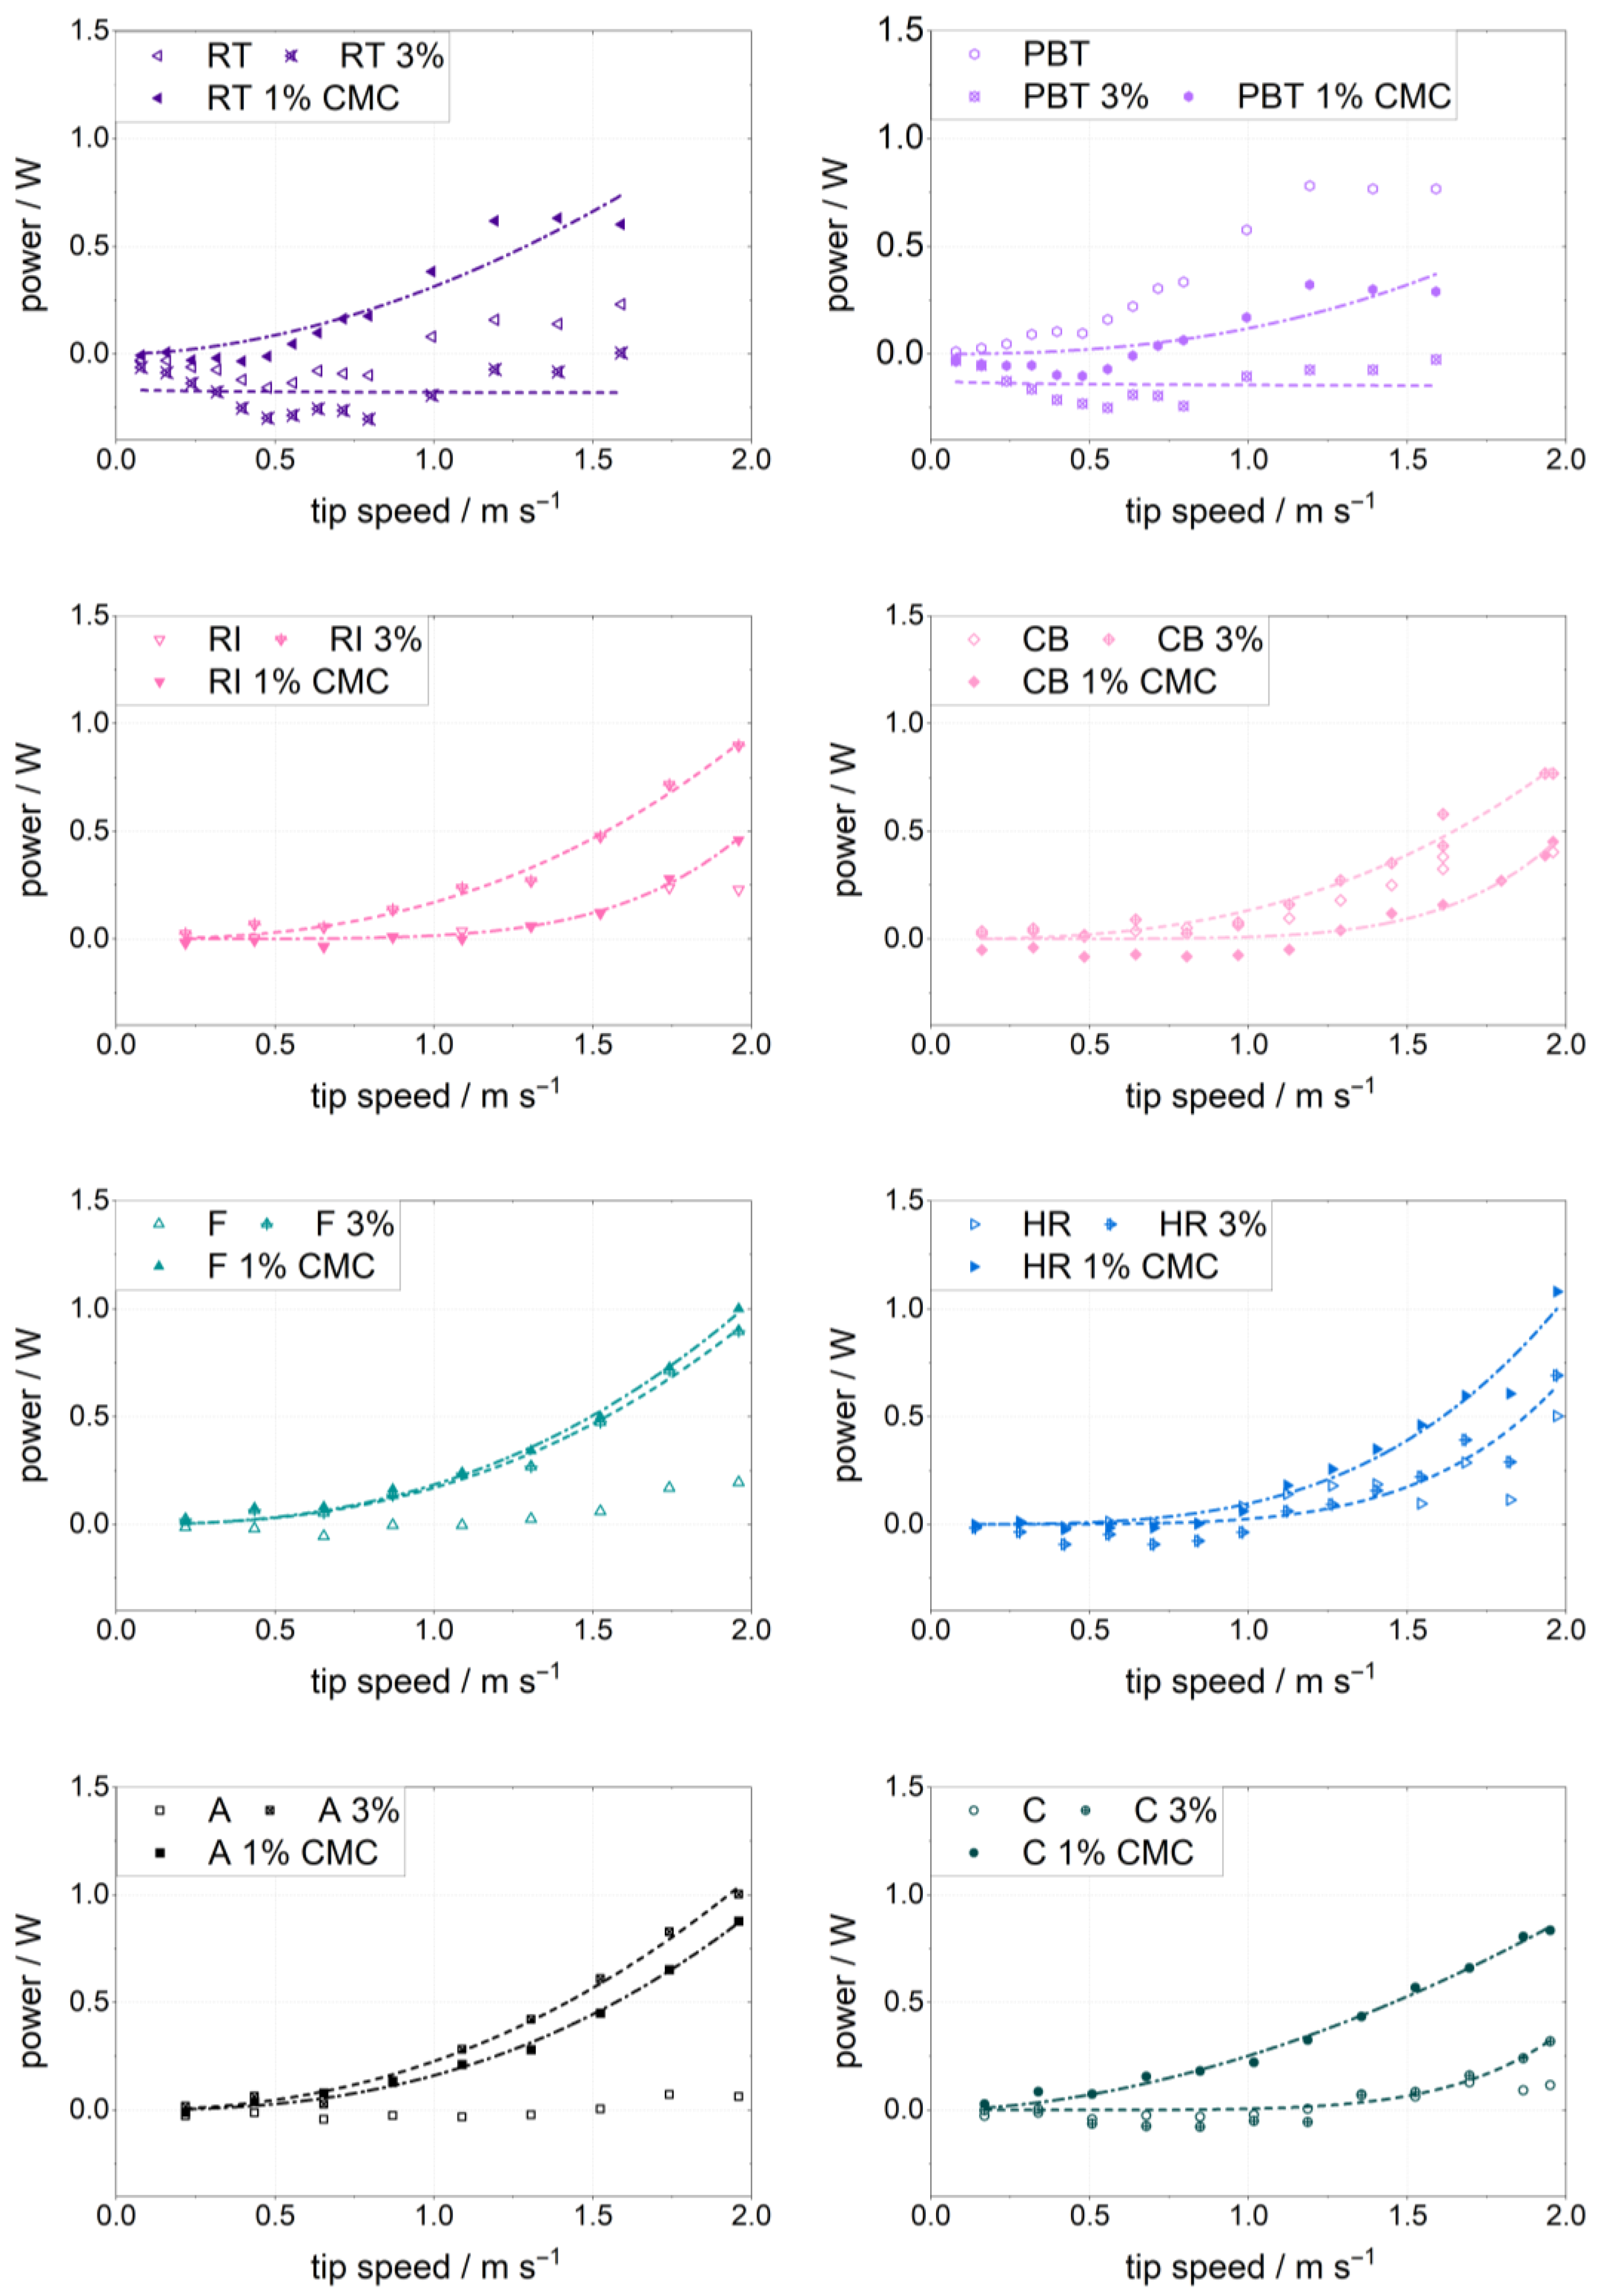
To investigate the effect of suspending activity in comparison to simple stirring of homogenous Newtonian and non-Newtonian fluids, comparisons of power consumption curves of 1% and 3% textile suspension with water and 1% CMC solution are shown in Figure 7 and Figure 8 respectively.
Power consumption remains relatively constant at ≤0.1 W deviation from the motor baseline for pure water, until deviations occur at higher speeds due to vortex formation or turbulence. Power consumption is closely aligned (≤0.2 W difference) to that of water for the RI, CB, F, HR, and C geometries. Deviations are seen for the RI and CB at high rotational speeds, where the power consumption of the textile suspension supersedes that of the more viscous CMC solution. When using the anchor, the opposite occurs, suspension and solution require similar power amounts. For the PBT, energy consumption decreases below 0.5 m·s−1, then increases and reaches a plateau after 0.75 m·s−1 in pure water and CMC solution. The plateau is much less pronounced for the textile suspension. Investigation of the images in Appendix A shows that for the textiles, no vortex formation took place, indicating lower total energy uptake via global fluid mixing. In the RT plot, the plateau can be seen at 1% textile suspension, but not for the 3%. Likewise, in Appendix A, vortex formation can be observed at 1% and in pure water, but not at 3% suspension, affirming this hypothesis.
For the larger radial/tangential impellers, energy consumption of the suspension is very similar to that of the CMC solution. Trends are less clear for HR, CB, and the two turbines. For the CB, CMC solution is generally less energy-intense than the textile suspension, possibly due to early-occurring vortex formation and turbulence. The helical ribbon shows a similar power consumption between textile suspension and water, suggesting that regardless of concentration, the solids are moved and not suspended until relatively high speed.
From the preliminary rheometric curves, a clear increase in power consumption of 1% textile < 1% CMC < 3% textile was assumed. This was not affirmed; instead, the order of power consumption differed by geometry. This suggests that the defining influence on power efficiency in textile suspension is uplift and mixing of the solid, rather than its measured apparent viscosity.
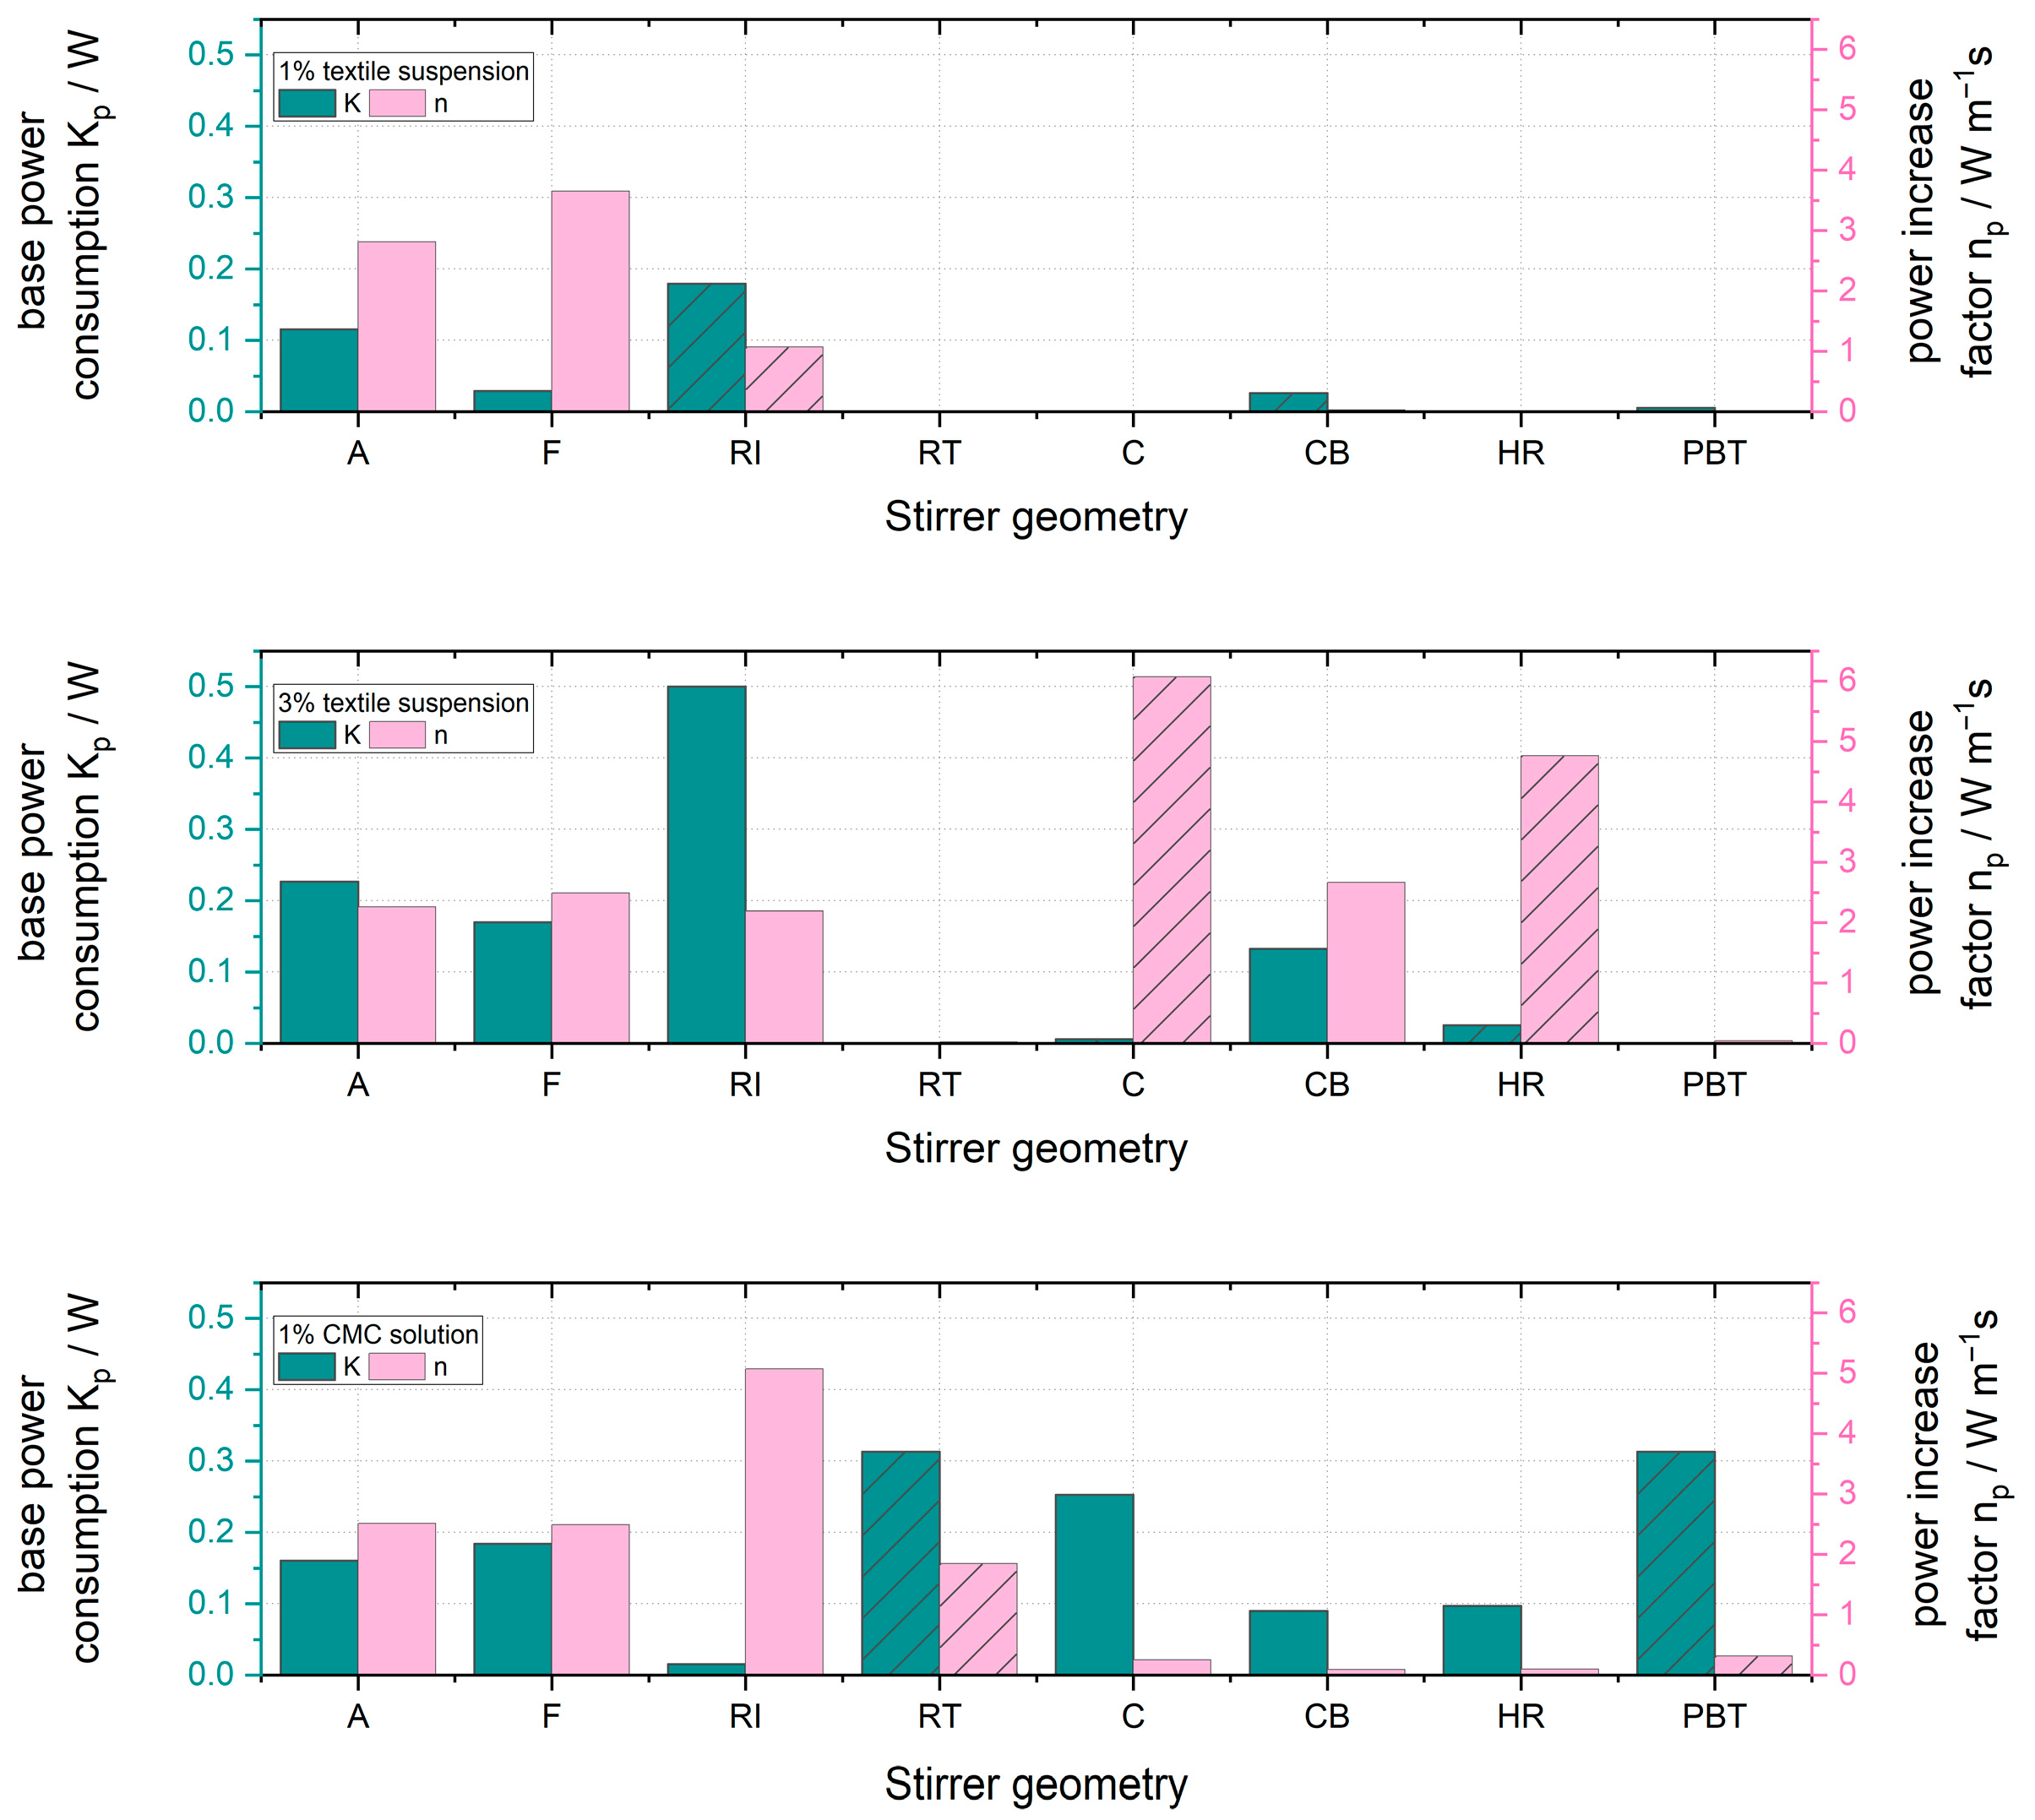
The experiments in textile suspension and CMC solution were further analyzed using a power law fit, containing base power consumption factor Kp in W and a power increase factor np in W m−1 s over the tip speed s in m s−1. Several speed–power correlations, especially in the less concentrated textile suspension, do not allow power law correlation fitting:
P = K p   · s n p
Power law parameters for both textile suspensions and CMC solution are plotted in Appendix D. At 1% suspension, power consumption remains almost constant near 0 for the majority of geometries and speeds. In this case, a power law fit is not applicable, indicating that the suspension is mixed as water containing particles, instead of a non-Newtonian fluid. The exception is given by the close-clearance impellers A and F.
At 3% textile suspension, a fit quality of R2 > 0.9 is achieved for A, F, RI and CB geometries. Anchor and frame have a similar base power requirement K around (0.19 W ± 0.03) and similar power increase factor np (2.37 ± 0.18 W m−1 s). The RI has a much Kp (0.5 W) at a slightly lower np (2.19 W m−1 s), while the CB shows less base power Kp (0.13 W) but larger increase with tip speed n (2.66 W m−1 s). While F, RI and CB achieved high cloud height values, A did not, suggesting that power consumption is affected by another factor in addition to suspension activity. This is further supported by the fact that the close-clearance impellers A and F show similar base power requirements (0.17 W ± 0.01) and power increase factors (2.5 ± 0.01 W m−1 s) in homogenous CMC solution. For all evaluated (R2 > 0.9) stirrers, 3% textile suspensions show comparatively higher K and lower n-vlaues than in 1% CMC solution. This correlates to the preliminary rheological measurements shown in Figure 4, where 3% textile suspension shows higher initial viscosity but less shear thinning than the 1% CMC solution, while showcasing that viscosity, when defined as “resistance to flow” is geometry dependant.

3.2.3. Mixing Time

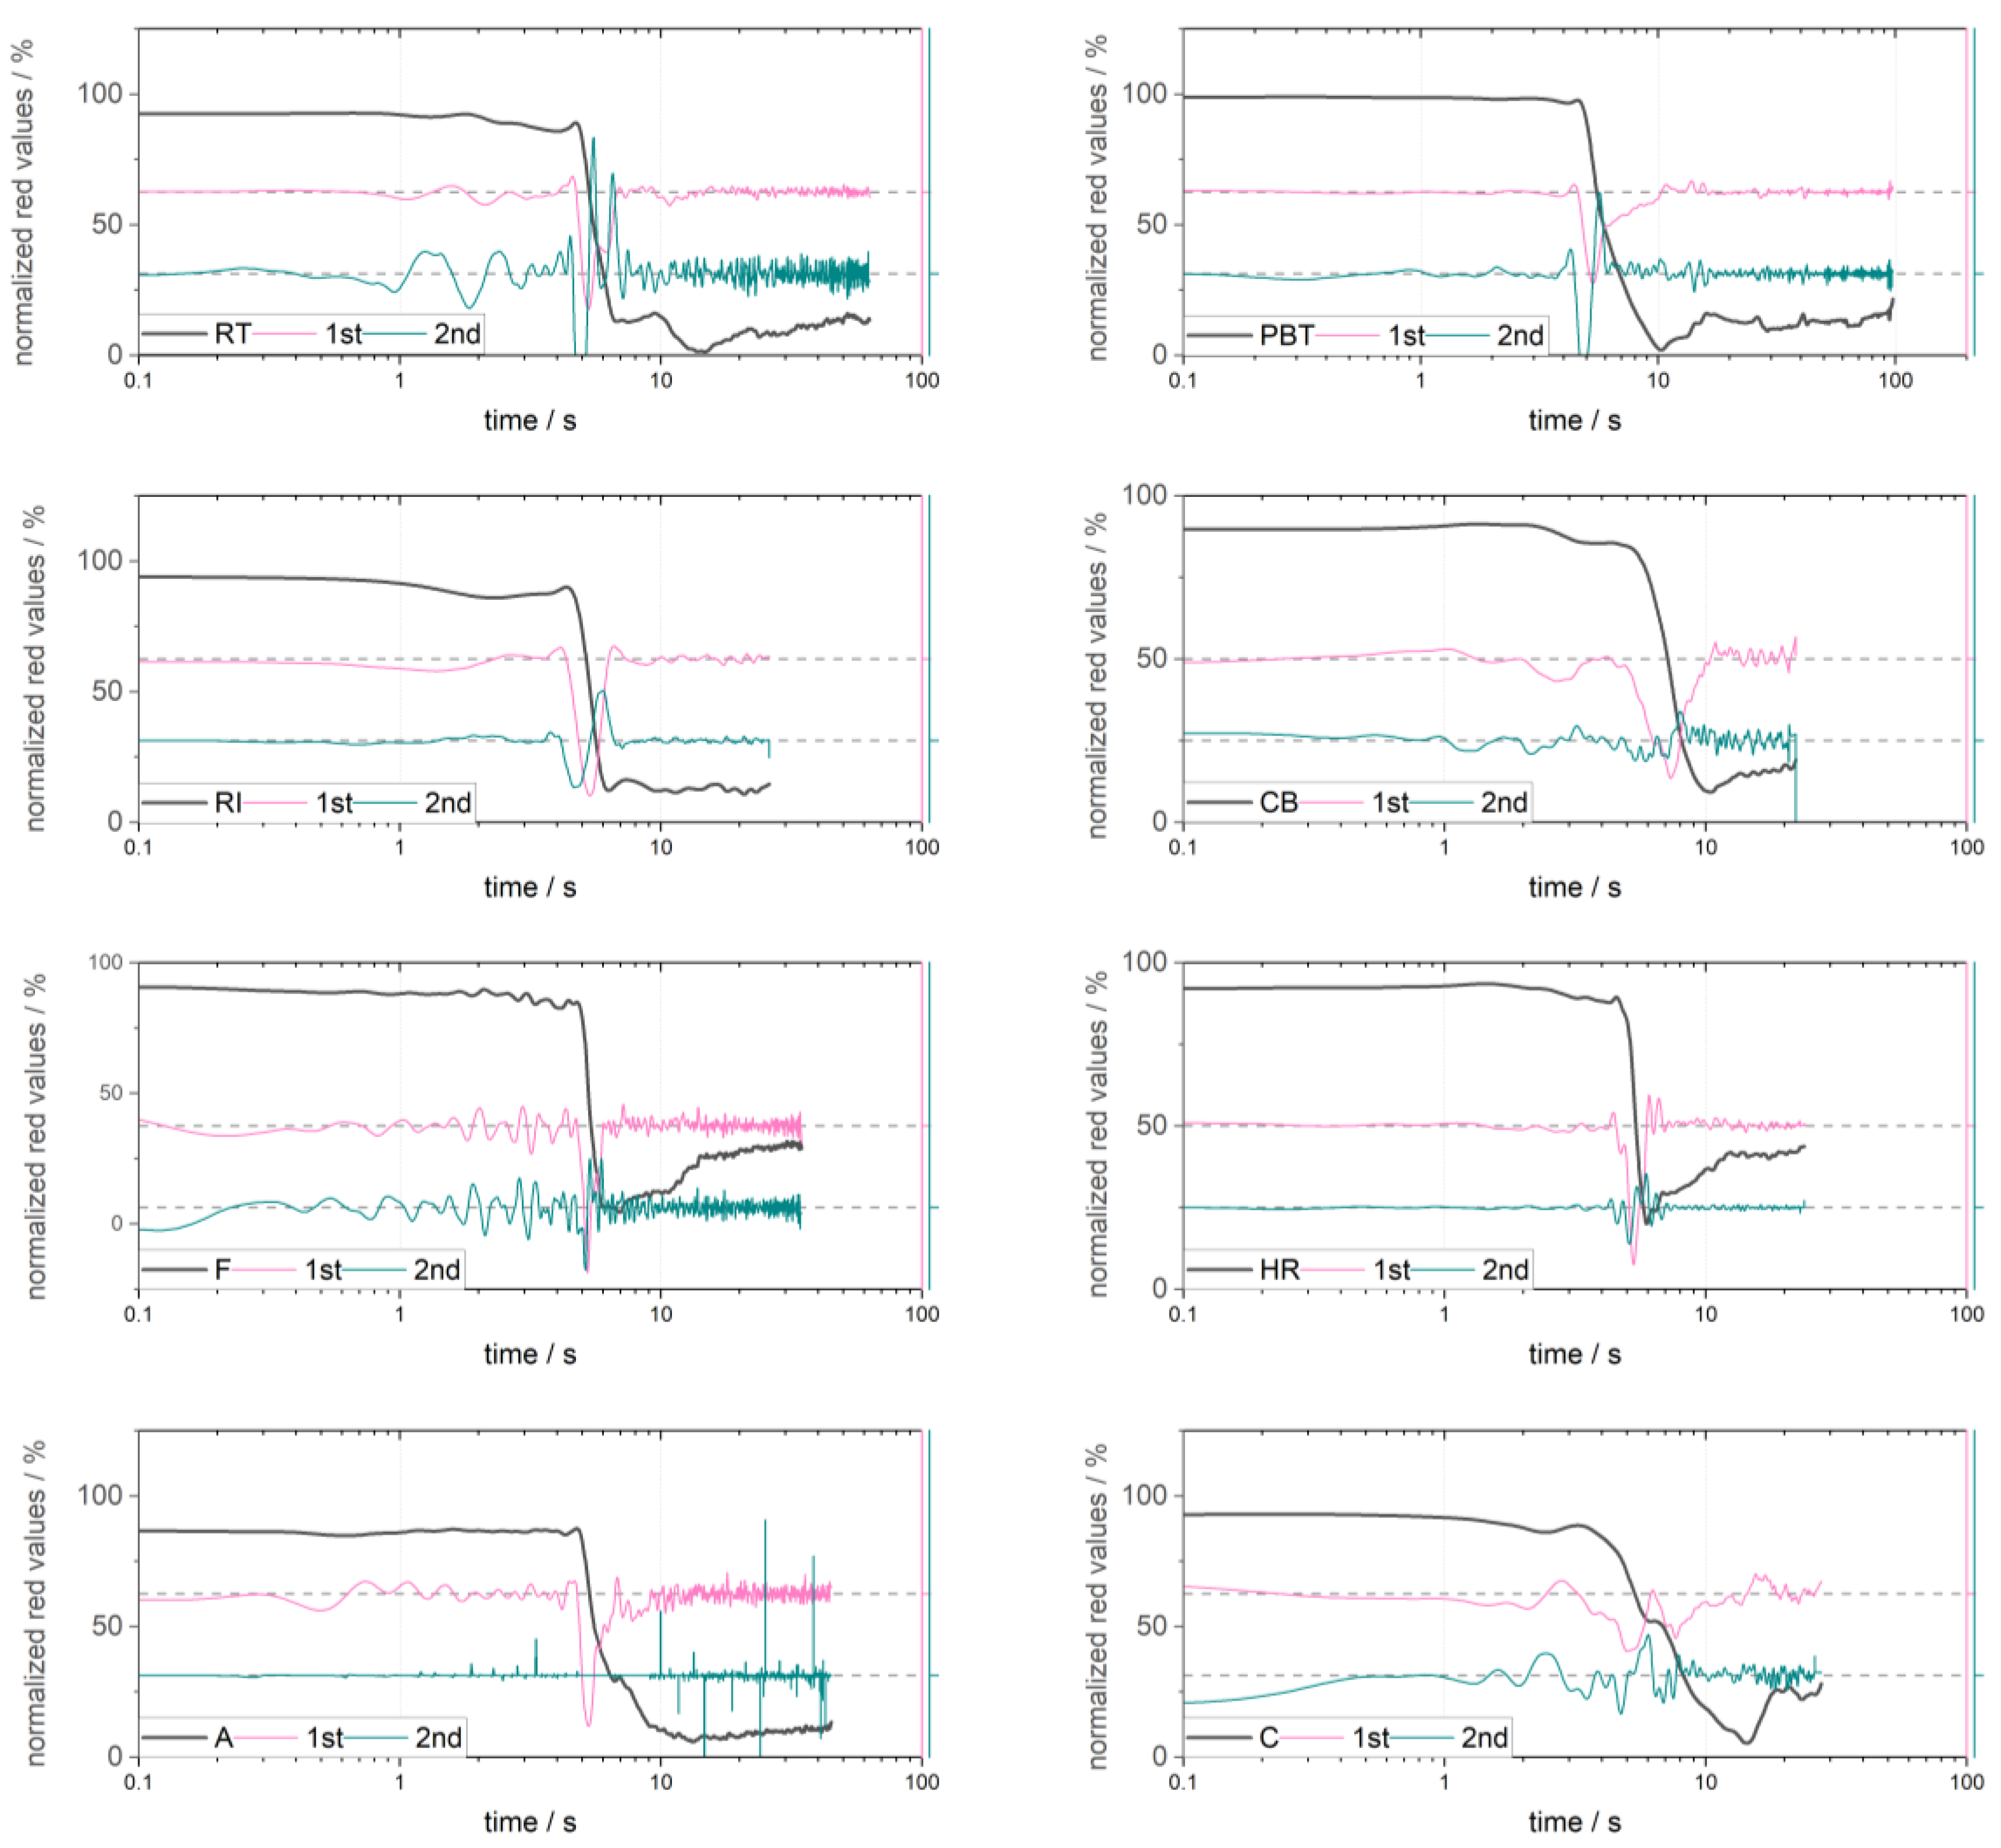
Mixing time experiments were performed in aqueous textile suspension and CMC solution. Analysis of the mixing time was performed by determining the point of dye addition and monitoring the decrease in opposite primary color. Figure 9 shows normalized and smoothed color-response curves as well as their first and second derivation. While some interference from particle movement is visible within the plots, the rapidity of the color change (shown by the slope of the color signal) is a preliminary indicator of mixing efficiency. However, the method is likely to underestimate mixing time, since the derivations are vulnerable to interference and visual assessment of the suspension mixing is necessary to confirm end set points. The radial impeller RI and helical ribbon HR showed stable color development < 0.2 min, while the majority of geometries required roughly 0.4 min. The Rushton and pitched-blade turbines required each required >1 min, showing the lowest colorimetric mixing efficiency in aqueous suspension.
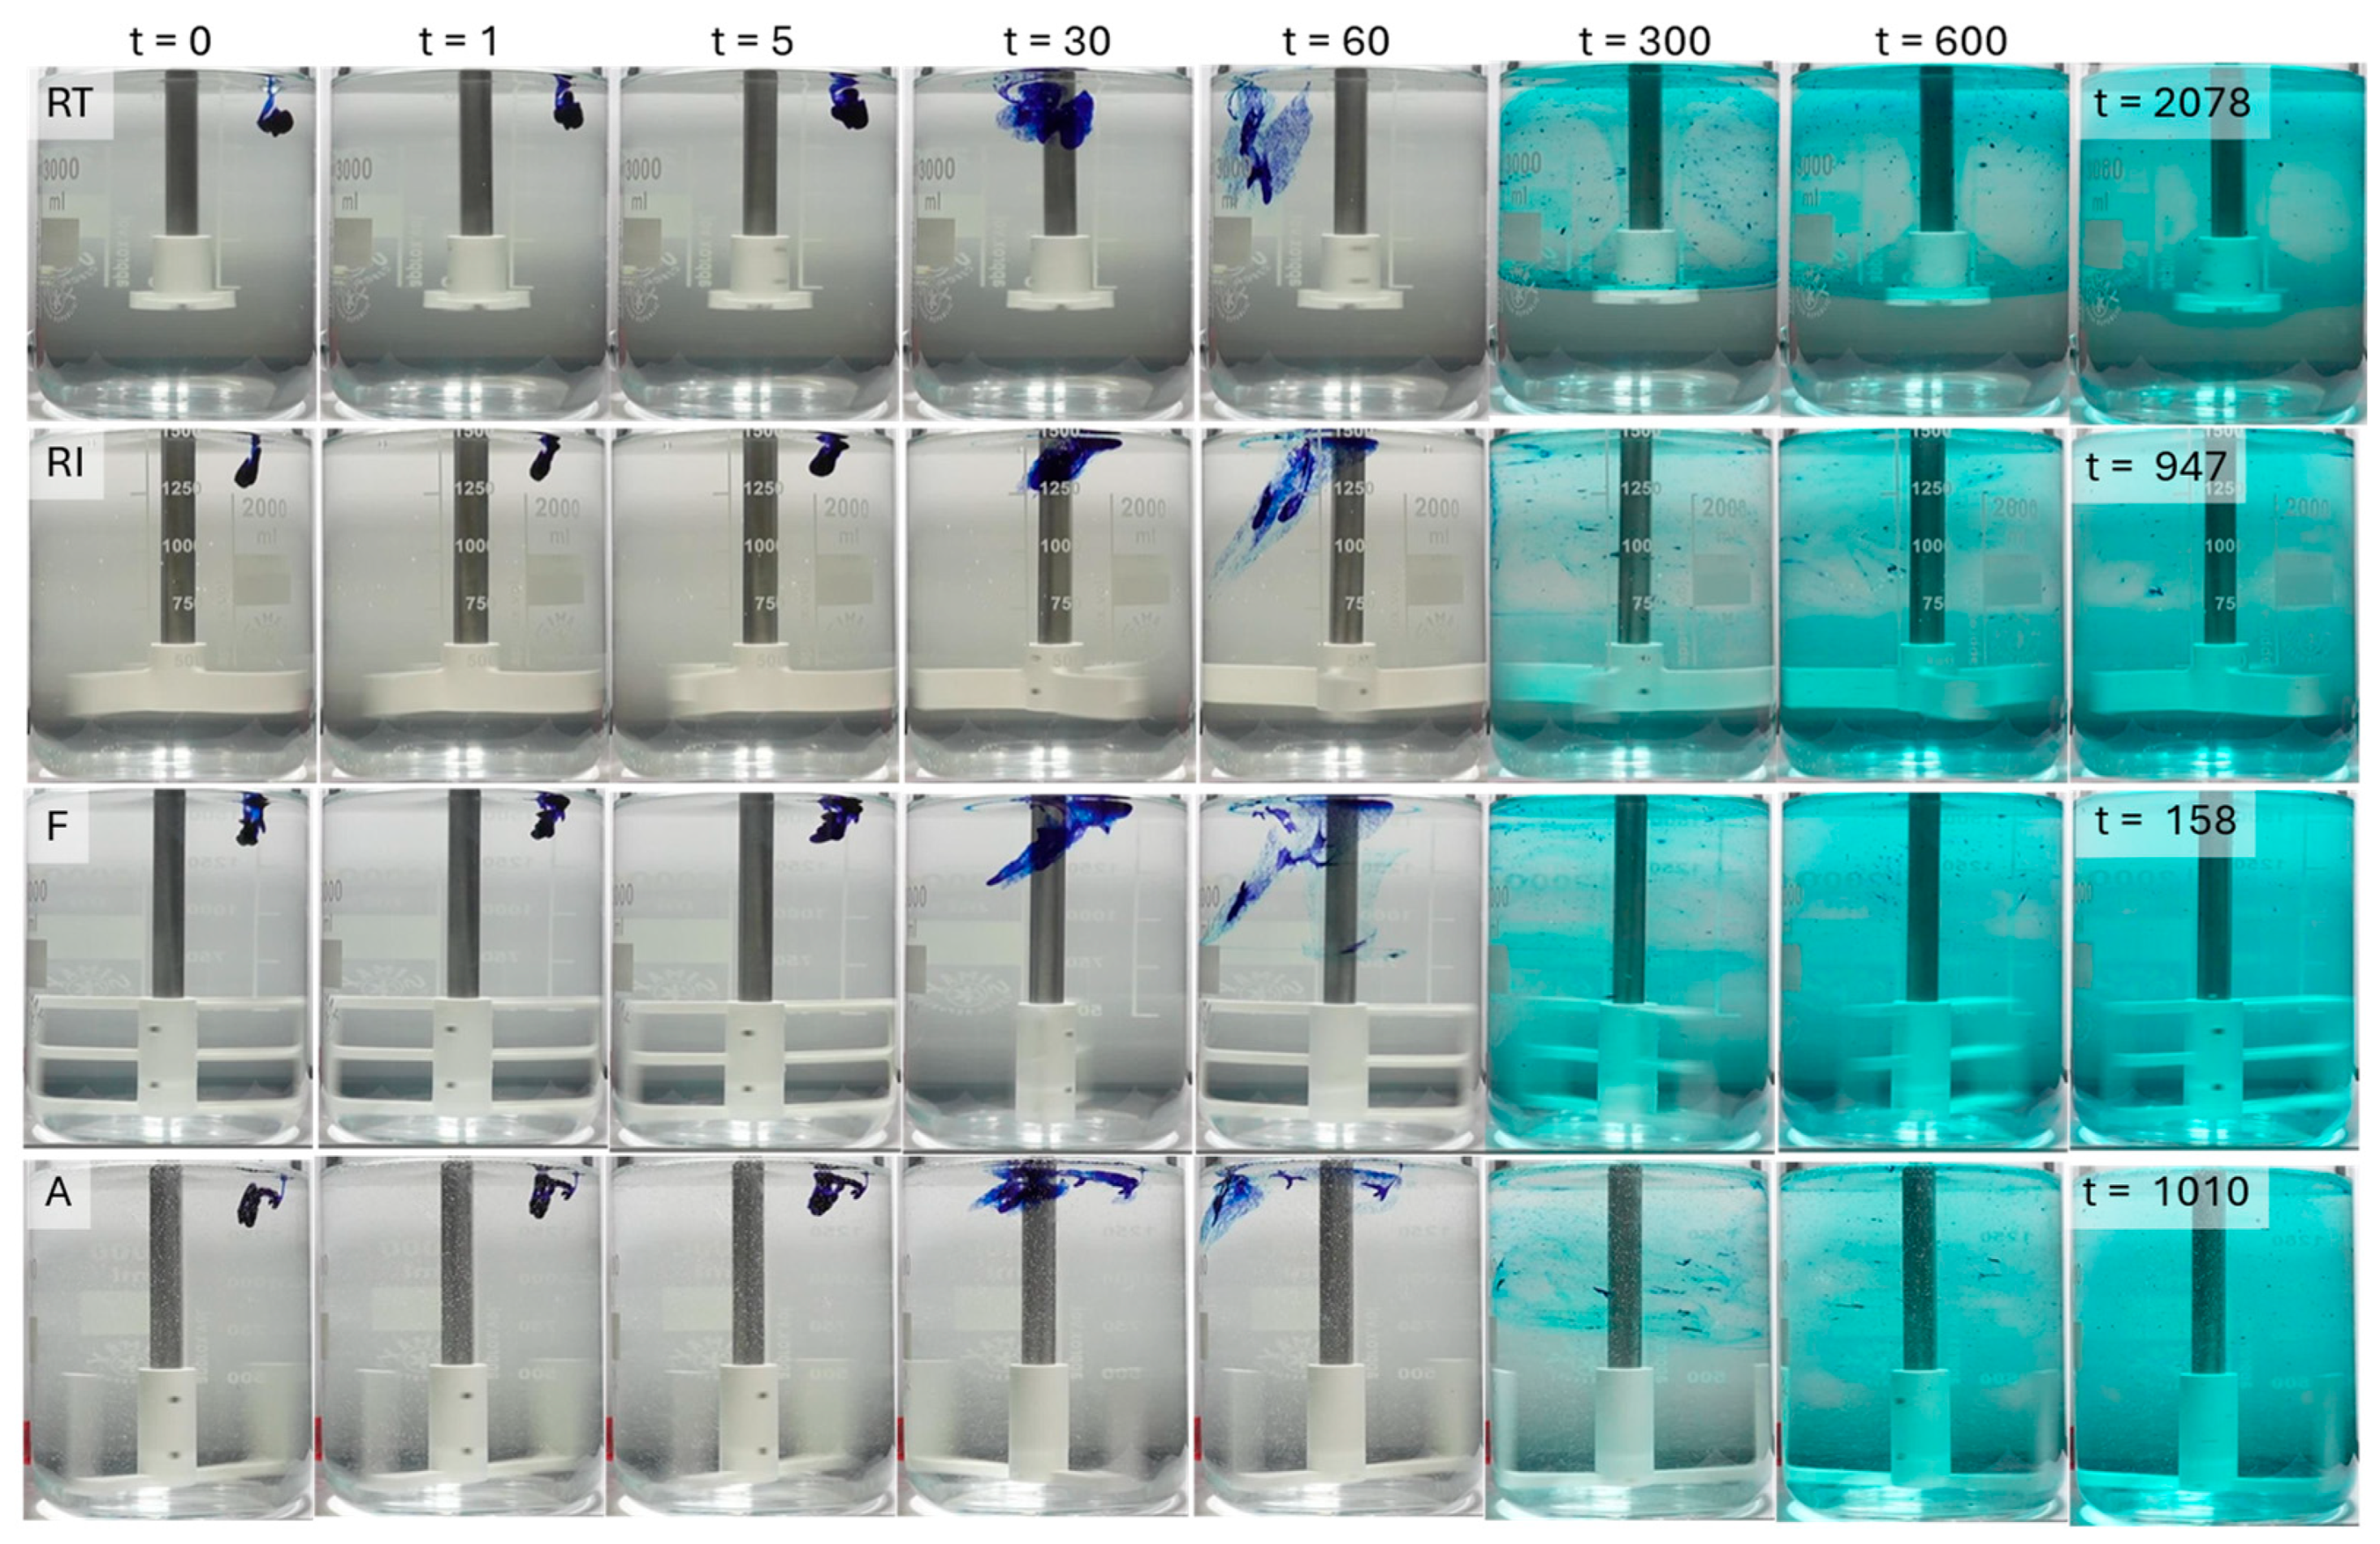
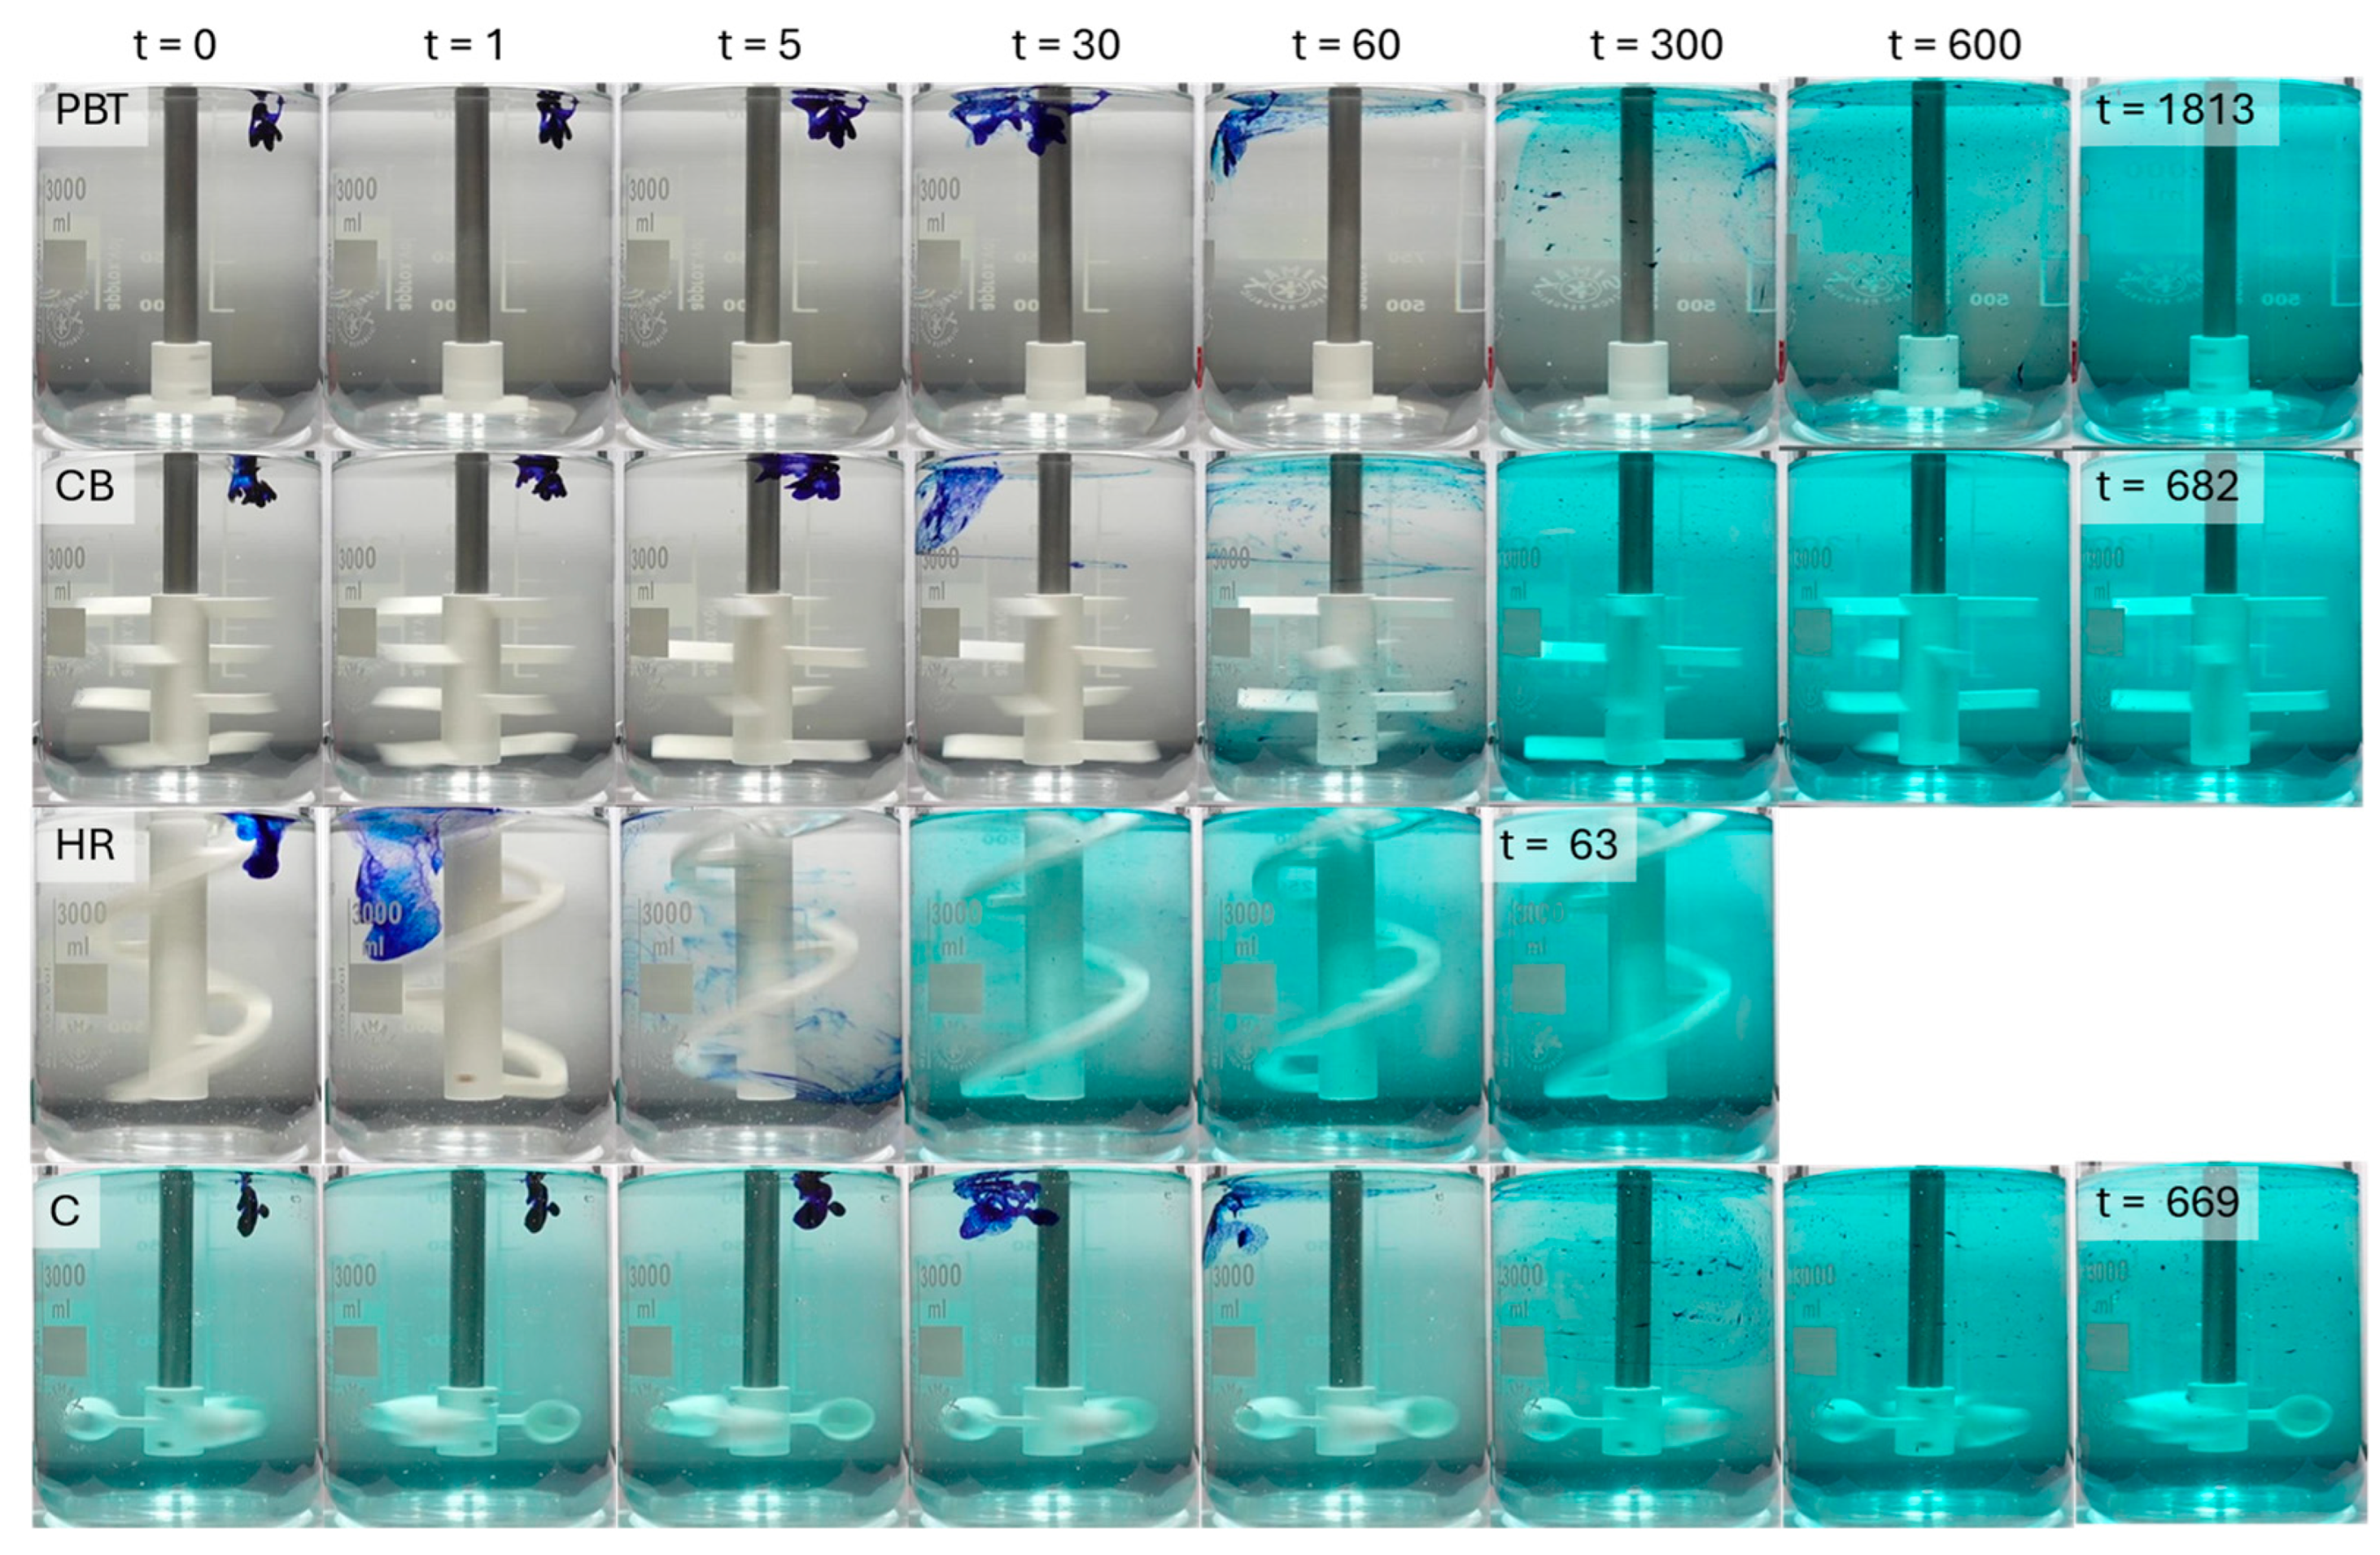
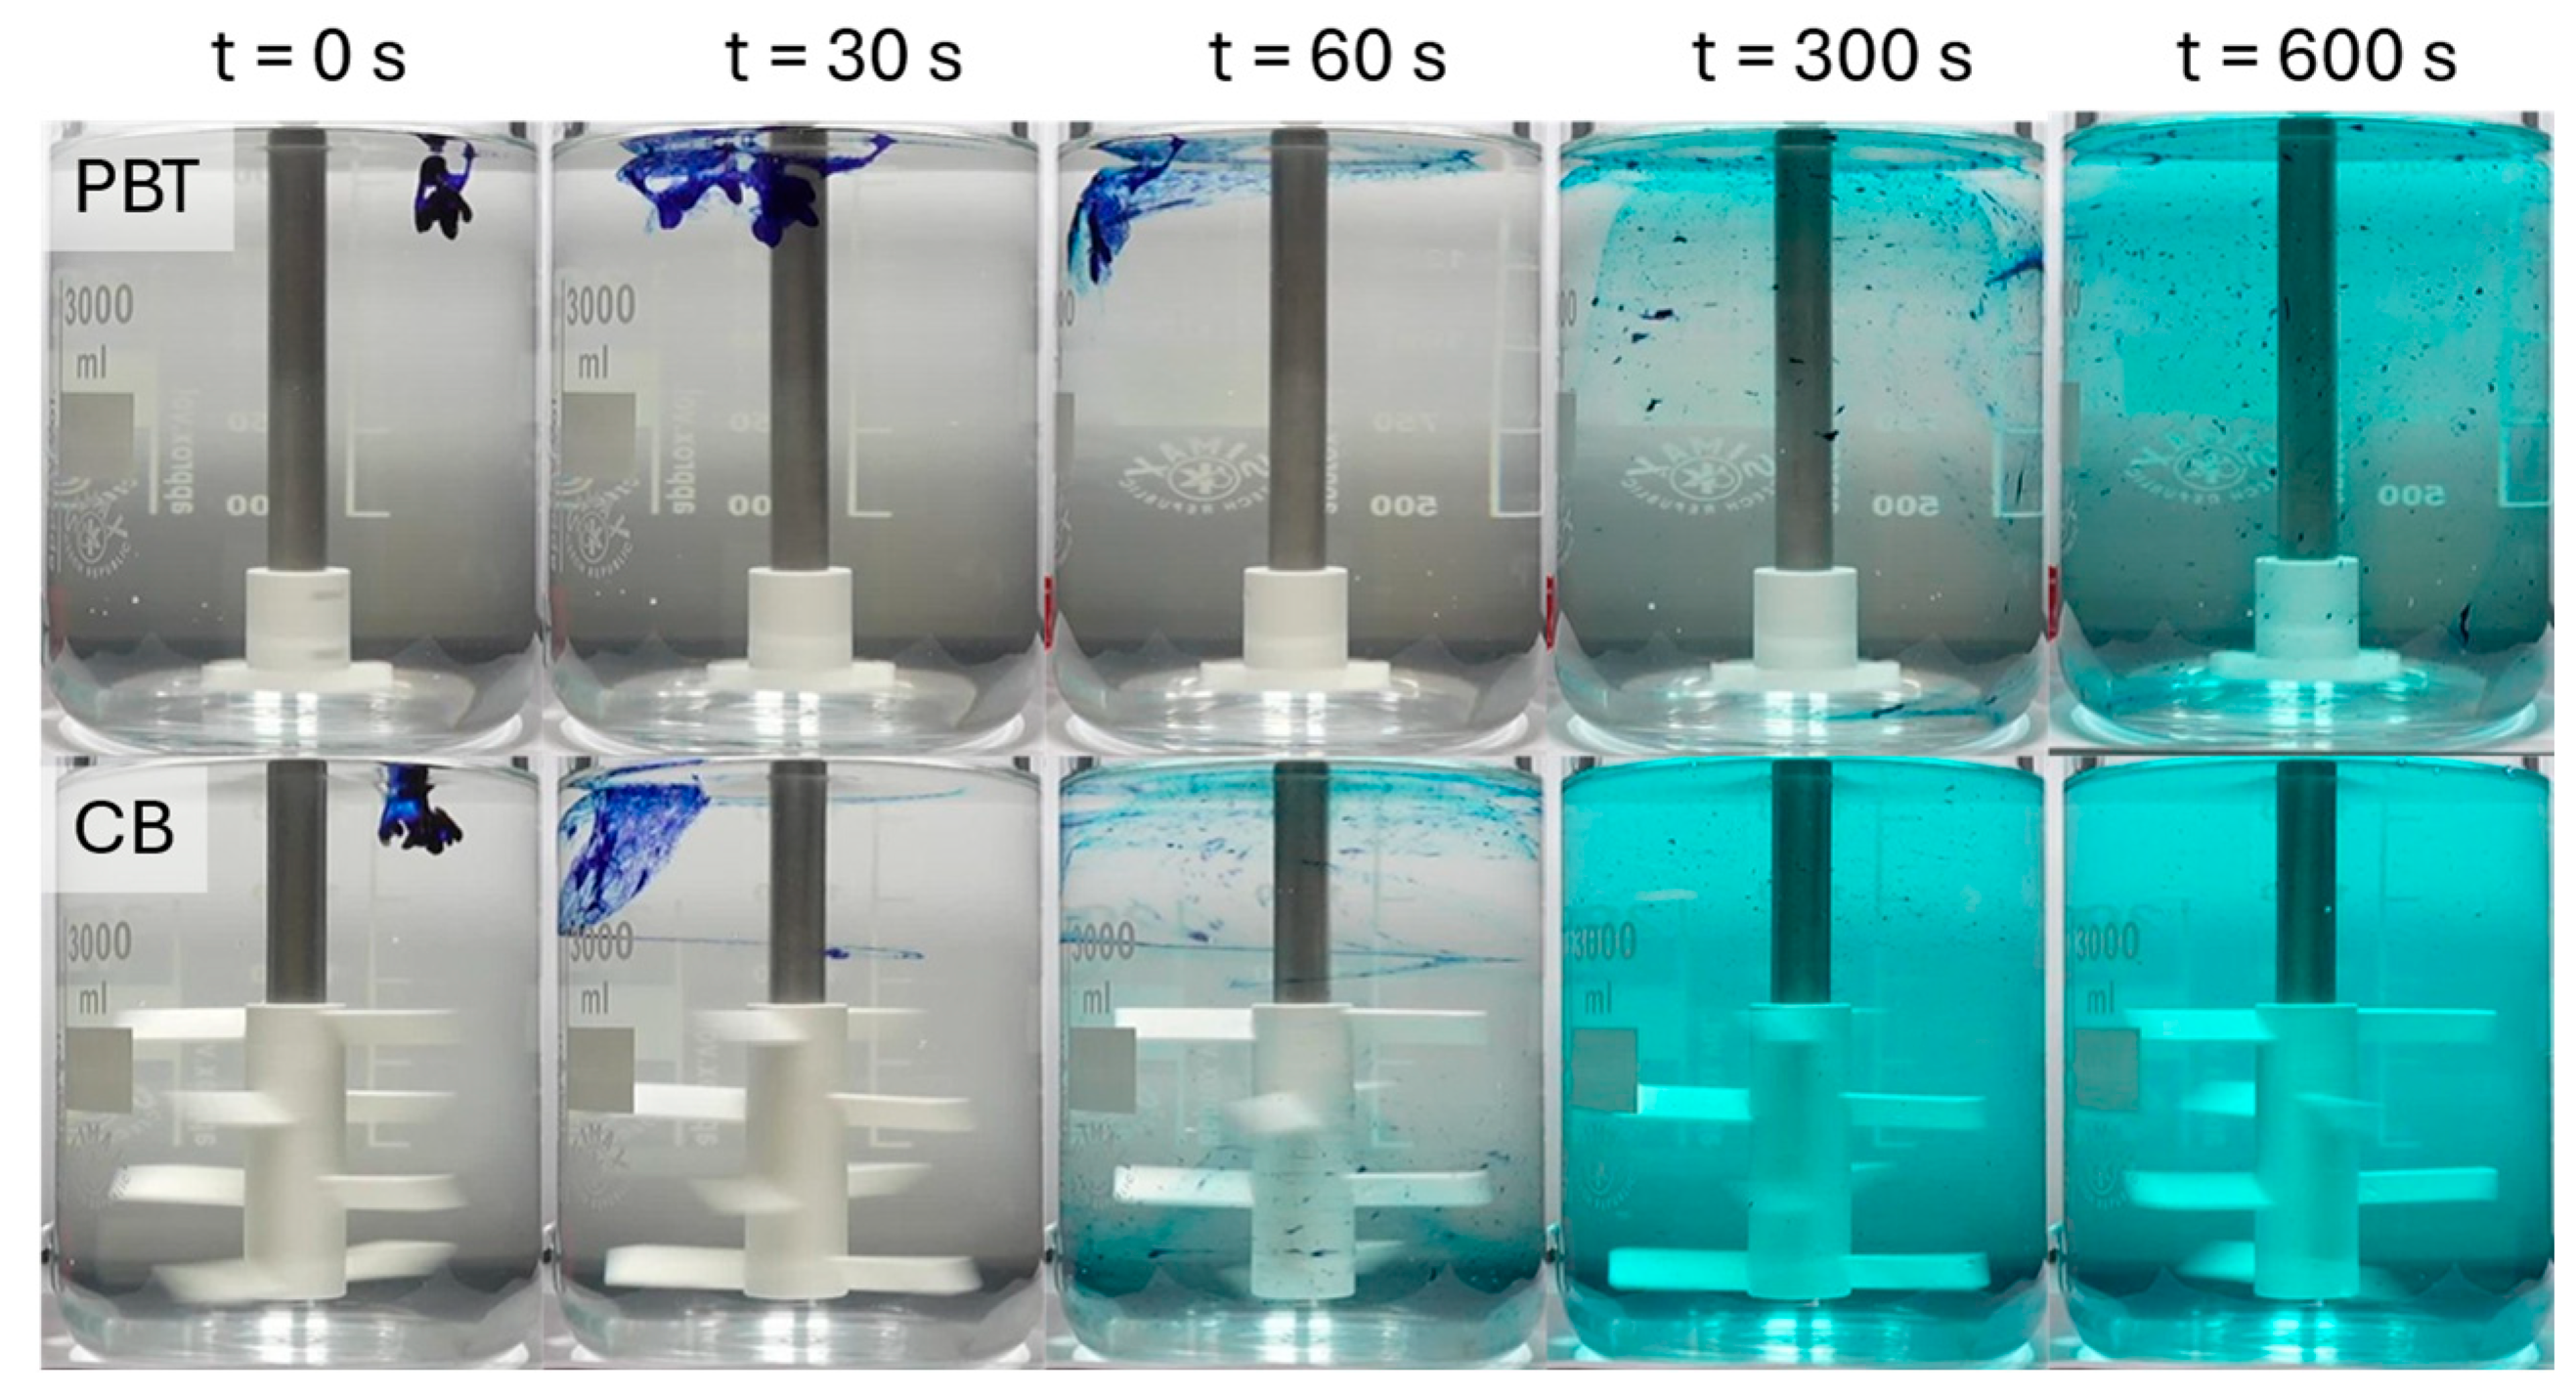
In CMC, often much longer mixing times were required, rendering the color–time analysis inefficient due to both space and processing power concerns. Instead, images were extracted and evaluated at fixed time intervals. Extracted frames from each timestamp are shown in Appendix B. As an example, the pitched-blade turbine and crossbeam impeller are shown in Figure 10.
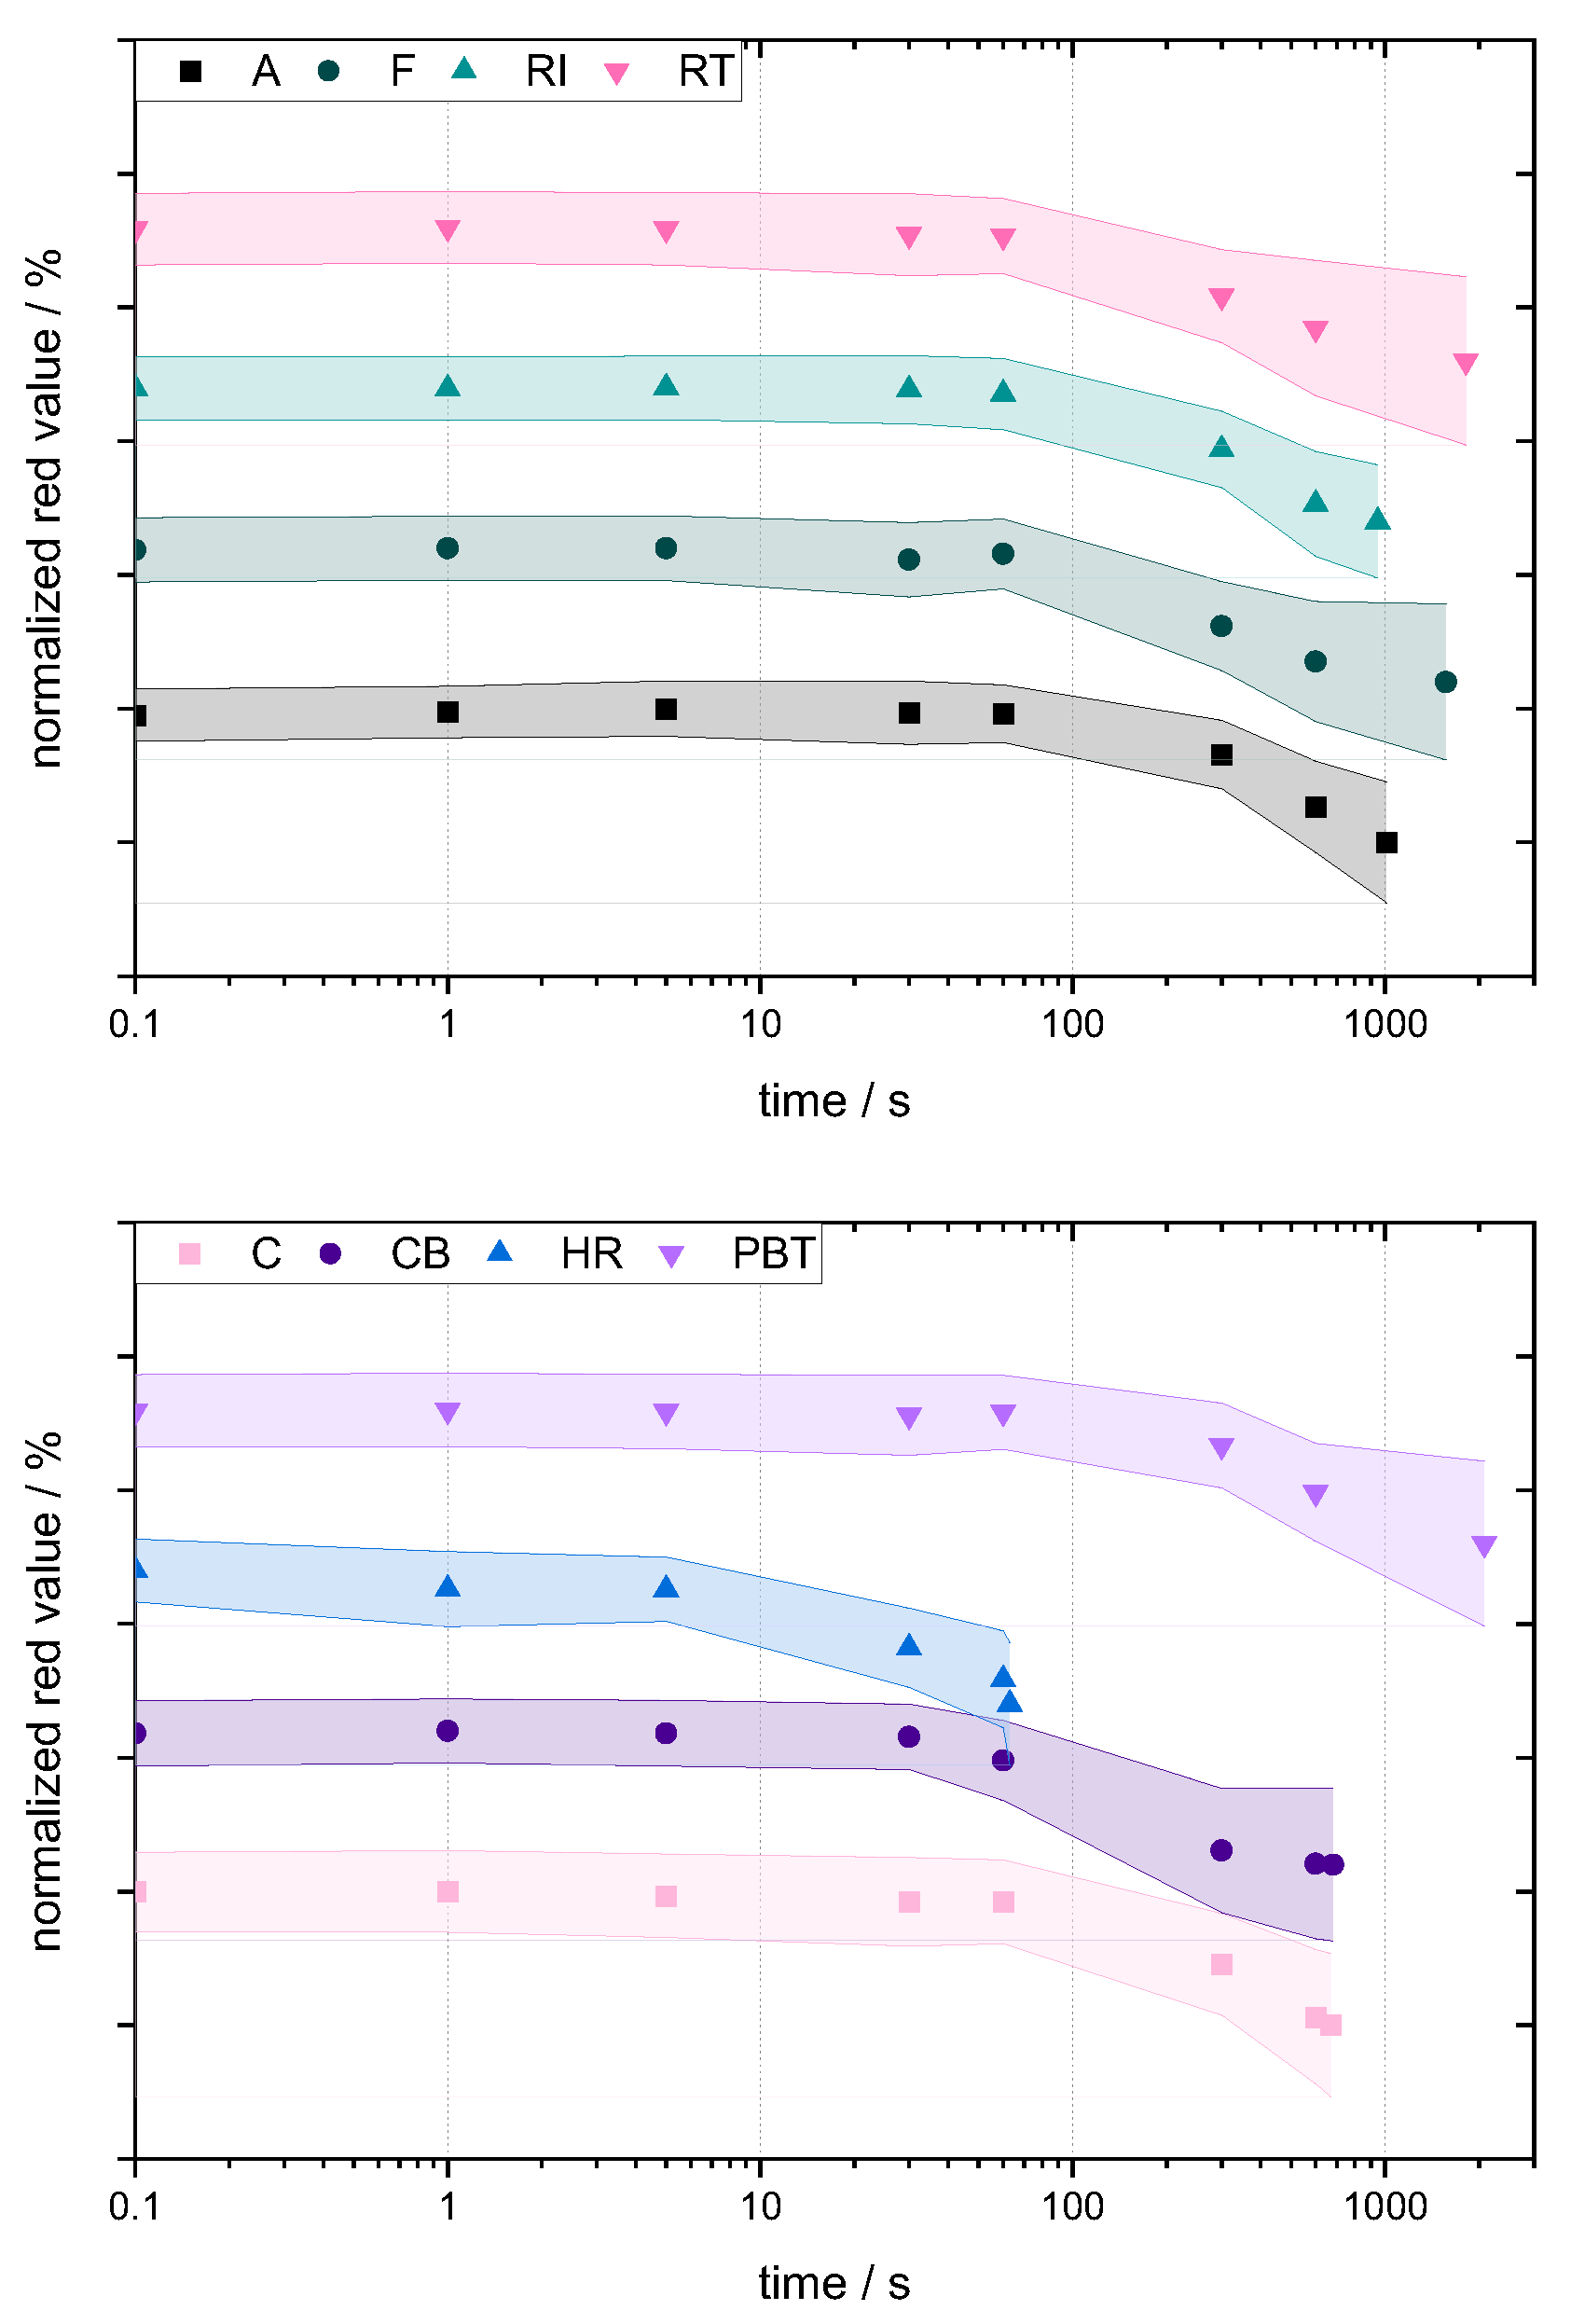
The progress of dye distribution can be separated into two phases: an initial phase dominated by diffusion (0 s–30 s), and an active mixing phase after the dye enters the stirrers’ sphere of influence (60 s). The distribution of the dye can be represented by the average color of the solution and evaluated analogously to the suspension (see Figure 11). Mixing occurs both via overall distribution of color throughout the vessel, and by breaking of residual agglomerates (see Figure 10, 300 s, both stirrers). However, while the former occurred for all stirrers within the monitored timeframe (≤30 min), the latter was mainly observed for two of the axial flow stirrer geometries (HR and CB, see also Appendix B). Colorimetric mixing time assessments are plotted in Figure 11.
The color evolution analysis also shows increased mixing efficiency for axial flow pattern stirrer geometries. While radial/tangential flow patterns require >60 s of mixing time to occur before a noticeable drop in red value, especially the HR and CB axial stirrers show earlier color mixing. This may be due to increased overall mixing efficiency; however, due to the relatively large height of these geometries, it is more likely to result from a reduction in the initial, diffusion based mixing phase.

3.3. Semi-Pilot Scale Experiments

Mixing Efficiency—Suspension Activity

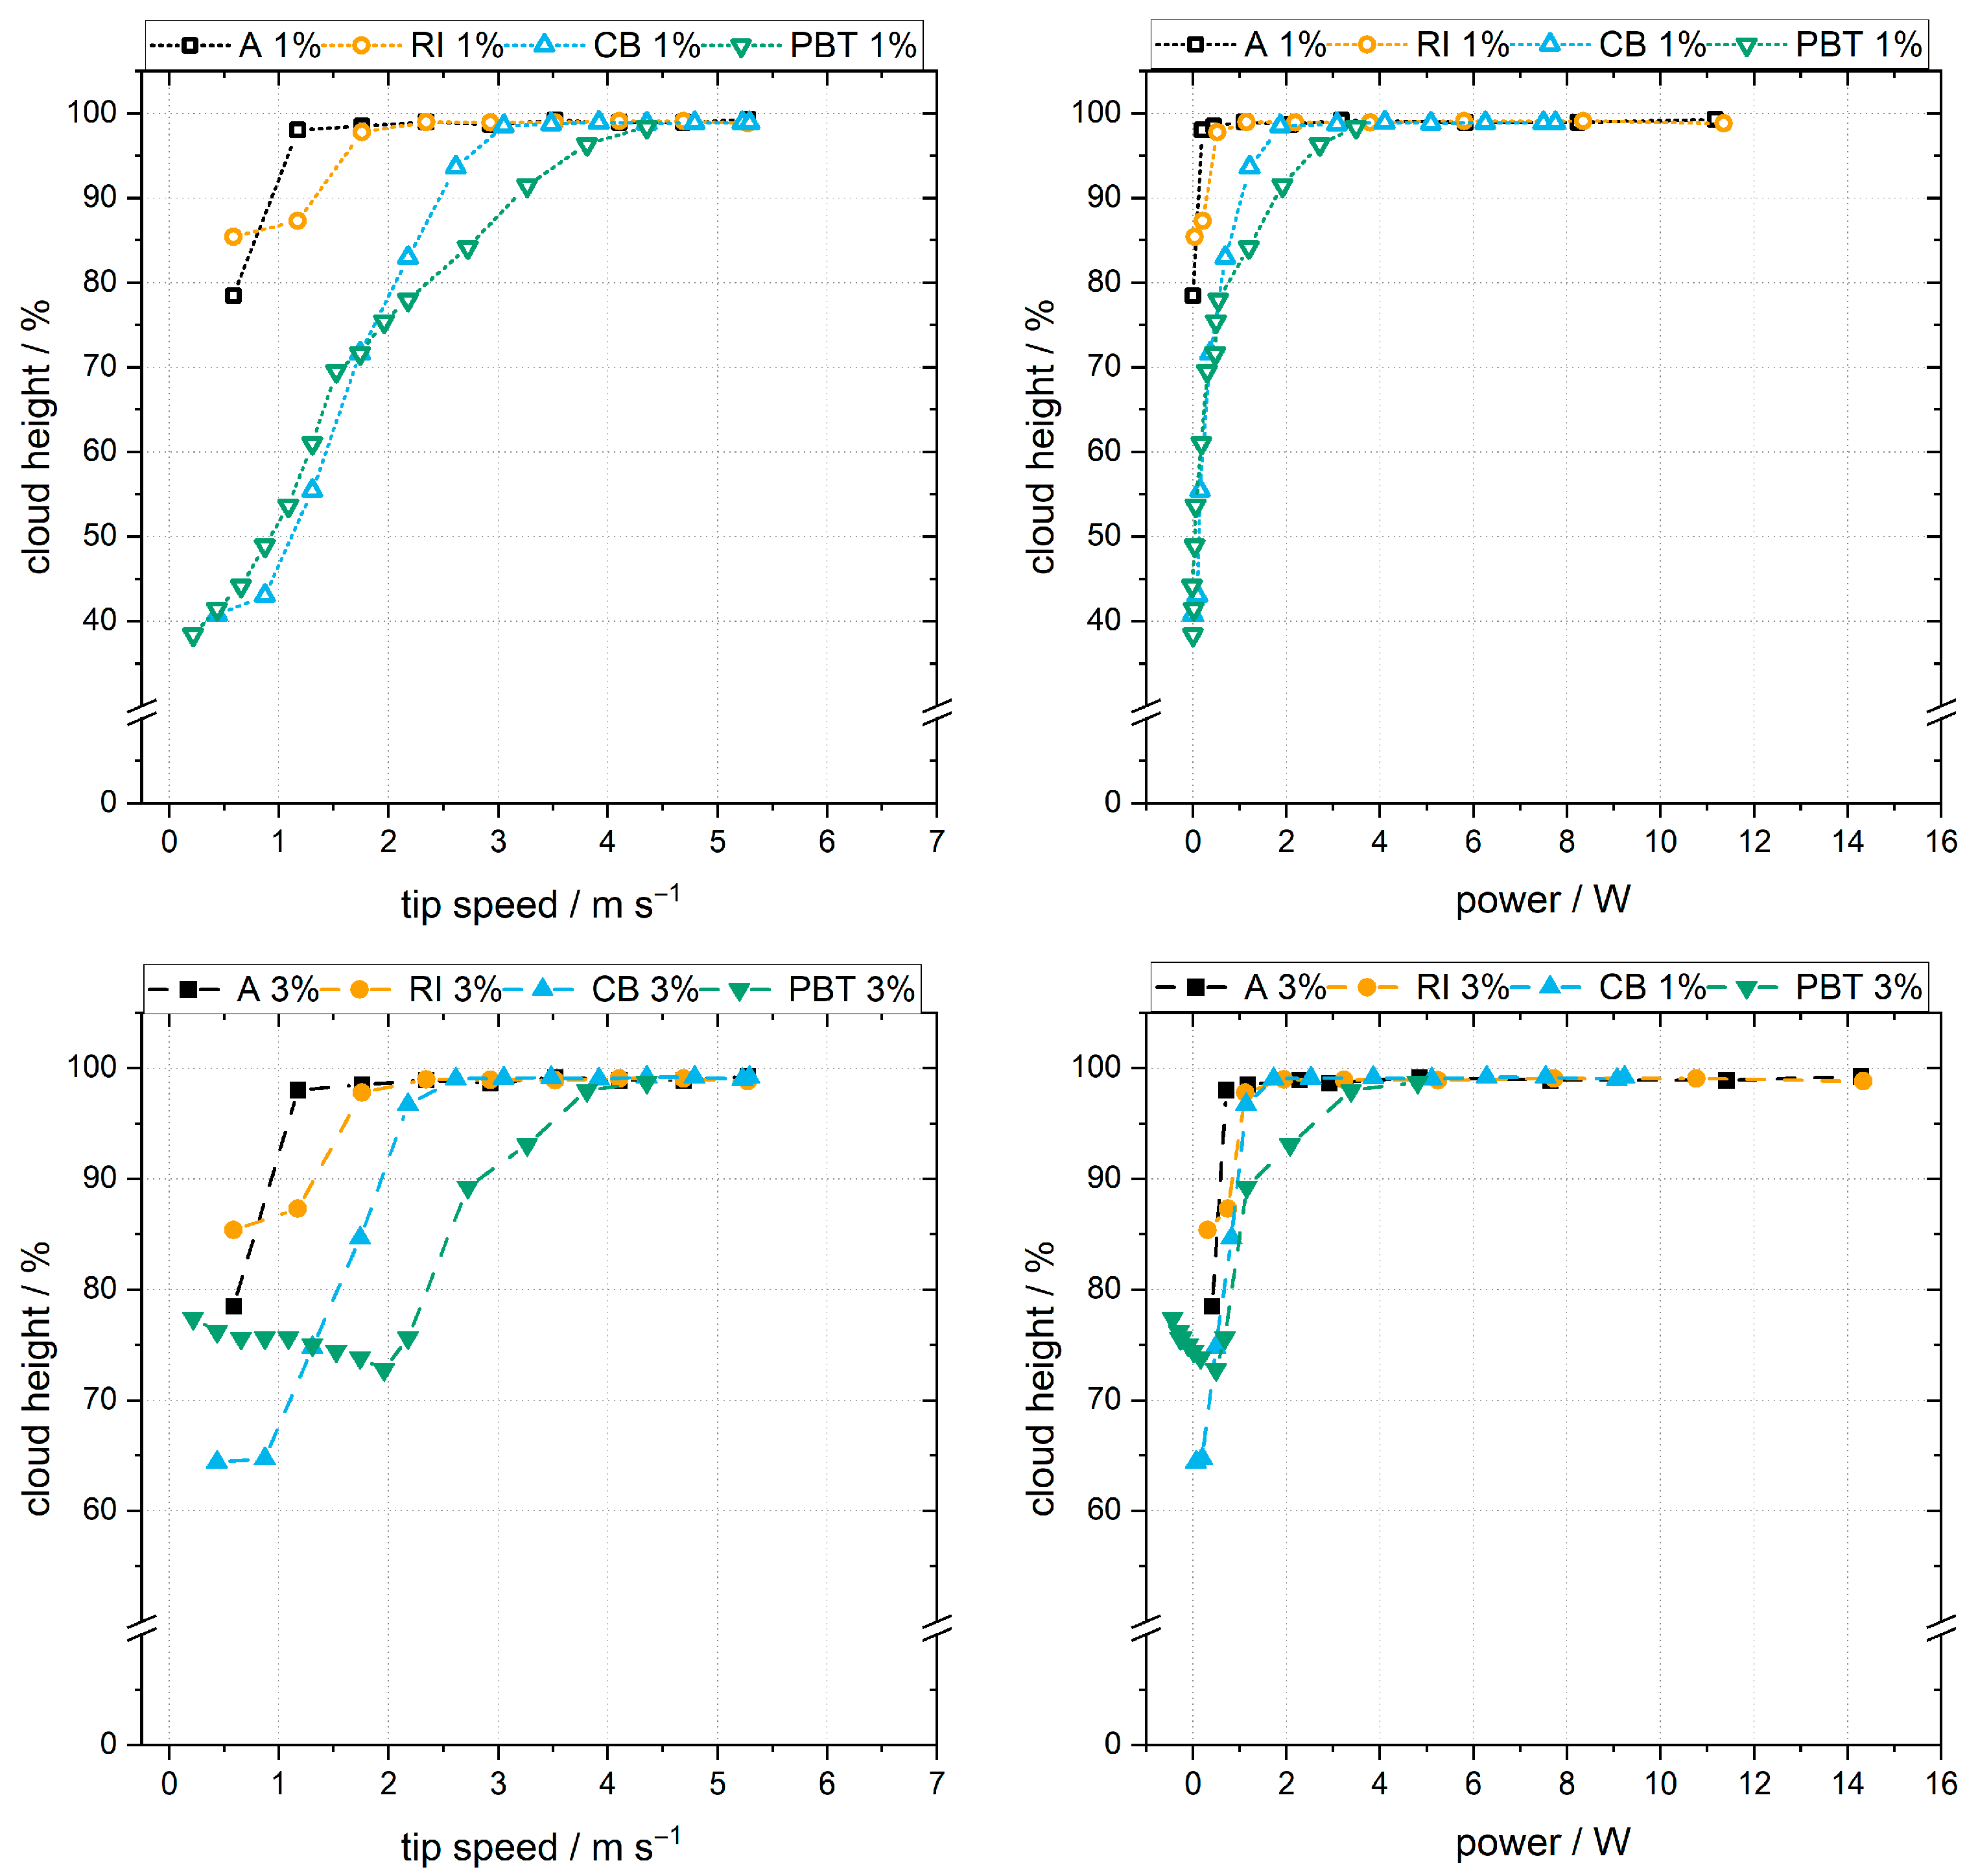
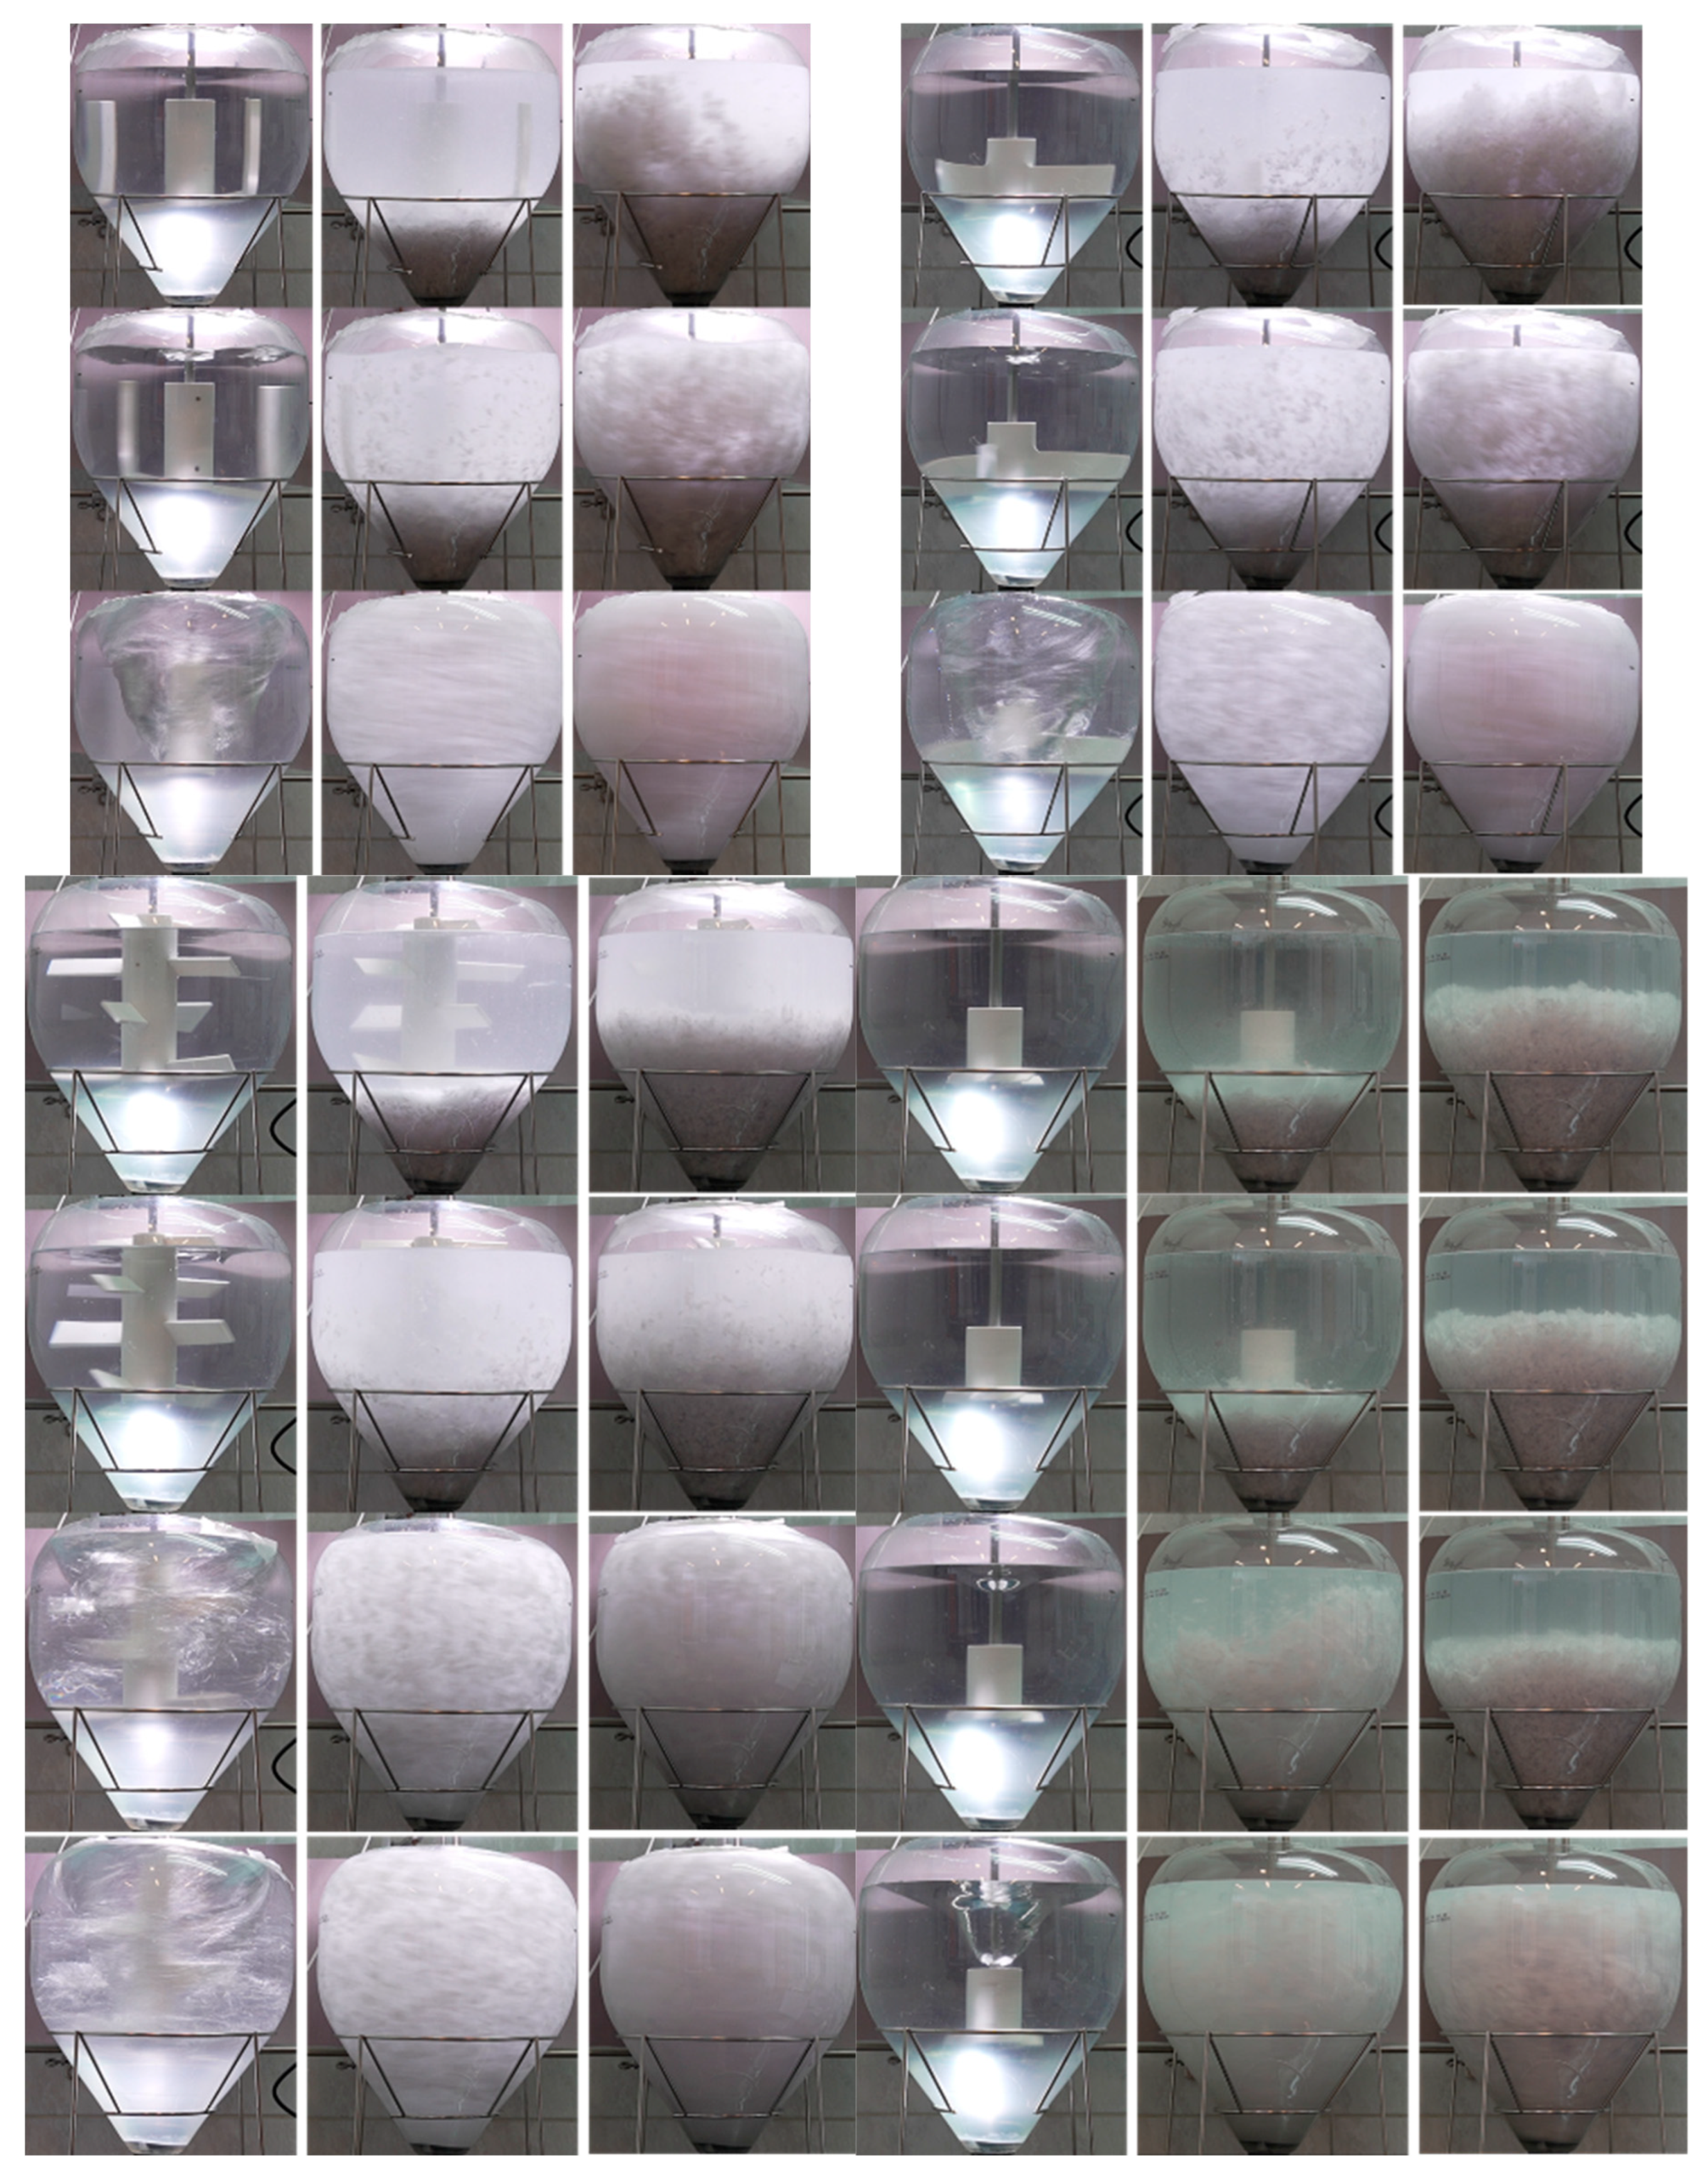
Images of all stirrers and concentrations can be seen at low (20 rpm), intermediate (60 rpm), high (180 rpm) and maximum (when not 180 rpm) motor speed in Appendix C. The cloud height in relation to tip speed and power consumption is shown in Figure 12.
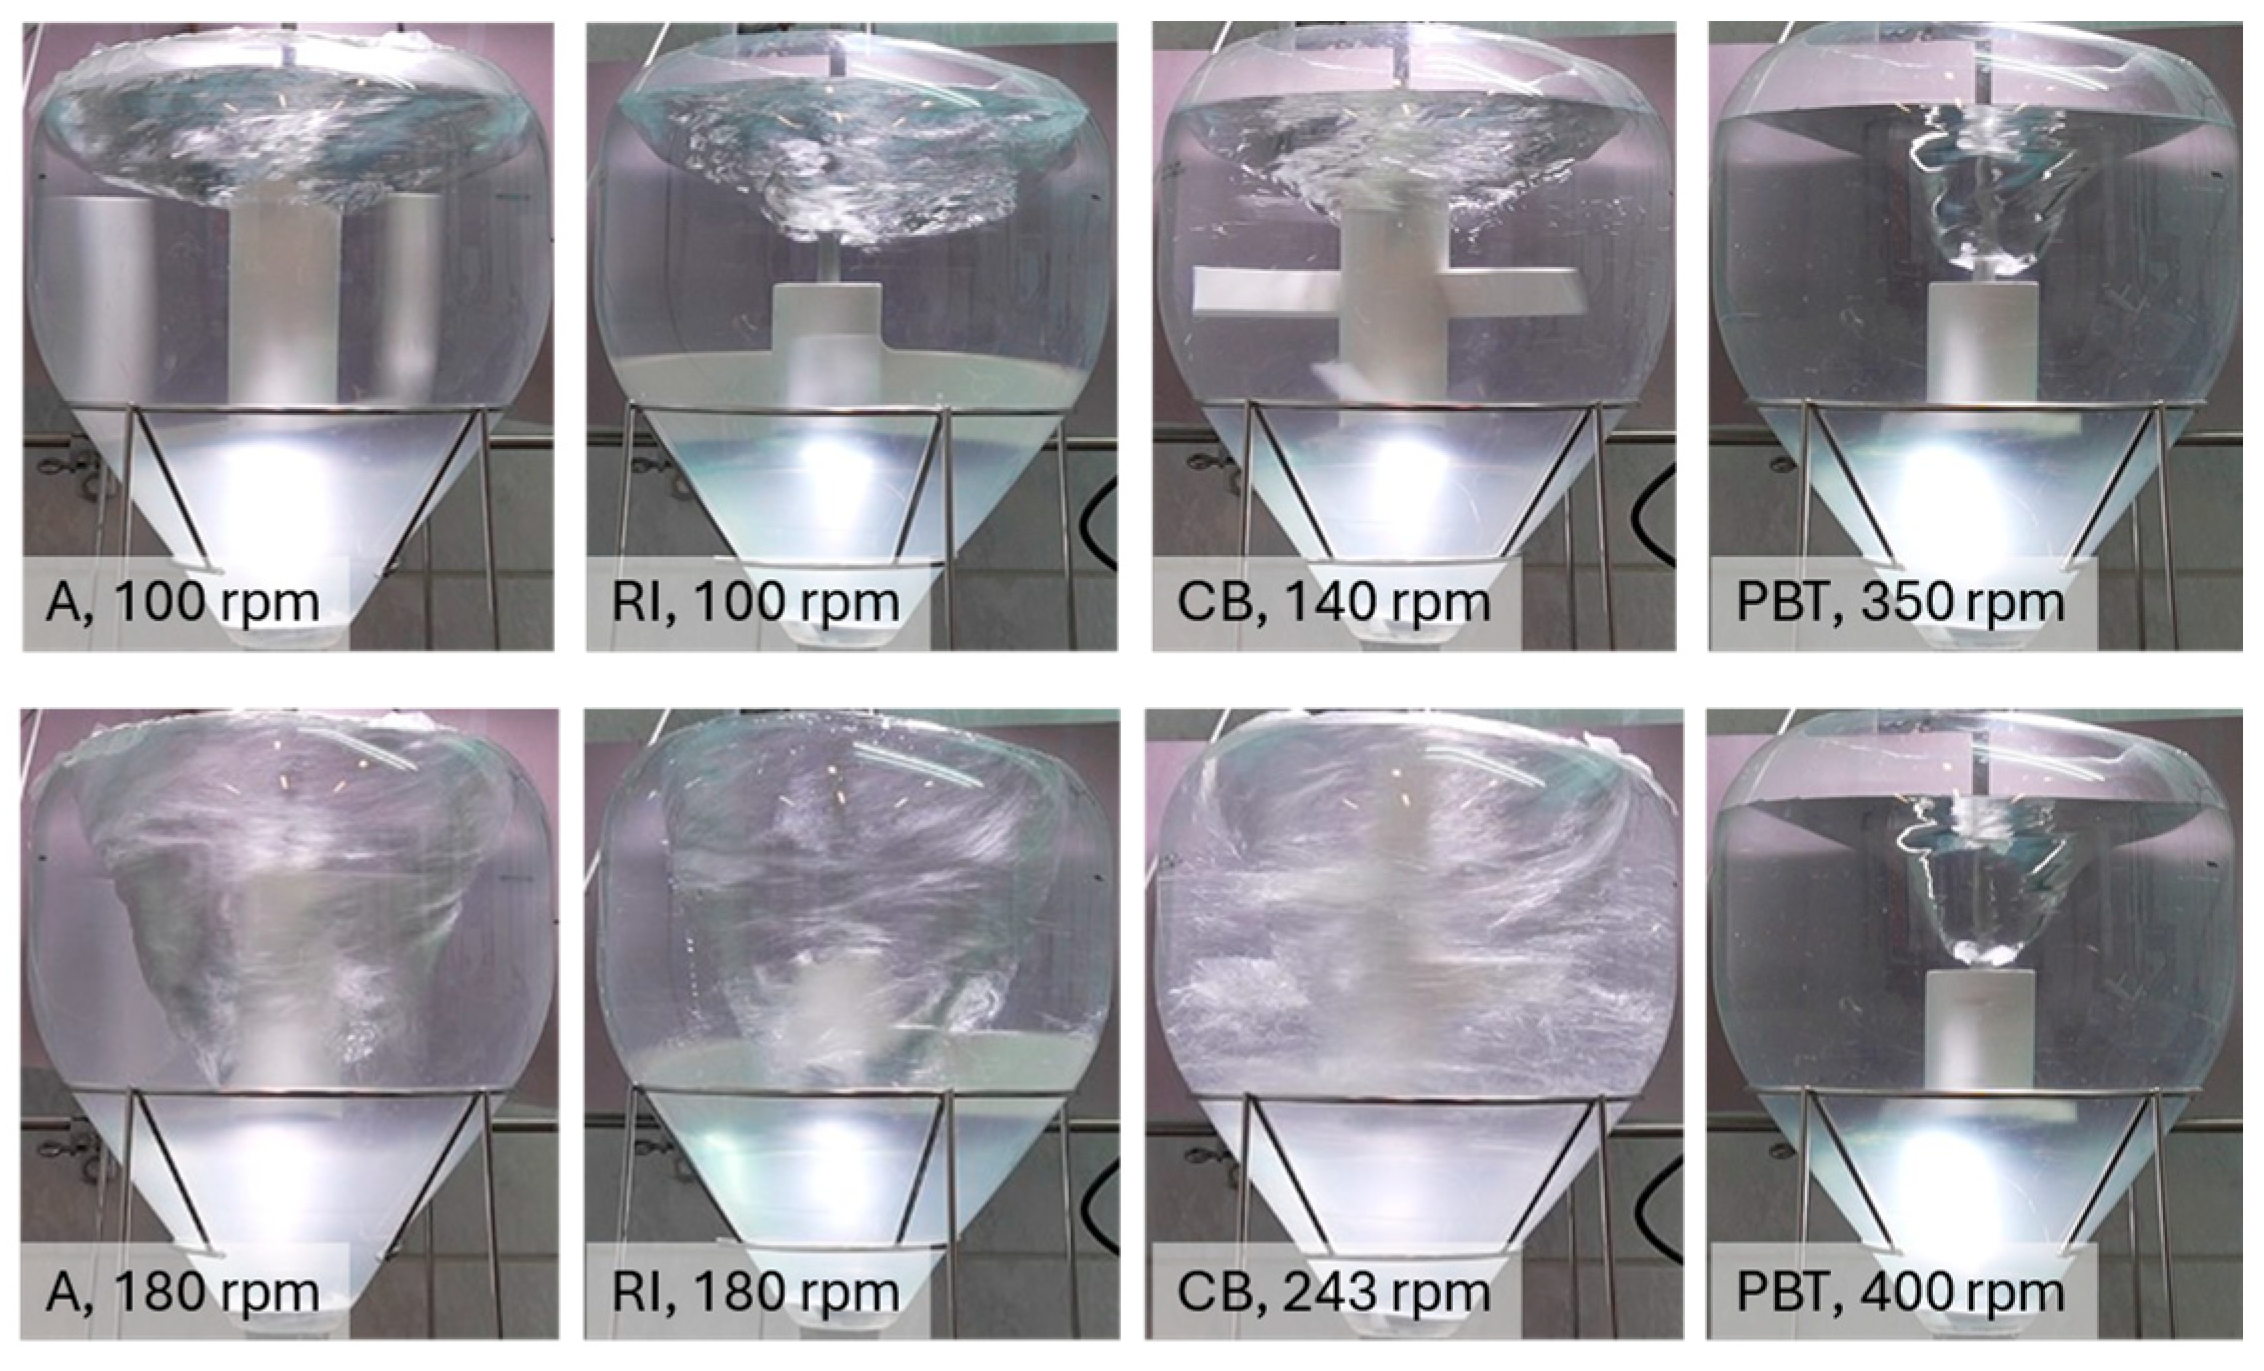
The cloud height reached the upper limit of the reaction vessel for all stirrer geometries at both substrate concentrations. The anchor and radial impeller achieved this at a lower below 2 m·s−1 tip speed, while the CB and PBT required 2.5 and 3.3 m·s−1 respectively. The CB also required approximately 0.2 W to 0.5 W higher power than A and RI at similar cloud heights, although this effect is less pronounced at higher substrate concentrations. The settling effect observed during the small-scale experiments for the Rushton turbine now also occurs for the PBT. Power consumption is low during this initial phase. Above 2 m s−1 tip speed, the downward pumping effect of the turbine is strong enough to move the material bulk. As a result, material is drawn down and repelled by the vessel wall and bottom, leading to both vertical and horizontal particle motion. Maximum cloud height is achieved at a power consumption of approximately 3 W (1–1.5 W higher than for the other geometries). Compared to the other geometries, a large vertical motion component of the particles was observed.
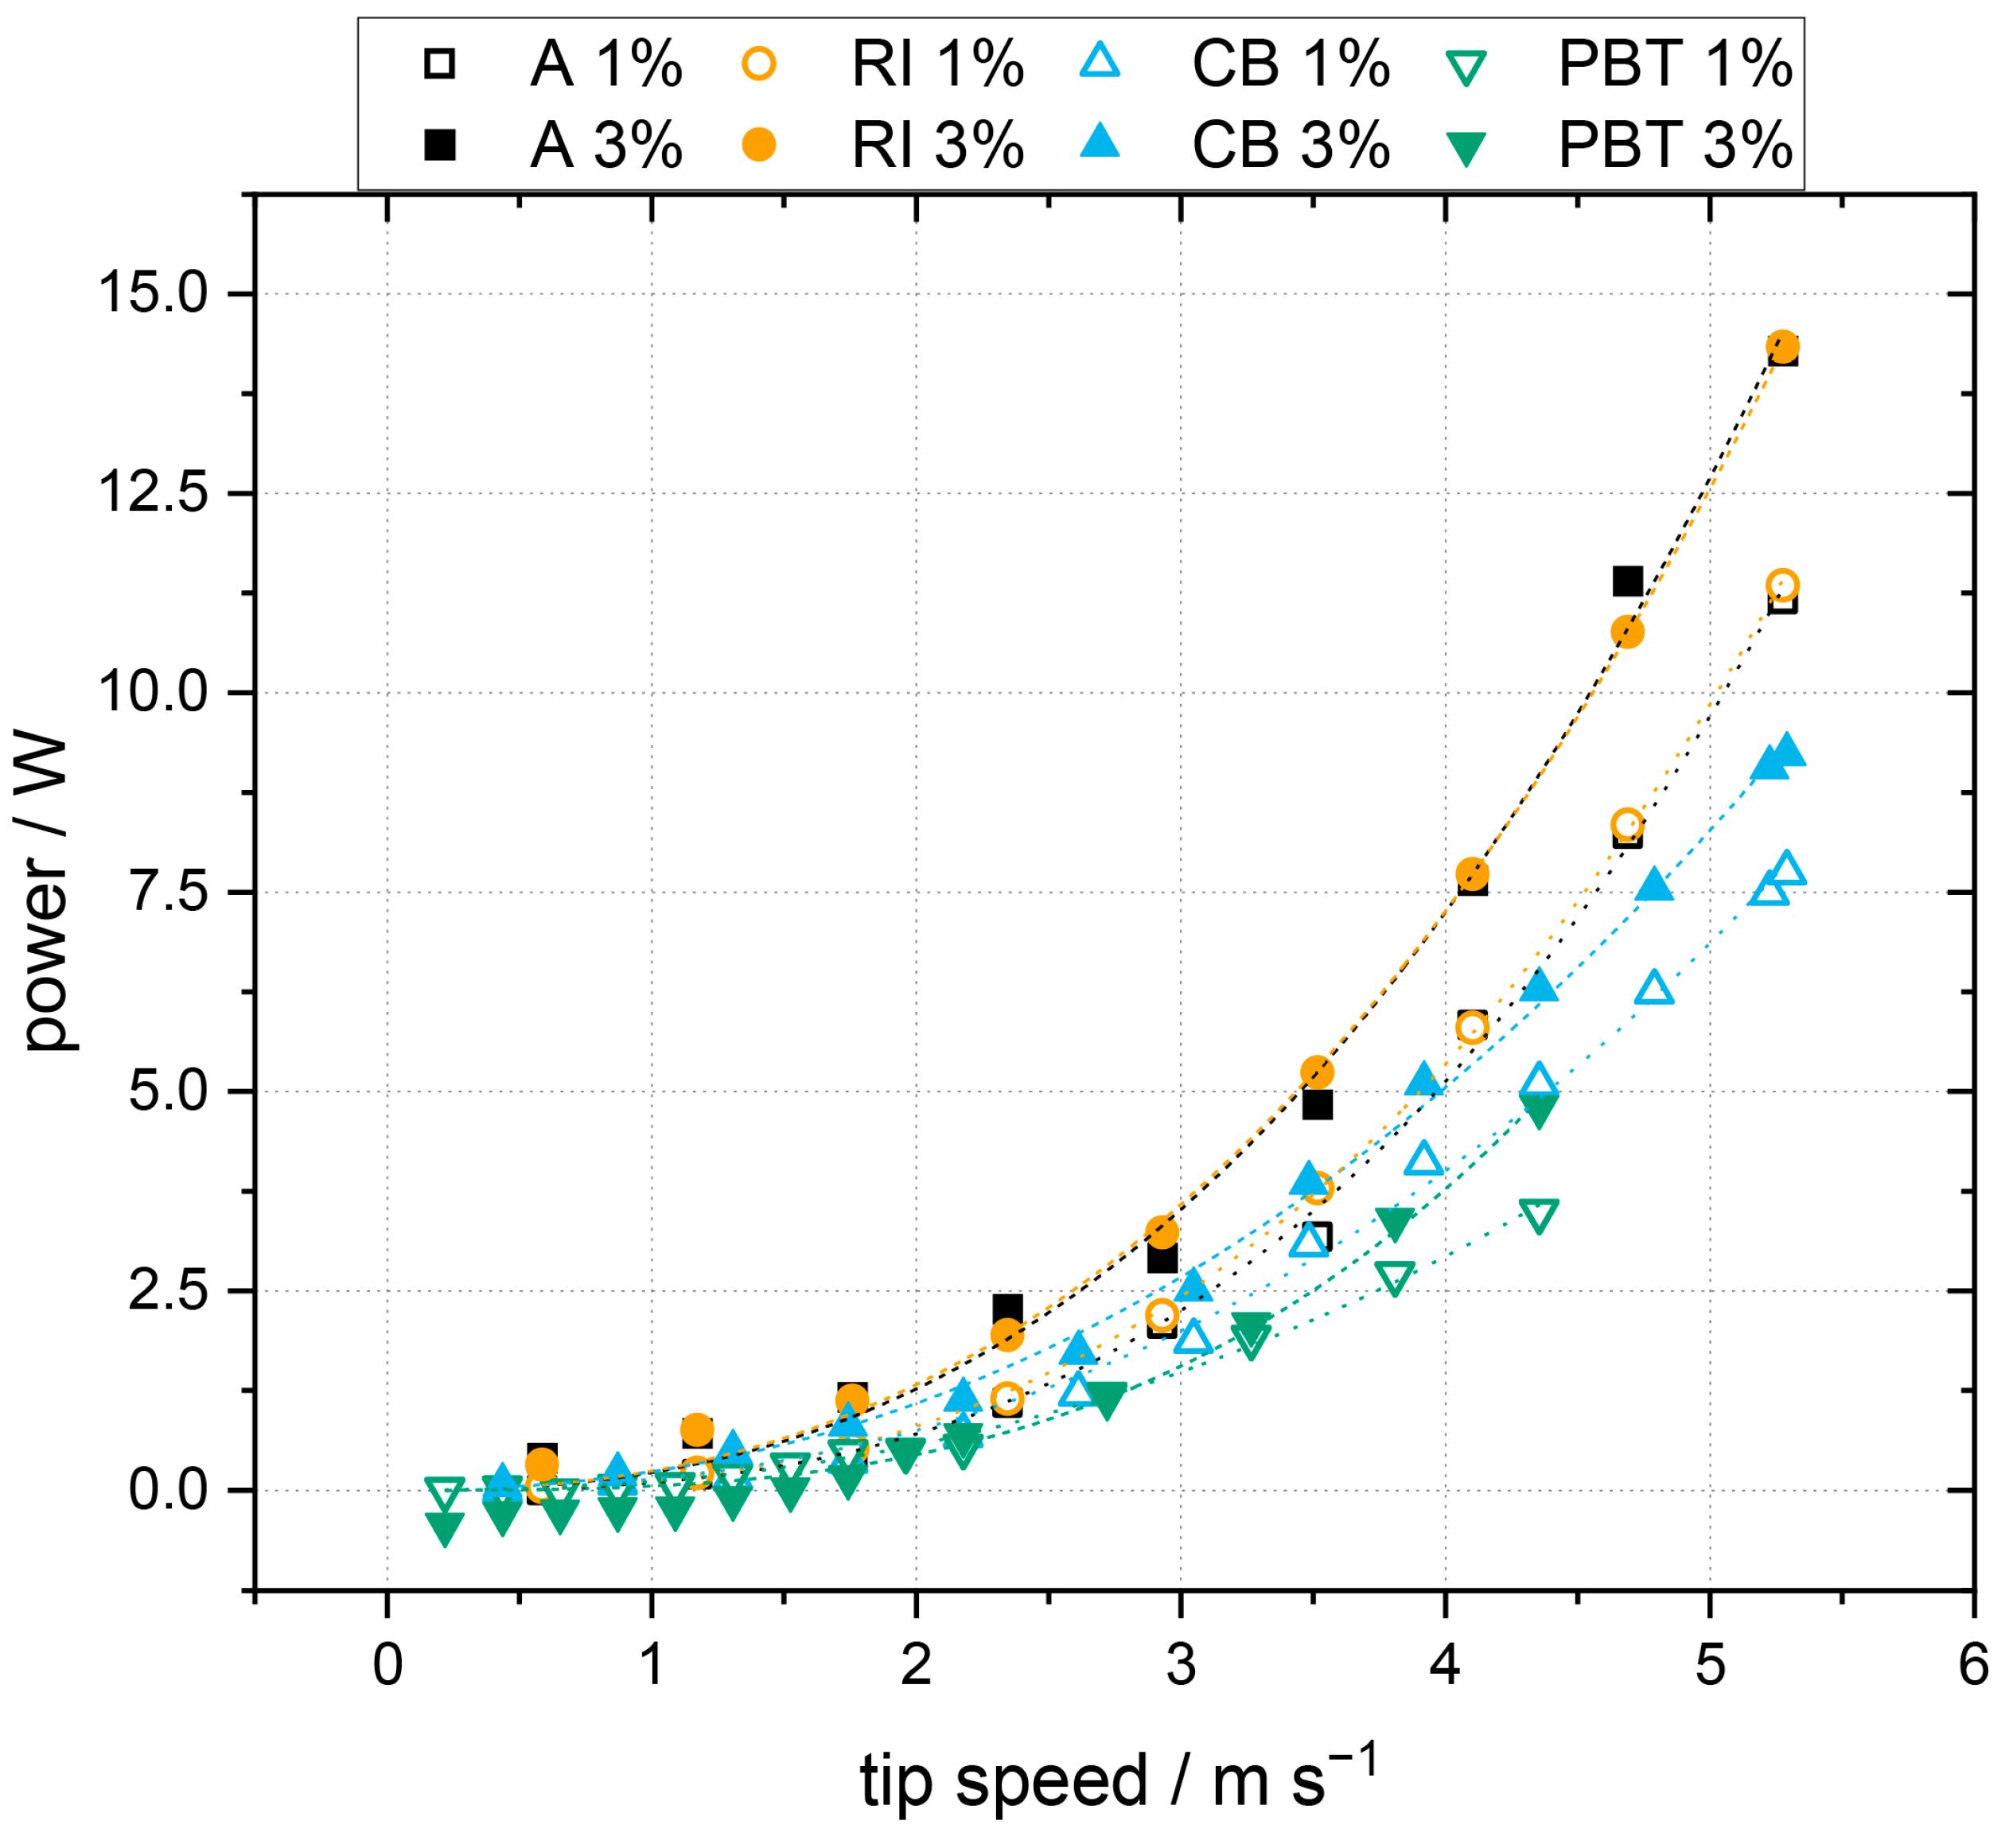
The correlation between power consumption of the motor and tip speed of the stirrer is shown in Figure 13 for all geometries.
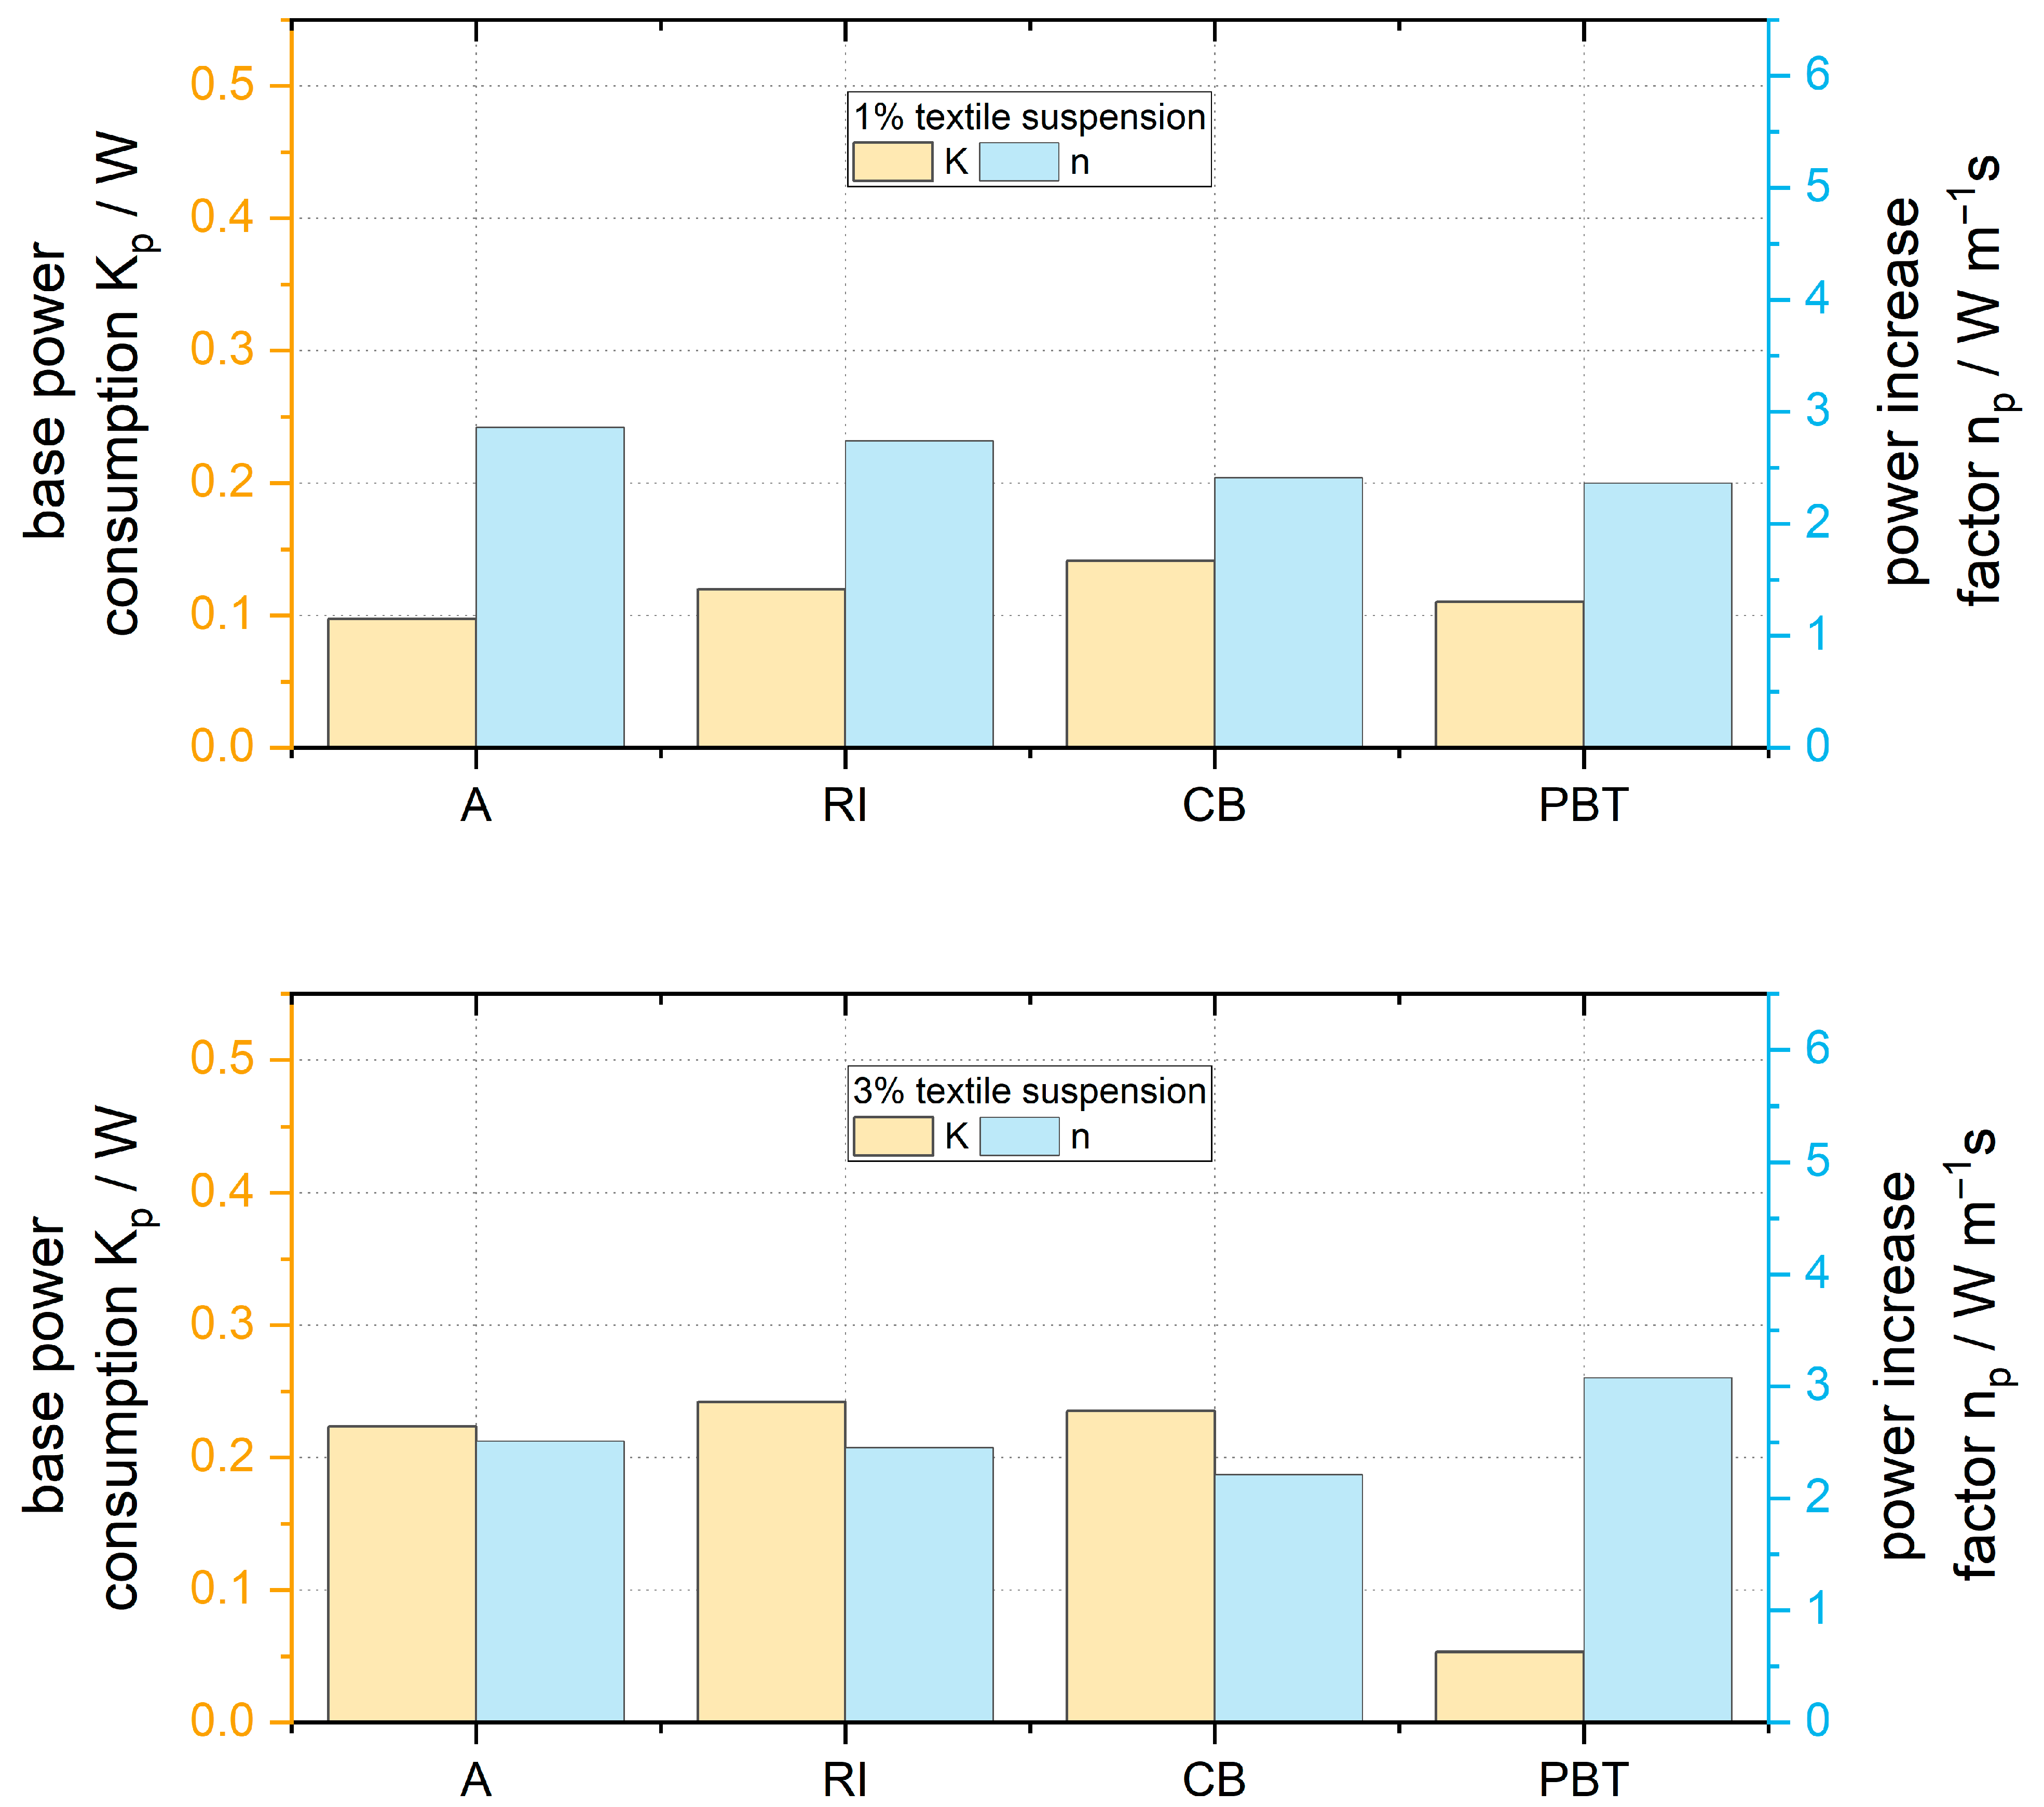
While the RI and anchor show high suspension activity, the PBT shows much lower energy consumption at each comparable tip speed, for both dilute and more concentrated textile suspensions. Power law modeling (see Appendix D for results) shows that the base power requirement Kp is at 0.12 ± 0.02 W and power increase factor np at 2.59 ± 0.21 W m−1 s for all stirrers in 1% textile suspension. At 3% textile concentration, the PBT shows a much lower Kp (0.05 W) at comparatively high np (3.07 W m−1 s). The other geometries are within a Kp range of 0.23 ± 0.01 W and np range of 2.39 ± 0.13 W m−1 s. Extrapolating to the experimentally unavailable equal tip speed of 5.29 m s−1, the PBT still shows the lowest power requirement of the semi-batch scale stirrers. In addition to its generally lower energy requirements, the PBT has another advantage: lower turbulence is observed at equal tip speed. Images of all four stirrers are shown in Figure 14 at both the speed where maximum cloud height is reached and their maximum investigated speed.
While there is some vortex formation visible for the PBT, the effect is minor compared to the other geometries. Both the anchor and impeller showed strong vortex formation at the minimum speed required for maximum cloud height. Air incorporation was visible for the CB at the minimum speed required for maximum cloud height, and for all three non-PBT geometries at maximum speed. Both effects reduce mixing efficiency, and air incorporation can lead to enzyme deactivation. Therefore, these geometries are undesirable for the enzymatic hydrolysis of textile waste without further adaptation of the experimental setup. These may include the installation of baffles (although this may lead to particle entrapment and flow dead-zones) and adaptation of stirrer geometry to allow lower bottom clearance.

3.4. Mathematical Modeling of Dimensionless Scaling Parameters

To allow efficiency comparisons independent of experimental setup, dimensionless numbers are used. For stirrers, commonly a correlation between the Reynolds number Re and the Power number Np is plotted, characterizing both flow regime present and the power consumption of the stirrer therein. However, Re depends on the viscosity of the investigated liquid, which is not constant for non-Newtonian media. In this case, measured viscosity decreases with rotational speed, resulting in a so-called shear thinning liquid. Due to the exponential correlation between shear rate and measured viscosity found in the rheometer, the so-called power law, containing the consistency factor K, the shear rate γ ˙ and the flow factor n applies:
η = K   γ ˙ n 1
Otto and Metzner were among the first to describe this problem [34]. They defined a constant B which establishes a relationship between the apparent shear rate and impeller rotational speed N, which is strongly influenced by both fluid rheology and mixer geometry.
γ ˙ = B   N
More recent approaches commonly determine effective overall shear rates, by system-specific Metzner–Otto constant KS, which contain impeller type, vessel configuration and viscosity dependence over shear rate.
γ ˙ e f f = K s   N
Due to its strong dependence on stirrer (impeller type, blade width, clearance, …) and vessel (baffles, bottom type, etc.) geometry, as well as the power-law index n of the fluid, empirical or modeled Ks values found in the literature are often inapplicable for even slightly different system setups [35]. Calderbank and Moo-Young instead modeled the stirrer–tank system as a capillary flow and reduced geometric factors to a stirrer and tank size relation [35,36]. From this, they derived a simplified generalized Reynolds number for power law fluids, containing the flow factor n and consistency factor K:
R e p l = ρ   D S 2   N 2 n K
The rheological parameters K and n were taken from the preliminary assessment via MCR and can be found in Table 2.
The power number Np is defined by power consumption P, the density   ρ , rotational speed N, and stirrer size DS.
N p = P ρ   D S 5   N 3
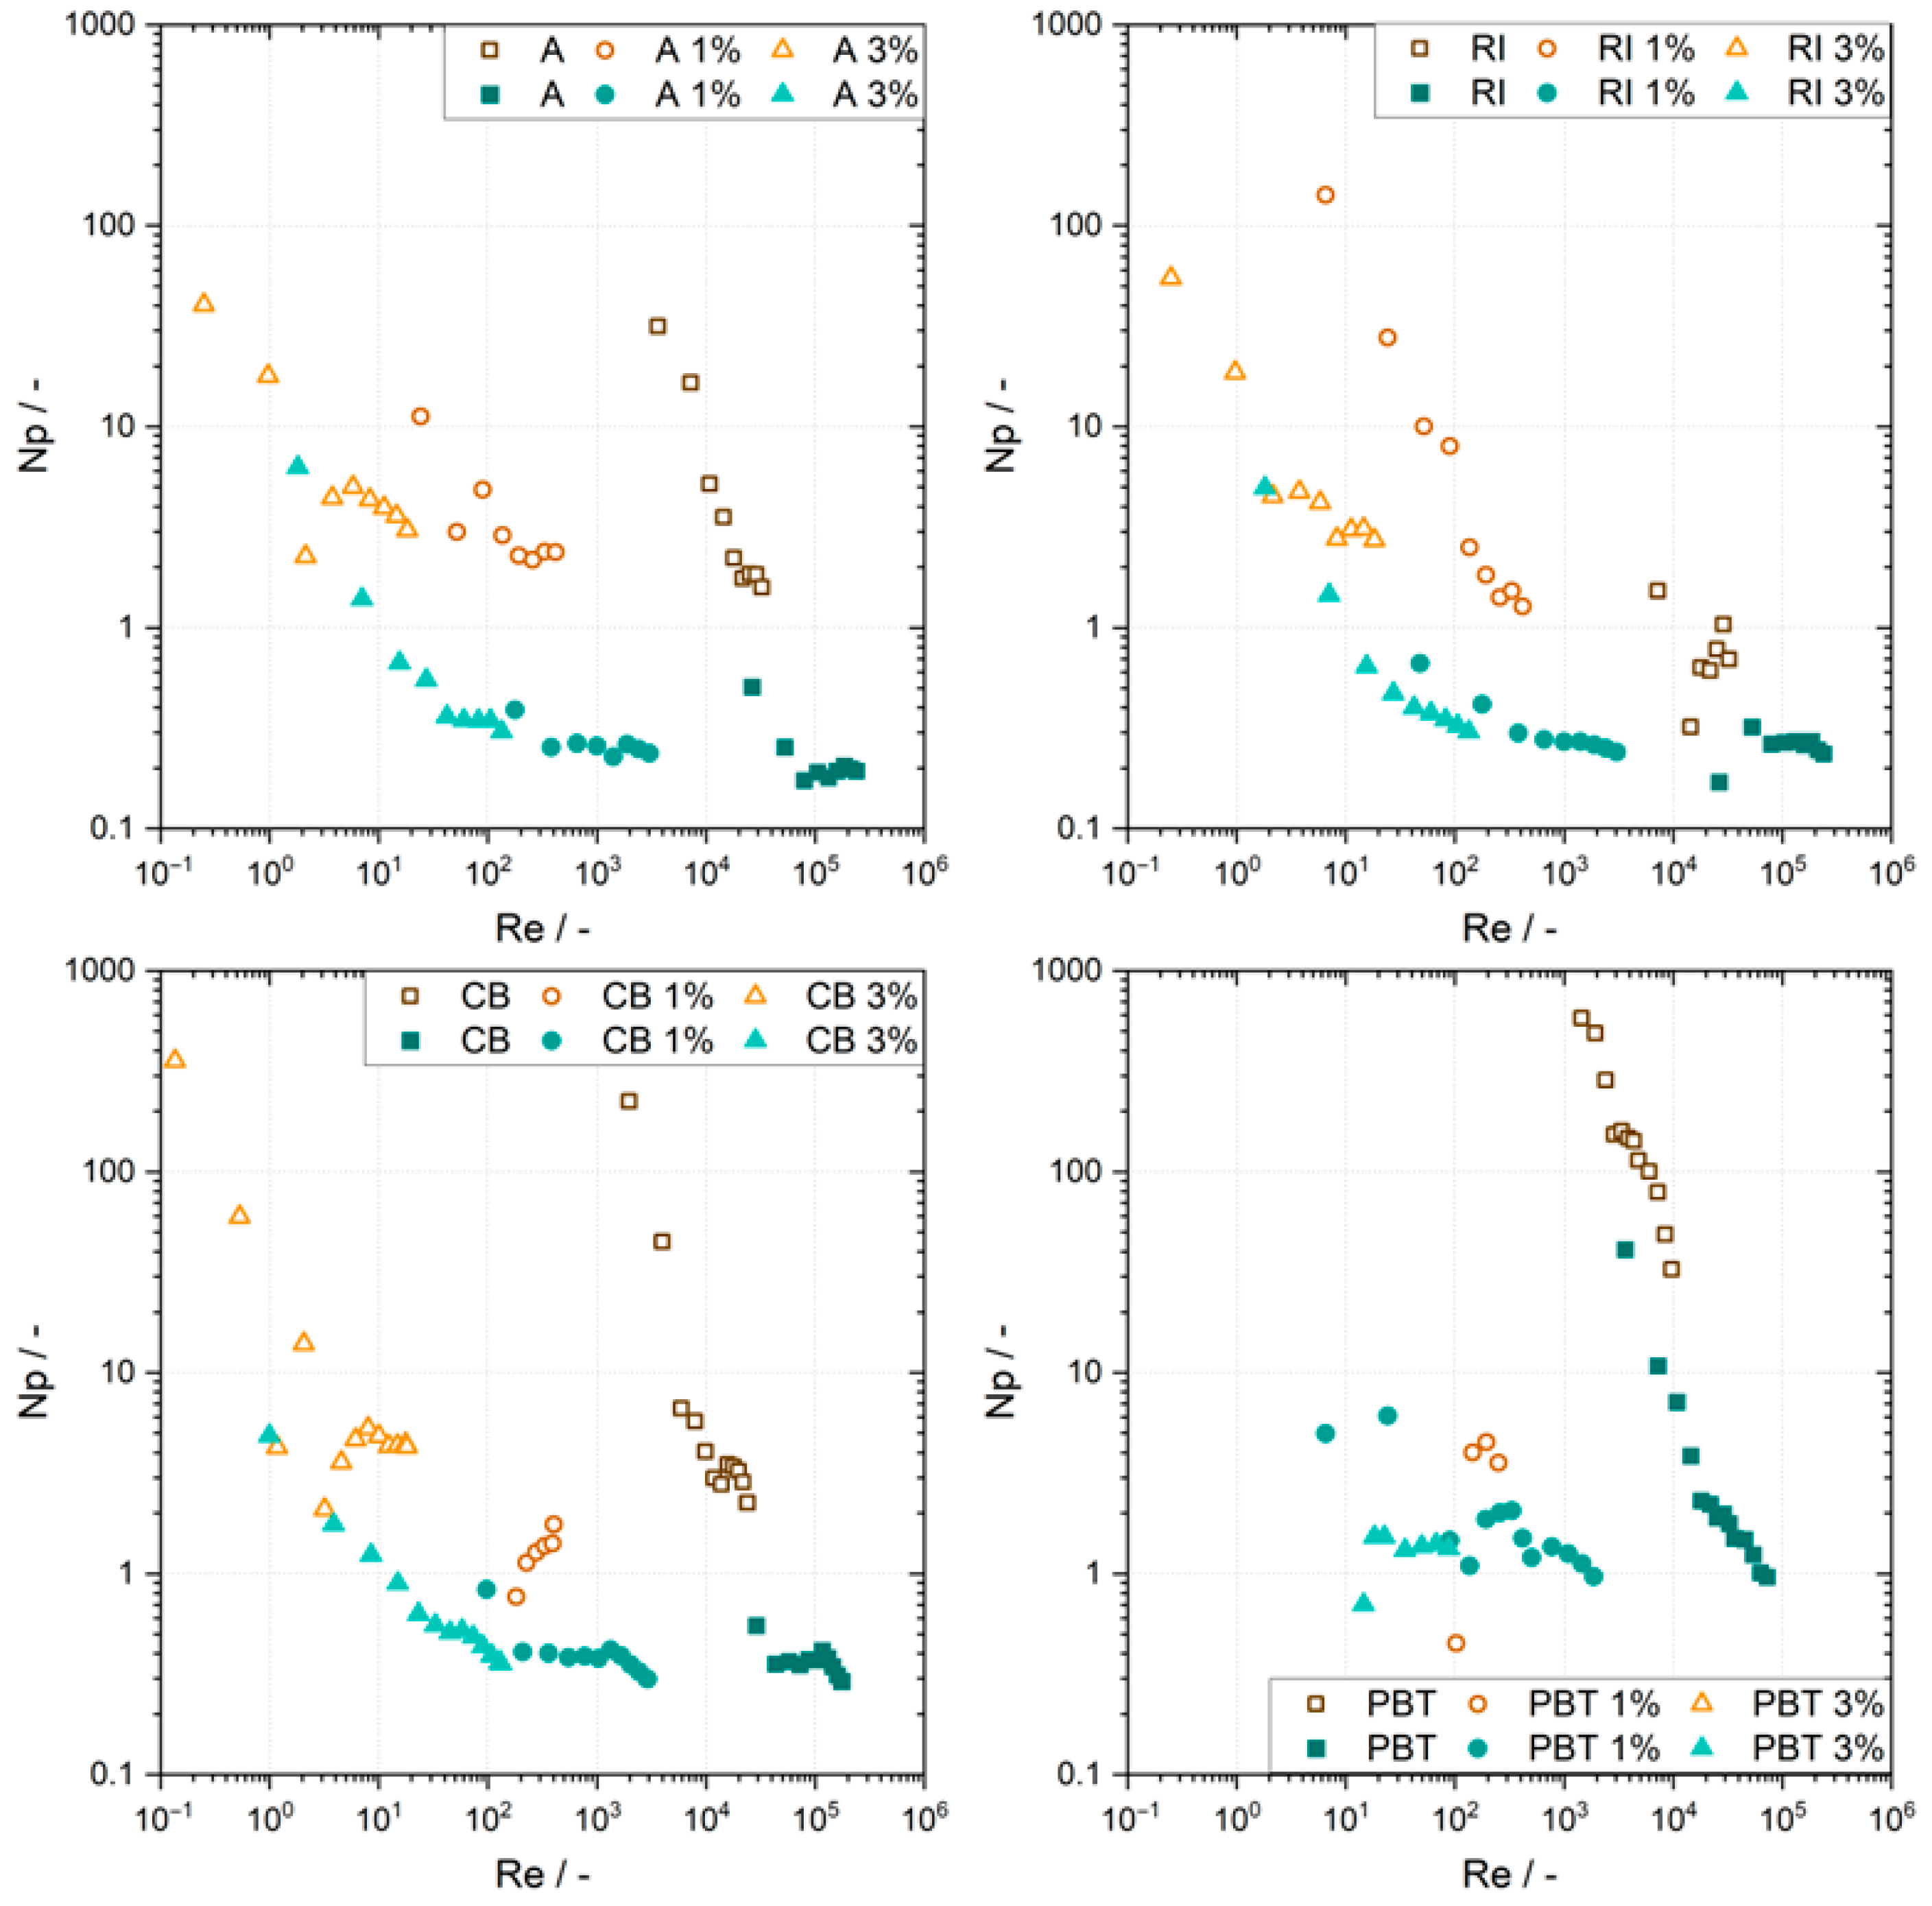
Dimensionless NpRepl plots are shown in Figure 15 for the semi-pilot scale experiments and corresponding bench-scale experiments.
Higher solid load decreases Re due to lower turbulence caused by the higher viscosity of the medium. At bench scale, it is further decreased by a factor of 5 to 10 due to an increased influence of wall effects. At semi-pilot scale, little influence of stirrer geometry on Np is observed for the anchor, radial, and crossbeam impellers—it is within 0.2 and 2 in water in and 1% suspension, increasing to a range of 0.3 to 5 at the highest substrate concentration. The PBT shows higher Np and Re in water than in suspension. Np is relatively constant in suspension, suggesting that the presence of the substrate results in purely laminar flow. At bench scale, assessment of Np is difficult due to comparatively small power differences observed between measurement and blank and stronger influence of the suspensions’ non-Newtonian behavior, effected by stronger boundary layer effects and lower mean shear rates. Calculation is possible while interpretation is complicated for three out of four geometries, while the power consumption of the PBT falls below measurable limits in suspension. Turbulent Np values were found in the literature between 2.7 and 1 for the RI [37,38], approximately 0.8 for the A and PBT [39,40], and 0.3 for the CB [41]. While the semi-pilot CB and PBT are within a 0.1 range of values in the literature, the RI and A are lower. The system in this work differed from those in the literature due to the conical bottom geometry and lack of baffling. The effect of the conical bottom is comparatively minor [37], but the lack of baffling may greatly decrease power numbers [42]. Bench-scale experiments showed higher Np than the semi-pilot scale. However, the difficulty of accurately determining power consumption in scale-down operations and the further complications caused by viscoelastic fluids are known from the literature, requiring significant engineering to counteract [43,44]. To assess stirrer efficiency in textile suspensions, empirical observations at larger scale seem preferable. Until optimized mathematical descriptions can be found, rapid prototyping offers a quick method for investigation complex substrate-vessel-stirrer interactions.

4. Conclusions

The combination of gentle reaction conditions and difficult-to-model substrate make experimental analysis and the use of rapid prototyping for determining ideal stirrer geometries in enzymatic textile hydrolysis highly attractive. The PBT shows lower power consumption at equal tip speed than the other geometries investigated at semi-pilot scale. Furthermore, it provided high suspension activity, vertical homogenization, low vortex formation and did not incorporate air at the speed of maximum cloud height formation. Therefore, it was shown to be the ideal stirrer geometry for the 30 L conical tank. However, at bench scale it failed to increase cloud height even at high speeds and did not show fast color dispersion in either textile suspension or CMC solution. It is unclear whether this is due to the change in vessel geometry (flat to conical bottom) or whether the benchtop model was simply too small compared to the substrate (DS ≤ 2.5 substrate diameter). Mathematical modeling of characteristic dimensionless numbers showed discrepancies between benchtop and semi-batch scales, but showed comparable values to those in the literature for axial flow impellers at semi-pilot scale. The difference in performance of the PBT between small and large scales highlights the necessity of experimental investigations during scale-up, for which 3D printing offers a comparatively quick and cheap method for producing standard geometries. These studied geometries lead as a basis for further scale-up towards the industrial scale.

Author Contributions

Conceptualization, D.O.-K. and C.S.; methodology—D.O.-K. and C.S.; software, D.O.-K.; formal analysis—D.O.-K.; investigation, D.O.-K.; resources, B.L. and C.B.; writing—original draft, D.O.-K. and C.S.; writing—review and editing, C.S., B.L., C.B. and M.W.H.; supervision, C.B. and M.W.H.; project administration, C.B. and B.L.; funding acquisition C.B. All authors have read and agreed to the published version of the manuscript.

Funding

This research was funded by EU Horizon project Plastice (grant No. 101058540) and FFG (Austrian Research Promotion Agency) project TexPET (FO999905127).

Institutional Review Board Statement

Not applicable.

Informed Consent Statement

Not applicable.

Data Availability Statement

All data discussed is visible within the presented graphs and appendices. Further information will be made available upon request.

Acknowledgments

During the preparation of this manuscript, Doris Ostner-Kaineder used MS Copilot 365 (GPT5 Version) for the purpose of assisting in the creation and troubleshooting of python code. The authors have reviewed and edited the output and take full responsibility for the content of this publication.

Conflicts of Interest

Author Barbara Liedl was employed by the Transfercenter für Kunststofftechnik GmbH. The remaining authors declare that the research was conducted in the absence of any commercial or financial relationships that could be constructed as a potential conflict of interest.

Abbreviations

The following abbreviations are used in this manuscript:
MCRModular compact rheometer
CMCSodium carboxy methyl cellulose
AAnchor
CCup
FFrame
RIRadial impeller
CBCrossbeam
RTRushton turbine
HRHelical Ribbon
PBTPitched-blade turbine
nppower increase factor (from power consumption modelling)
KpBase power consumption factor (from power consumption modelling)
nflow factor (rheology)
Kconsistency index (rheology)

Appendix A

Figure A1. Anchor (left) and cup (right) stirrers, at minimum (20 rpm), medium (60 rpm), high and maximum speed (180 and 230 rpm).
Appliedchem 06 00031 g0a1
Figure A2. Frame (left) and radial impeller (right) stirrers, at minimum (20 rpm), medium (60 rpm) and maximum speed (180 rpm).
Appliedchem 06 00031 g0a2
Figure A3. Crossbeam (left) and Rushton turbine (right) stirrers, at minimum (20 rpm), medium (60 rpm), high (180 rpm) and maximum (240 and 400 rpm respectively) speed.
Appliedchem 06 00031 g0a3
Figure A4. Helical ribbon (left) and pitched-blade turbine (right) stirrers, at minimum (20rpm), medium (60 rpm), high (180 rpm) and maximum (280 and 400 rpm respectively) speed.
Appliedchem 06 00031 g0a4

Appendix B

Figure A5. Color evolution in 1% CMC solution over time (0 s–600 s; end of recording is marked within frame) for axial stirrers.
Appliedchem 06 00031 g0a5
Figure A6. Color evolution in 1% CMC solution over time (0 s–600 s; end of recording is marked within frame) for radial/tangential stirrers.
Appliedchem 06 00031 g0a6

Appendix C

Figure A7. Anchor (top left), radial impeller (top right), crossbeam (bottom left) and pitched-blade turbine (bottom right) stirrers on semi-pilot scale; from top to bottom at 20, 60, 180 and maximum (240 for CB, 400 for PBT) rpm.
Appliedchem 06 00031 g0a7

Appendix D

Figure A8. Base power consumption factor Kp and power increase factor np for bench-scale stirrers in textile suspension (1% top, 3% middle) and CMC suspension (bottom) from power law P = K p   · s n p modeling; fits below R2 = 0.9 are marked with hatched shading.
Appliedchem 06 00031 g0a8
Figure A9. Base power consumption factor Kp and power increase factor np for bench-scale stirrers in textile suspension (1% top, 3% bottom) from power law P = K p   · s n p modeling.
Appliedchem 06 00031 g0a9

References

  1. Ellen MacArthur Foundation. A New Textiles Economy: Redesigning Fashion’s Future. Available online: https://www.ellenmacarthurfoundation.org/assets/downloads/publications/A-New-Textiles-Economy_Full-Report.pdf (accessed on 21 January 2026).
  2. Gothandam, K.M.; Ranjan, S.; Dasgupta, N.; Lichtfouse, E. (Eds.) Nanoscience and Biotechnology for Environmental Applications; Springer International Publishing: Cham, Switzerland, 2019; ISBN 978-3-319-97921-2. [Google Scholar]
  3. Seifali Abbas-Abadi, M.; Tomme, B.; Goshayeshi, B.; Mynko, O.; Wang, Y.; Roy, S.; Kumar, R.; Baruah, B.; De Clerck, K.; De Meester, S.; et al. Advancing Textile Waste Recycling: Challenges and Opportunities Across Polymer and Non-Polymer Fiber Types. Polymers 2025, 17, 628. [Google Scholar] [CrossRef] [Scilit]
  4. Dissanayake, D.G.K.; Weerasinghe, D.U. Fabric Waste Recycling: A Systematic Review of Methods, Applications, and Challenges. Mater. Circ. Econ. 2021, 3, 24. [Google Scholar] [CrossRef] [Scilit]
  5. Textile Exchange. Materials Market Report 2024. Available online: https://textileexchange.org/app/uploads/2024/09/Materials-Market-Report-2024.pdf (accessed on 28 January 2026).
  6. Choudhury, K.; Tsianou, M.; Alexandridis, P. Recycling of Blended Fabrics for a Circular Economy of Textiles: Separation of Cotton, Polyester, and Elastane Fibers. Sustainability 2024, 16, 6206. [Google Scholar] [CrossRef] [Scilit]
  7. Ghosh, J.; Repon, M.R.; Rupanty, N.S.; Asif, T.R.; Tamjid, M.I.; Reukov, V. Chemical Valorization of Textile Waste: Advancing Sustainable Recycling for a Circular Economy. ACS Omega 2025, 10, 11697–11722. [Google Scholar] [CrossRef] [Scilit] [PubMed]
  8. Leenders, N.; Moerbeek, R.M.; Puijk, M.J.; Bronkhorst, R.J.A.; Bueno Morón, J.; van Klink, G.P.M.; Gruter, G.-J.M. Polycotton waste textile recycling by sequential hydrolysis and glycolysis. Nat. Commun. 2025, 16, 738. [Google Scholar] [CrossRef] [Scilit] [PubMed]
  9. Loo, S.-L.; Yu, E.; Hu, X. Tackling critical challenges in textile circularity: A review on strategies for recycling cellulose and polyester from blended fabrics. J. Environ. Chem. Eng. 2023, 11, 110482. [Google Scholar] [CrossRef] [Scilit]
  10. Ma, J.; Yang, K.; Wang, M.; Shan, J.; Yang, D.; Tian, G. Advancements in component separation through chemical methods for recycled polyester/cotton blended textiles. Cellulose 2024, 31, 9543–9563. [Google Scholar] [CrossRef] [Scilit]
  11. Leenders, N.; van Klink, G.P.M.; Gruter, G.-J.M. Towards polycotton waste valorisation: Depolymerisation of cotton to glucose with polyester preservation. RSC Sustain. 2025, 3, 3863–3882. [Google Scholar] [CrossRef] [Scilit]
  12. Rosini, E.; La Rocca, J.; Loro, C.; Broggini, G.; Pollegioni, L. Depolymerization of Polycotton-Blended Fabrics: Challenges and Opportunities. ChemSusChem 2026, 19, e202502002. [Google Scholar] [CrossRef] [Scilit]
  13. Gaikwad, A. Interactions of mixing and reaction kinetics of depolymerization of cellulose to renewable fuels. Chem. Eng. Commun. 2018, 205, 47–81. [Google Scholar] [CrossRef] [Scilit]
  14. Ganesh, K.; Joshi, J.B.; Sawant, S.B. Cellulase deactivation in a stirred reactor. Biochem. Eng. J. 2000, 4, 137–141. [Google Scholar] [CrossRef] [Scilit]
  15. Gunjikar, T.P.; Sawant, S.B.; Joshi, J.B. Shear deactivation of cellulase, exoglucanase, endoglucanase, and beta-glucosidase in a mechanically agitated reactor. Biotechnol. Prog. 2001, 17, 1166–1168. [Google Scholar] [CrossRef] [Scilit]
  16. Islam, M.M.; Yin, R.; West, A. A Brief Review of Mechanical Recycling of Textile Waste. Textiles 2025, 5, 41. [Google Scholar] [CrossRef] [Scilit]
  17. Hadded, A.; Benltoufa, S.; Fayala, F.; Jemni, A. Thermo physical characterisation of recycled textile materials used for building insulating. J. Build. Eng. 2016, 5, 34–40. [Google Scholar] [CrossRef] [Scilit]
  18. Ostner-Kaineder, D.; Liedl, B.; Hlawitschka, M.W.; Burgstaller, C. The influence of particle size and polyester content on rheological properties and enzymatic hydrolysis of knife-milled polycotton textile waste. Results Eng. 2025, 28, 108209. [Google Scholar] [CrossRef] [Scilit]
  19. Tornberg, A.-K. Numerical Simulations of the Dynamics of Fiber Suspensions. In Multiscale Methods in Science and Engineering; Engquist, B., Runborg, O., Lötstedt, P., Eds.; Springer: Berlin/Heidelberg, Germany, 2005; pp. 275–289. ISBN 3-540-25335-1. [Google Scholar]
  20. Liang, Y.; Wang, J.; Pan, D. Rheological properties and micro-mesoscopic mechanisms of complex particle suspensions: A review. Chin. Sci. Bull. 2023, 69, 1192–1210. [Google Scholar] [CrossRef] [Scilit]
  21. Bettermann, S.; Stuhr, R.; Moritz, H.-U.; Pauer, W. Customizable 3D-printed stirrers for investigation, optimization and scale-up processes of batch emulsion copolymerizations. Chem. Eng. Sci. 2019, 206, 50–62. [Google Scholar] [CrossRef] [Scilit]
  22. Alimi, O.A.; Meijboom, R. Current and future trends of additive manufacturing for chemistry applications: A review. J. Mater. Sci. 2021, 56, 16824–16850. [Google Scholar] [CrossRef] [Scilit] [PubMed]
  23. Vera, R.E.; Zambrano, F.; Suarez, A.; Pifano, A.; Marquez, R.; Farrell, M.; Ankeny, M.; Jameel, H.; Gonzalez, R. Transforming textile wastes into biobased building blocks via enzymatic hydrolysis: A review of key challenges and opportunities. Clean. Circ. Bioecon. 2022, 3, 100026. [Google Scholar] [CrossRef] [Scilit]
  24. Huang, X.; Tan, Y.; Huang, J.; Zhu, G.; Yin, R.; Tao, X.; Tian, X. Industrialization of open- and closed-loop waste textile recycling towards sustainability: A review. J. Clean. Prod. 2024, 436, 140676. [Google Scholar] [CrossRef] [Scilit]
  25. Zlokarnik, M. Rührtechnik; Springer: Berlin/Heidelberg, Germany, 1999; ISBN 978-3-642-63675-2. [Google Scholar]
  26. Kraume, M. Transportvorgänge in der Verfahrenstechnik: Aufgaben und Lösungen, 1st ed.; Springer: Berlin/Heidelberg, Germany, 2020; ISBN 9783662603932. [Google Scholar]
  27. Cabaret, F.; Bonnot, S.; Fradette, L.; Tanguy, P.A. Mixing Time Analysis Using Colorimetric Methods and Image Processing. Ind. Eng. Chem. Res. 2007, 46, 5032–5042. [Google Scholar] [CrossRef] [Scilit]
  28. Fitschen, J.; Hofmann, S.; Wutz, J.; Kameke, A.; Hoffmann, M.; Wucherpfennig, T.; Schlüter, M. Novel evaluation method to determine the local mixing time distribution in stirred tank reactors. Chem. Eng. Sci. X 2021, 10, 100098. [Google Scholar] [CrossRef] [Scilit]
  29. BOLA Laborbedarf aus PTFE. Rührelemente-Auswahl. Available online: https://www.bola.de/technische-informationen/ruehren-und-mischen/ruehrelemente-auswahl/ (accessed on 28 January 2026).
  30. Zhang, P.; Li, W.; Liu, Y.; Chi, R.; Long, B.; Zhang, J. Investigation on drawdown process of light-floating particles in a pilot scale cup-shaped blade agitator. Chem. Eng. Process.-Process Intensif. 2024, 201, 109811. [Google Scholar] [CrossRef] [Scilit]
  31. Yang, L.; Zhu, Z.; Qi, X.; Yan, X.; Zhang, H. The Process of the Intensification of Coal Fly Ash Flotation Using a Stirred Tank. Minerals 2018, 8, 597. [Google Scholar] [CrossRef] [Scilit]
  32. Singh, B.; Kovács, K.L.; Bagi, Z.; Nyári, J.; Szepesi, G.L.; Petrik, M.; Siménfalvi, Z.; Szamosi, Z. Enhancing Efficiency of Anaerobic Digestion by Optimization of Mixing Regimes Using Helical Ribbon Impeller. Fermentation 2021, 7, 251. [Google Scholar] [CrossRef] [Scilit]
  33. Petříček, R.; Labík, L.; Moucha, T.; Brucato, A.; Scargiali, F. Gas-liquid mass transfer rates in unbaffled tanks stirred by PBT: Scale-up effects and pumping direction. Chem. Eng. Res. Des. 2018, 137, 265–272. [Google Scholar] [CrossRef] [Scilit]
  34. Metzner, A.B.; Otto, R.E. Agitation of non-Newtonian fluids. AIChE J. 1957, 3, 3–10. [Google Scholar] [CrossRef] [Scilit]
  35. Doraiswamy, D.; Grenville, R.K.; Etchells, A.W. Two-Score Years of the Metzner-Otto Correlation. Ind. Eng. Chem. Res. 1994, 33, 2253–2258. [Google Scholar] [CrossRef] [Scilit]
  36. Calderbank, P.H. The Prediction of Power Consumption in the Agitation of Non-Newtonian Fluids by Helical Screw Agitators. Trans. Inst. Chem. Eng. 1959, 50, 147–155. [Google Scholar]
  37. Rielly, C.D.; Habib, M.; Sherlock, J.-P. Flow and Mixing Characteristics of a Retreat Curve Impeller in a Conical-Based Vessel. Chem. Eng. Res. Des. 2007, 85, 953–962. [Google Scholar] [CrossRef] [Scilit]
  38. Branan, C. Branan’s Rules of Thumb for Chemical Engineers; Elsevier: Amsterdam, The Netherlands, 2012; ISBN 9780123877857. [Google Scholar]
  39. Furukawa, H.; Kato, Y.; Kato, T.; Tada, Y. Power Correlations and Mixing Patterns of Several Large Paddle Impellers with Dished Bottoms. J. Chem. Eng. Jpn./JCEJ 2013, 46, 255–261. [Google Scholar] [CrossRef] [Scilit]
  40. Li, L.; Xu, B. Numerical analysis of hydrodynamics characteristics in a top-covered unbaffled stirred tank. Chem. Pap. 2021, 75, 5873–5884. [Google Scholar] [CrossRef] [Scilit]
  41. Xie, M.; Zhou, G.; Xia, J.; Zou, C.; Yu, P.; Zhang, S. Comparison of Power Number for Paddle-Type Impellers by Three Methods. J. Chem. Eng. Jpn./JCEJ 2011, 44, 840–844. [Google Scholar] [CrossRef] [Scilit]
  42. Ma, Z. Impeller Power Draw Across the Full Reynolds Number Spectrum. Master’s Thesis, University of Dayton, Dayton, OH, USA, 2014. [Google Scholar]
  43. Kaiser, S.C.; Werner, S.; Jossen, V.; Kraume, M.; Eibl, D. Development of a method for reliable power input measurements in conventional and single-use stirred bioreactors at laboratory scale. Eng. Life Sci. 2017, 17, 500–511. [Google Scholar] [CrossRef] [Scilit] [PubMed]
  44. Lassaigne, M.; Blais, B.; Fradette, L.; Bertrand, F. Experimental investigation of the mixing of viscous liquids and non-dilute concentrations of particles in a stirred tank. Chem. Eng. Res. Des. 2016, 108, 55–68. [Google Scholar] [CrossRef] [Scilit]
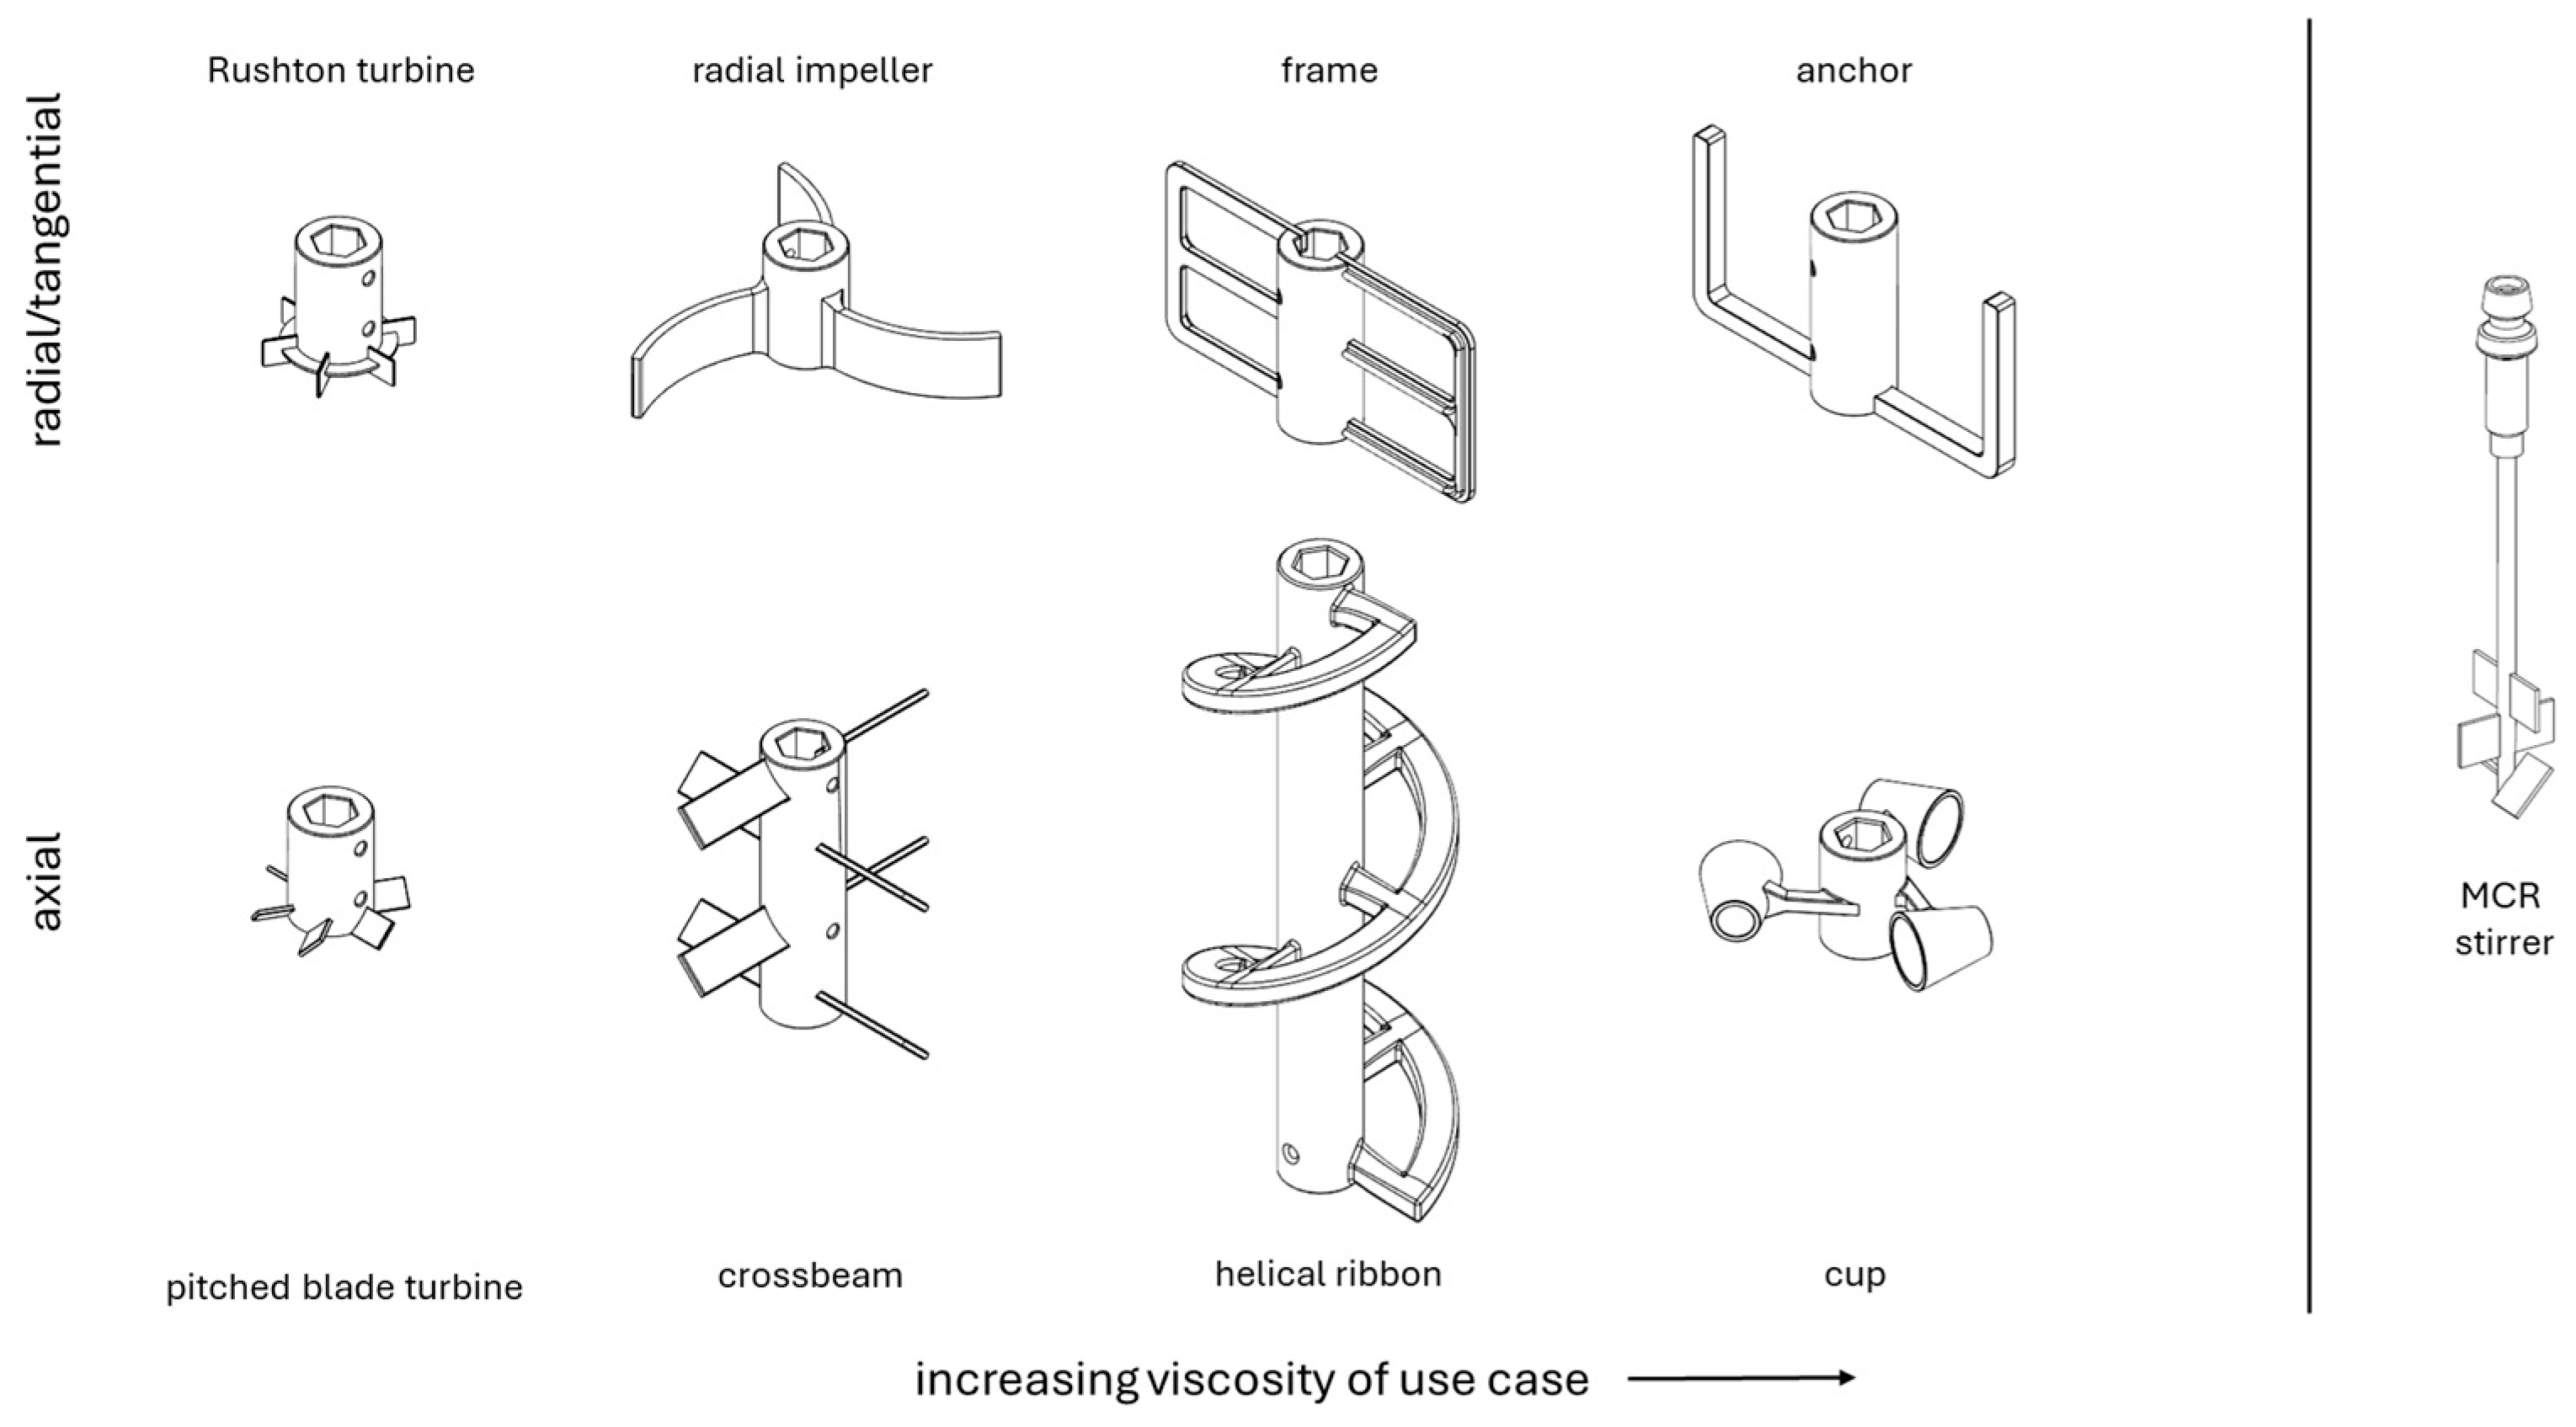
Figure 1. Representative semi-scale image of each stirrer, sorted by flow pattern (top…radial/tangential, bottom…axial) and application viscosity increasing from left to right; adapted from [25]; the geometry of the MCR stirrer used in preliminary measurements is shown separately.
Appliedchem 06 00031 g001
Figure 2. Experimental setup and tank dimensions of bench (left) and semi-pilot scale (right) experiments. Dimension abbreviations are the same as in Table 1; M refers to the stirrer motor.
Appliedchem 06 00031 g002
Figure 3. Schematic drawing (left) and averaged sample images (right) of cloud height determination. M refers to the stirrer motor.
Appliedchem 06 00031 g003
Figure 4. Rheological curves (apparent viscosity) of 1 and 3% textile suspensions (green) and CMC solution (pink) obtained via MCR stirrer attachment; absolute reference value obtained from Brookfield spindle viscometer (purple).
Appliedchem 06 00031 g004
Figure 5. Cloud height over tip speed for axial (left) and radial/tangential (right) flow pattern stirrers at 1% and 3% textile suspension (top and bottom, respectively).
Appliedchem 06 00031 g005
Figure 6. Cloud height over power consumption for axial (left) and radial/tangential (right) flow pattern stirrers at 1% and 3% textile suspension (top and bottom, respectively).
Appliedchem 06 00031 g006
Figure 7. Power consumption comparison over tip speed of radial/tangential (left) and axial (right) flow geometry stirrers in water (empty symbols), 1% aqueous suspension (crossed symbols, dotted lines) and 1% CMC solution (full symbols, dash-dot lines).
Appliedchem 06 00031 g007
Figure 8. Power consumption comparison over tip speed of radial/tangential (left) and axial (right) flow geometry stirrers in water (empty symbols), 3% aqueous suspension (crossed symbols, dotted lines) and 1% CMC solution (full symbols, dash-dot lines).
Appliedchem 06 00031 g008
Figure 9. Normalized semi-logarithmic color–time plots of small scale 3% aqueous textile suspension experiments; signal in gray; first derivation in pink, second ingreem; dotted lines signal 0-value of each derivation.
Appliedchem 06 00031 g009
Figure 10. Dispersion of aqueous methylene blue in 1% CMC solution over time (0 s–600 s), using a PBT (top) and CB (bottom) geometry.
Appliedchem 06 00031 g010
Figure 11. Normalized semi-logartihmic color–time plots of CMC solution experiments, showing relative values (symbols) and standard deviations (ribbons) of radial/tangential (top) and axial (bottom) flow pattern geometries. Dimensionless RGB values were normalized and plotted at fixed intervals.
Appliedchem 06 00031 g011
Figure 12. Cloud height over tip speed (left) and power consumption (right) at 1% and 3% textile suspension (top and bottom, respectively).
Appliedchem 06 00031 g012
Figure 13. Power consumption over tip speed for all geometries at 1% and 3% textile suspension.
Appliedchem 06 00031 g013
Figure 14. Stirrers at lowest speed of maximum cloud formation (top) and maximum speed (bottom).
Appliedchem 06 00031 g014
Figure 15. Dimensionless numbers Re and Np for the investigated radial/tangential (top) and axial (bottom) stirrer geometries; increasing textile concentration is marked by shade dark to light, scale by color (benchtop = brown, open symbols and semi-pilot = blue-green, closed symbols).
Appliedchem 06 00031 g015
Table 1. Stirrer names, abbreviations, investigated vessels (B…benchtop, SP…semi-pilot) and dimensions.
Stirrer Name and
Abbreviation
ScaleDSHSBSource
Anchor AB, SP0.9·DT0.5·DS0.03·DS[29]
CupCB0.355·DT0.9375·DT1/6·HT[30]
Frame FB0.9·DT0.5·DS0.03·DS[29]
Radial impellerRIB, SP0.9·DT0.17·DS0.18·DS[29]
Crossbeam
(45° angle)
CBB, SP2/3·DT1·DS0.15·DS[26]
Rushton turbine RTB0.33·DT0.03·DS1·DS[31]
Helical ribbon HRB0.58·DT1.5·DS0.3·DS[32]
Pitched-blade turbine
(downward pumping, 45° angle)
PBTB, SP1/3·DT0.1·DS0.03·DS[33]
Table 2. Rheological parameters of textile suspensions from preliminary MCR measurements.
1% Textile Suspension3% Textile Suspension
n/−0.1110.043
K/mPa·s210.335249.4
Disclaimer/Publisher’s Note: The statements, opinions and data contained in all publications are solely those of the individual author(s) and contributor(s) and not of MDPI and/or the editor(s). MDPI and/or the editor(s) disclaim responsibility for any injury to people or property resulting from any ideas, methods, instructions or products referred to in the content.