
Article

Improving Pre-Fattening Protocols for Manila Clam (Ruditapes philippinarum): A Technical Comparison of Upwelling and Flat-Bottom Rearing Systems

1
Independent Researcher, 30173 Venezia, Italy
2
Agenzia Veneta per l’Innovazione nel Settore Primario—Veneto Agricoltura, Viale dell’Università 14, 35020 Legnaro, Italy
3
Consorzio Cooperative Pescatori del Polesine O.P. S.C.Ar.L., Via della Sacca 11, 45018 Porto Tolle, Italy
*
Authors to whom correspondence should be addressed.
Aquac. J. 2026, 6(2), 12; https://doi.org/10.3390/aquacj6020012
Submission received: 18 February 2026 / Revised: 27 March 2026 / Accepted: 8 April 2026 / Published: 13 April 2026

Abstract

Pre-fattening (also referred to as nursery culture) of Manila clam is a priority for this sector of aquaculture, as it allows hatchery-produced seed (1–3 mg) to reach sowable juvenile sizes of 30–100 mg and reduces reliance on natural juvenile recruitment. This study evaluated the efficiency of two early pre-fattening systems, both in economic terms and in product quality: conventional upwelling units (a high-density system) and flat-bottom tanks (a mid-density system), the latter tested with and without a sand layer. The 51-day trial was conducted under autumn environmental conditions (temperature 13–25.8 °C; salinity 25–28 ppt; chlorophyll-a 3–24 µg/L), starting with 1.34 mg seed maintained under a water flow rate ≥ 15–20 mL/min/g. In upwelling units, the initial density was ~216 ind./cm2. Four grading events produced four size classes, with total mean weights ranging from 6.4 mg in the smallest (tails) to 46.3 mg in the largest (heads). The overall population mean size was 19.0 mg, with a specific growth rate (SGR) of 5.2%/day and mortality of 17.6%. Flat-bottom tanks, stocked at ~30 ind./cm2, achieved higher growth (overall weighted mean: 28.0 mg; SGR ~6%/day), but exhibited higher mortality (26.0% on average), with no significant effect from the presence of bottom sand. Overall, flat-bottom systems showed promising growth performance with reduced labor requirements, suggesting that this system could represent a viable alternative to upwelling. However, the associated rearing protocol could still be improved by optimizing stocking density and water exchange rates.

Graphical Abstract

1. Introduction

The Manila clam (Ruditapes philippinarum, Adam & Reeve 1850) is one of the most widely farmed bivalve species in Europe; Italy was the leading producer until 2022, with a volume of approximately 21,000 tons and a market value of EUR 252 million [1]. The northern Adriatic lagoons represent the main farming area for this species [2,3]. Since 2023, the spread of the blue crab (Callinectes sapidus Rathbun, 1896) in the northern Adriatic lagoons has drastically altered this scenario, reducing clam production in the area by 75–100%, depending on the location [1,3,4]. In the Sacca degli Scardovari (Po River Delta), annual harvests sharply declined from approximately 4807 tons in 2023 to 205 tons in 2024 and 340 tons in 2025. At the same time, the proliferation of blue crabs has drastically reduced the availability of natural seed, previously collected in specific lagoon areas and representing more than 95% of the total seed supply [2], further exacerbating the ongoing depletion of this resource due to other causes [5,6,7].
Seed supply, therefore, is now increasingly dependent on hatcheries, which face difficulties in producing large quantities of spat larger than 2–3 mm. This is mainly due to the high cost of phytoplankton, which can represent up to 30% of operating expenses and increases sharply with juvenile size [8,9]. For this reason, hatcheries generally transfer 1–2 mm spat to outdoor rearing systems [9], where they are fed using lagoon waters or waters from semi-natural basins, preferably eutrophic, using different techniques [10,11,12,13,14]. This stage is traditionally referred to as the nursery phase when carried out within hatchery premises, typically extending to a shell length of 8–10 mm [15]. In recent years, however, the term pre-fattening has become increasingly common, particularly with the establishment of on-farm pre-fattening facilities by farmers, to meet their need of larger seed sizes (even 15–20 mm or more). Within this extended phase between hatching and seeding in the lagoon, it is possible to distinguish between early pre-fattening, which largely coincides with the traditional nursery phase and is the focus of this study, and late pre-fattening, which can be achieved using different rearing techniques [16,17].
In the northern Adriatic lagoons, intensive upwelling-based pre-fattening systems are predominant, including standard modular units used in hatcheries and FLUPSYs (Floating Upweller Systems), the latter not requiring land-based facilities [11,18,19,20,21,22]. More recently, raceway-type tanks have also been adopted, in which juveniles are stocked at mid-low density and grown under laminar water flow, with minimal husbandry [23]. However, published information on the commercial-scale performance of this technique remains scarce and often outdated [13,14,24].
We designed a study aimed at evaluating the productivity of a system based on circular flat-bottom tanks in comparison with a conventional upwelling module managed with periodic size grading. The flat-bottom circular tank system is partly similar to raceways; however, reliable data on the productivity of both these systems at the commercial scale are lacking. The aim of this trial is therefore twofold: to propose a management protocol for flat-bottom tanks while documenting their production performance, and to assess whether these results are competitive, in terms of both size and quantity of harvested product, with those obtained from upwelling modules. Additionally, the effect of size grading on productivity in the upwelling system is discussed in light of previous experiments conducted without applying size selections.

2. Materials and Methods

2.1. Experimental Facilities and Layout

The trial was conducted at the premises of the Consorzio Cooperative Pescatori del Polesine O.P. (Po River Delta, Italy) using two parallel pre-fattening systems: a conventional upwelling rearing module and a set of circular flat-bottom tanks, two of which were provided with a sand substrate (Figure 1). Both systems operated as open-flow circuits, drawing water from the Sacca degli Scardovari.

2.2. Seed Material and Experimental Design

Seed was purchased from Naturedulis Srl (Goro, Italy) on 8 September 2025. Clams had a mean individual weight of 1.34 mg, calculated from four samples (total n = 942) as the ratio between total sample weight and number of individuals, and a mean individual length of 1.68 mm, based on 98 individual measurements.
The upwelling system consisted of a standard hatchery-type module (Figure 1a,b), comprising a flow-through system with rectangular raceways containing cylindrical PVC units (Figure 1a). Each of these units (Figure 1b), hereinafter referred to as upwellers (upw), was initially equipped with a 500 μm mesh bottom, which was replaced with a 1000 μm mesh bottom on day 22 of culture. The experimental groups were tested in duplicate, designated as the “V series” and the “R series,” respectively. Each replicate was initially stocked with approximately 258,000 individuals (total biomass: 345 g) in a single upweller (39 cm internal diameter; effective area: ~1194 cm2), corresponding to an initial density of ~216 ind./cm2. Therefore, at the beginning of the experiment, only upwellers V1 and R1 were in use, while the others were progressively activated and seeded with new subgroups derived from the periodic size grading. Grading was performed at approximately 10-day intervals, with four events conducted per replicate. Growth performance was monitored through triplicate sampling. Water flow rate was set at 26 L/min per upweller, corresponding to ~75 mL/min/g of initial biomass, and grading was conducted to maintain a water exchange rate ≥ 15 mL/min/g, preferably ≥20 mL/min/g [1].
The flat-bottom tank trial included two pre-fattening conditions, each in duplicate: tanks with sand (labeled G1 and G2) and tanks without substrate (labeled G3 and G4). Four cylindrical tanks (100 cm diameter, 65 cm height) were used, each equipped with a central standpipe drain (110 mm diameter) with an effective estimated usable area of 7750 cm2 and a volume of ~500 L. Each tank was initially stocked with approximately 230,436 individuals (total biomass: 308 g), corresponding to an initial density of ~30 ind./cm2. Water exchange was set at 85 L/min (approximately 10 tank volumes per hour) to ensure a water flow rate ≥ 15 mL/min/g in these groups until the end of the trial based on the expected final biomass. During the trial, some technical modifications were introduced to improve hydrodynamics and reduce sediment displacement and mortality (Figure 1c,d). In sand-bottom tanks, the initial sand layer (~4 cm) was reduced by half on day 16, following the formation of thick sediment accumulations and localized anoxic conditions. In addition, the water inlet and outlet configuration was modified to promote laminar downward circulation and bottom water renewal. This was achieved by introducing surface inflow and a concentric sleeve around the standpipe drain, thus forcing water withdrawal from the tank bottom (Figure 1d,e). This configuration improved contact between plankton-rich inflow and clams settled on the bottom before discharge.

2.3. Measurement of Environmental Parameters

Water chemical–physical parameters (dissolved oxygen, temperature, and salinity) in the Sacca degli Scardovari, from which the water was drawn, were monitored every 30 min by an ARPAV monitoring buoy (“Scardovari interno”) located approximately 300 m from the facility water intake. Validated data for these variables, covering the period of interest, were obtained from the ARPAV annual report [25].
In addition, unvalidated chlorophyll-a (Chl-a) concentration data recorded by the “Scardovari interno” buoy and temporarily available online (https://www.arpa.veneto.it/dati-ambientali/dati-in-diretta/acque/lagune-delta-del-po, accessed on 5 February 2026), with availability restricted to the most recent 48 hours, were continuously retrieved throughout the study period and independently processed by the authors. Data processing included a preliminary cleaning step consisting of the removal of evident outliers, identified as isolated values inconsistent with adjacent records in the time series. Daily mean values were then calculated together with the corresponding minimum and maximum values.
These continuously recorded environmental data were used as the reference for lagoon water conditions supplying the facility. In addition, the consistency of water quality within the experimental units was verified through routine manual monitoring. Dissolved oxygen (measured both at the inlet and within the rearing units) and temperature were measured from Monday to Friday using a portable oximeter (OxyGuard Handy Polaris, OxyGuard International A/S, Farum, Denmark), while salinity was measured approximately weekly with a handheld refractometer (Atago™ MASTER-S/MillM, Atago Co., Ltd., Tokyo, Japan). These checks were intended to confirm that water quality within the system remained consistent with the source water and that no progressive oxygen depletion occurred within the rearing units as a result of excessive biomass density.

2.4. Biometry, Growth, and Mortality

Mean individual weight data were collected periodically from triplicate samples and calculated as the ratio between the drained wet weight of each sample and the total number of individuals it contained. Each sample consisted of at least 200 individuals and was randomly collected after washing and homogenizing the cultured biomass. Sample weights were measured using a precision balance (Gibertini Europe 1000; 0.01 g sensitivity, Gibertini Elettronica S.r.l, Novate Milanese, Italy), while total biomass per experimental group was measured at stocking and harvest using a balance with 1 g sensitivity (Acculab ECON EC-2100, Sartorius Group, Goettingen, Germany).
Specific growth rate (SGR) was calculated according to Martínez-Córdova et al. [26]:
SGR = [(ln(WT) − ln(Wt))/(T − t)] × 100
where Wt and WT are the mean individual weights (mg) at times t and T, respectively, and T − t is the time interval in days.
Shell length was measured on photographic samples of approximately 100 individuals at the seeding time and 200–300 individuals at the end of the trial, using image analysis software ImageJ ver. 1.53t (NIH, Bethesda, MD, USA). Mortality was estimated at the end of the trial as the percentage difference between the number of clams initially seeded in each upwelling series or flat-bottom tank and the total number of individuals in the corresponding graded subsets, the latter calculated as the ratio between total harvested biomass and mean individual weight.

2.5. Statistical Analysis

Differences in mean shell length and mean individual weight among experimental groups within each pre-fattening system were tested using one-way ANOVA with 9999 permutations, followed by pairwise comparisons using permutation-based Tukey HSD tests. For the G series only, the effect of substrate (sand vs. no sand) was analyzed using a permutation-based Student’s t-test. All analyses were performed using B1Classic software ver. 2.0 (Sissad, Trieste, Italy). Permutation tests were used because they do not rely on assumptions of normality or homoscedasticity, providing a robust non-parametric approach suitable for experimental datasets with potentially non-standard distributions. The comparison of final individual total length distributions in the pooled populations from the upwelling system and the flat-bottom tanks, respectively, was performed using PAST ver. 4.03 [27].

3. Results

The trial lasted 51 days, during which culture conditions remained consistently favorable for clam growth. A prolonged interruption of water exchange occurred between days 18 and 20 of culture due to an electrical failure. This event caused severe stress and a temporary slowdown in growth; however, visual inspection of the cultured biomass following the restoration of water circulation did not reveal significant mortality. This was then confirmed by the percentage mortality recorded at the final harvest, which falls within the range already reported for this pre-fattening phase (cf. [1]). Environmental monitoring data and growth performance results are presented below.

3.1. Environmental Parameters

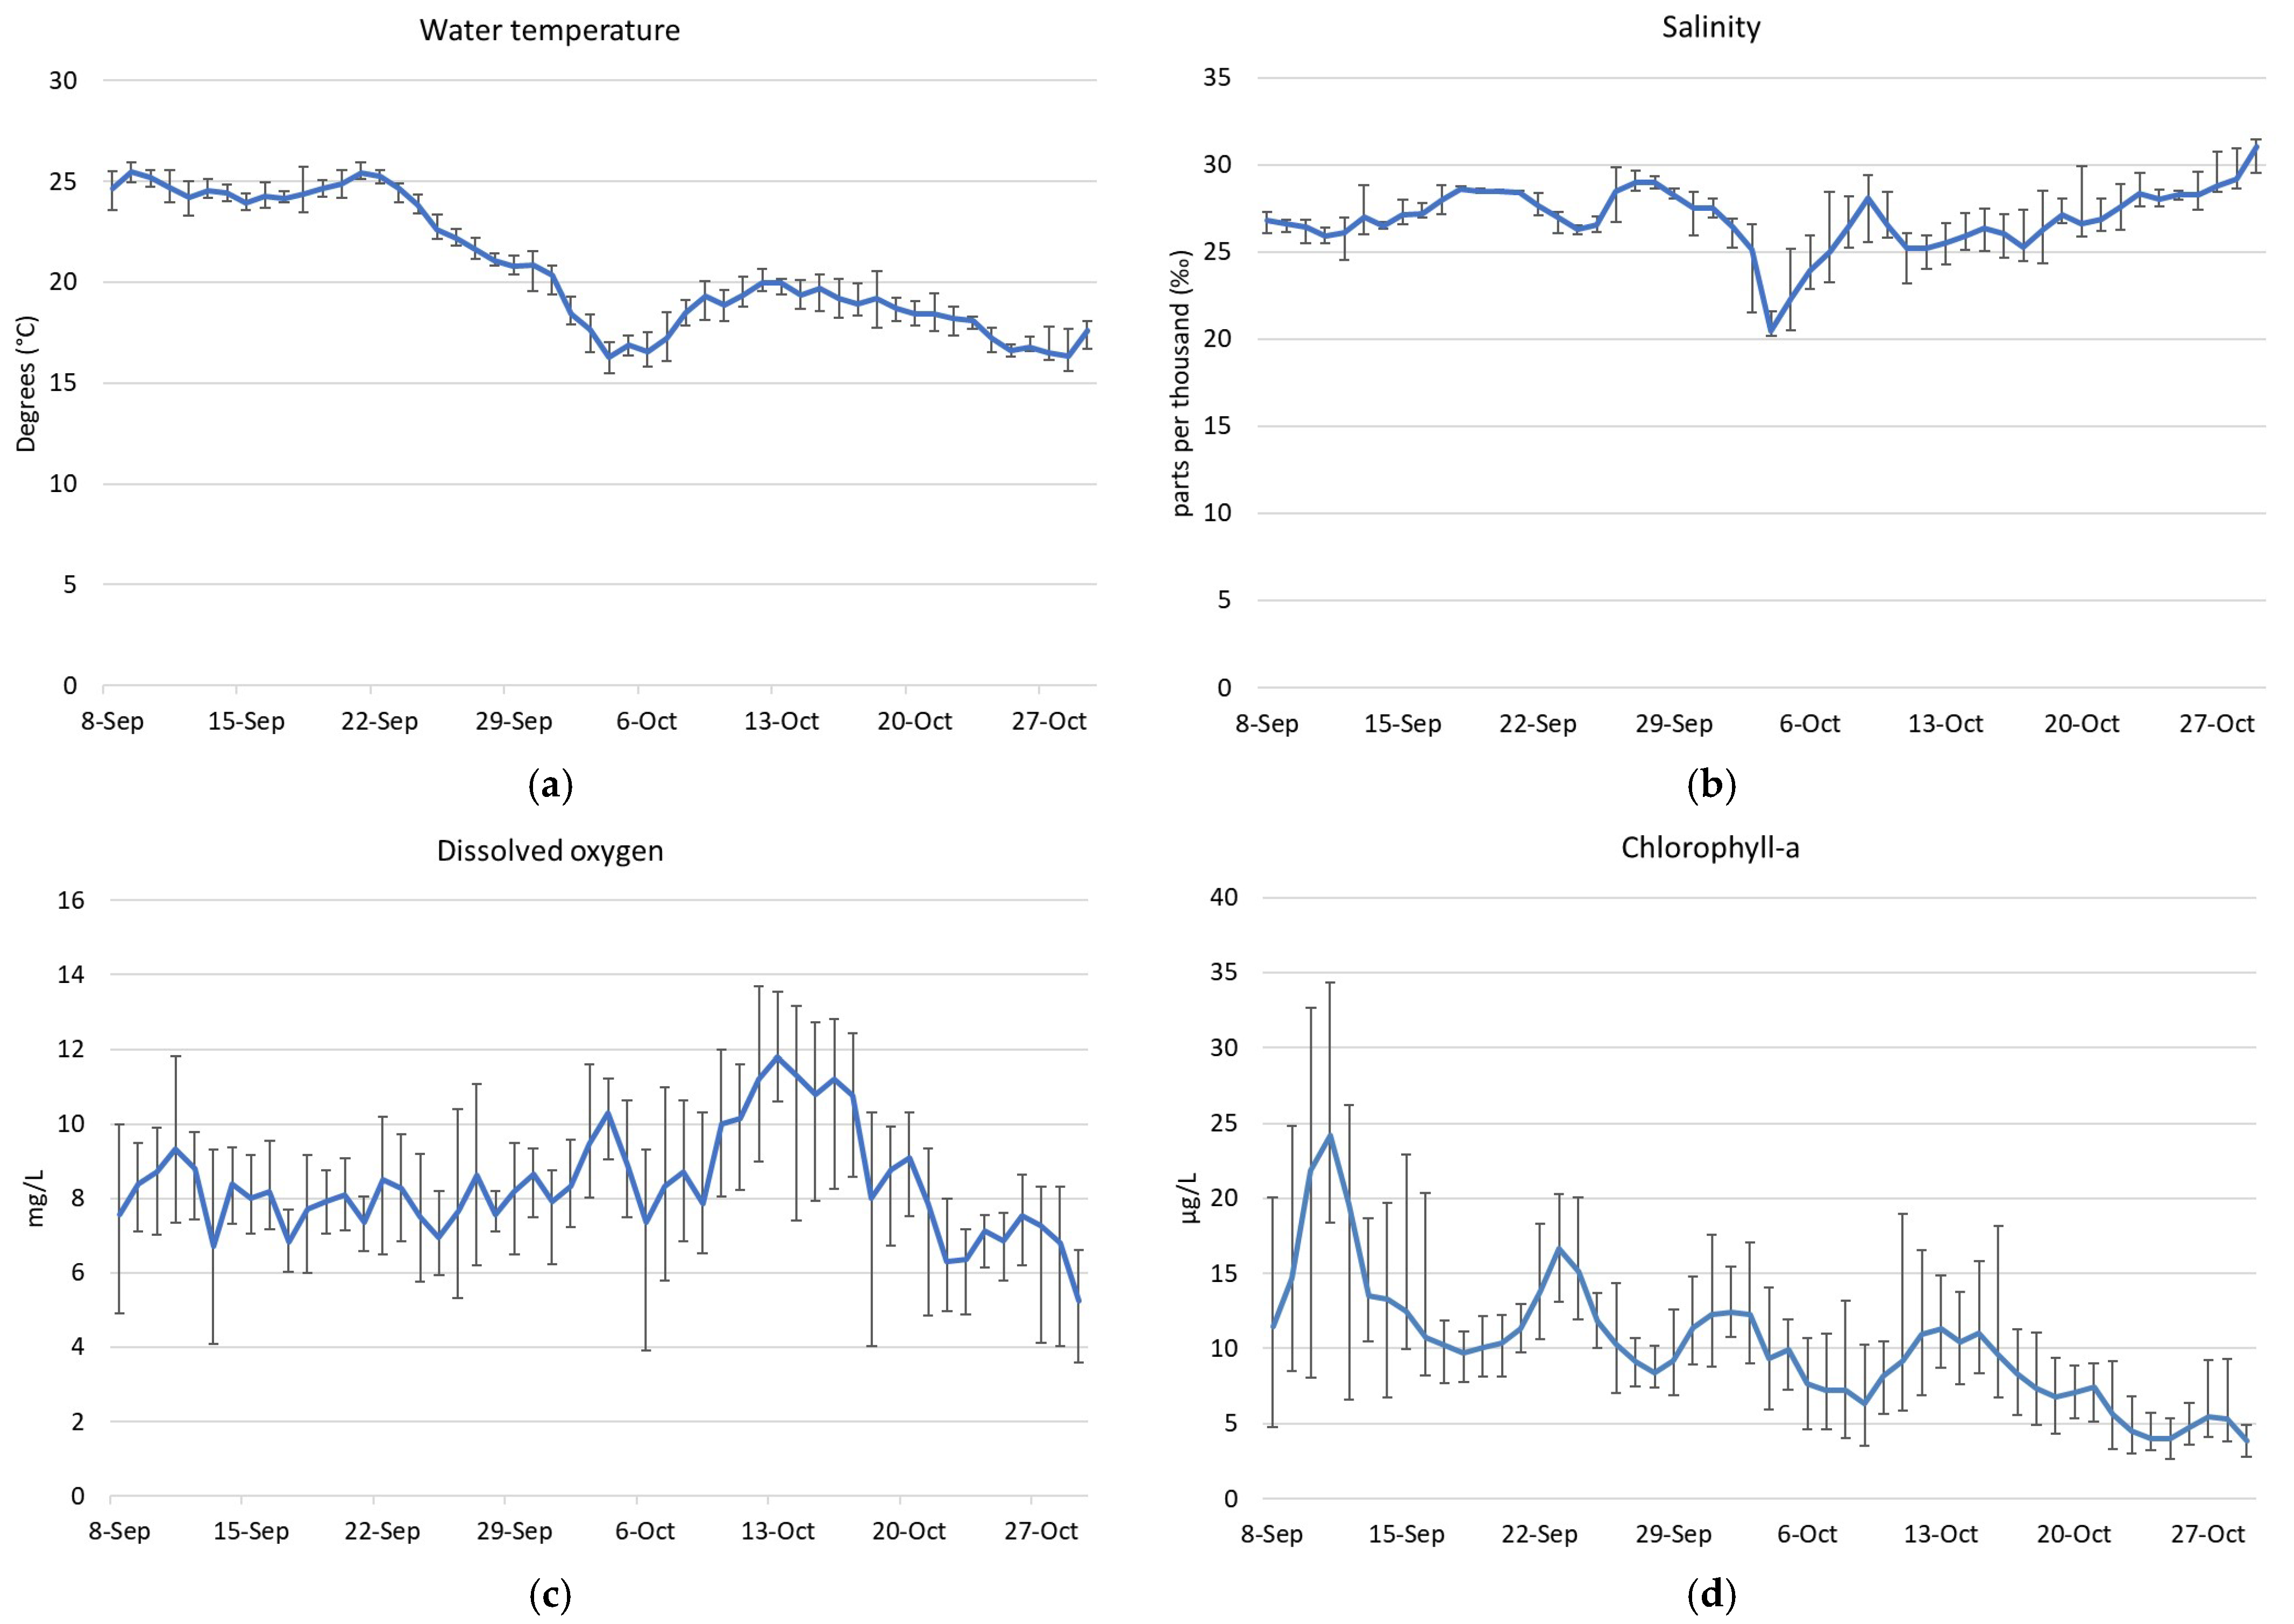
Figure 2 shows the continuous measurements of temperature (Figure 2a), salinity (Figure 2b), and dissolved oxygen (Figure 2c) recorded in the Sacca degli Scardovari. Discontinuous handheld measurements of the same variables in the rearing systems are reported in Table 1.
Based on data recorded through continuous monitoring, the mean temperature was 20.7 °C, ranging from 15.5 to 26 °C (Figure 2a). Salinity had a mean value of 26.9 ppt, ranging from 20.2 to 31.5 ppt, with the minimum briefly reached at the beginning of October due to heavy rainfall (Figure 2b). Dissolved oxygen exhibited a mean concentration of 8.4 mg/L, ranging from 3.6 to 13.7 mg/L (Figure 2c). Measurements on the rearing system water were consistent with these fluctuations. In particular, the data confirmed that the ratio between water flow rate and biomass density never reached levels that would lead to dissolved oxygen depletion harmful to clam health.
During the experimental period, Chl-a showed a mean concentration of 10.2 μg/L, with fluctuations ranging from 2.6 to 34.4 μg/L. Chl-a is the parameter most commonly used as an indicator of phytoplankton availability [28,29], which represents the primary food source for clams, although it is not the only one [30]. The recorded values indicate highly favorable trophic conditions [31], largely exceeding the minimum concentrations required to sustain adequate bivalve growth, as further discussed below.

3.2. Growth Performance of the Clams in the Upwelling System

Table 2 summarizes the main parameters calculated at the end of the trial with regard to growth performance and mortality of clams from series V and series R. The reported values are weighted means calculated by pooling the total biomass and the number of individuals from the three samples within each group. This approach was preferred to the mean of replicate means because the weighted mean is more precise when sample sizes are numerically imbalanced, as in this case. Variation among replicate samples was nevertheless assessed through statistical analysis, the results of which are presented later. Results show that the final mean individual weight achieved in the two replicates was nearly identical, reaching 19.2 mg in series V and 18.8 mg in series R. Mortality was slightly higher in series V (19%) compared to series R (16%). The SGR was 5.2%/day in both replicates, indicating comparable culture conditions and growth performance.
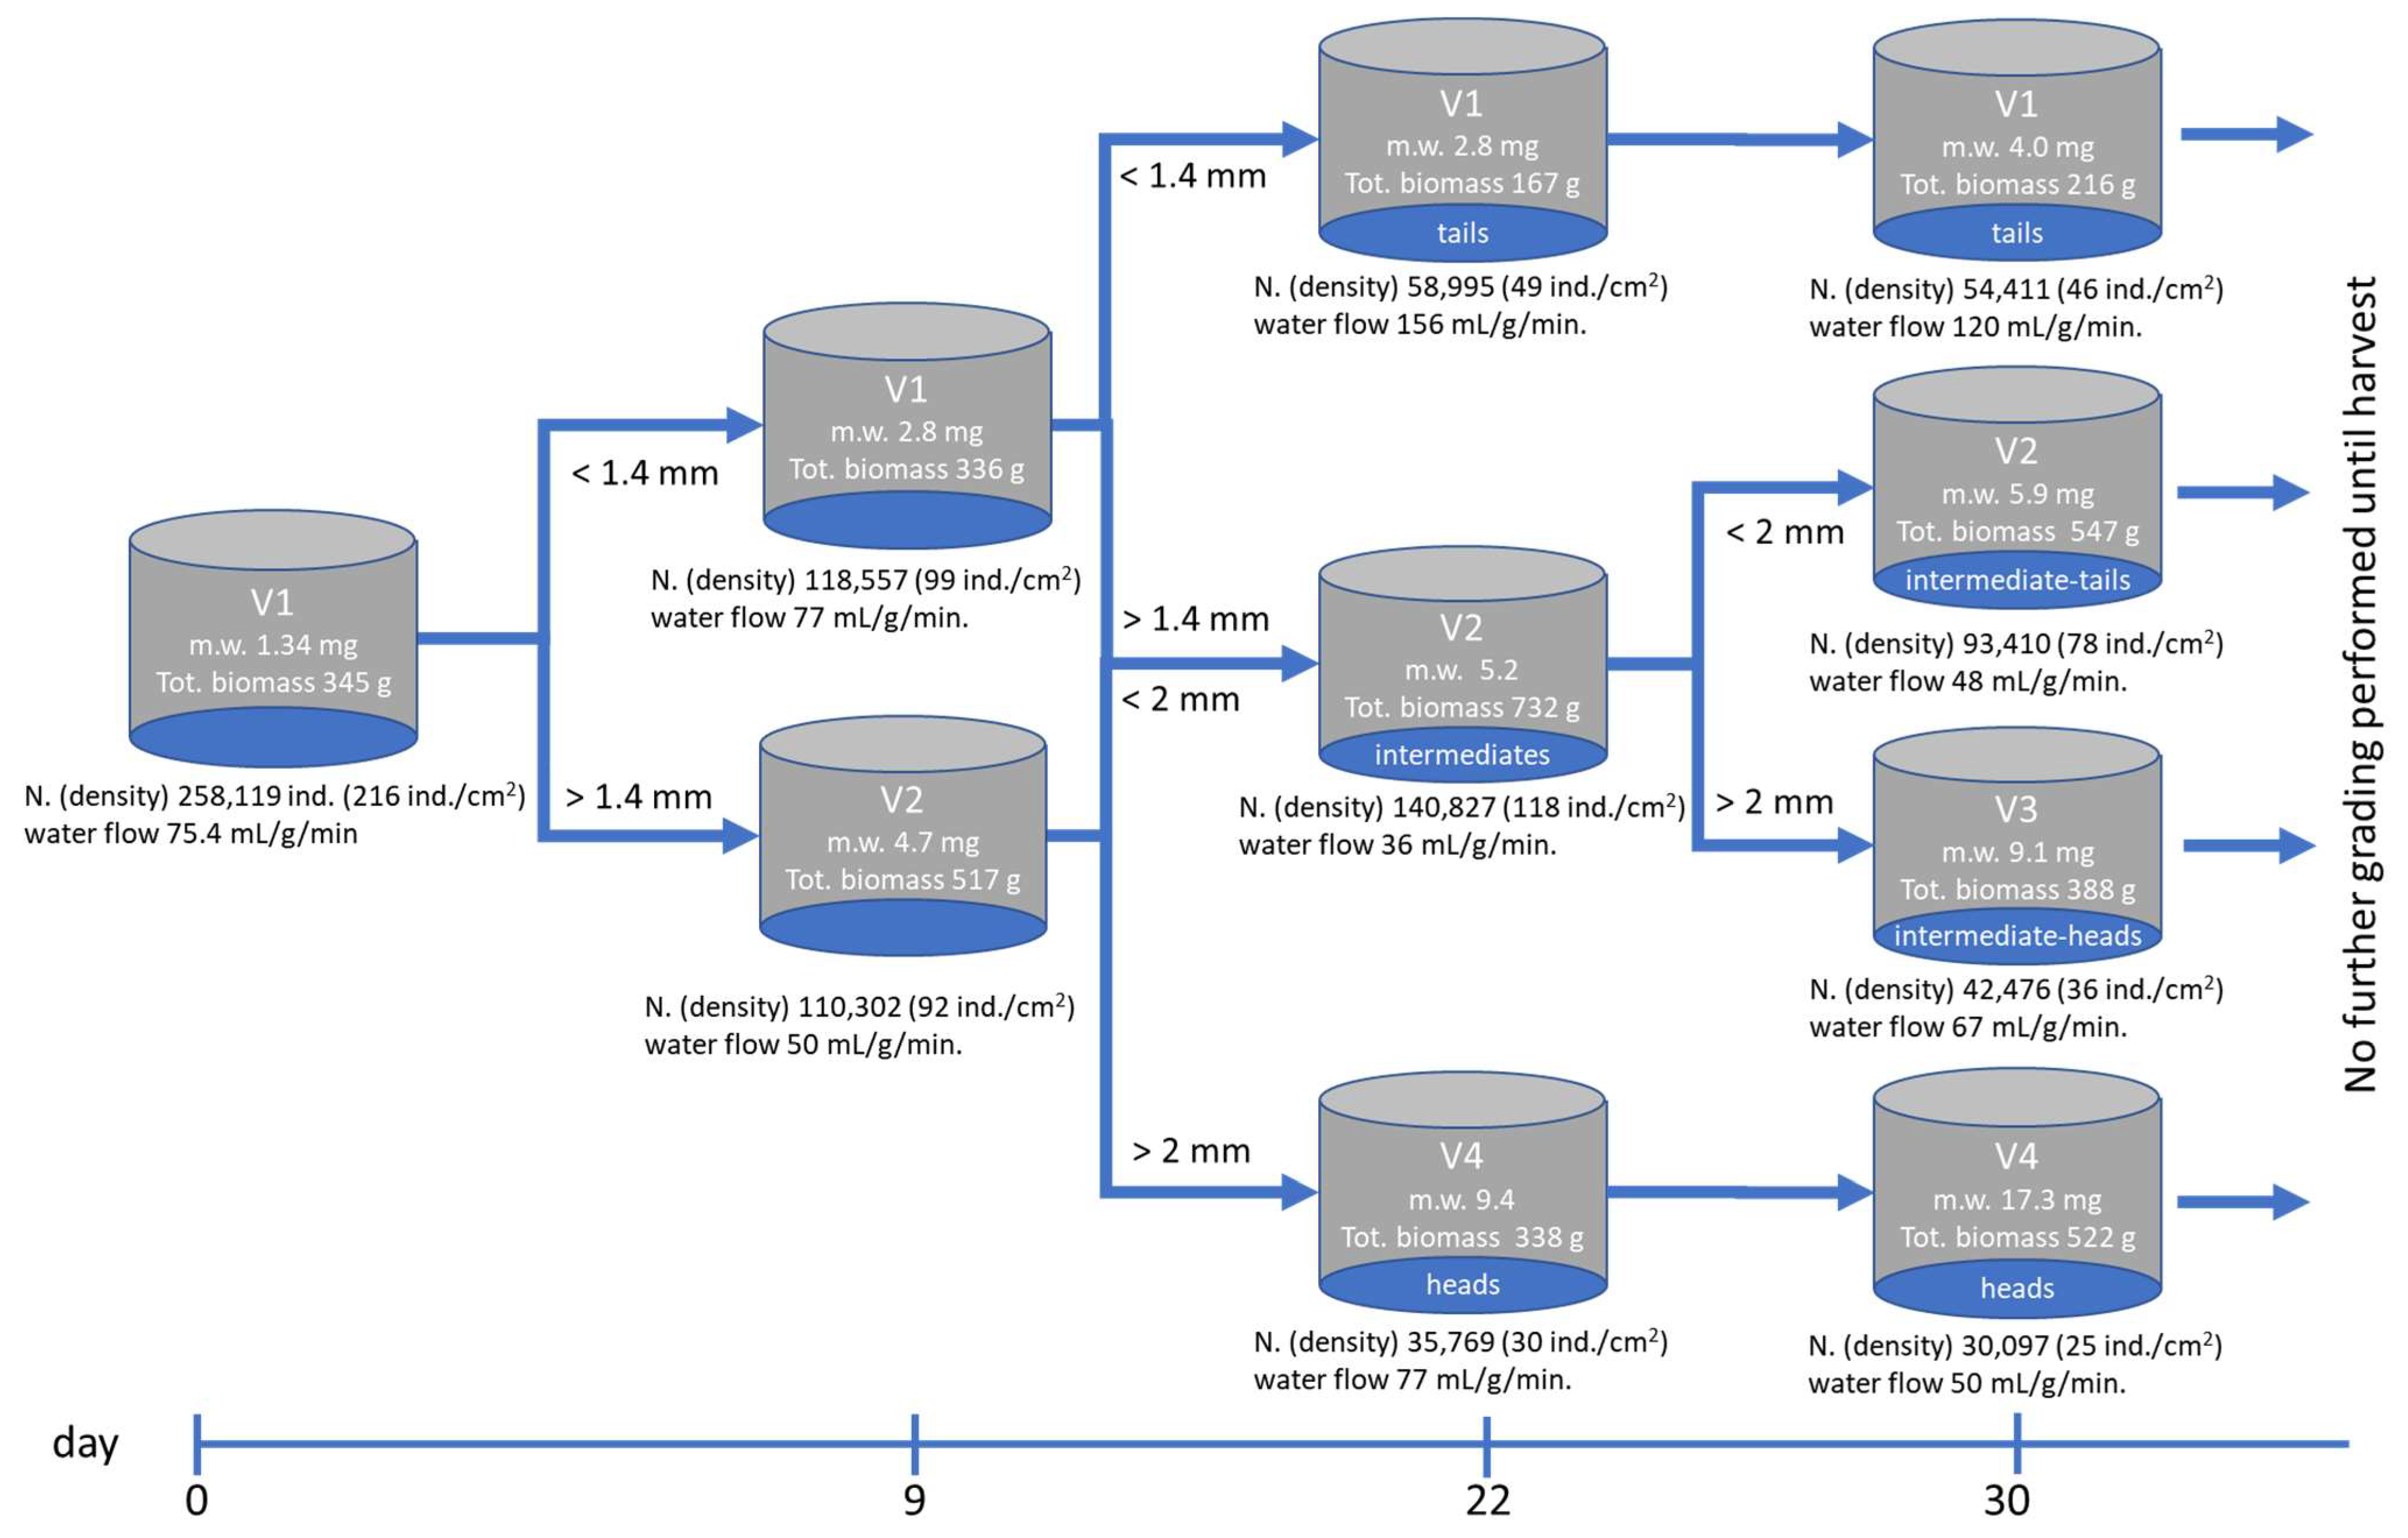
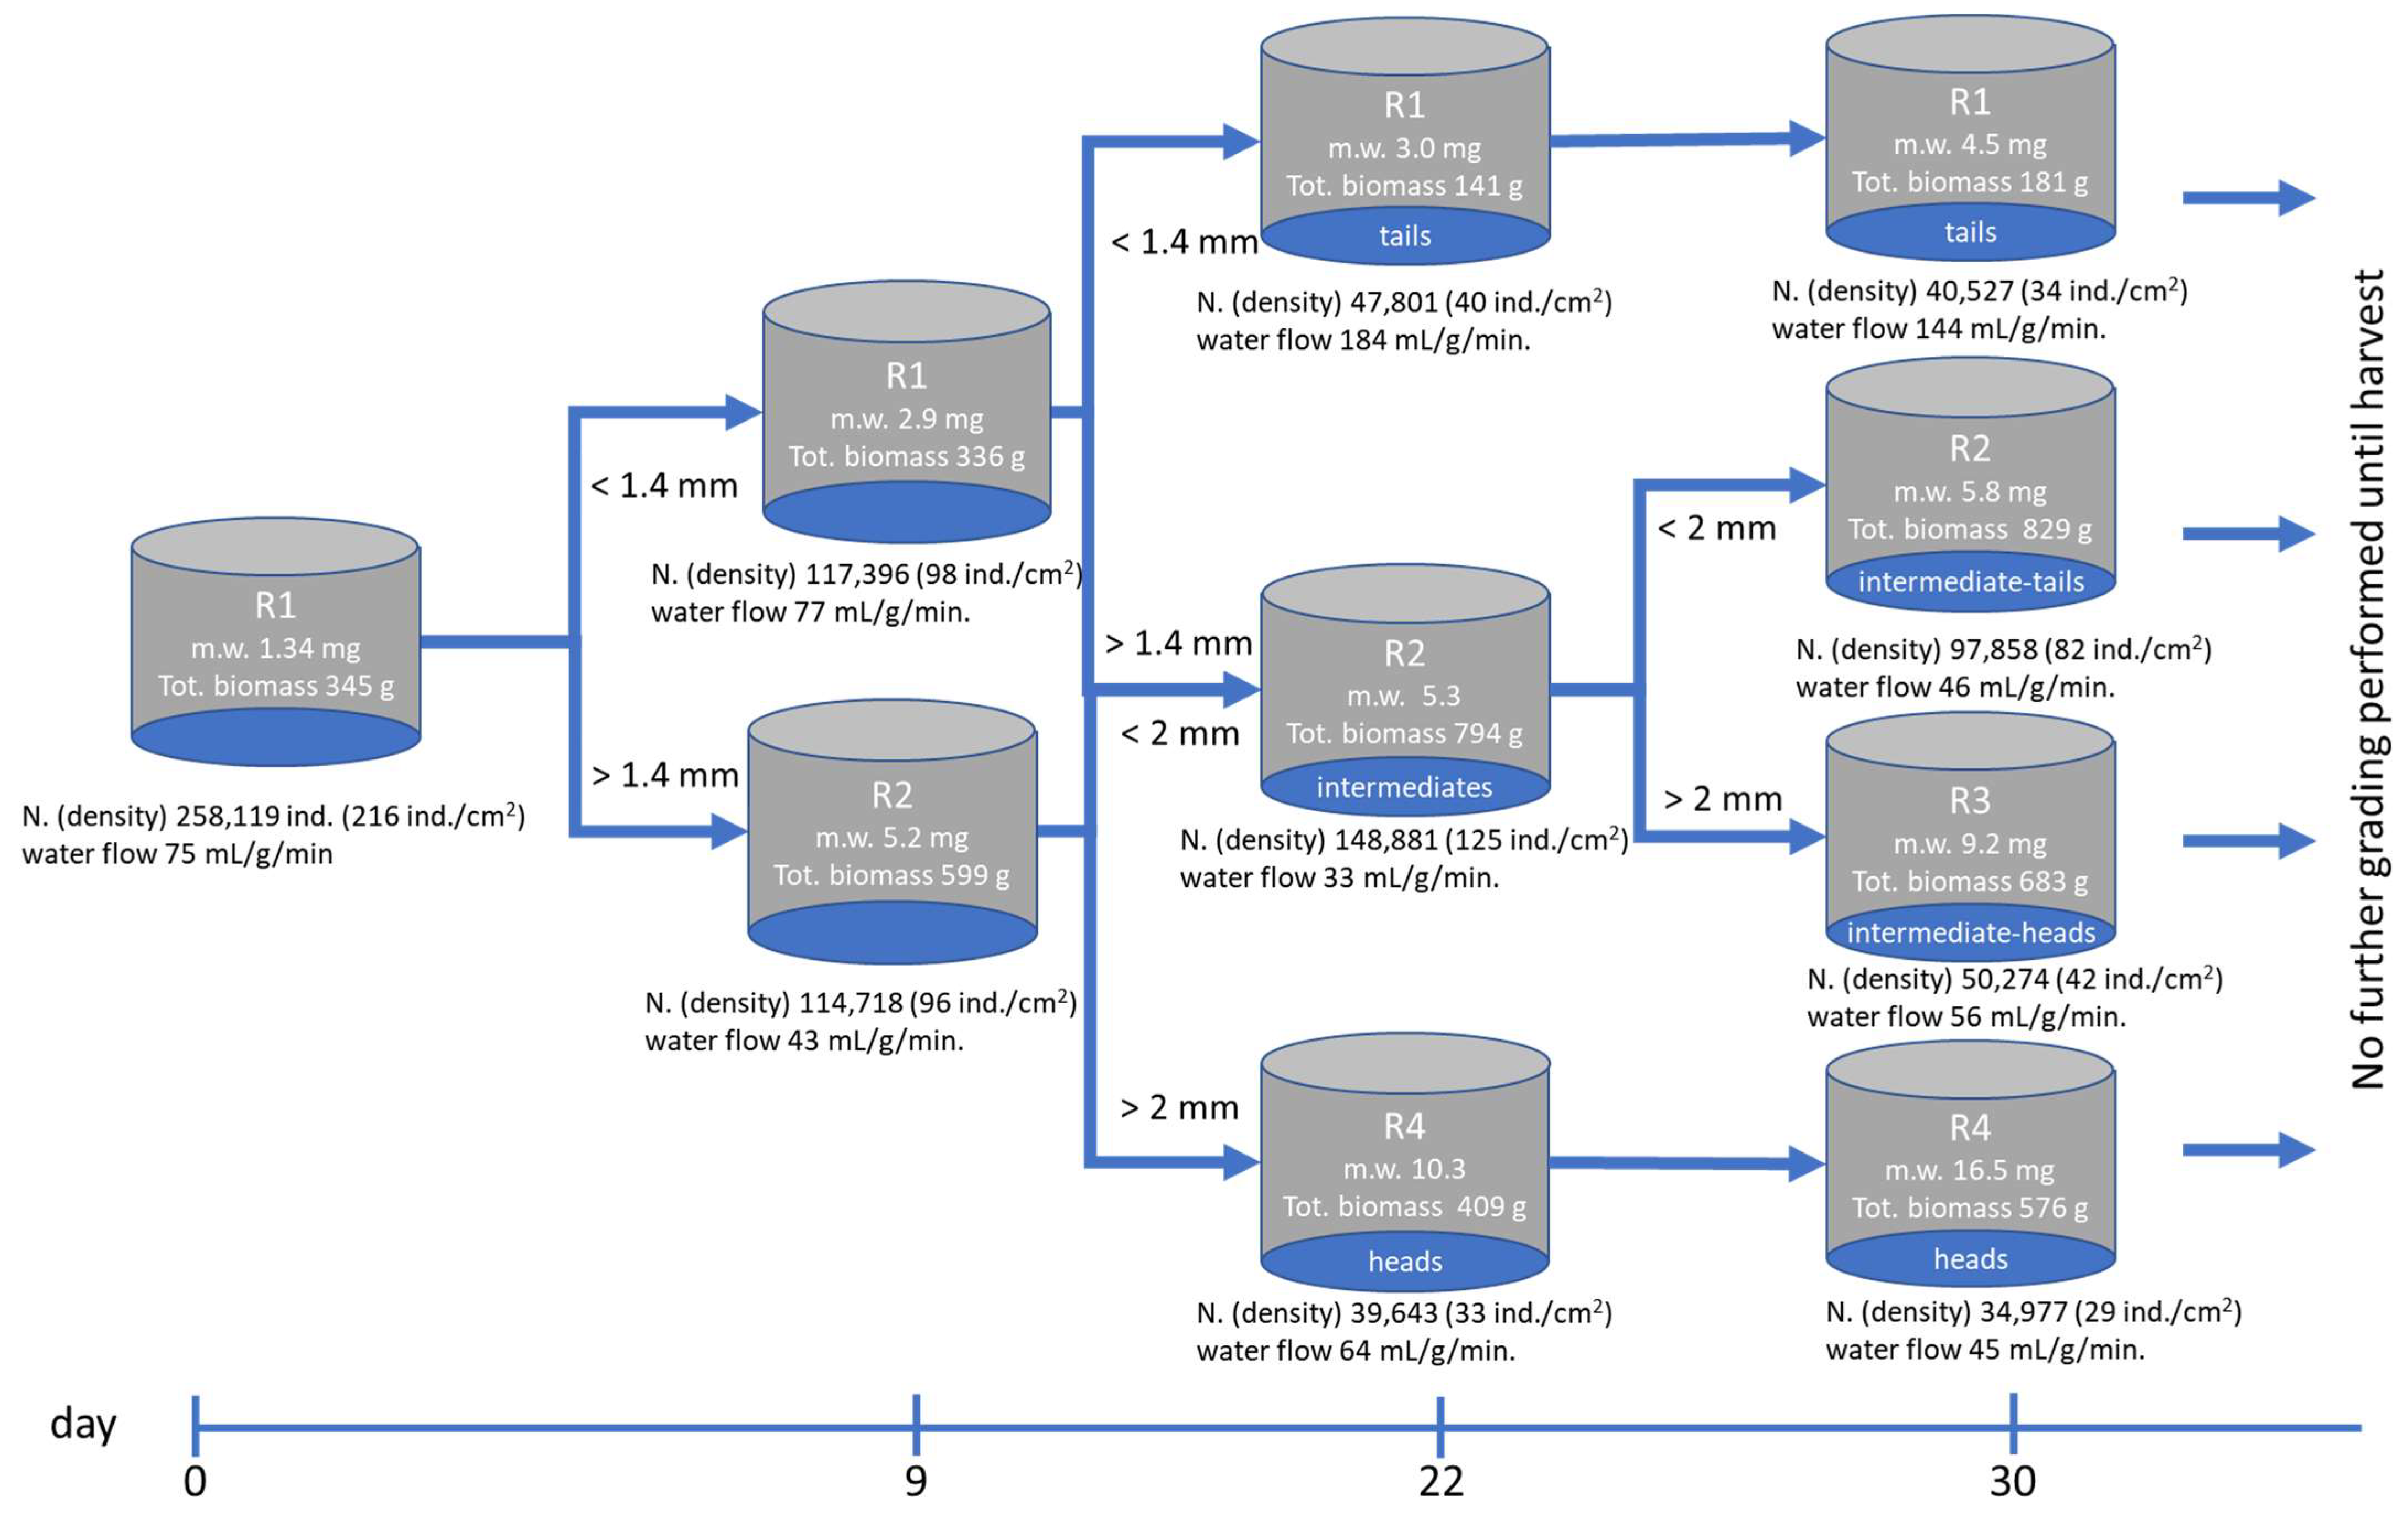
Table A1 (Appendix A) reports detailed data recorded during the trial, including mean individual weight growth and associated changes in biomass per upweller, density per cm2, and water exchange rate (mL/min/g of biomass). For each experimental group and grading event, the water exchange rate per gram of biomass is reported both before grading (for the total biomass) and after grading (for each resulting subgroup). Density values are reported only after grading. Figure 3 and Figure 4 illustrate the grading plan implemented during the rearing period and the corresponding redistribution of biomass among the upw units. At the third grading, the material was subdivided into three groups, here termed ‘heads’, ‘intermediates’, and ‘tails’, according to decreasing growth rate.
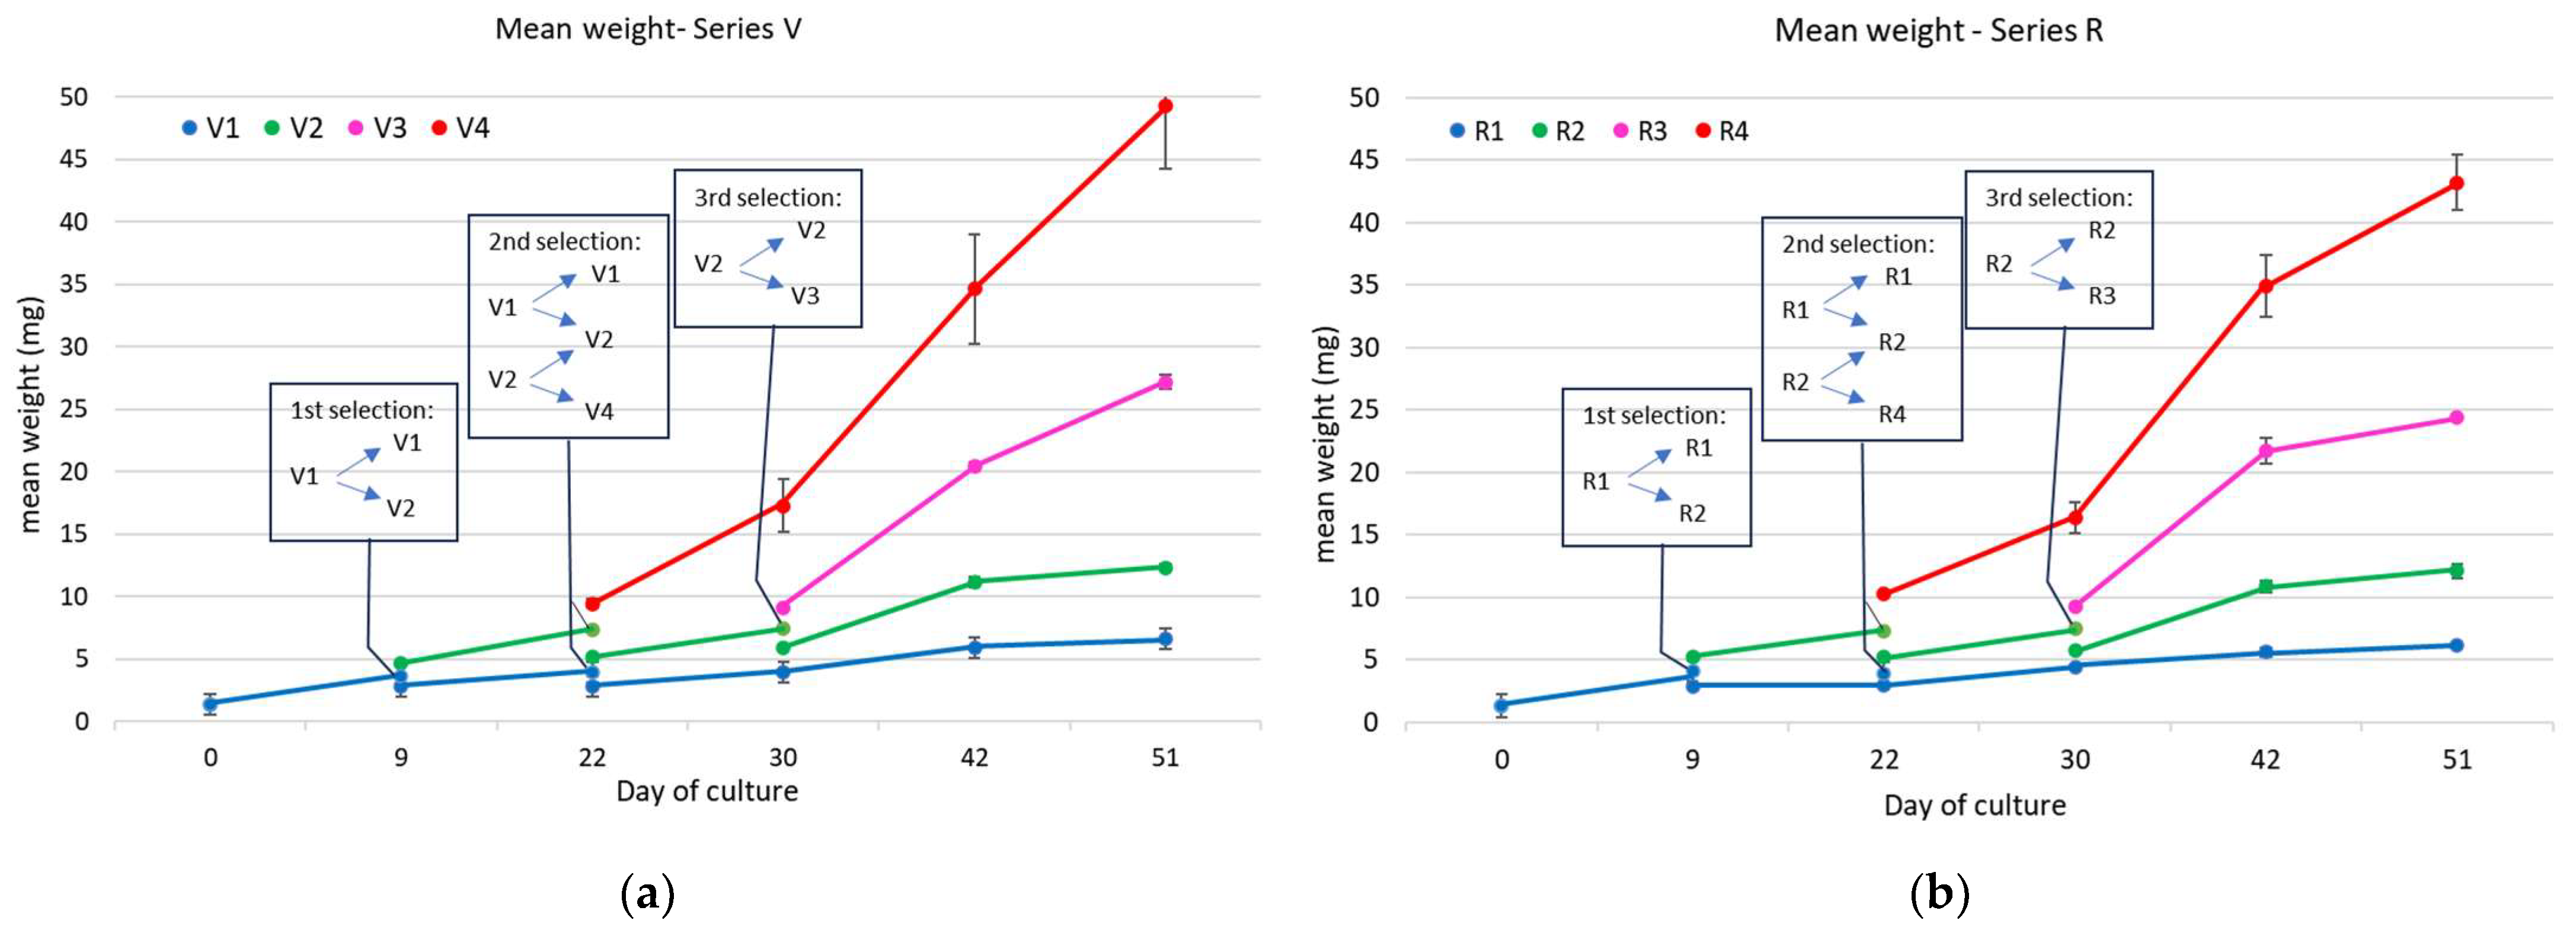
As expected, the intermediate group was the most abundant; therefore, a fourth grading was carried out after 8 days to maintain the planned optimal water flow rate per gram of biomass (>15 mL/min/g, preferably >20 mL/min/g), subdividing the intermediates into ‘intermediate-head’ and ‘intermediate-tail’ subgroups. The trend in mean individual weight over the course of the trial, calculated as the mean ± standard deviation from three samples per group, is shown in Figure 5. Growth trajectories were comparable between replicates and revealed a clear divergence between fast-growing (heads and intermediate-heads) and slow-growing fractions (tails and intermediate-tails). Despite repeated grading and redistribution of biomass aimed at maintaining optimal stocking density and water exchange rates, slow-growing groups (V1/R1 and V2/R2) did not show a substantial recovery in growth performance. Particularly evident is the nearly flat growth pattern of the tail groups (V1 and R1), which by the end of the trial only slightly exceeded 5 mg/ind.
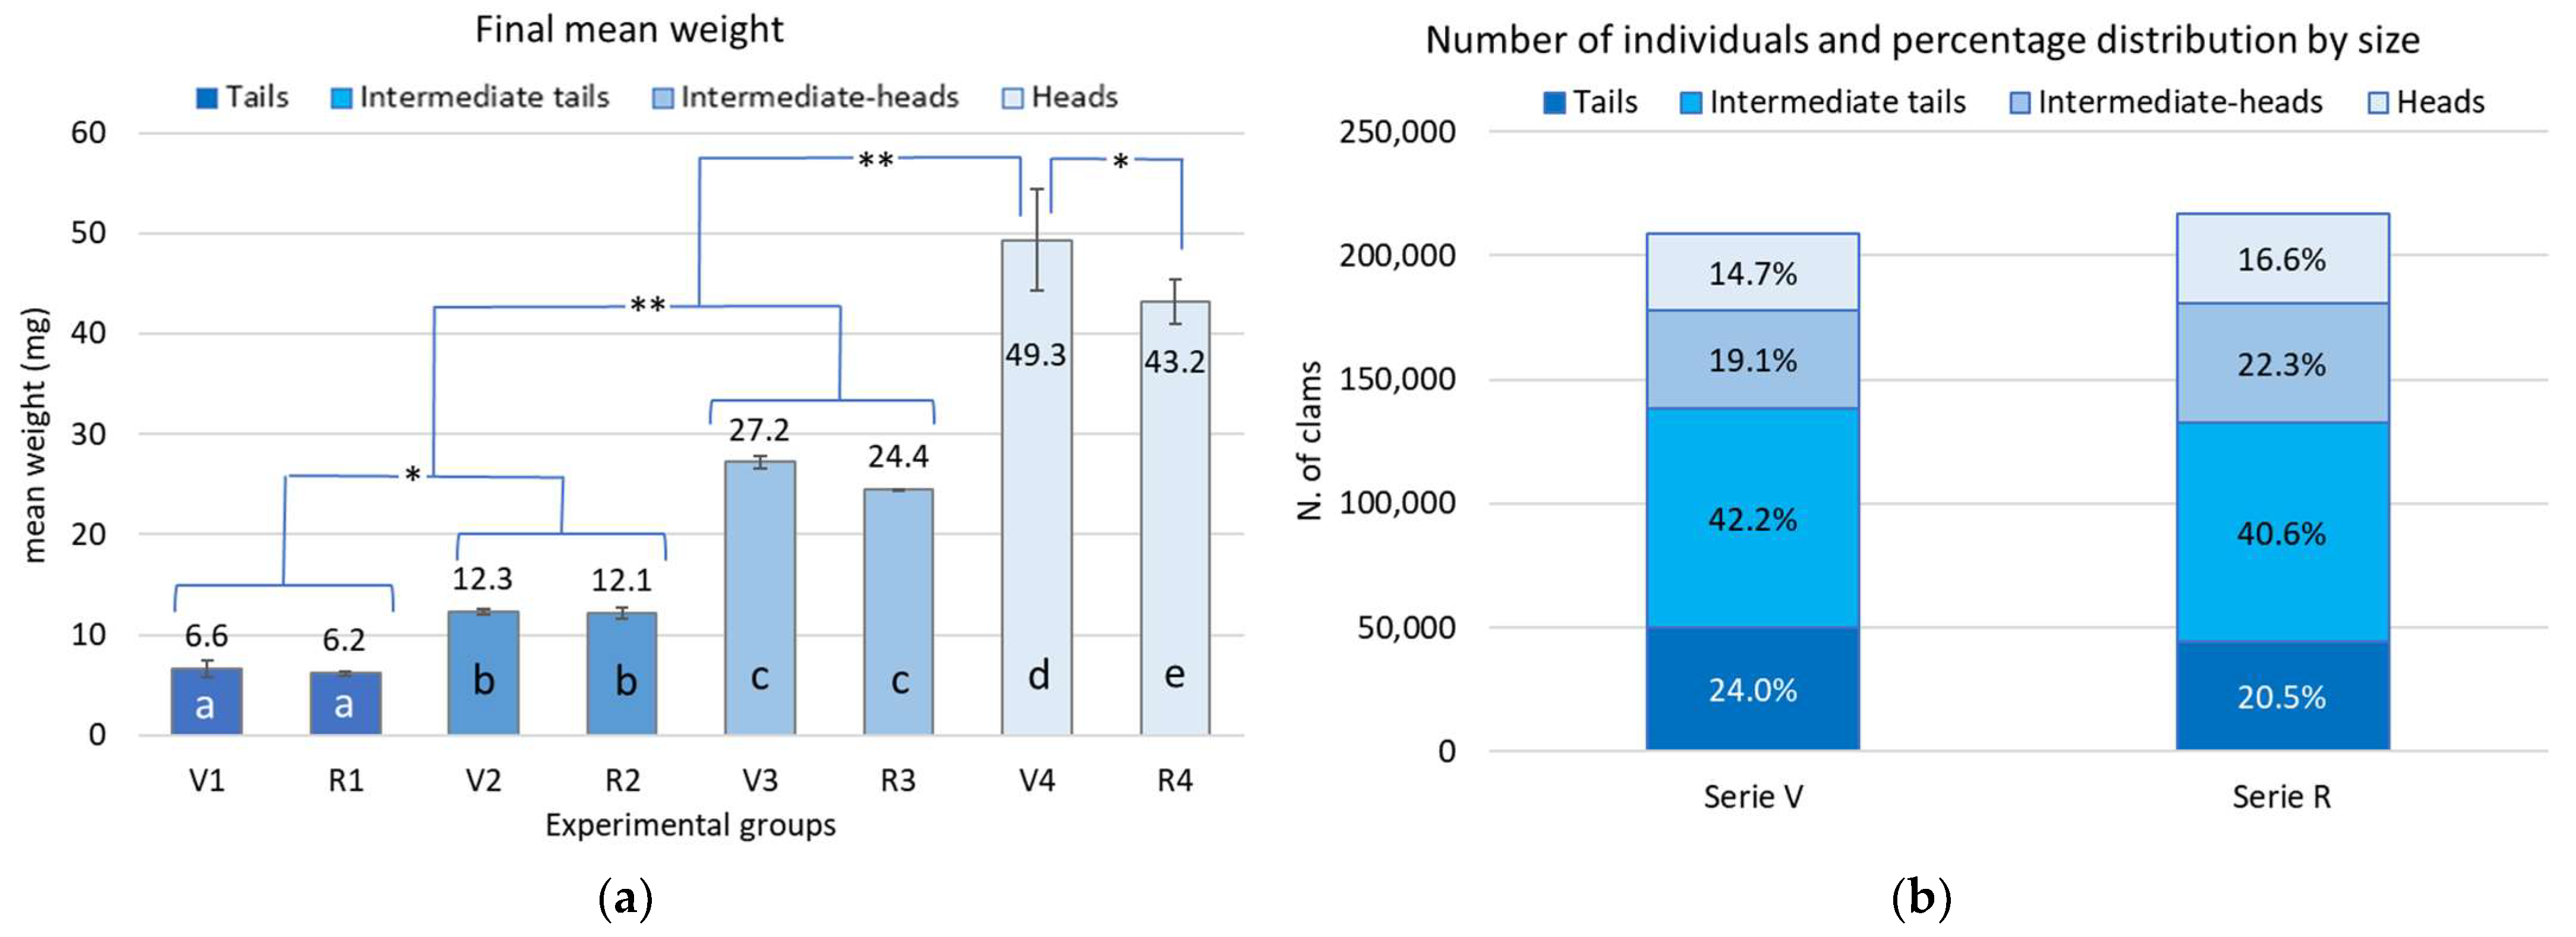
Final mean weights were highly consistent between replicates, with no significant differences among corresponding groups, except for the head fraction, which showed a larger size in V4 than in R4 (p < 0.05; Figure 6a), possibly related to the lower number of individuals in V4. The percentage distribution among size classes was also very similar between the two replicates, with the intermediate groups accounting for approximately 62% of the total population in each series (Figure 6b). This confirms that the observed growth performance depended primarily on the adopted management protocol, while uncontrolled variables did not exert significant effects.
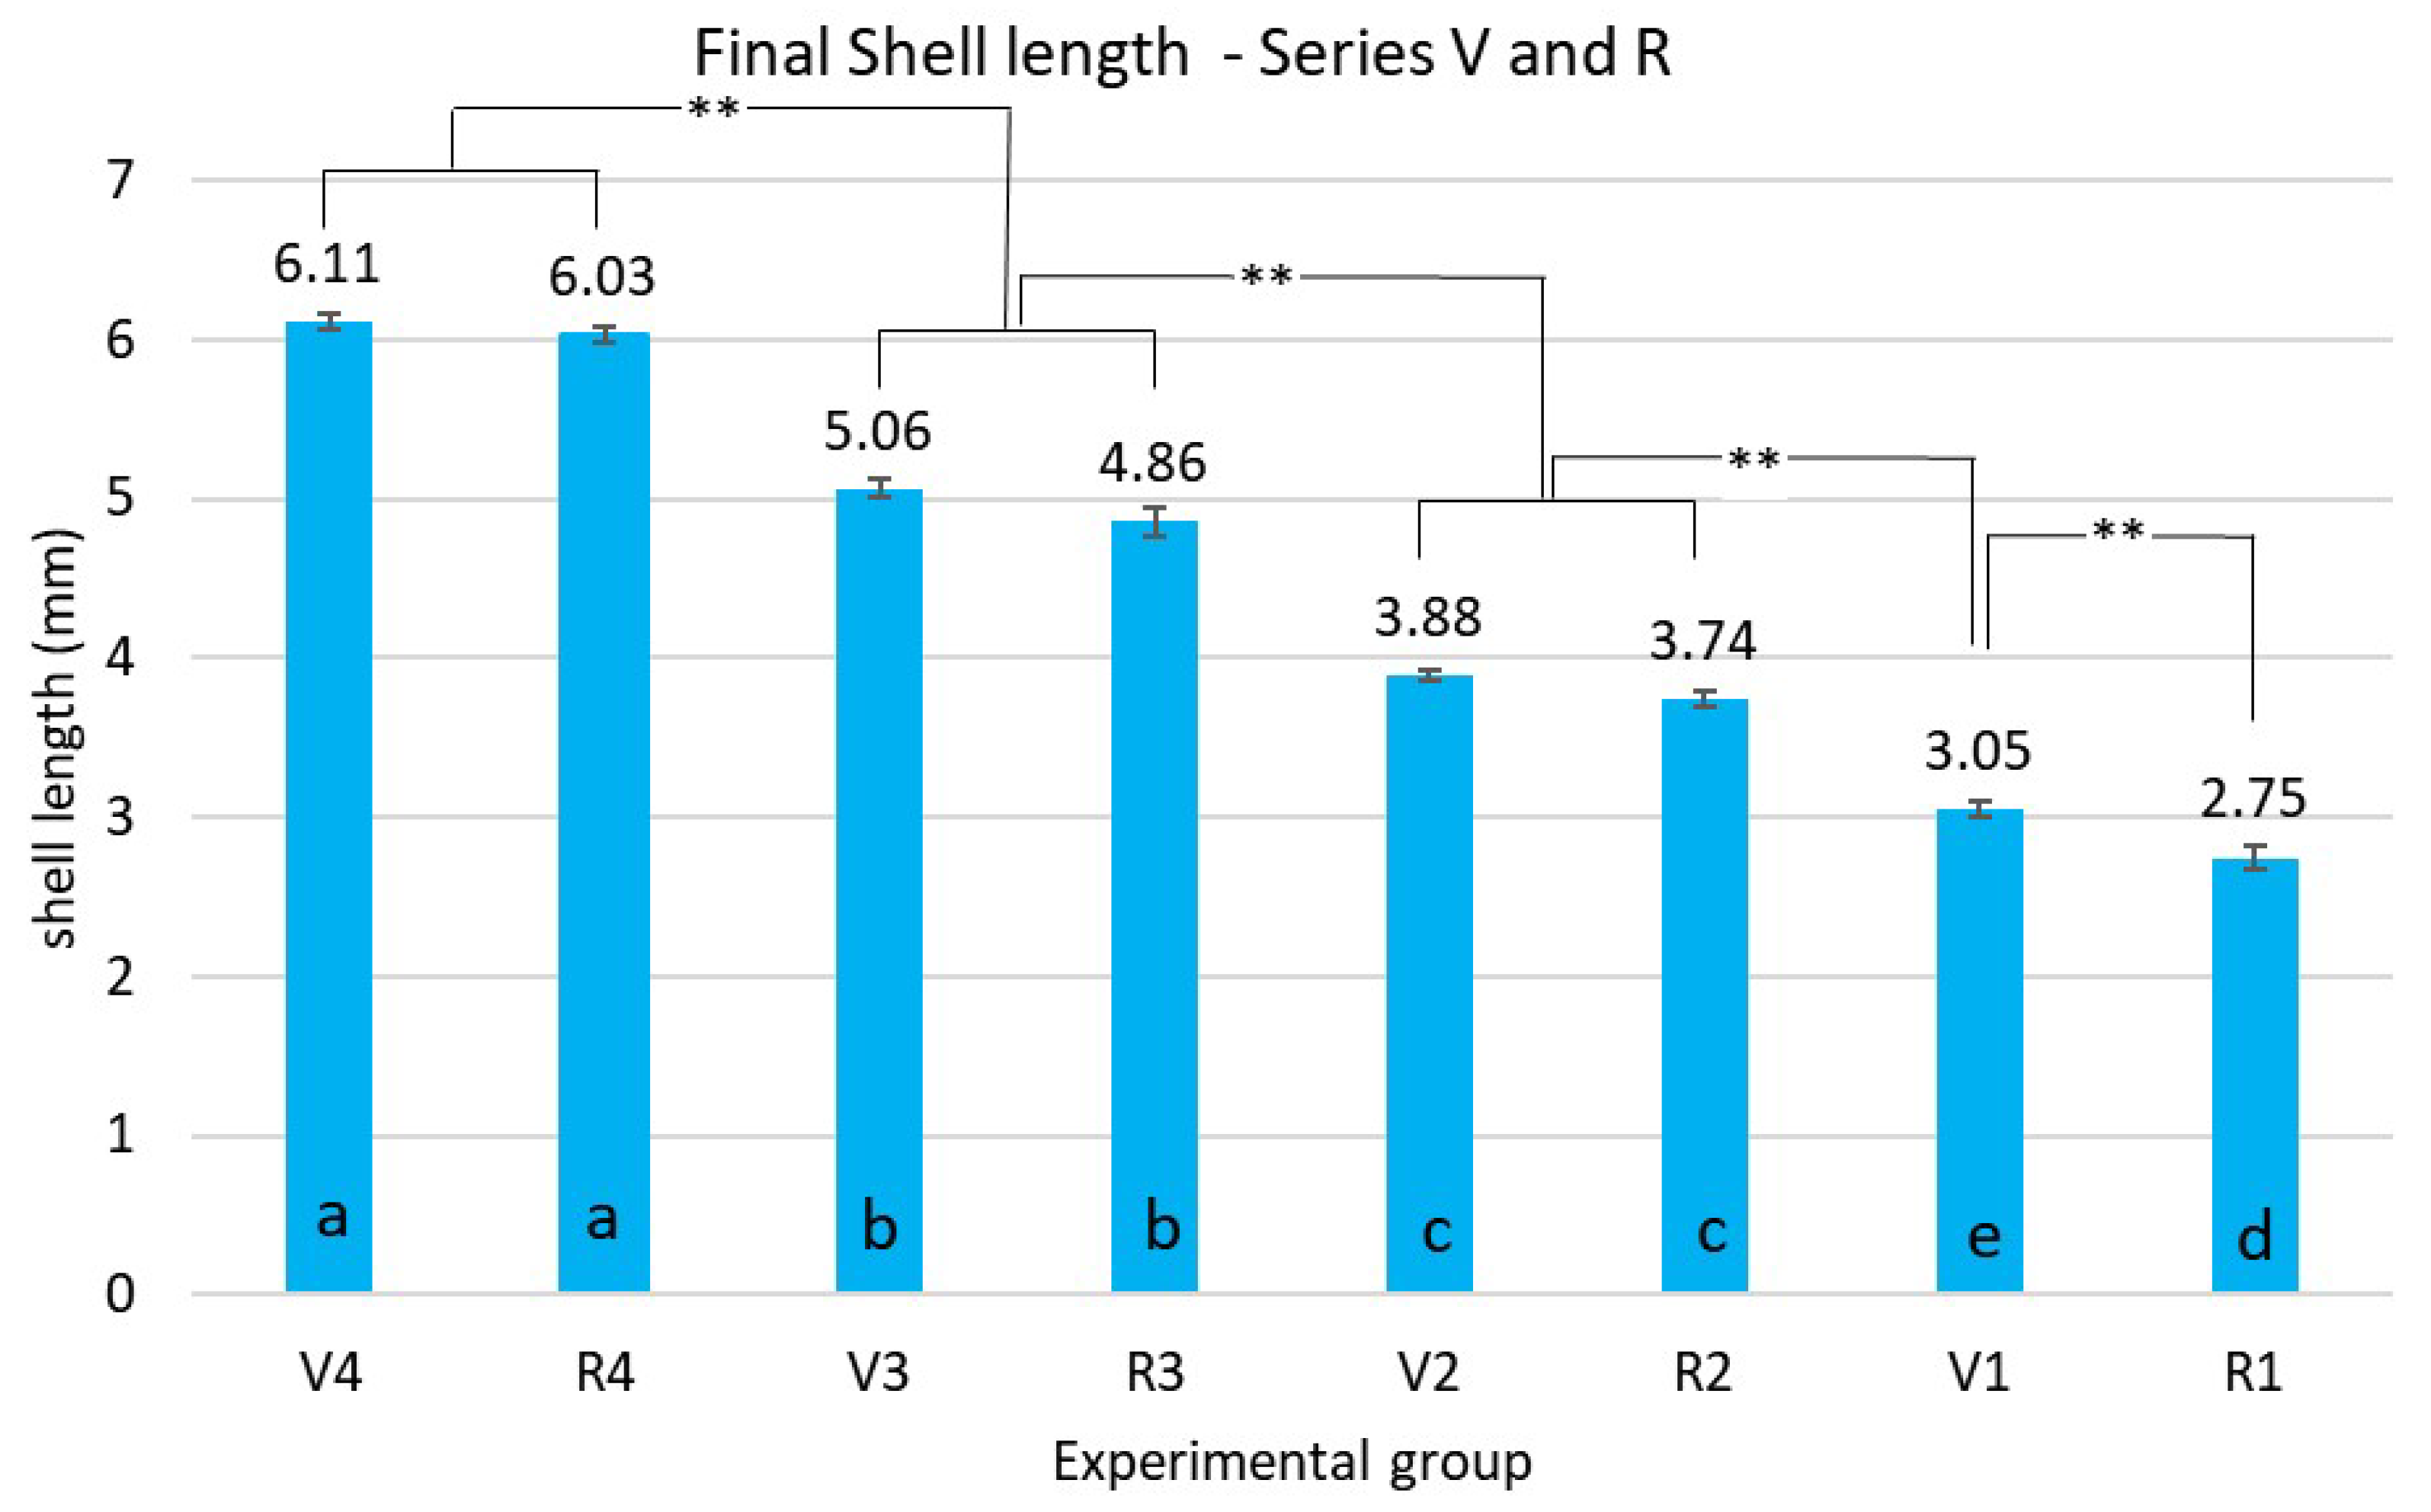
Figure 7 shows the final mean total shell length of the experimental groups, with the results of the statistical analysis. All replicate groups were statistically homogeneous, with the exception of groups V1 and R1, which differed significantly. It is noteworthy that, while statistical analysis of mean weights showed differences between the head replicates (V4/R4), analysis of total shell length revealed significant differences in the tail replicates (V1/R1). This discrepancy may be explained by variations in the weight-to-length relationship developing during growth.

3.3. Growth Performance of the Clams in the Flat-Bottom Tanks

Clams belonging to these experimental groups were reared without grading interventions; therefore, total biomass was measured only at stocking and at harvest. A single intermediate measurement was performed on day 16 of culture, when the thickness of the sand layer on the bottom of tanks G3 and G4 was reduced (cf. Section 2.2). On that occasion, stocking conditions (density and water exchange rate per gram of biomass) were also estimated. Mean sample weights recorded throughout the trial and the data related to stocking conditions are reported in detail in Table A2 (Appendix A), while a summary of these results is presented in Table 3.
It should be noted that harvest data were obtained after final grading, where the population was divided into tails, intermediates, and heads, in order to obtain a more reliable estimate of mean individual weight and number of individuals (Table 4). This procedure also allowed the estimation of size-class distribution within the populations of the different experimental groups, enabling an approximate comparison with the size structure observed in the upwelling-reared groups. The growth achieved by the different experimental batches did not reveal a clear effect attributable to the presence of sand on the bottom of tanks. The permutation-based Student’s t-test comparing mean individual weight (based on three samples per group, prior to final grading) between groups reared without sand (G1 + G2) and those reared in the presence of sand (G3 + G4) did not reveal significant differences (p = 0.50).
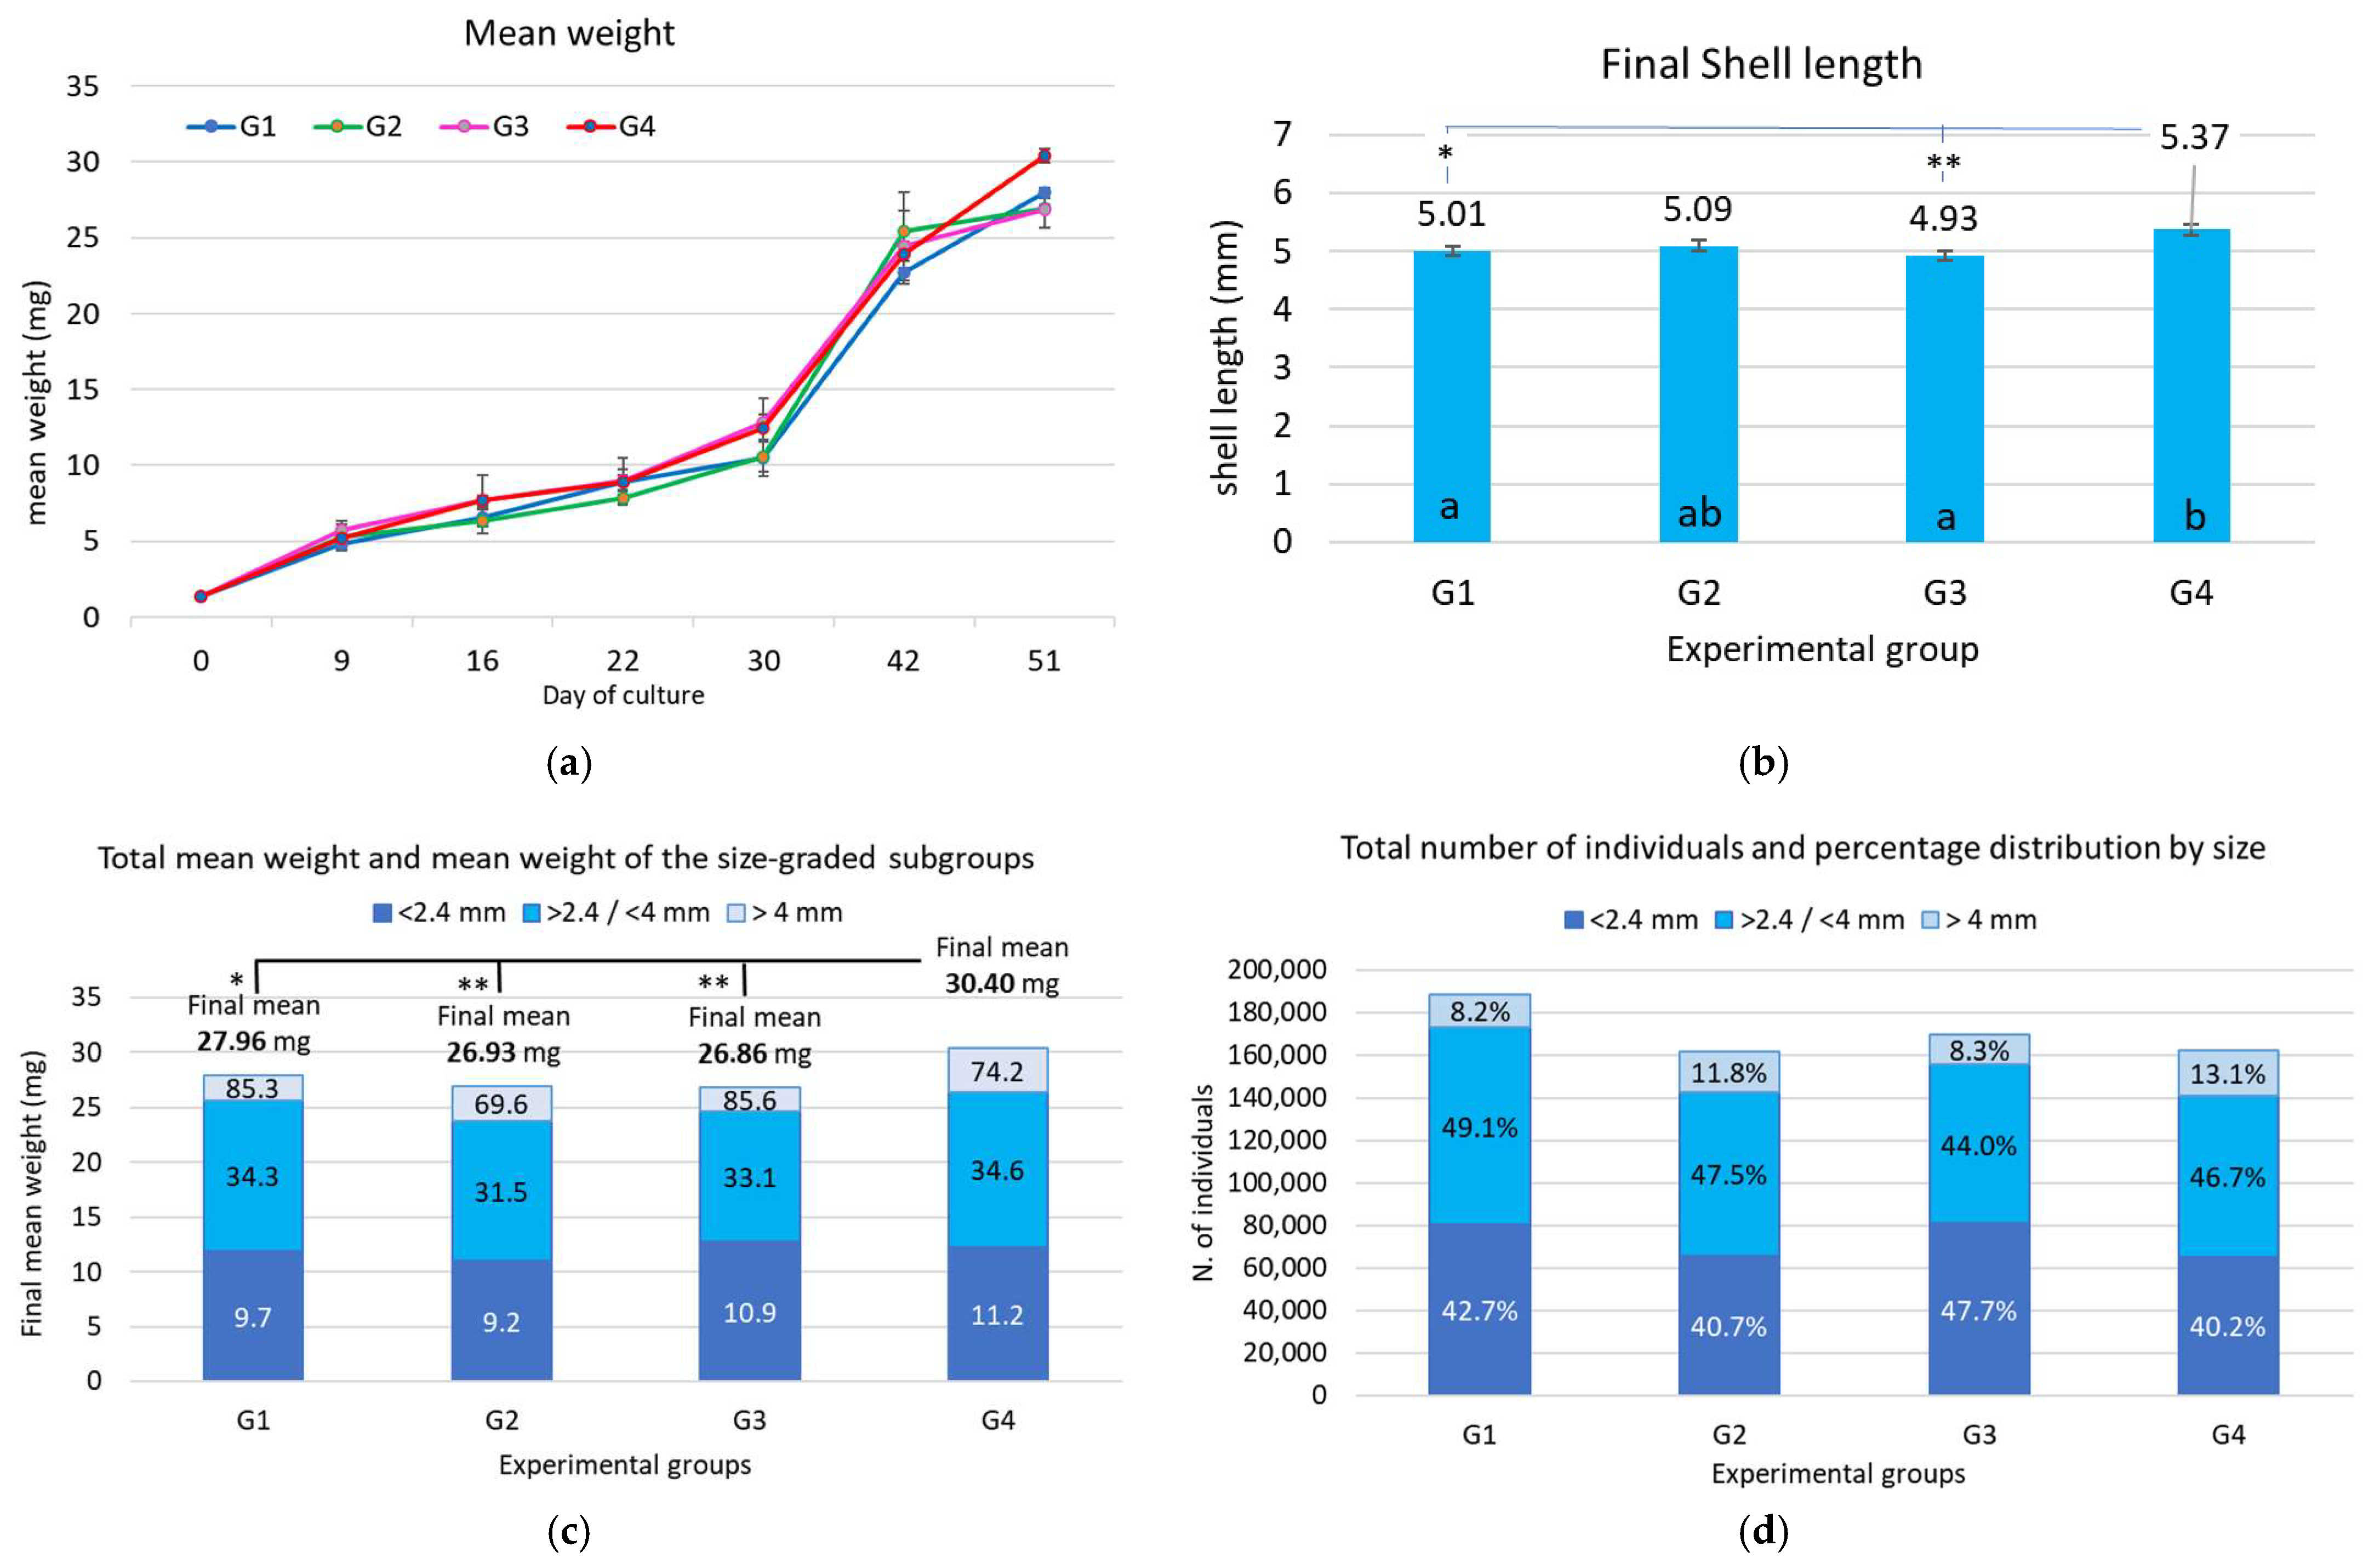
Overall, the groups reached mean individual weights ranging from 26.8 to 30.4 mg, supported by an average SGR of about 5.9–6.1%/day (Table 3 and Table 4, Figure 8a).
The growth curves (Figure 8a) show a marked increase in mean individual weight after day 30, with a slope comparable to that observed in the head and intermediate-head groups of the upwelling system. Only group G4 exhibited a significantly higher mean weight, while no statistically significant differences were detected among the remaining groups (Figure 8c). The mean shell length shown in Figure 8b was relatively similar among the G groups, ranging from 4.9 to 5.4 mm, values comparable to those of the intermediate-head groups in the upwelling system (cf. Figure 7).
Mean individual weight achieved in the flat-bottom tanks was approximately 40–60% higher than that recorded in the upwelling system, depending on the G-group, while mean SGR was about 15% higher. However, mortality was also higher, averaging 26%, with the lowest losses in G1 (18.3%) and the highest in G2 (29.9%). Consistent with mean weight results, no statistically significant differences in shell length were detected among groups G1–G3 (Figure 8b), whereas group G4 exhibited a significantly larger shell length than G1 (p < 0.05) and G3 (p < 0.01). The subgroups obtained through size grading (Figure 8c) are not directly comparable with those derived from the upwelling system; nevertheless, they indicate the presence of a small fraction of the population (approximately 8–13%) reaching very large individual weights (70–85 mg). This fraction was followed by two larger components (intermediate and tail fractions) characterized by mean individual weights clearly higher than those of the approximatively corresponding intermediate and tail fractions obtained under upwelling conditions.

3.4. Comparative Analysis of Shell Length Distributions in Pooled Clam Groups Reared in Upwelling Series Versus Flat-Bottom Tanks

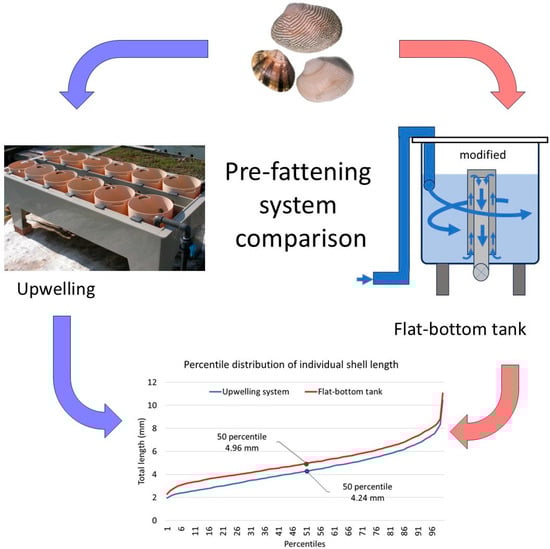
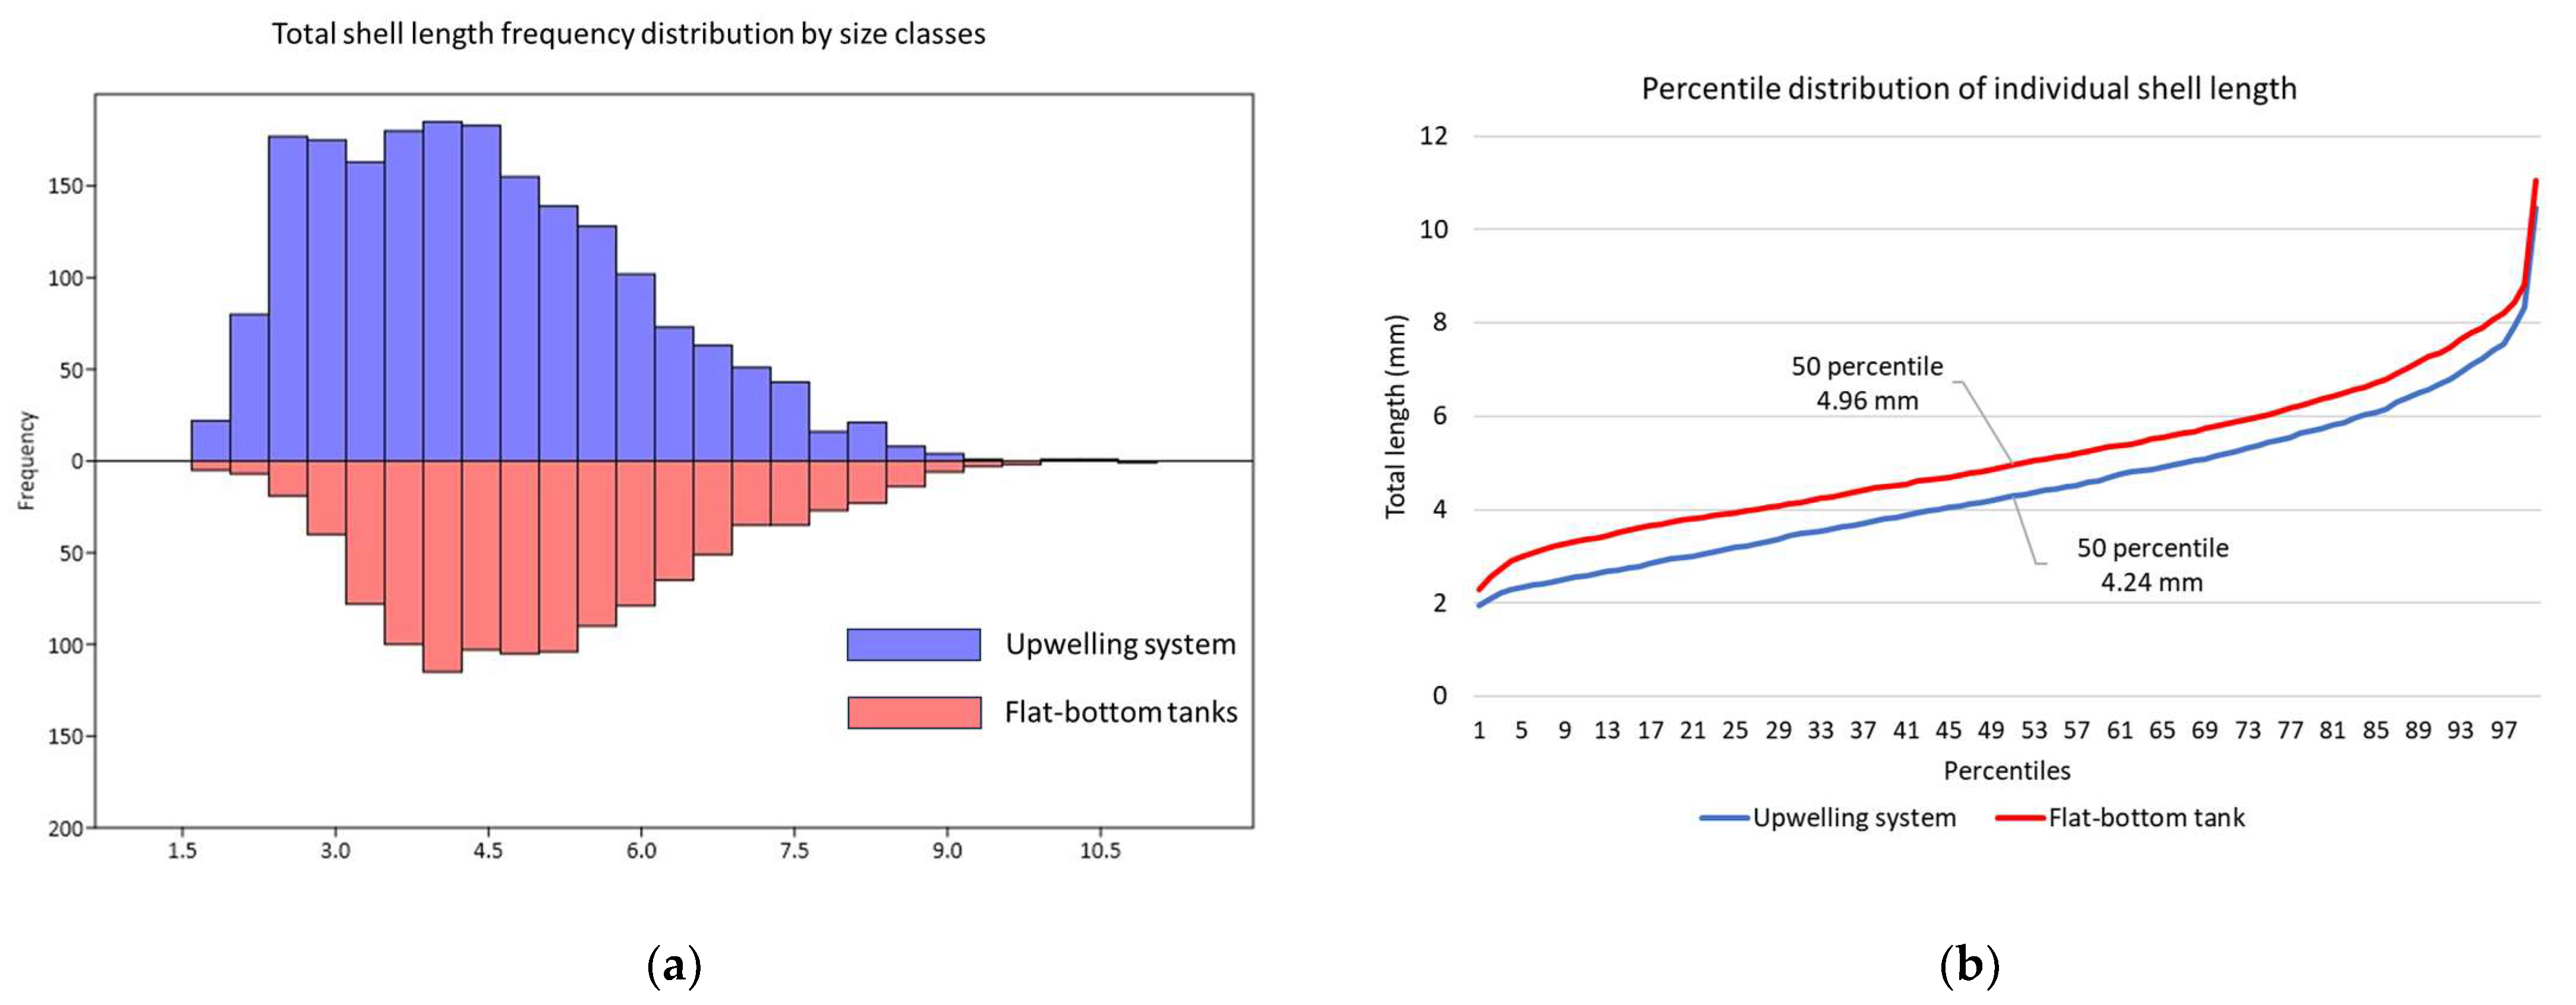
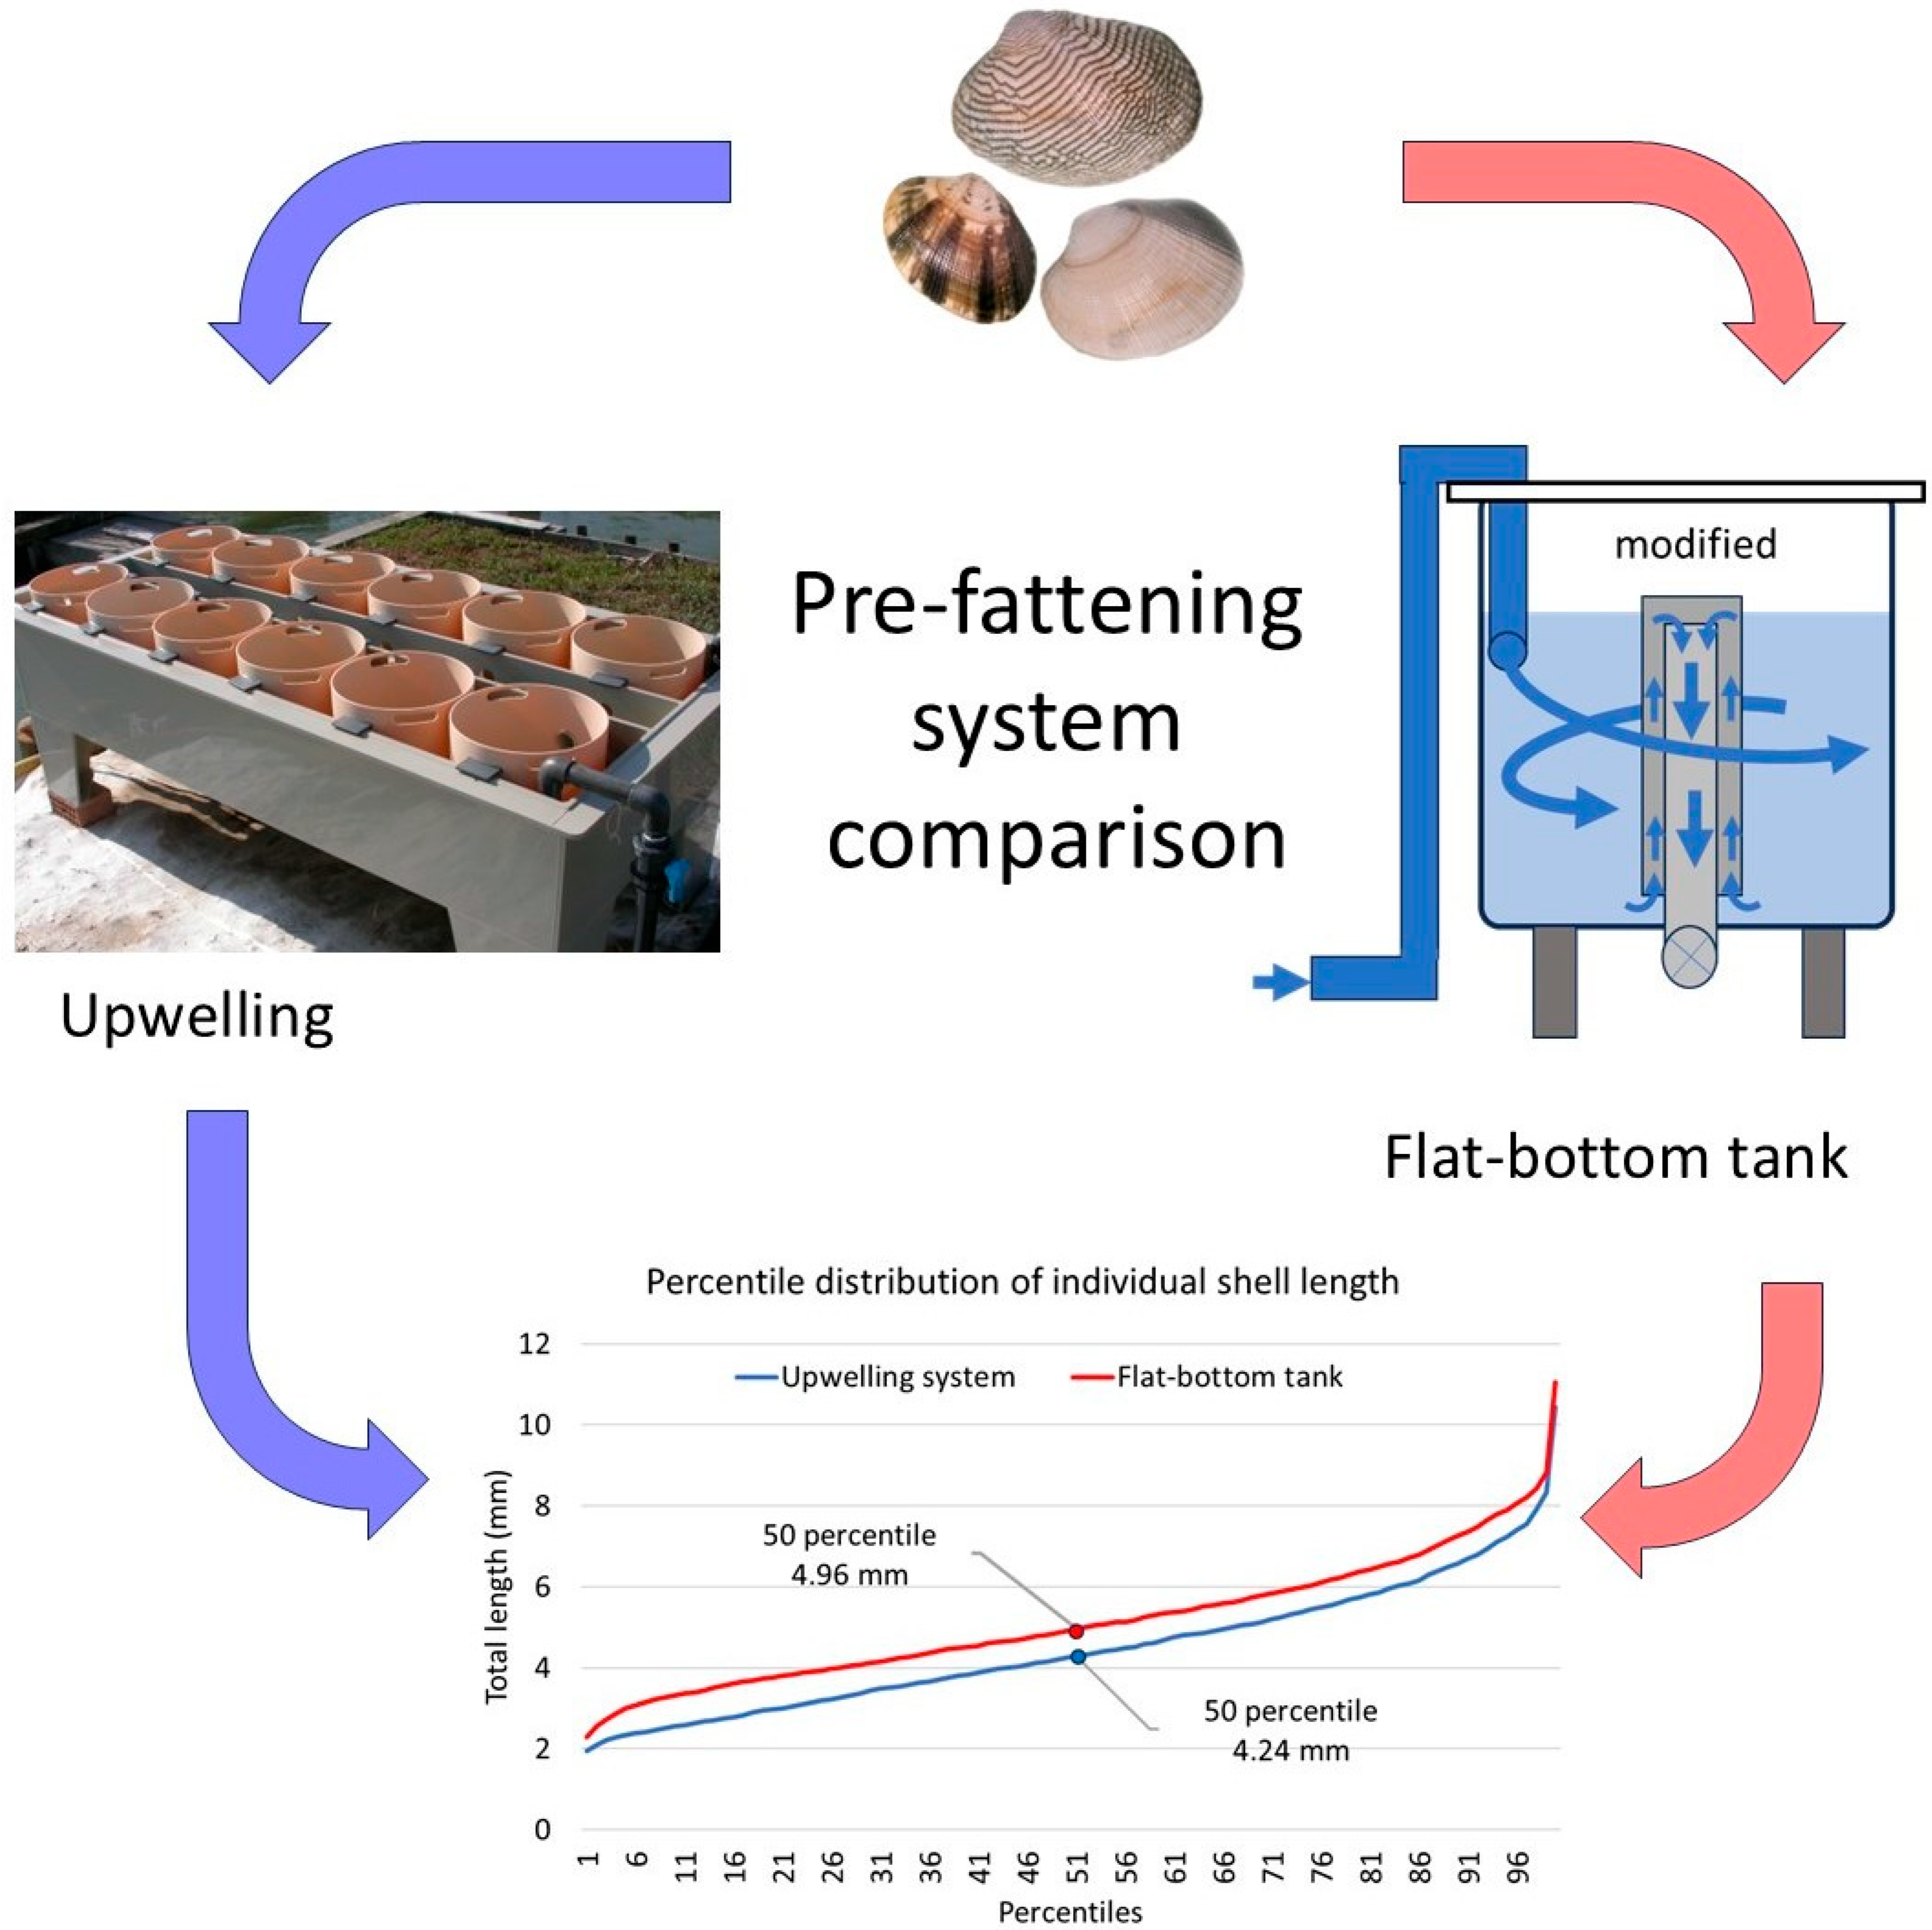
Individual total shell length distributions for the two rearing systems were analyzed by pooling all samples from the experimental groups within each series. The results shown in Figure 9 indicate that, compared with upwelling-reared clams, the population structure of clams reared in flat-bottom tanks was characterized by a greater mean size and a size distribution less skewed toward smaller size classes (Figure 9a). This indicates a more balanced representation of intermediate and larger individuals. Accordingly, the population reared in flat-bottom tanks shows a lower relative incidence of tails and intermediate-tails.
In Figure 9b, the percentile curves of individual shell length further confirm that the superior growth performance achieved in the flat-bottom system is distributed across the entire size range. The divergence between the two systems is particularly evident in the first quartile, corresponding to the smaller size classes, although the curves tend to converge within the lowest 3–4 percentiles.

4. Discussion

The results obtained are characterized by a high degree of consistency in growth and survival performance between replicates, both within the upwelling system and within the flat-bottom tank series. Manila clam juveniles exhibit an optimal temperature range of 20–25 °C, within which the mean temperature during the first 23 days of culture fell; however, they are capable of limited growth even at temperatures as low as 6 °C, provided food is available [32,33]. Based on laboratory experiments, it can be estimated that at 10 °C Manila clams still achieve a growth rate of approximately 20% of the maximum observed at 25 °C [34]. The thermal regime during the trial can therefore be considered favorable for the growth of the cultured bivalves [31,35].
Even if salinity briefly dropped to ~20 ppt at the beginning of October, it remained well above the 14–15 ppt threshold required to maintain full survival and normal metabolism [36,37,38]. Importantly, salinity stayed within the optimal 25–28 ppt range for most of the study period [31]. Finally, dissolved oxygen remained consistently above 3 mg/L, which can be considered a safety threshold for the well-being of these animals [39,40].
It should be emphasized that phytoplankton availability remained optimal throughout the entire rearing period (daily mean Chl-a range 3.8–24.2 μg/L) and, under the tested culture conditions, is unlikely to have represented a limiting factor.
Nakamura [41] conducted laboratory experiments showing that the minimum food ration for the basal metabolism, expressed as Chl-a, required by an individual with a soft-tissue dry weight of 12 mg, is approximately 4.3 μg/day. Considering the associated clearance rate for an individual of this size (i.e., about 4.8 L/day), this corresponds to a minimum Chl-a concentration of roughly 1 μg/L [41]. This value is consistent with estimates reported by Hadley and Manzi [24] from nursery experiments on Mercenaria mercenaria spat reared in raceway systems. Based on estimates derived from previous studies (Zanella and Palazzi, unpublished data), Manila clam spat in the size range of 12–30 mg exhibits a soft-tissue dry weight, calculated as ash-free dry weight, corresponding to approximately 5% of total wet weight. Accordingly, the minimum ration reported by Nakamura [41] can be approximated to about 18 μg Chl-a/day per gram of wet biomass. In the present study, the minimum water renewal rate adopted in the management protocol was 15 mL/min/g of biomass. Under these conditions, meeting the estimated minimum ration of 18 μg Chl-a/day would require a Chl-a concentration of approximately 0.85 μg/L (assuming that all phytoplankton is retained by the clams), a value consistent with the calculation derived from the cited authors. Moreover, in agreement with these observations, Zanella et al. [1] previously reported that a Chl-a concentration of 1 μg/L is sufficient not only to maintain the reared biomass, but also to sustain a high growth performance, provided that the water exchange rate exceeds 15 mL/min/g of biomass, i.e., the lower reference limit adopted in the present study.
Since Chl-a concentrations during this trial consistently exceeded this minimum by at least a factor of three, and on average were about 9–10 times higher, it is reasonable to assume that food availability did not represent a limiting factor for growth. This conclusion is further supported by the consideration that, unlike the experimental conditions adopted by Nakamura [41], which were based on a monospecific Chaetoceros diet, under natural feeding conditions clams are able to efficiently exploit seston components other than phytoplankton. These additional food sources, particularly bacterioplankton, are not reflected by Chl-a concentrations and are abundant in the waters of northern Adriatic lagoons, likely contributing to growth [30,42,43].
For the upwelling trial, culture conditions were set based on previous experiments conducted in 2022–2023, in which a maximum mean SGR of about 5%/day was achieved without grading [1]. A comparable growth performance was confirmed in the present study, where periodic grading was applied, yielding a pooled mean SGR of 5.2%/day across size-selected sub-batches. This finding suggests that, although grading allows optimization of stocking conditions, it does not substantially affect overall growth performance, provided that an appropriate balance between stocked biomass and water exchange rate is maintained. This has several interpretative implications for the adaptation of clams to culture conditions. In the previous work, it was hypothesized that the reduced growth observed in smaller clams within ungraded biomass might have resulted from competitive disadvantage relative to larger individuals. This effect was attributed primarily to the formation of byssal networks, in which smaller clams could become trapped within the interstitial spaces created by larger ones, thereby experiencing reduced exposure to the water flow. The growth results obtained in the present study appear to contradict this hypothesis. Even after grading (i.e., after day 30), the growth curves of the tail fractions (Figure 5) remained characterized by low growth rates, despite being exposed to more favorable water flow conditions (mL/min per gram of biomass) than those experienced by the head and intermediate-head fractions (cf. Table A1).
Direct comparison with the available literature is limited by the scarcity of published early pre-fattening data. Bordignon et al. [12] investigated density effects on Manila clam growth in the same lagoon, but differences in experimental system (net lanterns) and initial seed size (~40 mg) prevent direct quantitative comparison with the present study. An interesting three-week laboratory study on spats of approximately 5 mg showed that increasing feeding rations, based on pure cultures of Chaetoceros neogracile, resulted in SGR values ranging up to 6–10%/day under the best-performing conditions [44]. However, the experiments were conducted at small scale, under controlled laboratory conditions, at a constant temperature of 21 °C, and with monospecific and nutritionally optimal phytoplankton diets. Jara-Jara et al. [45] reported a pre-fattening trial in which clam mean individual weight increased from 28.3 mg to 162.5 mg over a 45-day period, at an initial stocking density of 2 kg/m2, using suspended trays supplied with effluents from a turbot farming facility. Based on these data, the corresponding specific growth rate can be estimated at approximately 3.9%/day. However, field studies focused on commercially relevant culture systems and specifically addressing the early pre-fattening phase, representing the critical transition from hatchery to lagoon-based pre-fattening and grow-out systems, are still largely lacking.
The mean SGR observed in the present study represents a weighted outcome resulting from the markedly different growth performances among the size fractions, with tails growing at approximately 3%/day and heads at about 7%/day. An overall mean SGR of around 5%/day can be considered satisfactory when compared with the experience reported by commercial producers. However, it should be noted that under commercial conditions the tail fraction is typically removed during the pre-fattening cycle; consequently, the final average SGR would be expected to increase, albeit at the expense of a lower overall final survival. Accordingly, when the tail fraction is excluded, the SGR estimated in the present trial carried out in an upwelling system would increase to approximately 5.5–5.6%/day.
The trial conducted in flat-bottom tanks yielded overall positive results when compared with those obtained using the upwelling system. This rearing approach undoubtedly entailed a lower degree of control over the cultured material, as reflected by the lower mean survival (26% in G series versus 17.6% in V/R series). However, final growth performance was superior, and labor requirements were substantially reduced. It should be emphasized that the stocking density applied in this trial (~30 ind./cm2), although markedly lower than that used during the initial upwelling phase, remains well above that typically used in commercial raceway systems, where seed is commonly stocked at approximately 10 ind./cm2 [23].
Weighted mean final individual weight (~28 mg) was about 48% higher than that recorded in the upwelling system (~19 mg). This outcome is not trivial, although the lower stocking density might suggest an obvious advantage. Indeed, under conditions of phytoplankton abundance, as in the present study, the greater food availability associated with lower density may not represent a critical factor. Conversely, the upwelling system ensures improved cleaning conditions and optimizes exposure of clams to the renewal water, as the entire water volume is forced to pass through the cultured biomass rather than interacting with it through laminar and tangential flow. Moreover, in flat-bottom tanks, clams tended over time to move and form small aggregates bound by byssal threads, despite being evenly distributed at seeding. This behavior negatively affects the effective contact between individual clams and the renewal water, potentially offsetting the benefits of lower stocking density. In this context, the presence of sand on the tank bottom was expected to significantly influence this aggregative behavior and to exert a positive effect on growth performance. This expectation was not clearly supported by the growth data, although it should be noted that the highest growth values were observed in group G4, which had sand on the bottom. Therefore, the apparent lack of a substrate effect warrants further investigation. Indeed, during the early phase of the trial, it became evident that the initial sand layer was excessively thick and that insufficient bioturbation prevented oxygenation of the deeper layers, leading to the formation of anoxic zones that likely altered stocking conditions. This issue was addressed on day 16 by reducing sand thickness. Interestingly, the tendency of clams to aggregate and bind via byssal threads was also observed in the presence of sand, albeit to a lesser extent. However, the lack of any clear advantage from the presence of a sand layer on the tank bottom was also reported by Acquafredda et al. [46] during a nursery trial on Atlantic surfclams (Spisula solidissima) conducted in raceway systems.
One potentially relevant aspect is that clams reared on sand appeared markedly cleaner, lacking the microfouling film that covered the shells of individuals cultured in the upwelling module.

Operational Cost-Efficiency of Pre-Fattening Systems

Table 5 provides a summary comparison of the estimated production costs associated with the two pre-fattening systems tested, expressed per thousand clams harvested to ensure comparability. Calculations refer to standard operating management, reported as 7 days a week, and are limited to electricity consumed, manpower required, and seed costs, excluding experimental activities. Energy consumption was estimated based on the actual performance of the 1.5 kW submersible pump used during the experimental trial, which delivered a flow rate of 22.5 m3/h. Labor requirements were quantified by accounting for routine environmental monitoring, experimental system management, and grading operations. Labor input was estimated as follows:
  • 15 min for the daily water quality monitoring and general system checks (e.g., flow rate adjustments), applied equally to both culture systems;
  • 5 min for the daily cleaning of each upweller, including system draining and subsequent refilling;
  • 30 min for each grading operation (four for series V and four for series R; a final selection for each of the four G-tank).
Overall, the flat-bottom tank system (series G) required approximately 33% higher electrical energy consumption than the upwelling system, due to the larger volume of water exchanged per 1000 clams produced. However, this increase was largely offset by a substantial reduction in labor demand, which was estimated to be 78.5% lower than that required for the upwelling module. Seeding costs in the flat-bottom tanks represent an additional relevant cost component, as they are negatively affected by the higher mortality observed under this rearing system. The overall economic balance is strongly dependent on the geographical and operational context, as the relative weight of individual cost components may vary substantially. In the present case, the use of flat-bottom tanks resulted in an estimated saving of 0.15 EUR per 1000 individuals. From a strictly economic perspective, therefore, the less intensive flat-bottom system appears more cost-efficient for pre-fattening operations. Nevertheless, this advantage must be weighed against the greater level of biological control offered by the upwelling system, which entails lower risks of losses due to adverse events, as well as its reduced spatial footprint, both of which may represent critical factors under specific production or management constraints.

5. Conclusions

The trial in flat-bottom tanks showed that this system is a viable alternative to upwelling systems for early clam pre-fattening. Although survival was lower and energy use somewhat higher, it offered notable labor savings and larger average clam size. While the choice of system depends on farm management and local conditions, these results can guide informed decisions. A practical approach could involve a short initial upwelling phase (~10 days) to control spat at ~200 ind./cm2, followed by transfer to flat-bottom tanks for further growth. The technical recommendations for flat-bottom tank management, which warrant further experimental confirmation, include:
  • Tank shape: Circular tanks promote more uniform rearing conditions than rectangular raceways, reducing spatial variability in feeding.
  • Water flow: Tangential surface inflow combined with forced bottom-layer outflow enhances water distribution, promotes contact with clams, and mitigates passive aggregation.
  • Seeding: Following seeding, tanks should remain static for 1–2 h before circulation is resumed to allow clams to attach via byssus at their point of settlement, thereby preventing seed displacement, aggregation, and uneven spatial distribution.
  • Water flow rate: Gradually increasing recirculation (50 L/min until day 15, 70 L/min until day 30, and 85 L/min thereafter) may maintain growth rate while save energy.
The results obtained with the flat-bottom tank system should be confirmed by further trials, in which it would be important to reverify the potential effect of the sandy substrate, optimize stocking density, and assess the possibility of reducing water exchange without significantly affecting growth performance.

Author Contributions

Conceptualization, methodology and validation, L.Z. and R.P.; investigation, L.Z., G.R., M.M. (Marco Morin), M.M. (Matteo Martellato) and E.R.; resources, E.R.; data curation, L.Z. and G.R.; writing—original draft preparation, L.Z.; writing—review and editing, L.Z. and R.P.; supervision, R.P.; project administration, R.P. All authors have read and agreed to the published version of the manuscript.

Funding

The research project was funded by Veneto Agricoltura through internal institutional resources. The equipment used in the study was owned by Veneto Agricoltura but installed at the facility of the Consorzio Cooperative Pescatori del Polesine O.P. S.C.Ar.L, which also provided access to a fully equipped laboratory.

Institutional Review Board Statement

The present study was conducted within a commercial aquaculture facility and involved standard rearing practices applied to an invertebrate species (Ruditapes philippinarum). No experimental manipulations affecting animal physiology or procedures likely to cause harm or distress were involved. According to Directive 2010/63/EU, ethical approval is required for experimental procedures involving vertebrate animals and cephalopods; however, this regulation does not apply to bivalve molluscs. Therefore, no formal ethical approval was required for the present study. All activities were carried out in accordance with applicable national and EU regulations and standard aquaculture practices.

Data Availability Statement

The original contributions presented in this study are included in the article. Further inquiries can be directed to the corresponding authors.

Acknowledgments

The authors wish to thank Antonio Mancin and Gianni Salvagno (Centro Ittico Sperimentale Bonello, Veneto Agricoltura) for their indispensable contribution to the technical management of the clam farming facility during these trials. Our gratitude is also extended to the three anonymous reviewers, whose comments substantially improved the quality of the manuscript.

Conflicts of Interest

The authors declare no conflicts of interest. Veneto Agricoltura is an operational agency of the Veneto Region dedicated to applied research and innovation to enhance competitiveness and sustainability in the agricultural, agri-food, forestry, and fisheries sectors. Lorenzo Zanella is a freelance biologist engaged to manage these experimental trials. Emanuele Rossetti is a biologist employed by Consorzio Cooperative Pescatori del Polesine O.P. S.C. a r.l., a cooperative engaged in the production and commercialization of molluscs.

Appendix A

Table A1. Biometric data of series V and R during the rearing period. Upwellers were progressively occupied through successive grading of the initial groups; densities refer to post-grading values (cf. Figure 3 and Figure 4).
Experimental Subset (Upweller)V1V2V3V4R1R2R3R4
Date (day 0)08-Sep. 08-Sep.
Mean weight (mg)1.34 1.34
Total biomass (g)345 345
N. ind.258,119 258,119
Density (N./cm2)216 216
Water flow (mL/min/g)75.4 75.4
Date (day 9)17-Sep.17-Sep. 17-Sep.17-Sep.
Mean weight (mg)2.84.7 2.95.2
Total biomass (g)336517 336599
N. ind.118,557109,110 117,396114,718
Density (N./cm2)9992 9896
Water flow (mL/min/g) pre-grad.30.5empty 27.8empty
Water flow (mL/min/g) post-grad.77.350.3 77.343.4
Date (day 22)30-Sep.30-Sep. 30-Sep. 30-Sep.30-Sep. 30-Sep.
Mean weight (mg)2.85.2 9.43.05.3 10.3
Total biomass (g)167732 338141794 409
N. ind.58,995140,827 35,76947,801148,881 39,643
Density (N./cm2)49118 3040125 33
Water flow (mL/min/g) pre-grad.54.934.1 empty56.829.4 empty
Water flow (mL/min/g) post-grad.155.835.5 76.9184.332.8 63.6
Date (day 30)08-Oct.08-Oct.08-Oct.08-Oct.08-Oct.08-Oct.08-Oct.08-Oct.
Mean weight (mg)4.05.99.117.34.55.89.216.5
Total biomass (g)216547388522181829683576
N. ind.54,41193,41042,47630,09740,52797,85850,27434,977
Density (N./cm2)4678362534824229
Water flow (mL/min/g) pre-grad.120.427.8empty49.9143.625.3empty45.1
Water flow (mL/min/g) post-grad.no grad.47.567.0no grad.no grad.46.256.0no grad.
Date (day 42)20-Oct.20-Oct.20-Oct.20-Oct.20-Oct.20-Oct.20-Oct.20-Oct.
Mean weight (mg)5.911.120.434.55.610.921.734.9
Total biomass (g) (estimated)31910398671040227106310931221
N. ind. (estimated)54,41193,41042,47630,09740,52797,85850,27434,977
Density (N./cm2) (estimated)4678362534824229
Water flow (mL/min/g) pre-grad.81.525.030.025.0114.324.523.821.3
Water flow (mL/min/g) post-grad.no grad.no grad.no grad.no grad.no grad.no grad.no grad.no grad.
Date (day 51)29-Oct.29-Oct.29-Oct.29-Oct.29-Oct.29-Oct.29-Oct.29-Oct.
Mean weight (mg)6.612.327.249.26.212.124.443.1
Total biomass (g)329108710811510274106811801555
N. ind.50,11688,05939,78530,69044,46388,14948,30336,052
Density (N./cm2)4274332637744030
Final water flow (mL/min/g)79.023.924.017.294.924.322.016.7
Table A2. Biometric data and stocking conditions of the experimental batches of series G. Density and water exchange rate per gram of biomass were calculated only when total biomass in culture was measured, namely at stocking, at harvest, and on 24 September, when the sand layer at the bottom of tanks G3 and G4 was reduced from 4 to 2 cm in thickness.
Date08-Sep.17-Sep.24-Sep.03-Oct.08-Oct.20-Oct.29-Oct.
with no sand substrateGroup G1
Mean weight (mg)1.344.796.078.9010.4921.9027.96
N. ind.230,436 199,418 188,284
Total biomass (g)308 1211 5265
Density (N/cm2)29.7 25.7 24.3
Flow rate (mL/min/g)276.0 70.2 16.1
Group G2
Mean weight (mg)1.345.306.317.8210.5223.5926.93
N. ind.230,436 156,006 161,565
Total biomass (g)308 985 4351
Density (N/cm2)29.7 20.1 20.8
Flow rate (mL/min/g)276.0 86.3 19.5
with sand substrateGroup G3
Mean weight (mg)1.345.726.558.9912.8322.3026.86
N. ind.230,436 195,838 169,627
Total biomass (g)308 1282 4557
Density (N/cm2)29.7 25.3 21.9
Flow rate (mL/min/g)276.0 66.3 18.7
Group G4
Mean weight (mg)1.344.797.618.8812.4723.2330.40
N. ind.230,436 192,220 162,246
Total biomass (g)308 1474 4933
Density (N/cm2)29.7 24.8 20.9
Flow rate (mL/min/g)276.0 57.7 17.2

References

  1. Zanella, L.; Pastres, R.; Freguglia, M.; Stoppa, S.; Palazzi, R. Effects of Water Flow Rate and Stocking Density on the Early Pre-Fattening of Manila Clams (Ruditapes philippinarum) Farmed in a North Adriatic “Valle Da Pesca” (Italy). Aquac. Int. 2025, 33, 161. [Google Scholar] [CrossRef] [Scilit]
  2. Turolla, E. La Venericoltura in Italia. In Estado Actual del Cultivo y Manejo de Moluscos Bivalvos y su Proyección Futura. Factores que Afectan su Sustentabilidad en América Latina; FAO Actas de Pesca y Acuicultura; FAO: Rome, Italy, 2008; pp. 177–188. [Google Scholar]
  3. Chiesa, S.; Petochi, T.; Brusà, R.B.; Raicevich, S.; Cacciatore, F.; Franceschini, G.; Antonini, C.; Vallini, C.; Bernarello, V.; Oselladore, F.; et al. Impacts of the Blue Crab Invasion on Manila Clam Aquaculture in Po Delta Coastal Lagoons (Northern Adriatic Sea, Italy). Estuar. Coast. Shelf Sci. 2025, 312, 109037. [Google Scholar] [CrossRef] [Scilit]
  4. Boschiero, M.; Facca, C.; Cavraro, F.; Tonolli, M.; Malavasi, S.; Franzoi, P. Feeding Strategies of the Invasive Blue Crab (Callinectes sapidus) on Manila Clam (Ruditapes philippinarum): Implications for Aquaculture. Estuar. Coast. Shelf Sci. 2025, 325, 109486. [Google Scholar] [CrossRef] [Scilit]
  5. Martini, A.; Aguiari, L.; Capoccioni, F.; Martinoli, M.; Napolitano, R.; Pirlo, G.; Tonachella, N.; Pulcini, D. Is Manila Clam Farming Environmentally Sustainable? A Life Cycle Assessment (LCA) Approach Applied to an Italian Ruditapes philippinarum Hatchery. Sustainability 2023, 15, 3237. [Google Scholar] [CrossRef] [Scilit]
  6. Boscolo Brusà, R.; Cacciatore, F.; Ponis, E.; Molin, E.; Delaney, E. Clam Culture in the Venice Lagoon: Stock Assessment of Manila Clam (Venerupis philippinarum) Populations at a Nursery Site and Management Proposals to Increase Clam Farming Sustainability. Aquat. Living Resour. 2013, 26, 1–10. [Google Scholar] [CrossRef] [Scilit]
  7. Martini, A.; Napolitano, R.; Capoccioni, F.; Martinoli, M.; Tonachella, N.; Aguiari, L.; Piva, P.; Rossetti, E.; Pulcini, D. Prefacing the Challenge—Assessment of the Environmental Efficiency of Manila Clam (Ruditapes philippinarum) Production Based on Hatchery-Produced and Wild Seed. Aquaculture 2025, 595, 741474. [Google Scholar] [CrossRef] [Scilit]
  8. Coutteau, P.; Sorgeloos, P. The Use of Algal Substitutes and the Requirement for Live Algae in the Hatchery and Nursery Rearing of Bivalve Molluscs: An International Survey. J. Shellfish Res. 1992, 11, 467. [Google Scholar]
  9. De Pauw, N.; Verboven, J.; Claus, C. Large-Scale Microalgae Production for Nursery Rearing of Marine Bivalves. Aquac. Eng. 1983, 2, 27–47. [Google Scholar] [CrossRef] [Scilit]
  10. Sladonja, B.; Bettoso, N.; Zentilin, A.; Tamberlich, F.; Acquavita, A.; Sladonja, B.; Bettoso, N.; Zentilin, A.; Tamberlich, F.; Acquavita, A. Manila Clam (Tapes philippinarum Adams & Reeve, 1852) in the Lagoon of Marano and Grado (Northern Adriatic Sea, Italy): Socio-Economic and Environmental Pathway of a Shell Farm. In Aquaculture and the Environment—A Shared Destiny; IntechOpen: London, UK, 2011. [Google Scholar]
  11. Boscolo Brusà, R.; Ponis, E.; Cacciatore, F. Dalla Pesca All’allevamento della Vongola Filippina in Laguna di Venezia: “il Preingrasso”; Quaderni—Ricerca Marina; ISPRA: Rome, Italy, 2011; p. 79. [Google Scholar]
  12. Bordignon, F.; Trocino, A.; Rossetti, E.; Zomeño, C.; Pascual, A.; Birolo, M.; Llorens, S.M.; Xiccato, G. Effect of Stocking Density on Growth and Survival of Juvenile Manila Clams (Ruditapes philippinarum) Farmed in Suspended Lanterns in a North Italian Lagoon. Aquac. Rep. 2021, 20, 100719. [Google Scholar] [CrossRef] [Scilit]
  13. Jones, G.G.; Sanford, C.L.; Jones, B.L. Manila Clams: Hatchery and Nursery Methods; Min. of Agriculture and Fisheries: Hong Kong, China, 1993. [Google Scholar]
  14. Hadley, N.H.; Whetstone, J.M. Hard Clam Hatchery and Nursery Production; SRAC Publication; Southern Regional Aquaculture Center: Stoneville, MS, USA, 2007; p. 8. [Google Scholar]
  15. Claus, C. Trends in Nursery Rearing of Bivalve Molluscs. In Nursery Culturing of Bivalve Molluscs; Claus, C., De Pauw, N., Jaspers, E., Eds.; EMS Special Publication; European Mariculture Society: Bredene, Belgium, 1981; pp. 1–33. [Google Scholar]
  16. Magnesen, T.; Christophersen, G. Large-scale Raceway Nursery for Improved Scallop (Pecten maximus) Spat Production. Aquac. Eng. 2007, 36, 149–158. [Google Scholar] [CrossRef] [Scilit]
  17. Martini, A.; De Iorio, T.; Ferrarese, L.; Landri, P.; Martinoli, M.; Napolitano, R.; Ortu, F.; Pulcini, D. Mama’s Clams: Environmental Performance of an Extended Nursery Phase for Manila Clams—Sand-Nurseries as a Potential Strategy to Address Juvenile Scarcity. Sustainability 2026, 18, 2229. [Google Scholar] [CrossRef] [Scilit]
  18. Chessa, G.; Serra, S.; Saba, S.; Manca, S.; Chessa, F.; Trentadue, M.; Fois, N. The Floating Upwelling System (FLUPSY) for Breeding of Venerupis decussata (Linnaeus, 1758) Juveniles in a Coastal Lagoon in Sardinia (Italy). Transitional Waters Bull. 2013, 7, 53–61. [Google Scholar]
  19. Palazzi, R. Ottimizzazione del Preingrasso Lagunare della Vongola Verace; Veneto Agricoltura: Padova, Italy, 2015; p. 25. [Google Scholar]
  20. Rivara, G.; Tetrault, K.; Patricio, R.M. A Low Cost Floating Upweller Shellfish Nursery System: Construction and Operations Guide; Cornell Cooperative Extension: Suffolk, NY, USA, 2002; pp. 1–5. [Google Scholar]
  21. Ram, E.; McKay, W.J.G.; Jeffs, A.G.; Skelton, B.M. The Performance of Juvenile GreenshellTM Mussels (Perna canaliculus) of Different Sizes during Floating Upwelling System (FLUPSY) Nursery Culture and after Seeding onto Coastal Farms. Aquaculture 2026, 618, 743791. [Google Scholar] [CrossRef] [Scilit]
  22. Skelton, B.M.; McKay, W.J.G.; Jeffs, A.G. Evaluation of a Floating Upwelling System for Nursery Culture of the GreenshellTM Mussel (Perna canaliculus). Aquac. Res. 2021, 52, 3649–3659. [Google Scholar] [CrossRef] [Scilit]
  23. Bacco, L. Pre-Fattening Modelling of Clam (Ruditapes philippinarum). Master’s Thesis, Università Ca’ Foscari di Venezia, Venezia, Italy, 2024. [Google Scholar]
  24. Hadley, N.H.; Manzi, J.J. Growth of Seed Clams, Mercenaria mercenaria, at Various Densities in a Commercial Scale Nursery System. Aquaculture 1984, 36, 369–378. [Google Scholar] [CrossRef] [Scilit]
  25. ARPAV (Agenzia Regionale per la Prevenzione e Protezione Ambientale del Veneto). Acque di transizione—Boe Delta del Po. Available online: https://www.arpa.veneto.it/dati-ambientali/open-data/idrosfera/acque-di-transizione/acque-di-transizione-boe-delta-del-po (accessed on 5 February 2026).
  26. Martínez-Córdova, L.R.; Enríquez-Ocaña, L.F.; López-Rascón, F.; López-Elías, J.A.; Martínez-Porchas, M. Overwintering the Black Clam Chione fluctifraga in a Tidal Shrimp Pond and in an Estuary, Using Suspended and Bottom Systems. Aquaculture 2013, 396–399, 102–105. [Google Scholar] [CrossRef] [Scilit]
  27. Hammer, O.; Harper, D.A.T.; Ryan, P.D. PAST: Paleontological Statistics Software Package for Education and Data Analysis. Palaeontol. Electron. 2001, 4, 9. [Google Scholar]
  28. García–Nieto, P.J.; García–Gonzalo, E.; Alonso Fernández, J.R.; Díaz Muñiz, C. Forecast of Chlorophyll-a Concentration as an Indicator of Phytoplankton Biomass in El Val Reservoir by Utilizing Various Machine Learning Techniques: A Case Study in Ebro River Basin, Spain. J. Hydrol. 2024, 639, 131639. [Google Scholar] [CrossRef] [Scilit]
  29. Zhang, C.; McIntosh, K.D.; Sienkiewicz, N.; Stelzer, E.A.; Graham, J.L.; Lu, J. qPCR-Based Phytoplankton Abundance and Chlorophyll a: A Multi-Year Study in Twelve Large Freshwater Rivers across the United States. Sci. Total Environ. 2024, 954, 175067. [Google Scholar] [CrossRef] [Scilit]
  30. Rahman, M.A.; Henderson, S.; Miller-Ezzy, P.A.; Li, X.X.; Qin, J.G. Analysis of the Seasonal Impact of Three Marine Bivalves on Seston Particles in Water Column. J. Exp. Mar. Biol. Ecol. 2020, 522, 151251. [Google Scholar] [CrossRef] [Scilit]
  31. Paesanti, F.; Pellizzato, M. Tapes phililippinarum. Manuale Sulla Vongola Verace d’allevamento; Manuale di Divulgazione Serie Acquacoltura; Veneto Agricoltura: Legnaro, Italy, 2000. [Google Scholar]
  32. Laing, I.; Child, A.R. Comparative Tolerance of Small Juvenile Palourdes (Tapes decussatus L.) and Manila Clams (Tapes philippinarum Adams & Reeve) to Low Temperature. J. Exp. Mar. Biol. Ecol. 1996, 195, 267–285. [Google Scholar] [CrossRef] [Scilit]
  33. Han, K.N.; Lee, S.W.; Wang, S.Y. The Effect of Temperature on the Energy Budget of the Manila Clam, Ruditapes philippinarum. Aquac. Int. 2008, 16, 143–152. [Google Scholar] [CrossRef] [Scilit]
  34. Laing, I.; Utting, S.D.; Kilada, R.W.S. Interactive Effect of Diet and Temperature on the Growth of Juvenile Clams. J. Exp. Mar. Biol. Ecol. 1987, 113, 23–38. [Google Scholar] [CrossRef] [Scilit]
  35. Kim, S.L.; Kwon, S.H.; Lee, H.-G.; Yu, O.H. Effects of Environmental and Biological Conditions on the Recruitment and Growth of the Manila Clam Ruditapes philippinarum on the West Coast of Korea. Ocean Sci. J. 2017, 52, 91–101. [Google Scholar] [CrossRef] [Scilit]
  36. Kim, W.S.; Huh, H.T.; Huh, S.-H.; Lee, T.W. Effects of Salinity on Endogenous Rhythm of the Manila Clam, Ruditapes philippinarum (Bivalvia: Veneridae). Mar. Biol. 2001, 138, 157–162. [Google Scholar] [CrossRef] [Scilit]
  37. Arisman, N.; Istiqomah, N.; Oka, H.; Yoshimatsu, T. Temporal Change of Salinity Stress in Manila Clam Ruditapes philippinarum: Implication for Biodefense Mechanism in Response to Climate Change. AACL Bioflux 2017, 10, 210–216. [Google Scholar]
  38. Rato, A.; Joaquim, S.; Matias, A.M.; Roque, C.; Marques, A.; Matias, D. The Impact of Climate Change on Bivalve Farming: Combined Effect of Temperature and Salinity on Survival and Feeding Behavior of Clams Ruditapes decussatus. Front. Mar. Sci. 2022, 9, 932310. [Google Scholar] [CrossRef] [Scilit]
  39. Li, Q.; Sun, S.; Zhang, F.; Wang, M.; Li, M. Effects of Hypoxia on Survival, Behavior, Metabolism and Cellular Damage of Manila Clam (Ruditapes philippinarum). PLoS ONE 2019, 14, e0215158. [Google Scholar] [CrossRef] [Scilit]
  40. Jing, H.; Liu, Z.; Wu, B.; Tu, K.; Liu, Z.; Sun, X.; Zhou, L. Physiological and Molecular Responses to Hypoxia Stress in Manila Clam Ruditapes philippinarum. Aquat. Toxicol. 2023, 257, 106428. [Google Scholar] [CrossRef] [Scilit]
  41. Nakamura, Y. Suspension Feeding and Growth of Juvenile Manila Clam Ruditapes philippinarum Reared in the Laboratory. Fish. Sci. 2004, 70, 215–222. [Google Scholar] [CrossRef] [Scilit]
  42. Trombetta, T.; Bouget, F.-Y.; Félix, C.; Mostajir, B.; Vidussi, F. Microbial Diversity in a North Western Mediterranean Sea Shallow Coastal Lagoon Under Contrasting Water Temperature Conditions. Front. Mar. Sci. 2022, 9, 858744. [Google Scholar] [CrossRef] [Scilit]
  43. Sorokin, Y.I.; Giovanardi, O. Trophic Characteristics of the Manila Clam (Tapes philippinarum Adams and Reeve). ICES J. Mar. Sci. 1995, 52, 853–862. [Google Scholar] [CrossRef] [Scilit]
  44. Coutteau, P.; Curé, K.; Sorgeloos, P. Effect of Algal Ration on Feeding and Growth of Juvenile Manila Clam Tapes philippinarum (Adams and Reeve). J. Shellfish Res. 1994, 13, 47–55. [Google Scholar]
  45. Jara-Jara, R.; Pazos, A.J.; Abad, M.; García-Martín, L.O.; Sánchez, J. Growth of Clam Seed (Ruditapes decussatus) Reared in the Wastewater Effluent from a Fish Farm in Galicia (N.W. Spain). Aquaculture 1997, 158, 247–262. [Google Scholar] [CrossRef] [Scilit]
  46. Acquafredda, M.P.; Morris, N.; Calvo, L.; De Luca, M.; Munroe, D. Evaluating the Efficacy of Nursery Gear Types for Cultivating Atlantic Surfclams (Spisula solidissima). Aquac. Rep. 2022, 25, 101186. [Google Scholar] [CrossRef] [Scilit]
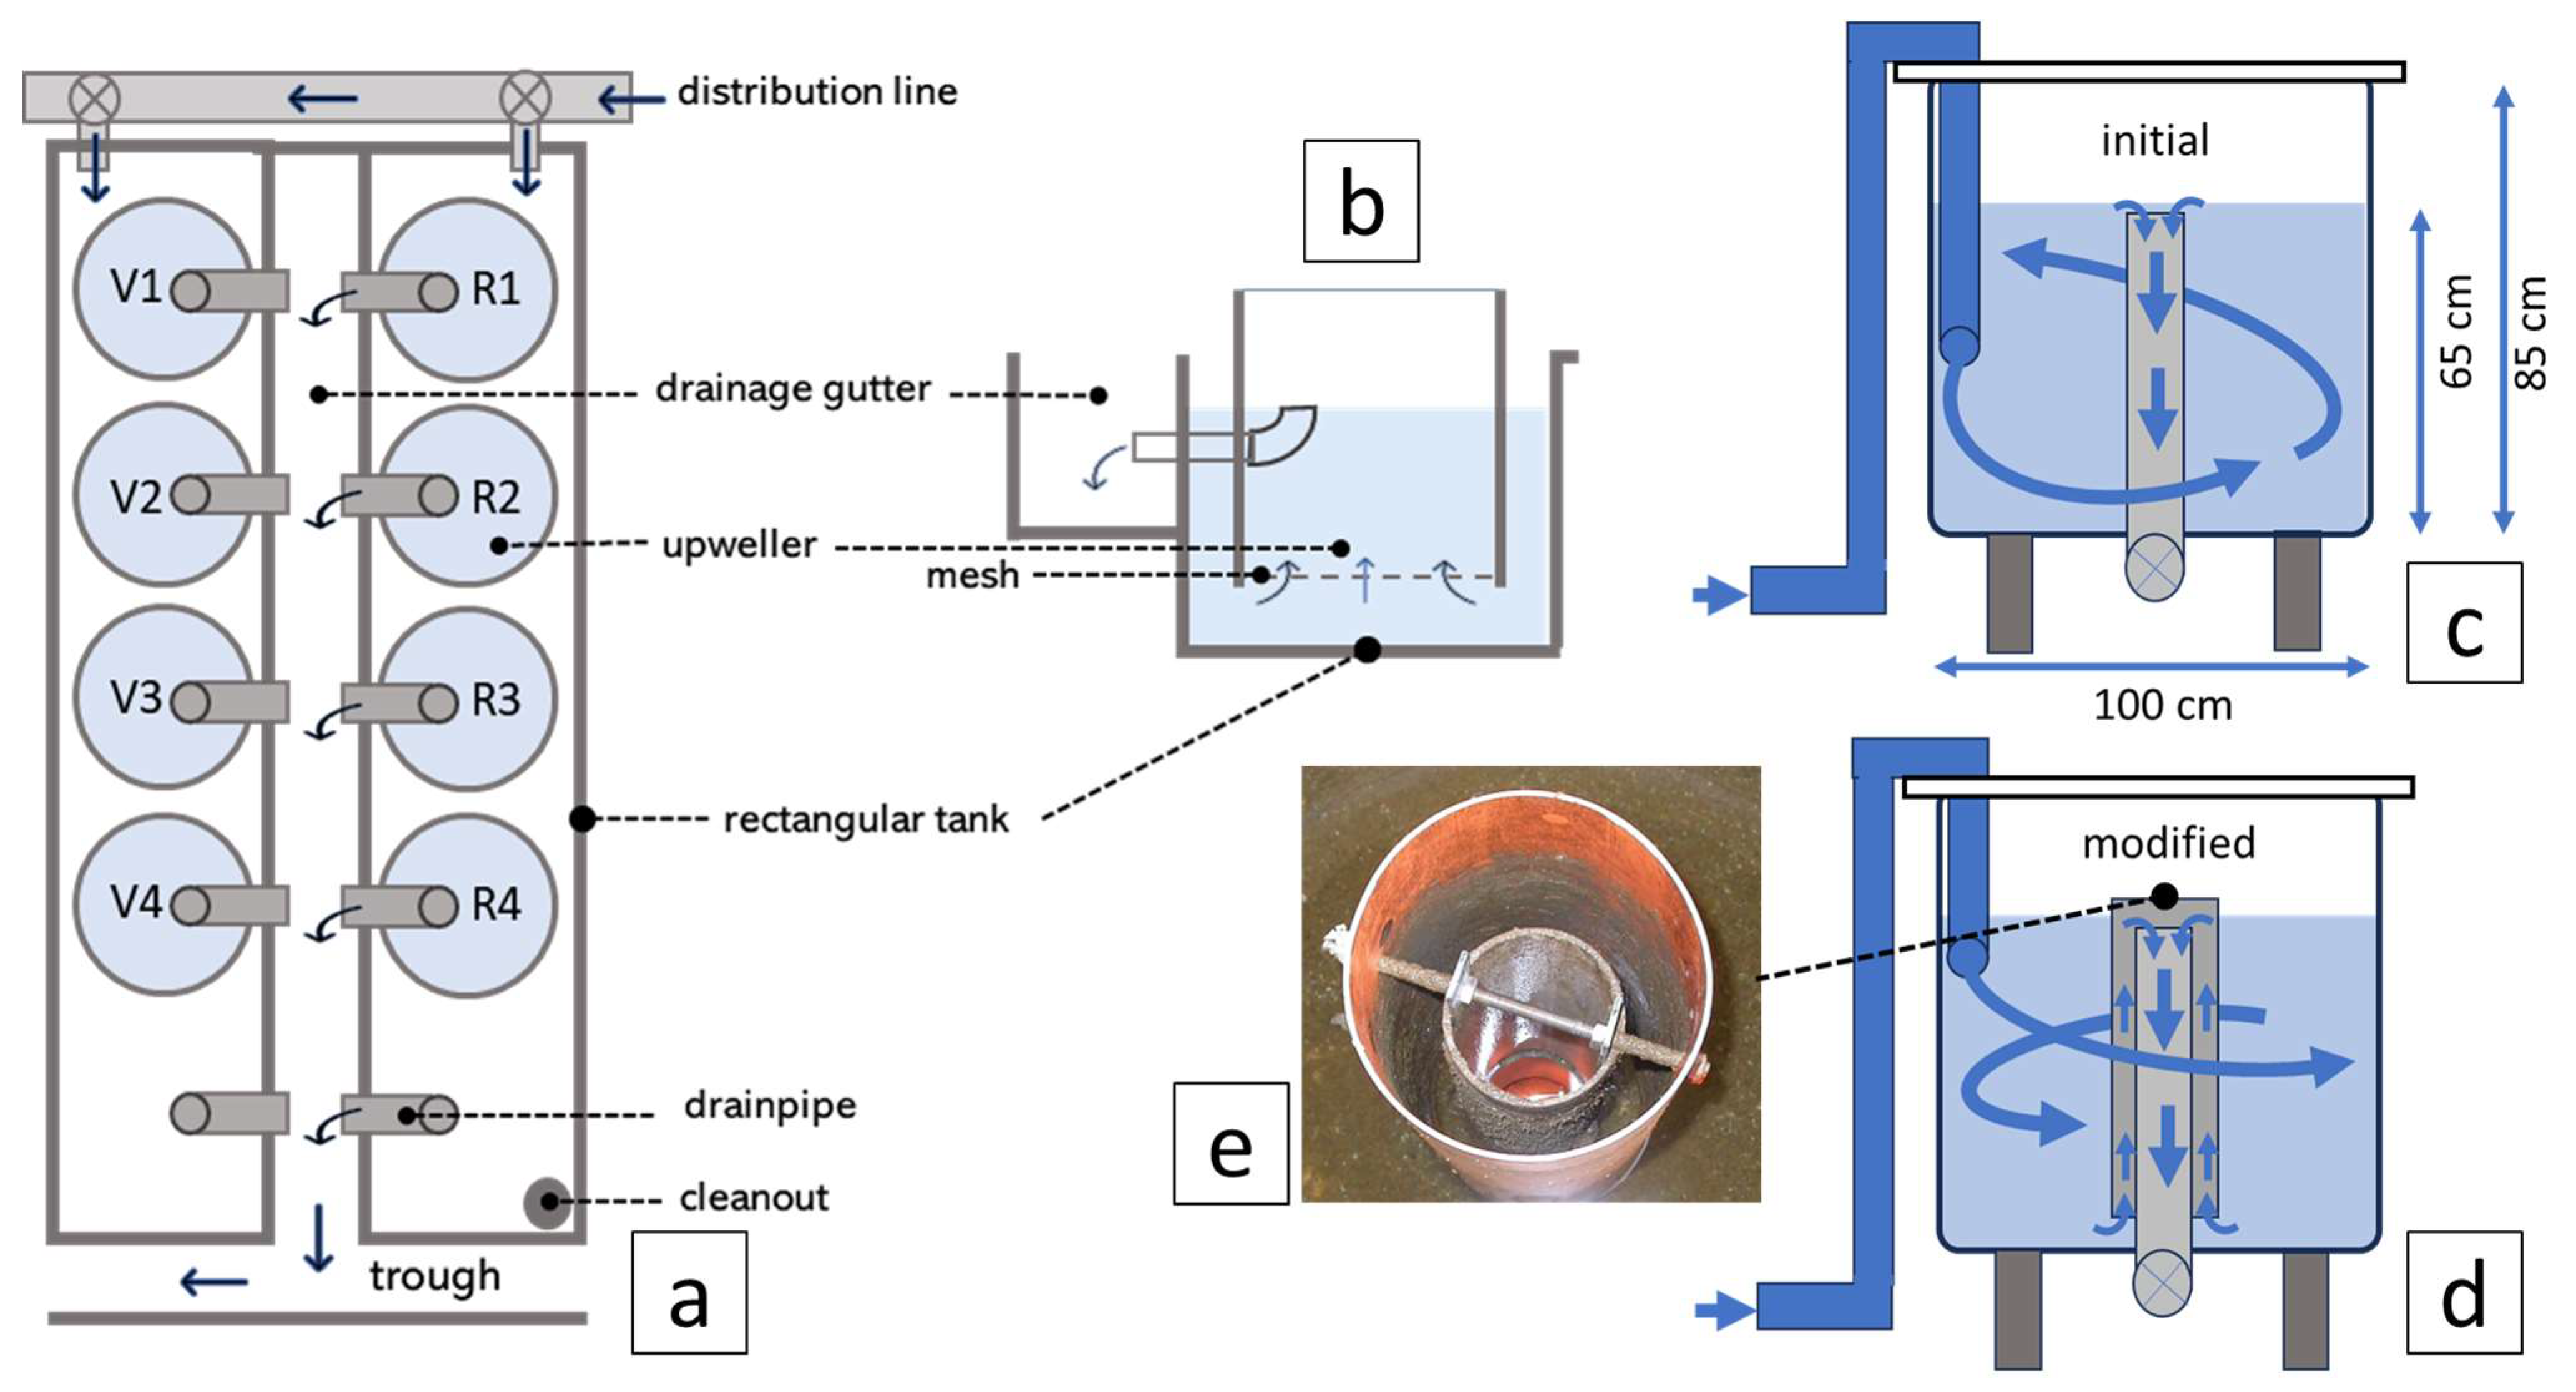
Figure 1. Schematics of the experimental systems used in the two trials: (a) layout of the upwelling system; (b) cross-sectional view of a single upweller; (c) cross-section of the flat-bottom tank with the hydraulic circulation system in its initial configuration; (d) cross-section of the flat-bottom tank with the modified hydraulic circulation system; (e) top view detail of the outlet standpipe.
Aquacj 06 00012 g001
Figure 2. Daily variations in temperature (a), salinity (b) dissolved oxygen (c) and chlorophyll-a (d) recorded in the Sacca degli Scardovari. Data are presented as mean values, while vertical bars span the intraday minimum–maximum range (ARPAV data processed by the authors, cf. Section 2.3).
Aquacj 06 00012 g002
Figure 3. Grading schedule applied during the rearing period of series V clams and associated changes in mean weight, total biomass, number of individuals, density, and water exchange rate.
Aquacj 06 00012 g003
Figure 4. Grading schedule applied during the rearing period of series R clams and associated changes in mean weight, total biomass, number of individuals, density, and water exchange rate.
Aquacj 06 00012 g004
Figure 5. Mean weight growth (mg) of series V clams (a) and series R (b) estimated from three samples per group during the trial. Group rearrangements during grading are indicated by connectors linked to pre-grading group means; vertical bars represent standard deviation.
Aquacj 06 00012 g005
Figure 6. (a) Final mean individual weight (±standard deviation) estimated from three samples per group. Statistical analysis: one-way permutation ANOVA (9999 permutations), followed by a permutation-based Tukey HSD post hoc test. Histograms sharing the same letter are not statistically different; * p < 0.05 and, ** p < 0.01. (b) Abundance of the experimental groups in series V and R and percentage distribution among size-selected subgroups.
Aquacj 06 00012 g006
Figure 7. Final mean total shell length (±standard deviation) expressed in mm, calculated from samples of 209–288 individuals. Statistical analysis: one-way permutation ANOVA (9999 permutations), followed by a permutation-based Tukey HSD post hoc test. Histograms sharing the same letter are not statistically different; ** p < 0.01.
Aquacj 06 00012 g007
Figure 8. Biometric data and size structure of series G populations (flat-bottom tanks): (a) mean individual weight over time (mg); (b) final mean shell length (mm); (c) mean individual weight of the experimental groups, with colored sections within each bar indicating the mean weight (mg) of the size-selected subgroups; (d) abundance of the experimental groups, with colored sections indicating the percentage distribution among size-selected subgroups. In panels (a,b), vertical bars represent standard deviations. Histograms sharing the same letter are not statistically different; * p < 0.05 and ** p < 0.01.
Aquacj 06 00012 g008
Figure 9. Comparison of individual shell length distributions for the two rearing systems (upwelling system vs. flat-bottom tanks), based on samples pooled from all experimental groups: (a) length–frequency distribution based on 25 predefined size classes spanning the full observed size range; (b) percentile distribution curves of individual shell length.
Aquacj 06 00012 g009
Table 1. Mean, minimum (Min), maximum (Max), and number of observations (N) for physico-chemical water parameters measured at the inlet and outlet of the different experimental units.
Inlet WaterOutlet Water O2 (mg/L)
Temp.
(°C)
Salinity (ppt)O2 (mg/L)Upwelling SystemFlat-Bottom Tanks
V1V2 V3 V4 R1 R2 R3 R4 G1 G2 G3 G4
Mean19.7267.57.37.68.58.27.37.58.58.17.17.17.07.1
Min13.0254.43.63.96.96.83.63.66.86.83.73.43.64.0
Max25.82810.110.210.210.310.210.310.210.310.29.79.89.89.8
N.34734332612183326121833333333
Table 2. Final summary of biometric data, growth performance, and mortality of Manila clam seed after 51 days of pre-fattening in the upwelling system (series V and R).
V1V2V3V4R1R2R3R4
Weighted mean individual weight by group (mg)6.612.327.249.26.212.124.443.1
Total N. 50,11688,05939,78530,69044,46388,14948,30336,052
SGR by group (%/day)3.124.355.907.072.994.325.696.81
Weighted mean individual weight by series (mg)19.218.8
Mortality (%)1916
SGR by series (%/day)5.25.2
Table 3. Biometric data and rearing parameters of the experimental batches from series G (flat-bottom tanks) recorded during the rearing period. Tanks G1 and G2 had a sand-free bottom, whereas tanks G3 and G4 were provided with a sand layer, which was reduced from 4–5 cm to about 2 cm on day 16.
GroupParameterSeedingDay 16Harvesting
with no sand substrateG1Mean weight (mg)1.346.0727.96
N. ind.230,436199,418188,284
Total biomass (g)30812115265
density (N/cm2)29.7025.724.3
Water flow rate (mL/min/g)276.070.216.1
G2Mean weight (mg)1.346.3126.93
N. ind.230,436156,006161,565
Total biomass (g)3089854351
density (N/cm2)29.720.120.8
Water flow rate (mL/min/g)276.086.319.5
with sand substrateG3Mean weight (mg)1.346.5526.86
N. ind.230,436195,838169,627
Total biomass (g)30812824557
density (N/cm2)29.725.321.9
Water flow rate (mL/min/g)276,066,318.7
G4Mean weight (mg)1.347.6130.40
N. ind.230,436192,220162,246
Total biomass (g)30814744933
density (N/cm2)29.724.820.9
Water flow rate (mL/min/g)276.057.717.2
Table 4. Biometric data and rearing parameters of the experimental batches from series G (flat-bottom tanks) subdivided by size class (sieve mesh sizes are reported in the first column). The graded subgroups are defined as tails, intermediates, and heads, according to progressively increasing growth performance.
ParameterG1G2G3G4
Tails
<2.4 mm
Mean weight (mg)9.79.210.911.2
Total biomass (g)776604881730
N. ind.80,37465,74080,86065,216
SGR (%/day)3.873.784.114.16
Intermediates
>2.4 mm
<4 mm
Mean weight (mg)34.331.533.134.6
Total biomass (g)3176242224692622
N. ind.92,52376,79074,66075,715
SGR (%/day)6.366.196.296.38
Heads
>4 mm
Mean weight (mg)85.369.685.674.2
Total biomass (g)1313132412071581
N. ind.15,38819,03514,10721,315
SGR (%/day)8.147.748.157.87
Overall
performance
Mortality (%)18.329.926.429.6
SGR (%/day)5.965.885.886.12
Table 5. Summary of energy consumption and labor requirements for environmental monitoring and routine management of the two rearing systems (time values are expressed in decimal minutes).
Data Calculated per 1000 Harvested IndividualsSeries V/RSeries GRelative Change (%) in Consumption in Series G Compared to Series V/R
EnergyWater volume consumed (m3/1000 ind.)27.536.6
Electricity consumption (kWh/1000 ind.)1.842.44+33.0%
LaborLabor for data collection (min/1000 ind.)1.801.12
Cleaning and selection labor (min/1000 ind.)4.240.18
Total labor (min/1000 ind.)6.041.30−78.5%
SeedSpat needed to harvest 1000 ind.12141351+11.4%
Disclaimer/Publisher’s Note: The statements, opinions and data contained in all publications are solely those of the individual author(s) and contributor(s) and not of MDPI and/or the editor(s). MDPI and/or the editor(s) disclaim responsibility for any injury to people or property resulting from any ideas, methods, instructions or products referred to in the content.