Article

Prediction of Estimated VO2max in Active University Students Using Field Tests: Rockport Walk Test Versus 20-m Shuttle Run


by
Julio Martín-Ruiz
Department of Health and Functional Assessment, Catholic University of Valencia, 46900 Torrent, Valencia, Spain
Physiologia 2026, 6(2), 28; https://doi.org/10.3390/physiologia6020028
Submission received: 19 March 2026 / Revised: 3 April 2026 / Accepted: 13 April 2026 / Published: 14 April 2026
(This article belongs to the Special Issue Exercise Physiology and Biochemistry: 3rd Edition)

Abstract

Background/Objectives: To develop and internally validate multiple linear regression models to predict estimated VO2max from anthropometric variables and easily obtainable physical fitness tests in active university students and to compare model performance when estimated VO2max was derived from the Rockport Walk Test versus the 20-m Shuttle Run (Course Navette). Methods: Anthropometric variables and physical fitness indicators, including body mass index (BMI), Ruffier index, and burpee repetitions, as well as sex and age, were evaluated. Estimated VO2max was obtained separately from the Rockport Walk Test and the 20-m Shuttle Run using their respective field test equations. For each test, a multiple linear regression model was fitted using the same set of predictors. Model performance was assessed using apparent metrics and internal validation with optimism correction based on repeated cross-validation. Results: The Rockport walk test model showed better predictive performance, explaining 55.2% of the variability in estimated VO2max (R2 = 0.552; adjusted R2 = 0.498) with a lower prediction error (RMSE = 3.54 mL·kg−1·min−1). In contrast, the 20-m shuttle run model showed lower explanatory capacity (R2 = 0.319; adjusted R2 = 0.256) and a substantially higher prediction error (RMSE = 11.93 mL·kg−1·min−1). Internal validation reduced performance in both models, more markedly in the 20-m shuttle run, where the corrected R2 fell to 0.163 and the corrected RMSE increased to 13.18 mL·kg−1·min−1, compared with 0.338 and 4.37 mL·kg−1·min−1 in the Rockport walk test. Conclusions: Estimated VO2max can be predicted pragmatically using low-cost models based on simple variables in a university setting; however, model performance depends on the field test used. The Rockport walk test appears more suitable for prediction using general-purpose predictors, whereas the 20-m shuttle run may require more test-specific predictors and external validation before application beyond the development sample.

1. Introduction

Cardiorespiratory fitness is a key component of health and physical performance, and VO2max is commonly regarded as a reference physiological indicator [1]. Although direct measurement by ergospirometry is considered the gold standard, its use is often limited in applied settings because it requires specialized equipment, trained personnel, time, and individual testing conditions [2]. Therefore, field tests and predictive equations are frequently used to obtain an indirect estimate of VO2max in educational, sports, and health-related contexts [3,4].
The Rockport walk test and 20-m shuttle run were selected because both are practical, low-cost, and widely used field tests for estimating cardiorespiratory fitness in educational and sports settings. In addition, they represent two distinctly different testing demands. The Rockport test is based on fast walking over a fixed distance and may be more accessible for participants with heterogeneous fitness levels, whereas the 20-m shuttle run is a progressive maximal test that is frequently used in physically active and university populations. Therefore, comparing prediction models derived from both tests may provide useful information about the influence of test characteristics on estimated VO2max.
In this regard, an ergospirometry test using gas analysis is considered the gold standard for direct measurement [5]; however, it is not accessible because of the costs, time required for instrumentation, and lower applicability in real-world contexts, as only one participant can be evaluated at a time. In this scenario, field tests and predictive equations are viable alternatives for estimating VO2max in sports [6] and educational and clinical settings, assuming a logical margin of error [7,8,9].
These field tests are widely used because of their simplicity; however, their accuracy largely depends on careful adherence to the protocol, target population (which should not be heterogeneous), and other variables that may be considered in the estimation [10]. Errors can increase when equations designed for specific tests are applied in other settings or when their predictive values are not properly interpreted. Focusing on active university students is relevant because this population is frequently assessed in educational and sports contexts, where low-cost and time-efficient field methods are especially valuable. Improving the prediction of estimated VO2max in this group may support routine fitness monitoring, training prescription, and early identification of low cardiorespiratory fitness. One such test is the Rockport walk test [11], the aim of which is to walk one mile as quickly as possible [12]. It is considered a very inclusive test, as it does not impose a minimum speed and allows participants to self-manage the intensity. In contrast, the 20-m Shuttle Run (Course Navette) [13] is a test widely used in the educational and sports fields that can distinguish cardiorespiratory levels based on the stages achieved [14,15].
The Rockport Walk Test and 20-m Shuttle Run differ substantially in terms of intensity, as they require submaximal and maximal effort, respectively [16], as well as in execution requirements, which can influence the estimation of VO2 max [17,18]. Therefore, it is methodologically appropriate to propose specific models for each test without assuming that a single prediction approach will be suitable for both [15]. Accordingly, the present study focused on the prediction of estimated VO2max derived from field test equations rather than directly measured VO2max obtained by gas analysis.
Multiple linear regression models allow for the integration of easily measurable information [19,20] (anthropometric characteristics and field test results) to improve the prediction of VO2max. However, this approach provides interpretability and practical applicability, making it easier to use the equations in real-world settings without requiring specialized equipment [21,22]. Despite the availability of multiple equations to estimate VO2max, significant differences in accuracy and consistency persist between tests and populations, and the performance of the models is not always clearly reported [23]. In this context, providing specific models for each test along with comparable performance metrics and an internal validation procedure, helps strengthen the applied utility of these estimates [24,25].
Therefore, this study aimed to develop and internally validate multiple linear regression models to predict estimated VO2max, derived separately from the Rockport Walk Test and the 20-m Shuttle Run, using simple anthropometric and physical fitness variables in active university students. This study does not validate field tests against direct ergospirometric measurement; rather, it compares the behavior and practical utility of predictive models of estimated VO2max derived from two widely used field-test equations in an active university setting. In this context, the findings are useful for identifying which low-cost model is more stable and interpretable when only simple field-based variables are available. A secondary aim was to compare the predictive performance of both models under the same analytical framework. A secondary aim was to compare the predictive performance of both models under the same analytical framework.
Assessing aerobic physical fitness in university students is key to the early detection of sedentary lifestyles and cardiometabolic risk. Overall, it provides an objective indicator for designing effective interventions and evaluating their impact.

2. Materials and Methods

2.1. Experimental Approach to the Problem

To evaluate the predictive capacity of VO2max measurements, a cross-sectional study was conducted using quantitative tests and field assessments during the development of a university class.
Active students from the Faculty of Physical Activity and Sports Sciences participated in the study after providing informed consent. The timing of the test measurements corresponded to the students’ class schedule during the course. The study was designed in accordance with the principles of the Declaration of Helsinki to ensure the fundamental rights of research involving human subjects and was approved by the Ethics Committee of the Catholic University of Valencia (reference number: UCV/2025-2026/002).

2.2. Participants

The total number of participants was 108, comprising two different samples. Sample A comprised 48 (12 women and 36 men), and Sample B comprised 7 (women) and 53 (men) students enrolled in a bachelor’s degree in Physical Activity and Sport Sciences at the Catholic University of Valencia, Spain (the male-to-female ratio was similar to that of the degree program). The inclusion criteria were as follows: age between 18 and 30 years, two subjects engaging in physical exercise at least four days a week (either in structured sports or activities involving at least 60–90 min daily), and no performance of physical activity on the day of the test or the day before. The exclusion criteria were as follows: injury at the time of the study, recovery period of less than one month before the test, and exemption from practical activities due to a medical prescription.

2.3. Procedure

After obtaining informed consent, measurements were taken in two sessions during class periods, with a one-week interval between the sessions.
In the first session, the principal investigator (ISAK-I) measured the participants’ weight and height. Height was measured using a stadiometer (Seca 213; Hamburg, Germany) with the head positioned in the Frankfurt plane. Weight was measured using a scale (Seca 213; Hamburg, Germany), and the results were recorded after two seconds of stillness.
Subsequently, each participant wore a wristband equipped with ANT+ technology (Moofit HW401, Shenzhen, China). The device was placed on the forearm, and the participant was asked to remain in a relaxed position for at least one minute to record their resting heart rate, which was captured using specific software (Pulse monitor, Michalowice, Poland v. 4.2.2.) and served as a reference for the expected increases during the main part.
Subsequently, a standardized warm-up was performed, consisting of an initial general preventive section with analytical and isometric exercises to reduce spinal compression and increase muscle stabilization: cat-camel (six repetitions), bird-dog (six repetitions), and front plank (15 s), followed by general joint mobility exercises before the specific warm-up, which included strength exercises such as squats (2 × 10 repetitions), jumping jacks (2 × 10 reps), and three 40 m running progressions.
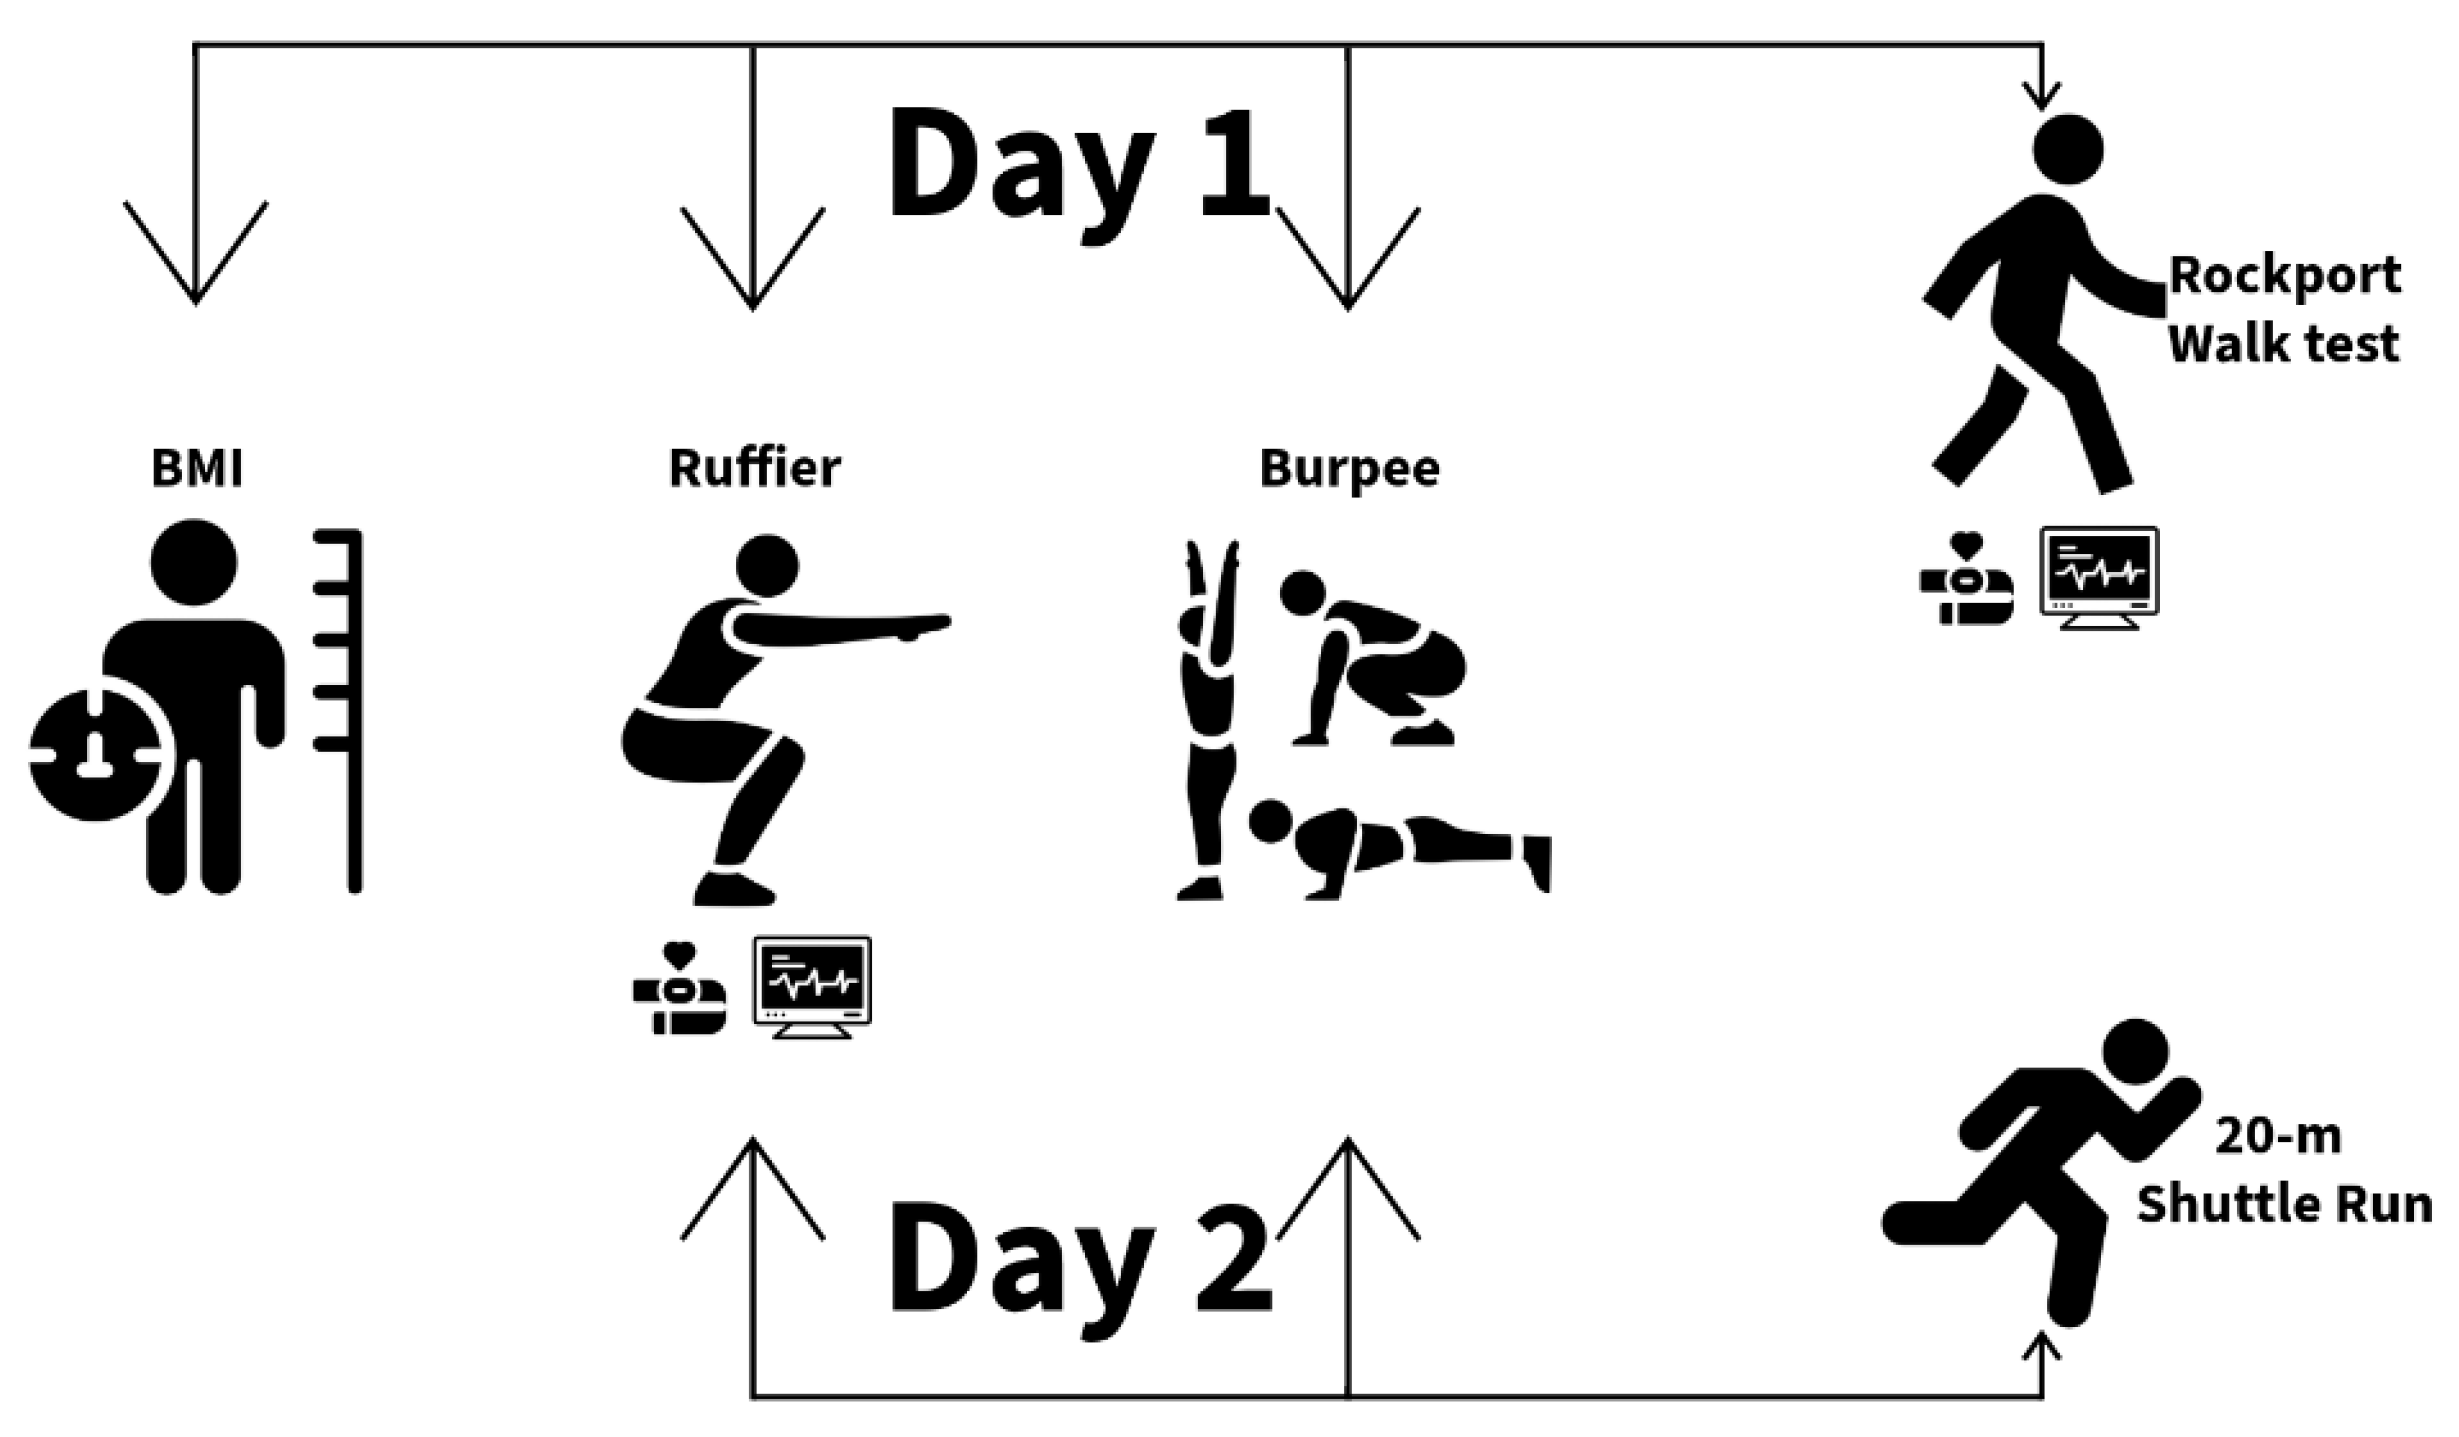
The placement of the device and warm-up were identical in the first and second sessions. The main part of the training on both days included the Ruffier and burpee tests. The final test was performed on two different days: the Rockport walk test on one day and the 20-m shuttle run test on the second day.

2.4. Ruffier Test

The total number of students stood in a bipedal standing position with their feet shoulder-width apart. At the investigator’s signal, the stopwatch was started for 45 s, during which the participants performed 30 squat repetitions, ensuring that they reached 90º of flexion in each repetition and maintained spinal alignment [26].
The pulse was recorded at the end of the period and 60 s after exercise. The test results were calculated considering the resting pulse, pulse after exercise, and pulse after one minute (P1, P2, and P3) using the following formula:
R I = P 1 + P 2 + P 3 200 10
The lowest value in all cases was the most desirable, indicating good recovery and tolerance to fatigue; the following scale was used: (1) 0–5, good; (2) 5.1–10, average; and (3) 10.1–15 or higher, insufficient.

2.5. Burpee Test

The participants were paired. One counted the repetitions while the other performed the exercise, and they then switched roles. At the researcher’s signal, who started the timer, the participants had to perform the burpee movement as many times as possible in 60 s and at maximum speed [27,28]. The movement had to be performed in a specific sequence: standing, supported squat, plank with an extended body, return to squat, and jump. At the end of the time, the total repetitions from the single attempt were recorded, and the values were interpreted as follows: low, <19 men and <15 women; average, 20–26 men and 16–23 women; 3 a high, >27 men and >24 women.

2.6. Rockport Walk Test

With the device placed on the forearm and on a measured surface of 100 m, the participants completed 16 laps and 9 m to cover a total distance of one mile (1609 m). The activity had to be performed at a fast walking pace, without running, allowing participants to self-manage their intensity with the goal of finishing in the shortest time possible. At the end of the route, age, weight, sex (0 women and 1 man), and final heart rate were recorded [13,29]. VO2max was estimated using the following formula:
V O 2   m a x = 132.853 0.0769 w e i g h t ( k g ) 0.3877 a g e ( y e a r s ) + 6.315 s e x 3.2649 t i m e ( m i n ) 0.1565 H R ( b p m )
Participants were instructed to complete the one-mile course as fast as possible while maintaining a walking gait, in accordance with the original Rockport protocol. Standardized verbal instructions were provided to encourage consistent effort among participants. However, no direct physiological criterion was used to verify maximal effort.

2.7. 20-m Shuttle Run Test

The participants positioned themselves at a line marker with a separation of 20 m. The test was conducted in stages, each increasing in intensity with every beep, requiring the participants to increase their running pace [11,30]. When a participant withdrew, the last completed stage was recorded, and VO2max was estimated using the Léger equation based on the final speed reached:
V O 2 m a x = 31.025 + 3.238 S p e e d 3.248 A g e + 0.1538 V A g e
Figure 1 depicts the sequence of tests performed each day.

2.8. Statistical Analysis

Statistical analysis was performed using R (v. 4.5.2.) [31], using the ggplot2 package (v.4.0.0.) [32] for visualization. The significance level was set at α = 0.05. The analyses were conducted separately for each test (Rockport Walk Test and 20-m Shuttle Run) as they were independent data sets.
Descriptive analysis of the variables was conducted, presenting the mean ± standard deviation for continuous variables and frequencies (n, %) for categorical variables. Prior to modeling, the presence of missing values and consistency of the variables were assessed.
For each test, a multiple linear regression model was fitted with VO2max as the dependent variable. The predictors included anthropometric and performance variables specific to each test, depending on their availability. The collinearity between predictors was assessed, and the model assumptions were verified by inspecting the residuals, including normality, homoscedasticity, and detection of influential observations.
The predictive performance of the models was evaluated using R2, RMSE, and MAE. Internal validation was conducted using repeated 10-fold cross-validation with 200 repetitions. In each repetition, the model was trained on nine folds, and predictions were generated for the excluded fold, repeating the process until all 10 folds were completed. The metrics were summarized as the mean and standard deviation across repetitions, and model optimism was estimated by comparing the apparent performance with the average performance obtained during cross-validation.

3. Results

3.1. Sample Characteristics

Two independent datasets were analyzed according to the field test used to derive the estimated VO2max. The Rockport Walk Test group included 48 participants, whereas the 20-m Shuttle Run group included 60 participants. Men were overrepresented in both groups (Rockport: 36 men and 12 women; Shuttle Run: 53 men and 7 women). These sample characteristics should be considered when interpreting the scope and generalizability of the findings, particularly for female participants. Descriptive results are presented for the two groups using estimated VO2max values derived from the corresponding field test equations rather than directly measured VO2max (Table 1).
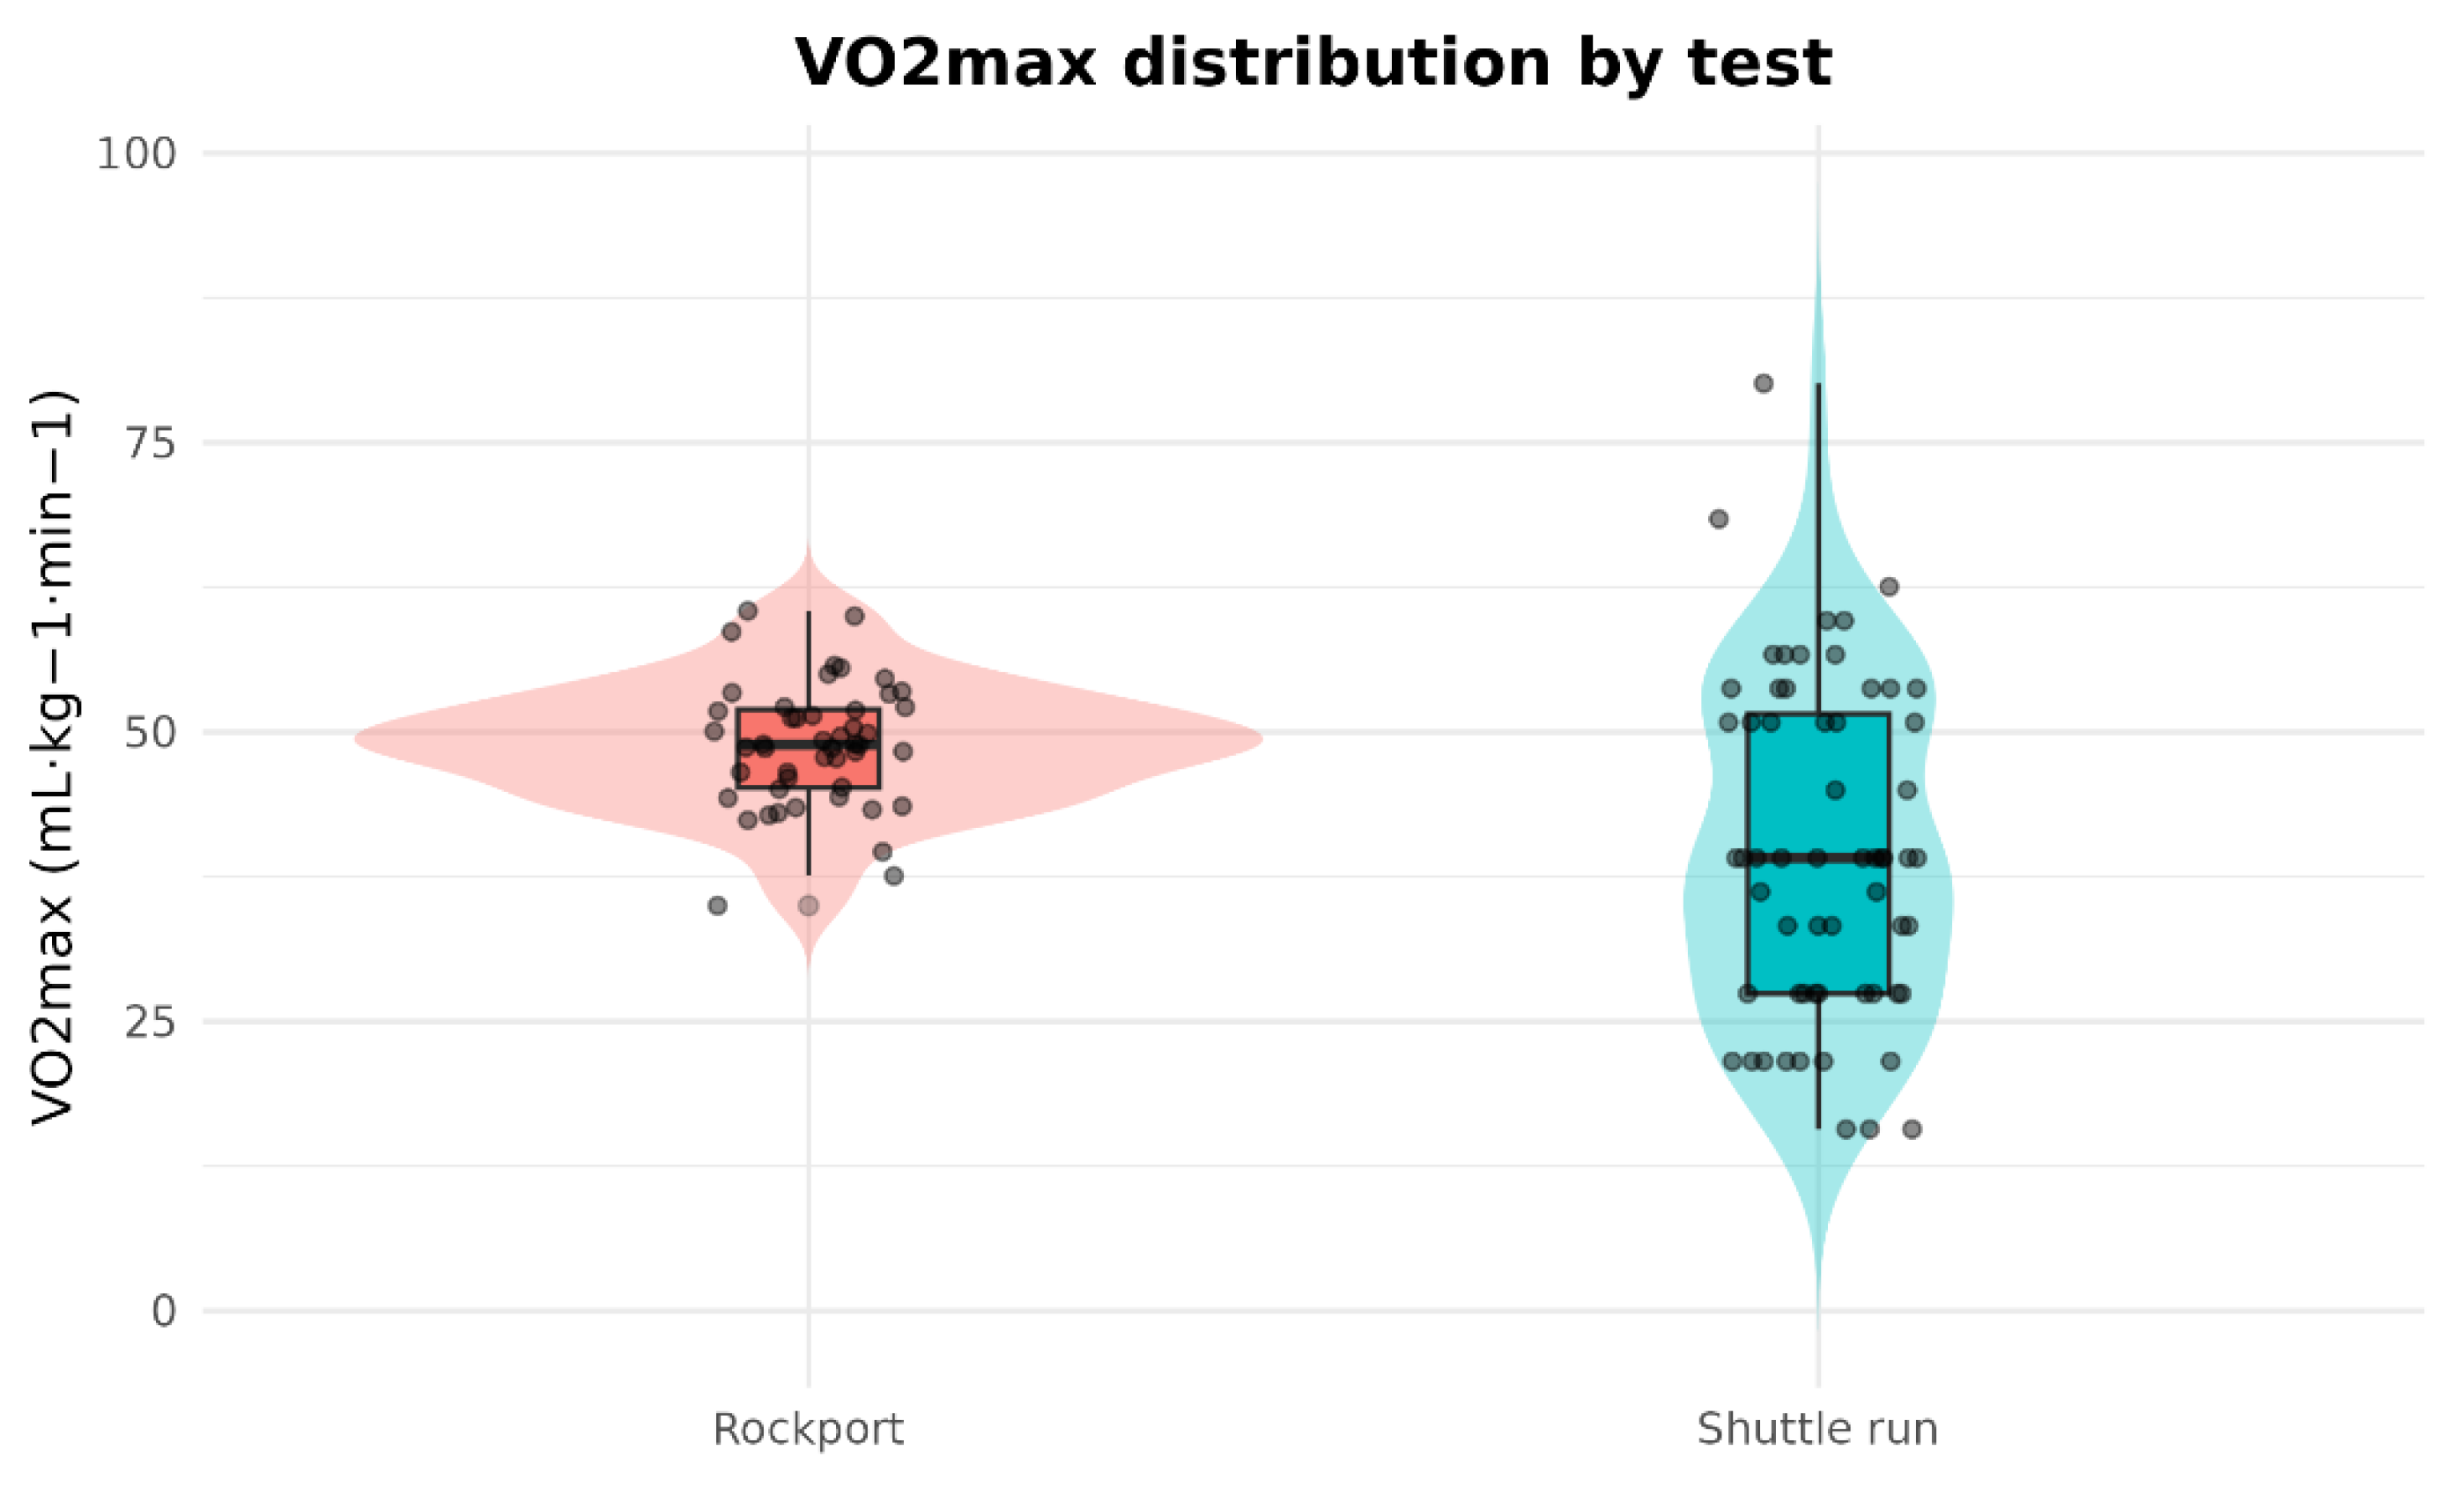
Table 1 summarizes the descriptive characteristics of the two analytical samples. These values are presented to characterize each sample and should not be interpreted as formal between-group comparisons. The average age was comparable between the groups, with a slightly higher mean in the Rockport Walk test. Body mass index (BMI) was similar between groups, and the mean values for Ruffier and repetitions in the Burpee test showed similar magnitudes, although with differences in dispersion. The average VO2max was higher in the Rockport walk test than in the 20-m shuttle run test, with much greater variability in the latter.
Figure 2 shows the distribution of the estimated VO2max values for each test, highlighting the intra-group variability and overall differences between the Rockport Walk Test and the 20-m shuttle run.

3.2. Multiple Regression Model for VO2max in the Rockport Walk Test

In the Rockport Walk Test group, the multiple linear regression model including body mass index (BMI), Ruffier index, burpee repetitions, sex, and age explained a moderate-to-high proportion of the variability in VO2max. Regarding effects, the Ruffier index was negatively and significantly associated with VO2max, indicating that poorer performance/higher cardiovascular load in the Ruffier test is related to lower estimated aerobic capacity. Sex (male vs. female) showed a large and significant positive effect, with higher VO2max values in men after adjusting for other covariates. Age was negatively and significantly associated with VO2max, consistent with a decline in aerobic capacity with increasing age within the observed range of ages. BMI and burpees did not reach statistical significance in this model (although their directions were consistent with general intuition, the pattern was not sufficiently stable in this sample) (Table 2).

3.3. Multiple Regression Model for VO2max in the 20-m Shuttle Run

In the 20-m shuttle run group, the same model (BMI, Ruffier, Burpee, sex, and age) explained a smaller proportion of the variability in VO2max than in the Rockport walk test group. Overall, the fit was weaker, and the prediction error was considerably higher, which is consistent with the high dispersion observed in VO2max in this dataset. This result suggests that, in this sample, the VO2max derived from the 20-m shuttle run presented greater heterogeneity, and that the included variables captured only part of this variability (Table 3).

3.4. Comparison of Model Performance and Impact of Internal Validation

To assess performance stability, apparent metrics and metrics corrected for optimism (internal validation) were considered. In the Rockport Walk Test, the model showed good apparent performance; however, the optimism correction significantly reduced the R2 and increased the RMSE, indicating that part of the initial performance was inflated because of fitting the same sample. In the 20-m shuttle run, the apparent performance was already more modest, and after correction, the R2 decreased further and the RMSE increased, reinforcing the idea that the model generalizes worse in this set of data (Table 4).

4. Discussion

In the present study, clear differences were observed in the performance of the models depending on the test used, with better performance in the Rockport Walk Test than in the 20-m Shuttle Run. These differences are plausible from both physiological and methodological standpoints, as the Rockport Walk Test is a submaximal test that is less dependent on pacing and tolerance for maximal effort, whereas the 20-m Shuttle Run is a maximal incremental test that can amplify interindividual variability owing to motivational factors, familiarity with the test, and changes in direction [33]. In the Rockport Walk Test, the pattern of associations (worse cardiorespiratory status reflected in cardiovascular or performance indicators is linked to lower estimated VO2max, and sex shows expected differences) is consistent with the rationale behind the classic equations of the test, which integrate demographic and anthropometric variables along with performance/HR to estimate VO2max in field settings [13].
Moreover, the magnitude of sex differences observed is usually consistent with physiological evidence regarding higher relative and absolute VO2max in men, mediated in part by differences in fat-free mass, hemoglobin, and heart size, even within young age ranges [34]. In the 20-m Shuttle Run, the lower fit of the model can be explained by the fact that performance in the Shuttle Run does not depend solely on aerobic capacity, but also on running economy, acceleration–deceleration ability, and skill in changing direction—factors that can act as noise when attempting to predict VO2max using only general variables such as BMI, age, sex, or complementary tests that are not specific to the locomotor pattern of the 20-m Shuttle Run [35]. The weaker performance of the 20-m shuttle run model may also reflect the absence of test-specific predictors more directly linked to shuttle run performance. Unlike the Rockport walk test, the 20-m shuttle run involves progressive speed increments, repeated accelerations and decelerations, pacing demands, and changes of direction, all of which may introduce additional variability into the estimated VO2max. Variables such as the final stage achieved, peak running speed, running economy, or change-of-direction ability may therefore improve predictive performance in future models specifically designed for this test.
In addition, the estimation equations for the 20-m Shuttle Run were developed under specific conditions, and their validity may vary when applied to samples with different characteristics or variations in the protocol or familiarization [36]. Regarding the methodology, the drop in performance after internal validation is an expected finding and reinforces that the apparent performance may be inflated owing to overfitting, especially when there are several predictors and a moderate sample size. Therefore, it is advisable to report optimism-corrected performance using internal validation, rather than interpreting the apparent R2 as an estimate of out-of-sample performance [37].
Overall, the results support the use of test-specific approaches and suggest that, for the 20-m Shuttle Run, incorporating predictors that are more closely related to the test itself (e.g., final speed, locomotion variables, or markers of internal load) could improve the stability of the model [38]. Therefore, these findings should be interpreted cautiously. The better performance observed in the Rockport-based model is supported by its higher explained variance and lower prediction error relative to the 20-m shuttle run model within this sample. However, because both outcomes were based on indirect estimation and only internal validation was performed, these results should not be interpreted as evidence of superiority beyond the study context.
From a practical perspective, the two field tests differed not only in intensity but also in the type of performance they demanded. The Rockport Walk Test may be more compatible with prediction based on general anthropometric and fitness-related variables because it relies on a submaximal locomotor task with lower coordination and pacing demands. In contrast, performance in the 20-m shuttle run is more likely to be influenced by additional factors, such as pacing ability, turning efficiency, tolerance to progressive maximal effort, and running-specific economy. This may partly explain why the same set of general predictors performed less satisfactorily in the shuttle-run model.
This study has several limitations. First, the sample size was modest in both groups, which may reduce model stability and increase the risk of overfitting, despite internal validation procedures. Second, the sample was clearly imbalanced by sex, with a predominance of men, which limits the generalizability of the findings, particularly for women. Third, all participants were active university students from the Department of Physical Education and Sport; therefore, the results should not be extrapolated without caution to sedentary individuals, clinical populations, other academic settings, or different age groups. Fourth, the outcome variable was estimated VO2max derived from field-test equations rather than directly measured VO2max obtained by ergospirometry. Finally, although internal validation was performed, the models were not externally validated in an independent sample; therefore, their transportability to other populations remains uncertain. An additional limitation is that effort during the Rockport Walk Test was standardized through instructions and protocol adherence but not objectively verified using physiological criteria. Therefore, some variability related to individual motivation or pacing strategy cannot be ruled out.

5. Conclusions

In conclusion, simple anthropometric and physical fitness variables may be useful for predicting estimated VO2max in active university students, although predictive performance depends on the field test used to derive the outcome. The Rockport walk test showed better performance under the present modelling approach, whereas the 20-m shuttle run yielded a greater prediction error and may require test-specific predictors and external validation before broader application.

Funding

This study received no external funding.

Institutional Review Board Statement

The study was conducted in accordance with the Declaration of Helsinki and approved by the Ethics Committee of the Catholic University of Valencia (protocol code UCV/2025-26/002 on 2025-09/29) for studies involving humans.

Informed Consent Statement

Informed consent was obtained from all subjects involved in the study.

Data Availability Statement

The datasets used and analyzed in the current study are available from the corresponding author upon reasonable request owing to privacy and ethical restrictions.

Acknowledgments

We would like to express our sincere gratitude to the students who participated in this study.

Conflicts of Interest

The author declares no conflicts of interest.

Abbreviations

The following abbreviations are used in this manuscript:
CVCross-validation
HRHeart rate
MAEMean absolute error
RMSERoot mean square error
VO2maxMaximal oxygen uptake

References

  1. Lang, J.J.; A Prince, S.; Merucci, K.; Cadenas-Sanchez, C.; Chaput, J.-P.; Fraser, B.J.; Manyanga, T.; McGrath, R.; Ortega, F.B.; Singh, B.; et al. Cardiorespiratory fitness is a strong and consistent predictor of morbidity and mortality among adults: An overview of meta-analyses representing over 20.9 million observations from 199 unique cohort studies. Br. J. Sports Med. 2024, 58, 556–566. [Google Scholar] [CrossRef]
  2. Mandsager, K.; Harb, S.; Cremer, P.; Phelan, D.; Nissen, S.E.; Jaber, W. Association of Cardiorespiratory Fitness With Long-term Mortality Among Adults Undergoing Exercise Treadmill Testing. JAMA Netw. Open 2018, 1, e183605. [Google Scholar] [CrossRef] [PubMed]
  3. Ross, R.; Blair, S.N.; Arena, R.; Church, T.S.; Despres, J.P.; Franklin, B.A.; Haskell, W.L.; Kaminsky, L.A.; Levine, B.D.; Lavie, C.J.; et al. Importance of Assessing Cardiorespiratory Fitness in Clinical Practice: A Case for Fitness as a Clinical Vital Sign: A Scientific Statement from the American Heart Association. Circulation 2016, 134, e653–e699. [Google Scholar] [CrossRef]
  4. Strasser, B.; Burtscher, M. Survival of the fittest: VO2max, a key predictor of longevity? Front. Biosci. 2018, 23, 1505–1516. [Google Scholar] [CrossRef]
  5. Poole, D.C.; Jones, A.M. Measurement of the maximum oxygen uptake Vo2max: Vo2peak is no longer acceptable. J. Appl. Physiol. 2017, 122, 997–1002. [Google Scholar] [CrossRef]
  6. Jeličić, M.; Ivančev, V.; Čular, D.; Čović, N.; Stojanović, E.; Scanlan, A.T.; Milanović, Z. The 30-15 Intermittent Fitness Test: A Reliable, Valid, and Useful Tool to Assess Aerobic Capacity in Female Basketball Players. Res. Q. Exerc. Sport 2020, 91, 83–91. [Google Scholar] [CrossRef]
  7. Silva Queiroz, D.; Marques da Silva, C.C.B.; Franco Amaral, A.; Rodrigues Oliveira, M.; Salge, J.M.; Ribeiro Carvalho, C.R.; Baldi, B.G.; Carvalho, C.R.F. Evaluation of maximal exercise capacity through the incremental shuttle walking test in lymphangioleiomyomatosis. Pulmonology 2024, 30, 563–569. [Google Scholar] [CrossRef]
  8. Bennett, H.; Parfitt, G.; Davison, K.; Eston, R. Validity of Submaximal Step Tests to Estimate Maximal Oxygen Uptake in Healthy Adults. Sports Med. 2016, 46, 737–750. [Google Scholar] [CrossRef]
  9. Peterman, J.E.; Whaley, M.H.; Harber, M.P.; Fleenor, B.S.; Imboden, M.T.; Myers, J.; Arena, R.; Kaminsky, L.A. Comparison of non-exercise cardiorespiratory fitness prediction equations in apparently healthy adults. Eur. J. Prev. Cardiol. 2021, 28, 142–148. [Google Scholar] [CrossRef] [PubMed]
  10. Castro-Piñero, J.; Marin-Jimenez, N.; Fernandez-Santos, J.R.; Martin-Acosta, F.; Segura-Jimenez, V.; Izquierdo-Gomez, R.; Ruiz, J.R.; Cuenca-Garcia, M. Criterion-Related Validity of Field-Based Fitness Tests in Adults: A Systematic Review. J. Clin. Med. 2021, 10, 3743. [Google Scholar] [CrossRef] [PubMed]
  11. Léger, L.A.; Lambert, J. A maximal multistage 20-m shuttle run test to predict VO2 max. Eur. J. Appl. Physiol. Occup. Physiol. 1982, 49, 1–12. [Google Scholar] [CrossRef]
  12. Castells-Sánchez, A.; Roig-Coll, F.; Lamonja-Vicente, N.; Torán-Monserrat, P.; Pera, G.; Montero, P.; Dacosta-Aguayo, R.; Bermudo-Gallaguet, A.; Bherer, L.; Erickson, K.I.; et al. Sex Matters in the Association between Physical Activity and Fitness with Cognition. Med. Sci. Sports Exerc. 2021, 53, 1252–1259. [Google Scholar] [CrossRef]
  13. Kline, G.M.; Porcari, J.P.; Hintermeister, R.; Freedson, P.S.; Ward, A.; Mccarron, R.F.; Ross, J.; Rippe, J.M. Estimation of VO2max from a one-mile track walk, gender, age, and body weight. Med. Sci. Sports Exerc. 1987, 19, 253–259. [Google Scholar] [CrossRef]
  14. Magee, M.K.; White, J.B.; Merrigan, J.J.; Jones, M.T. Does the Multistage 20-m Shuttle Run Test Accurately Predict VO2max in NCAA Division I Women Collegiate Field Hockey Athletes? Sports 2021, 9, 75. [Google Scholar] [CrossRef]
  15. Welsman, J.; Armstrong, N. The 20 m shuttle run is not a valid test of cardiorespiratory fitness in boys aged 11–14 years. BMJ Open Sport Exerc. Med. 2019, 5, e000627. [Google Scholar] [CrossRef]
  16. Predovan, D.; Berryman, N.; Lussier, M.; Comte, F.; Vu, T.T.M.; Villalpando, J.M.; Bherer, L. Assessment of the Relationship Between Executive Function and Cardiorespiratory Fitness in Healthy Older Adults. Front. Psychol. 2021, 12, 742184. [Google Scholar] [CrossRef]
  17. Tomkinson, G.R.; Lang, J.J.; Blanchard, J.; Léger, L.A.; Tremblay, M.S. The 20-m Shuttle Run: Assessment and Interpretation of Data in Relation to Youth Aerobic Fitness and Health. Pediatr. Exerc. Sci. 2019, 31, 152–163. [Google Scholar] [CrossRef] [PubMed]
  18. Papini, G.B.; Carder, C.; Lightfoot, C.J.; Kubis, H.-P.; Bonomi, A.G.; Sartor, F. Quarter-mile walk test sensitive to training-induced fitness changes. J. Sports Med. Phys. Fit. 2019, 59, 1820–1827. [Google Scholar] [CrossRef] [PubMed]
  19. Myers, J.; Kaminsky, L.A.; Lima, R.; Christle, J.W.; Ashley, E.; Arena, R. A Reference Equation for Normal Standards for VO2 Max: Analysis from the Fitness Registry and the Importance of Exercise National Database (FRIEND Registry). Prog. Cardiovasc. Dis. 2017, 60, 21–29. [Google Scholar] [CrossRef] [PubMed]
  20. Selland, C.A.; Kelly, J.; Gums, K.; Meendering, J.R.; Vukovich, M. A Generalized Equation for Prediction of VO2peak from a Step Test. Int. J. Sports Med. 2021, 42, 833–839. [Google Scholar] [CrossRef]
  21. Rowley, T.W.; Cho, C.; Swartz, A.M.; Cho, Y.; Strath, S.J. Validation of a series of walking and stepping tests to predict maximal oxygen consumption in adults aged 18-79 years. PLoS ONE 2022, 17, e0264110. [Google Scholar] [CrossRef]
  22. Bragada, J.A.; Bartolomeu, R.F.; Rodrigues, P.M.; Magalhães, P.M.; Bragada, J.P.; Morais, J.E. Validation of StepTest4all for Assessing Cardiovascular Capacity in Young Adults. Int. J. Environ. Res. Public Health 2022, 19, 11274. [Google Scholar] [CrossRef]
  23. Jalili, M.; Nazem, F.; Sazvar, A.; Ranjbar, K. Prediction of Maximal Oxygen Uptake by Six-Minute Walk Test and Body Mass Index in Healthy Boys. J. Pediatr. 2018, 200, 155–159. [Google Scholar] [CrossRef]
  24. Dugas, M.-O.; Paradis-Deschênes, P.; Simard, L.; Chevrette, T.; Blackburn, P.; Lavallière, M. Comparison of VO2max Estimations for Maximal and Submaximal Exercise Tests in Apparently Healthy Adults. Sports 2023, 11, 235. [Google Scholar] [CrossRef]
  25. Nikseresht, M.; Castagna, C.; Nikseresht, M. Assessing the Validity of Two Non-Exercise Regression Equations for Predicting Maximal Oxygen Consumption. Res. Q. Exerc. Sport 2024, 95, 953–962. [Google Scholar] [CrossRef]
  26. Guo, Y.; Bian, J.; Li, Q.; Leavitt, T.; I Rosenberg, E.; Buford, T.W.; Smith, M.D.; Vincent, H.K.; Modave, F. A 3-minute test of cardiorespiratory fitness for use in primary care clinics. PLoS ONE 2018, 13, e0201598. [Google Scholar] [CrossRef]
  27. Andreassen, Ø.; Brønnick, K.; Njå, A.-L.; Furulund, E.; Nesvåg, S. The Effect of High-Intensity Interval/Circuit Training on Cognitive Functioning and Quality of Life During Recovery from Substance Abuse Disorder. A Study Protocol. Front. Psychol. 2019, 10, 2564. [Google Scholar] [CrossRef] [PubMed]
  28. Podstawski, R.; Borysławski, K. 30 Years of Change: Declining Motor Fitness and Anthropometric Shifts in Polish University Students (1994–2024). Life 2024, 14, 1325. [Google Scholar] [CrossRef]
  29. Weiglein, L.; Herrick, J.; Kirk, S.; Kirk, E.P. The 1-mile walk test is a valid predictor of VO(2max) and is a reliable alternative fitness test to the 1.5-mile run in U.S. Air Force males. Mil. Med. 2011, 176, 669–673. [Google Scholar] [CrossRef] [PubMed]
  30. Léger, L.A.; Mercier, D.; Gadoury, C.; Lambert, J. The multistage 20 metre shuttle run test for aerobic fitness. J. Sports Sci. 1988, 6, 93–101. [Google Scholar] [CrossRef] [PubMed]
  31. R Core Team. R: A Language and Environment for Statistical Computing; R Foundation for Statistical Computing: Vienna, Austria, 2022. [Google Scholar]
  32. Kassambara, A. Ggpubr:“ggplot2” Based Publication Ready Plots, R Package Version 0.4.0.; R Foundation for Statistical Computing: Vienna, Austria, 2020. [Google Scholar]
  33. Tomkinson, G.R.; Lang, J.J.; Tremblay, M.S.; Dale, M.; LeBlanc, A.G.; Belanger, K.; Ortega, F.B.; Léger, L. International normative 20 m shuttle run values from 1 142 026 children and youth representing 50 countries. Br. J. Sports Med. 2017, 51, 1545–1554. [Google Scholar] [CrossRef]
  34. Bassett, D.R.; Howley, E.T. Limiting factors for maximum oxygen uptake and determinants of endurance performance. Med. Sci. Sports Exerc. 2000, 32, 70–84. [Google Scholar] [CrossRef] [PubMed]
  35. Buchheit, M. The 30-15 intermittent fitness test: Accuracy for individualizing interval training of young intermittent sport players. J. Strength Cond. Res. 2008, 22, 365–374. [Google Scholar] [CrossRef] [PubMed]
  36. Ruiz, J.R.; Castro-Piñero, J.; Artero, E.G.; Ortega, F.B.; Sjöström, M.; Suni, J.; Castillo, M.J. Predictive validity of health-related fitness in youth: A systematic review. Br. J. Sports Med. 2009, 43, 909–923. [Google Scholar] [CrossRef] [PubMed]
  37. Steyerberg, E.W.; Harrell, F.E.; Borsboom, G.J.; Eijkemans, M.J.; Vergouwe, Y.; Habbema, J.D. Internal validation of predictive models: Efficiency of some procedures for logistic regression analysis. J. Clin. Epidemiol. 2001, 54, 774–781. [Google Scholar] [CrossRef]
  38. Riebe, D.; Ehrman, J.K.; Liguori, G.; Magal, M. ACSM’s Guidelines for Exercise Testing and Prescription; American College of Sports Medicine: Indianapolis, IN, USA, 2018. [Google Scholar]
Figure 1. Flowchart of research tests differentiated by day.
Physiologia 06 00028 g001
Figure 2. Distribution of estimated VO2max by the Rockport test and 20-m shuttle run. Note. These points represent the individual participants. VO2max, maximal oxygen uptake.
Physiologia 06 00028 g002
Table 1. Characteristics of the participants and physical condition variables by group: Rockport Walk Test and 20-m Shuttle Run.
VariableRockport Walk Test20-m Shuttle Run
Sex (n)Female = 12; Male = 36Female = 7; Male = 53
Age (y)21.46 ± 4.3920.63 ± 2.31
BMI (kg/m2)21.38 ± 1.8121.80 ± 1.74
Ruffier index (a.u.)15.36 ± 5.6413.73 ± 4.25
Burpee repetitions (n)22.50 ± 4.0923.27 ± 4.29
VO2max (mL·kg−1·min−1)48.85 ± 5.3439.80 ± 14.58
Note. BMI, body mass index; estimated VO2max values were derived from the Rockport Walk Test and 20-m Shuttle Run equations and were not directly measured by ergospirometry.
Table 2. Multiple linear regression model for the estimated VO2max derived from the Rockport walk test.
ModelPredictorBSECI_LowCI_HighStd. βp
Rockport Walk testIntercept62.6718.0646.40678.935−0.855<0.001
BMI−0.4860.309−1.1090.137 0.123
Ruffier index−0.2420.101−0.445−0.038 0.021
Burpee repetitions0.2120.14−0.070.494 0.137
Sex (Male vs. Female)6.0821.2973.4658.6981.140<0.001
Age−0.4220.133−0.692−0.153 0.003
Note. B = unstandardized regression coefficient; SE = standard error; β = standardized regression coefficient; 95% CI = 95% confidence interval (Low or High value). The dependent variable was estimated VO2max derived from the Rockport Walk Test equation and expressed in mL·kg−1·min−1. BMI = body mass index.
Table 3. Apparent and internally validated performance of the prediction model for estimated VO2max derived from the Rockport Walk Test.
ModelPredictorBSECI_LowCI_HighStd. Betap
20-m Shuttle RunIntercept15.18225.101−35.14265.507−0.4390.548
BMI−0.1010.971−2.0481.847 0.918
Ruffier index−0.5080.397−1.3030.288 0.206
Burpee repetitions1.5510.4020.7462.356 <0.001
Sex (Male vs. Female)7.255.358−3.49217.9930.4970.182
Age−0.4220.733−1.8911.046 0.567
Note. Model performance is reported using R2, RMSE, and MAE. Apparent performance corresponds to the model fitted in the development sample, whereas validated performance was estimated using repeated 10-fold cross-validation. Optimism was calculated as the difference between apparent and validated performances. RMSE = root mean square error; MAE = mean absolute error.
Table 4. Multiple linear regression model for the estimated VO2max derived from the 20-m shuttle run.
ModelnR2_ApparentAdjR2_ApparentRMSE_ApparentR2_CorrectedRMSE_Corrected
Rockport Walk Test480.5520.4983.540.3384.37
20-m Shuttle Run600.3190.25611.930.179
Note. The dependent variable was estimated VO2max derived from the 20-m Shuttle Run equation and expressed in mL·kg−1·min−1.
Disclaimer/Publisher’s Note: The statements, opinions and data contained in all publications are solely those of the individual author(s) and contributor(s) and not of MDPI and/or the editor(s). MDPI and/or the editor(s) disclaim responsibility for any injury to people or property resulting from any ideas, methods, instructions or products referred to in the content.