Article

Changes in Body Composition and Functional Capacity of Antarctic Expedition Participants

Centre for Scientific and Applied Activity in Sports, National Sports Academy “Vasil Levski”, 21, Acad. Stefan Mladenov St., 1700 Sofia, Bulgaria
*
Author to whom correspondence should be addressed.
Physiologia 2026, 6(2), 27; https://doi.org/10.3390/physiologia6020027
Submission received: 15 February 2026 / Revised: 24 March 2026 / Accepted: 2 April 2026 / Published: 4 April 2026
(This article belongs to the Section Exercise Physiology)

Abstract

Background: The number of people working in Antarctica has steadily increased. Identifying the characteristic functional changes in polar expeditioners can help preserve health, enhance work capacity, and improve adaptive potential in specific environments. Objective: This study aimed to evaluate the impact of a short-term (30-day) expedition in Antarctica on selected physiological parameters among expedition participants, depending on their body mass index (BMI). Methods: Thirty-four expedition members, divided into 3 BMI groups, were examined before and after a one-month stay in Antarctica. The assessments included anthropometry, body composition analysis, blood pressure (BP) evaluation, and a cycle ergometer stress test, performed up to 85% of predicted maximal heart rate (PWC85%) with gas analyses and heart rate measured at the 3rd minute after exercise completion (HR3’), used as an indicator of cardiovascular recovery. Results: After the expedition, the participants with normal weight showed a modest but significant increase in body weight and BMI, and non-significant increases in fat mass (FM) and muscle mass (MM); cardiovascular recovery and physical working capacity were improved, while aerobic fitness remained unchanged. In the overweight group, post-expedition body weight and BMI did not change significantly, although small reductions in FM and improvements in MM, BP, PWC85%, and HR3’ were observed. Returning, the participants with obesity demonstrated non-significant improvements in body composition and modest declines in BP, together with a significant improvement in HR3’. Conclusions: Comparative analysis revealed significant differences in post-expedition changes in several functional parameters between the normal-weight and obese groups. Overall, the Antarctic expedition elicited beneficial cardiovascular and functional adaptations, particularly among overweight individuals, while body composition and aerobic capacity remained unchanged across all groups.

1. Introduction

Antarctica presents one of the most extreme environments on Earth, characterized by low temperatures, strong winds, extended photoperiods, and high UV radiation. These factors, along with isolation from the usual social environment and challenging relationships within a limited group of people, pose unique physiological and psychological challenges for individuals who live and work there, particularly for prolonged periods or subjected to sustained strenuous activity [1,2,3,4]. Among the most affected aspects of human health during Antarctic missions, despite their psychological implications, are body composition, physical performance, cardiovascular function, and overall physiological resilience capacity [4,5,6,7]. This requires a new, more holistic approach to assessing the impacts and consequences of the specific expedition environment on human health. A holistic approach emphasizes the uniqueness of each expedition participant, the reciprocal relationship between the participant and the surrounding environment, the individual’s responsibility for maintaining their own health, and society’s responsibility to promote health [8,9].
However, there is still not enough research on how stays and activities in Antarctica affect various aspects of human health. Limited studies are present on the impact of increased workload during active research periods and environmental stressors on the participants in short-term Antarctic expeditions. Metabolic, hematologic, and immunologic changes have been reported among members of the Czech Antarctic expedition, attributed to dietary patterns, physical activities performed, and lifestyle during their stay [10,11,12]. Recent research involving participants in the 32nd Bulgarian Antarctic Expedition (2023–2024) identified alterations in some blood oxidative stress parameters, including serum total antioxidant capacity, antioxidant enzyme activities, and glutathione concentrations, as well as changes in trace elements, lipid profile, and hematological markers such as erythrocyte sedimentation rate and ferritin [13]. Additionally, cardiovascular functionality was assessed through anthropometric, physiological, and biochemical indicators [14], along with changes in biological age and 10-year mortality risk [15].
Despite the growing number of participants participating in Bulgarian Antarctic expeditions, data on the short-term physiological adaptations to the Antarctic environment remain limited, particularly with respect to differences related to their body weight status. This study aimed to examine the multifactorial effect of a short-term (30-day) summer stay in Antarctica on body composition and functional capacity of participants in the 32nd Bulgarian polar expedition, divided into three body mass index (BMI) categories. BMI was used as the primary grouping criterion, as it is generally associated with similar patterns of physical activity, dietary habits, and health status. By comparing changes in body composition, cardiovascular parameters, and physical working capacity across BMI categories, this study may contribute to a better understanding of how different body weight statuses may influence functional adaptation to the extreme Antarctic environment and workload. These findings could provide valuable insights for enhancing performance and safeguarding the health of expedition members, particularly in remote environments with limited medical support. The results may also highlight the importance of contributing to the development of more effective health-monitoring protocols and tailored nutritional and physical training programs for personnel preparing to participate in polar expeditions. Moreover, the findings will enrich the broader field of holistic polar medicine and research on human adaptation to extreme conditions.

2. Results

The primary changes observed after the expedition across the entire sample were related to heart rate recovery at the third minute after completion of the stress test (HR3′). In all three groups, this parameter decreased significantly, indicating enhanced cardiovascular recovery (i.e., a faster return to resting levels). The greatest number of statistically significant post-expedition changes were observed in the second group; in addition to HR3’, these included mean muscle mass (MM%), systolic blood pressure (SBP), mean physical working capacity at 85% of predicted maximal heart rate (PWC85%), and mean value of relative physical working capacity at 85% of predicted maximal heart rate (PWC85%R). In the first group, a significant increase in PWC85% was also found after the expedition. The results and a detailed description of the measured parameters for each group are presented below, along with statistically significant differences both within groups (pre- vs. post-expedition) and between groups (Section 2.4). The individual data of anthropometric, physiological, and functional characteristics of participants before (Table S1) and after (Table S2) the expedition, as well as the individual differences in the tested parameters (Table S3), are given in the Supplementary Materials.

2.1. Anthropometric, Physiological, and Functional Characteristics of Participants with Normal Weight

Table 1 provides a comprehensive overview of the anthropometric, physiological, and functional characteristics of participants in the Antarctic expedition who were classified before the journey as having normal weight (Group 1, with a BMI < 25 kg/m2). Compared to pre-expedition values, after the expedition, the mean body weight and mean BMI increased significantly. Mirroring the observed weight gain; the mean fat mass (FM%) and the MM% showed a slight, non-significant increase.
After the expedition, the mean SBP and diastolic blood pressure (DBP) dropped slightly, with neither change being statistically significant.
Participants demonstrated a significant improvement in PWC85% after the expedition. This increase highlights a notable gain in physical working capacity. The mean value of PWC85%R also rose. This change did not reach statistical significance (p = 0.092), though it suggested a trend toward enhanced performance.
The mean systolic blood pressure recovery at the 3rd minute (SBP3’) and diastolic blood pressure recovery at the 3rd minute (DBP3’) decreased non-significantly in participants after the expedition. The mean HR3’ statistically significantly decreased, indicating better cardiovascular recovery following physical exertion.
Compared to pre-expedition values, the mean predicted maximal oxygen uptake (VO2max) of participants, as well as the mean percentile estimation of maximal oxygen uptake (VO2maxP), showed a slight, non-significant decline.

2.2. Anthropometric, Physiological, and Functional Characteristics of Overweight Participants

Table 2 presents the mean and standard deviation of key anthropometric, physiological, and functional variables for overweight participants (Group 2, with a BMI between 25.00 kg/m2 and 29.99 kg/m2) recorded both before and after the Antarctic expedition.
After the expedition, there were non-significant decreases in both mean weight and BMI in this group. The mean FM% decreased slightly, though this reduction was not statistically significant. A significant increase in MM% (was observed, indicating improved muscular profile post-expedition.
Compared to pre-expedition values, the mean SBP and mean DBP decreased notably, with the SBP reduction reaching statistical significance (Table 2).
After the expedition, significant improvement was observed in mean PWC85% (and mean PWC85%R of participants, indicating a significant rise.
The observed post-expedition decrease in the mean SBP3’ and the mean DBP3’ was without statistical significance. There was a statistically significant reduction in mean HR3’ by 10 bpm, suggesting improved cardiovascular recovery.
Both the mean predicted VO2max and the mean VO2maxP increased modestly, but not significantly in participants after the expedition.

2.3. Anthropometric, Physiological, and Functional Capacity Characteristics of Participants with Obesity

The data in Table 3 presents a comparison of the anthropometric, physiological, and functional capacity characteristics of participants with obesity (Group 3, with a BMI of 30 kg/m2 or greater) before and after the expedition. Although there were some fluctuations in the tested parameters, no significant changes were observed between values before and after the expedition, except for HR3’. The mean HR3’ dropped. Performance and aerobic fitness indicators, such as predicted VO2max and its percentile ranking, declined slightly after the expedition. The mean percentile estimation of predicted VO2max decreased, but the change was not statistically significant. Power output measures, PWC85% and PWC85%R, also showed only a slight, non-significant increase after the expedition.

2.4. Comparison Between Groups Before and After the Antarctic Expedition

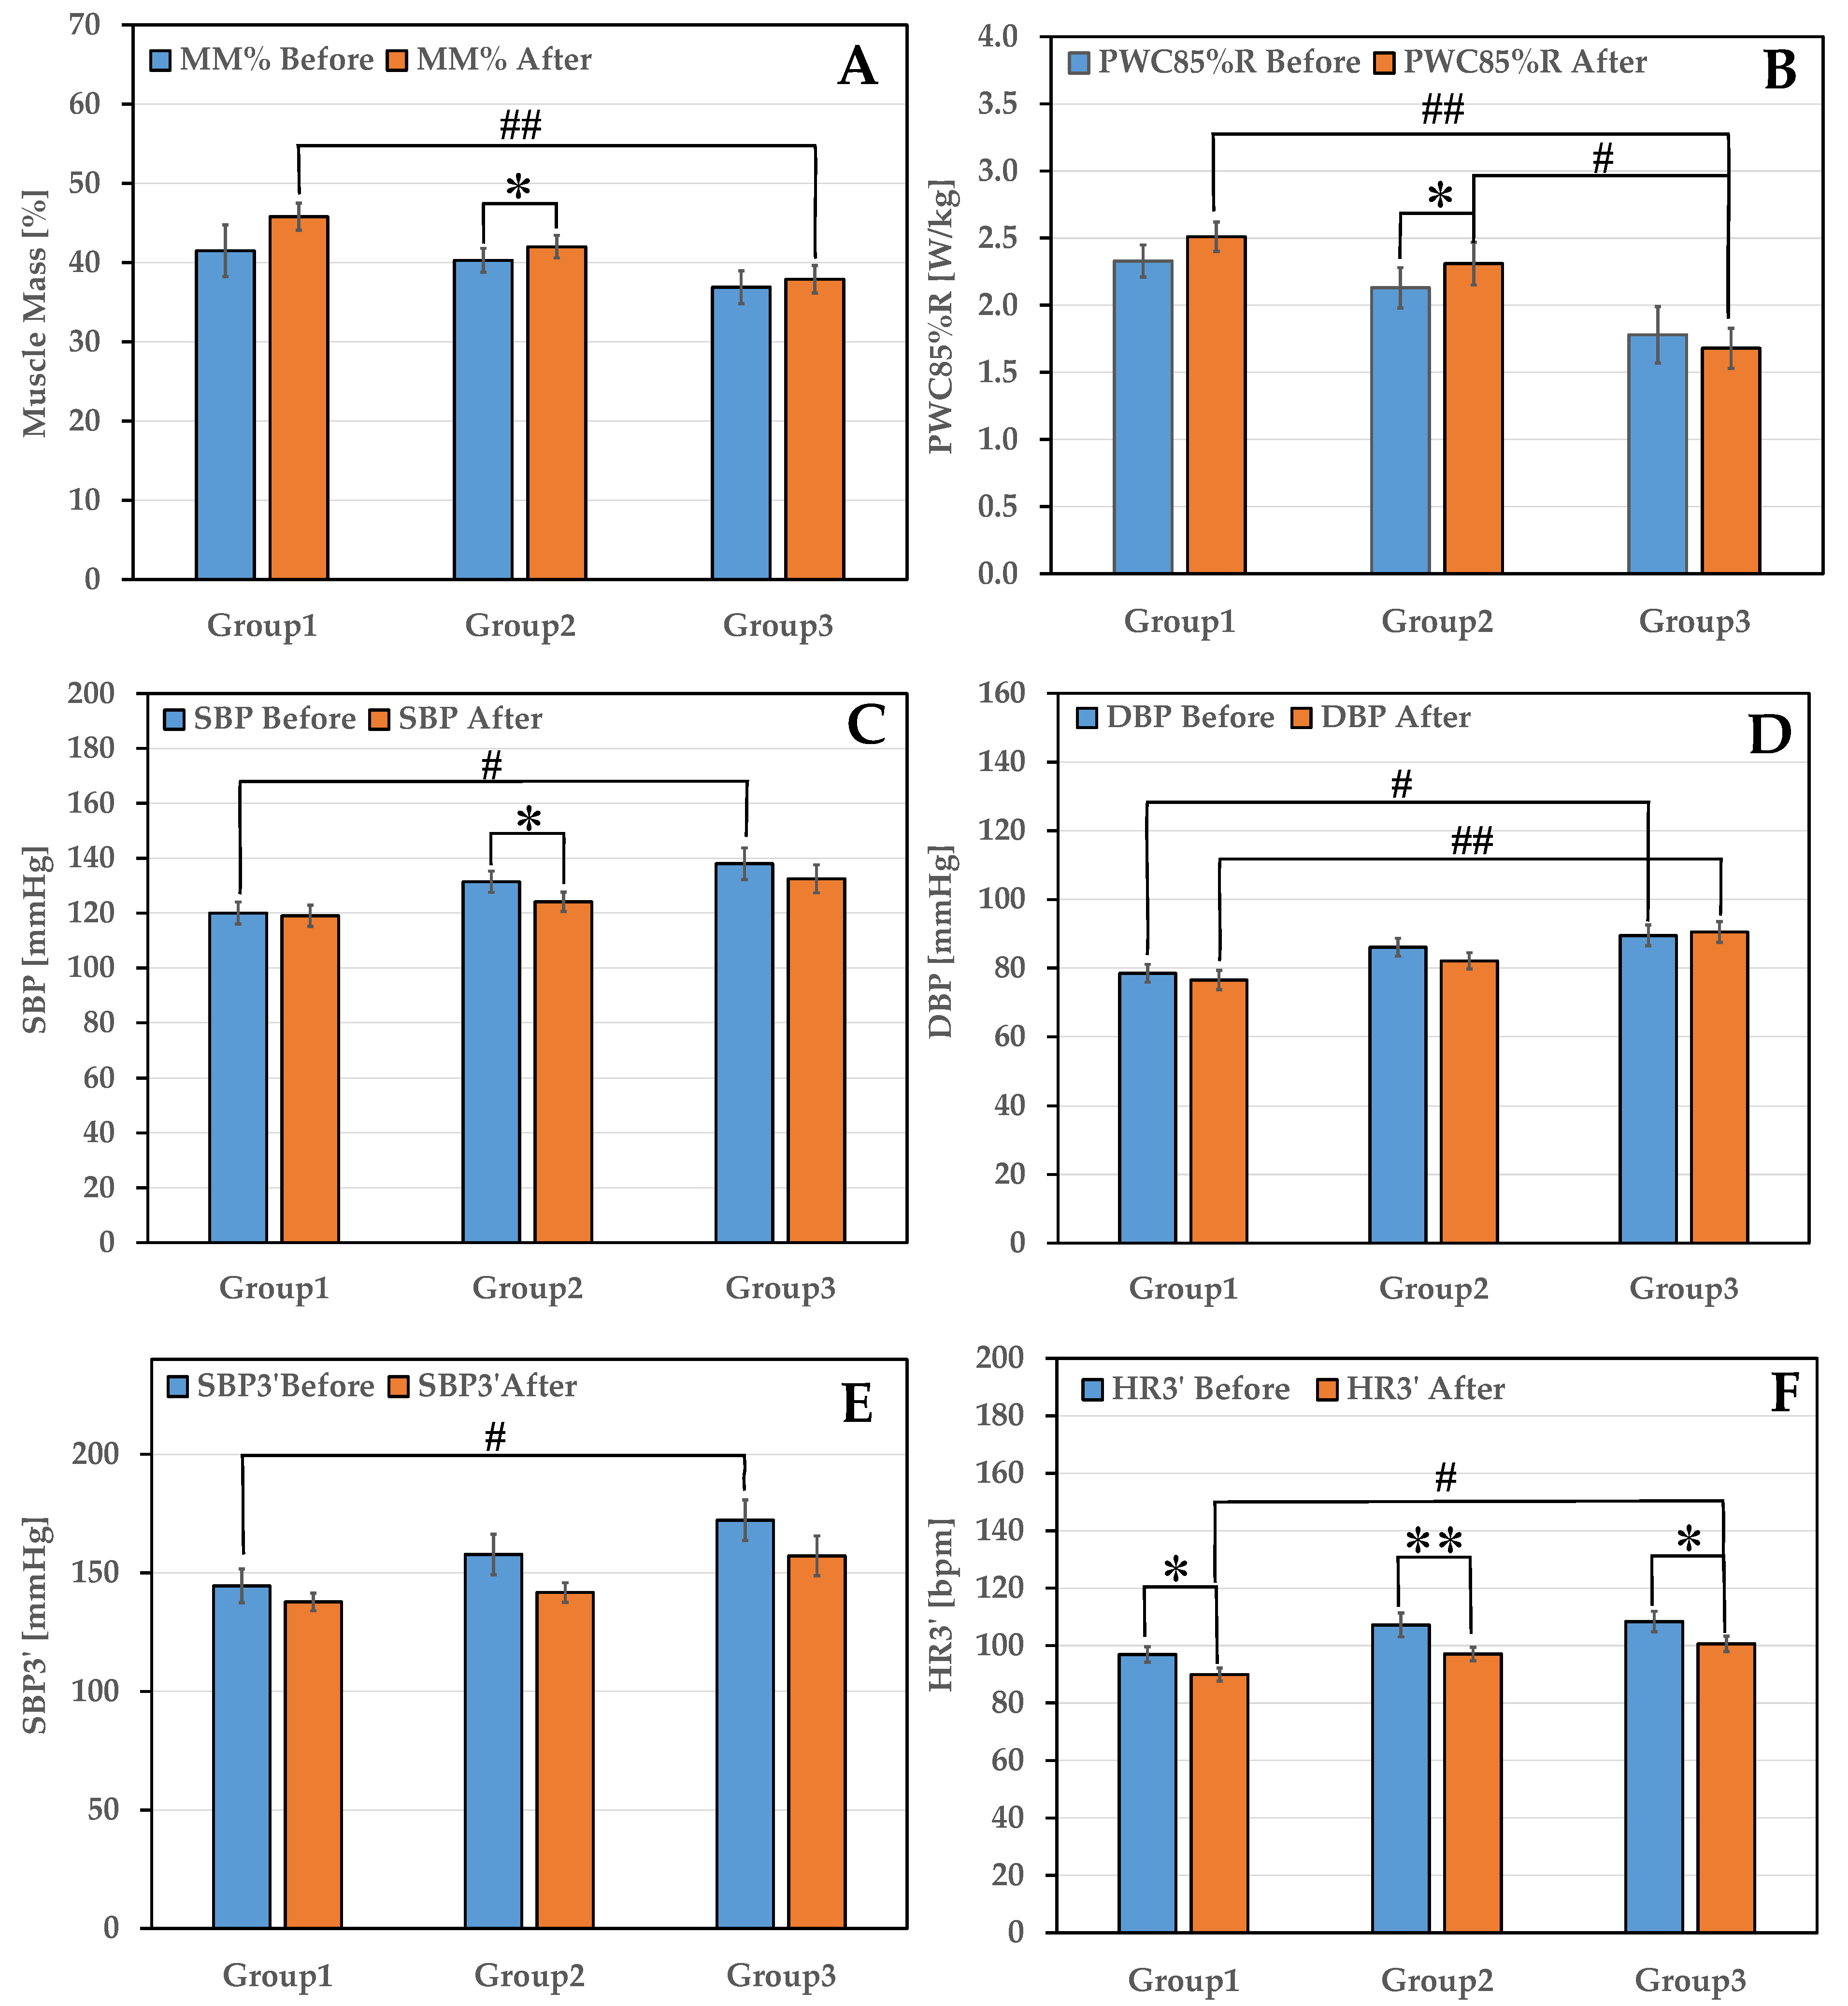
Figure 1 shows the statistical significance of differences in mean values between the groups, both before and after the Antarctic expedition. Predictably, body weight, BMI, and FM% varied significantly between groups, as BMI initially categorized participants before the expedition. Moreover, only three participants changed their BMI categories after the expedition: two women moved from overweight to normal weight, and one man shifted from normal weight to overweight (Supplementary Materials, Tables S1–S3). The MM% showed a significant difference between Group 1 and Group 3 after the expedition (Figure 1A), indicating a greater gain in muscle mass in Group 1 (3.3%) than in Group 3 (1%). The PWC85%R differed significantly after the expedition between Group 1 and Group 3, as well as between Group 2 and Group 3. Before the expedition, SBP3’ was significantly greater in Group 3 vs Group 1 (Figure 1B). The SBP was significantly greater in Group 3 vs Group 1 before the expedition, while the DBP was significantly greater in Group 3 vs Group 1 both before and after the expedition (Figure 1C,D). The important indicators of aerobic capacity, VO2max and its percentile estimation (VO2maxP), showed no statistically significant differences between groups before and after the expedition (Figure 1E). Additionally, HR3’ was significantly lower in Group 3 vs Group 1 only after the expedition (Figure 1F).
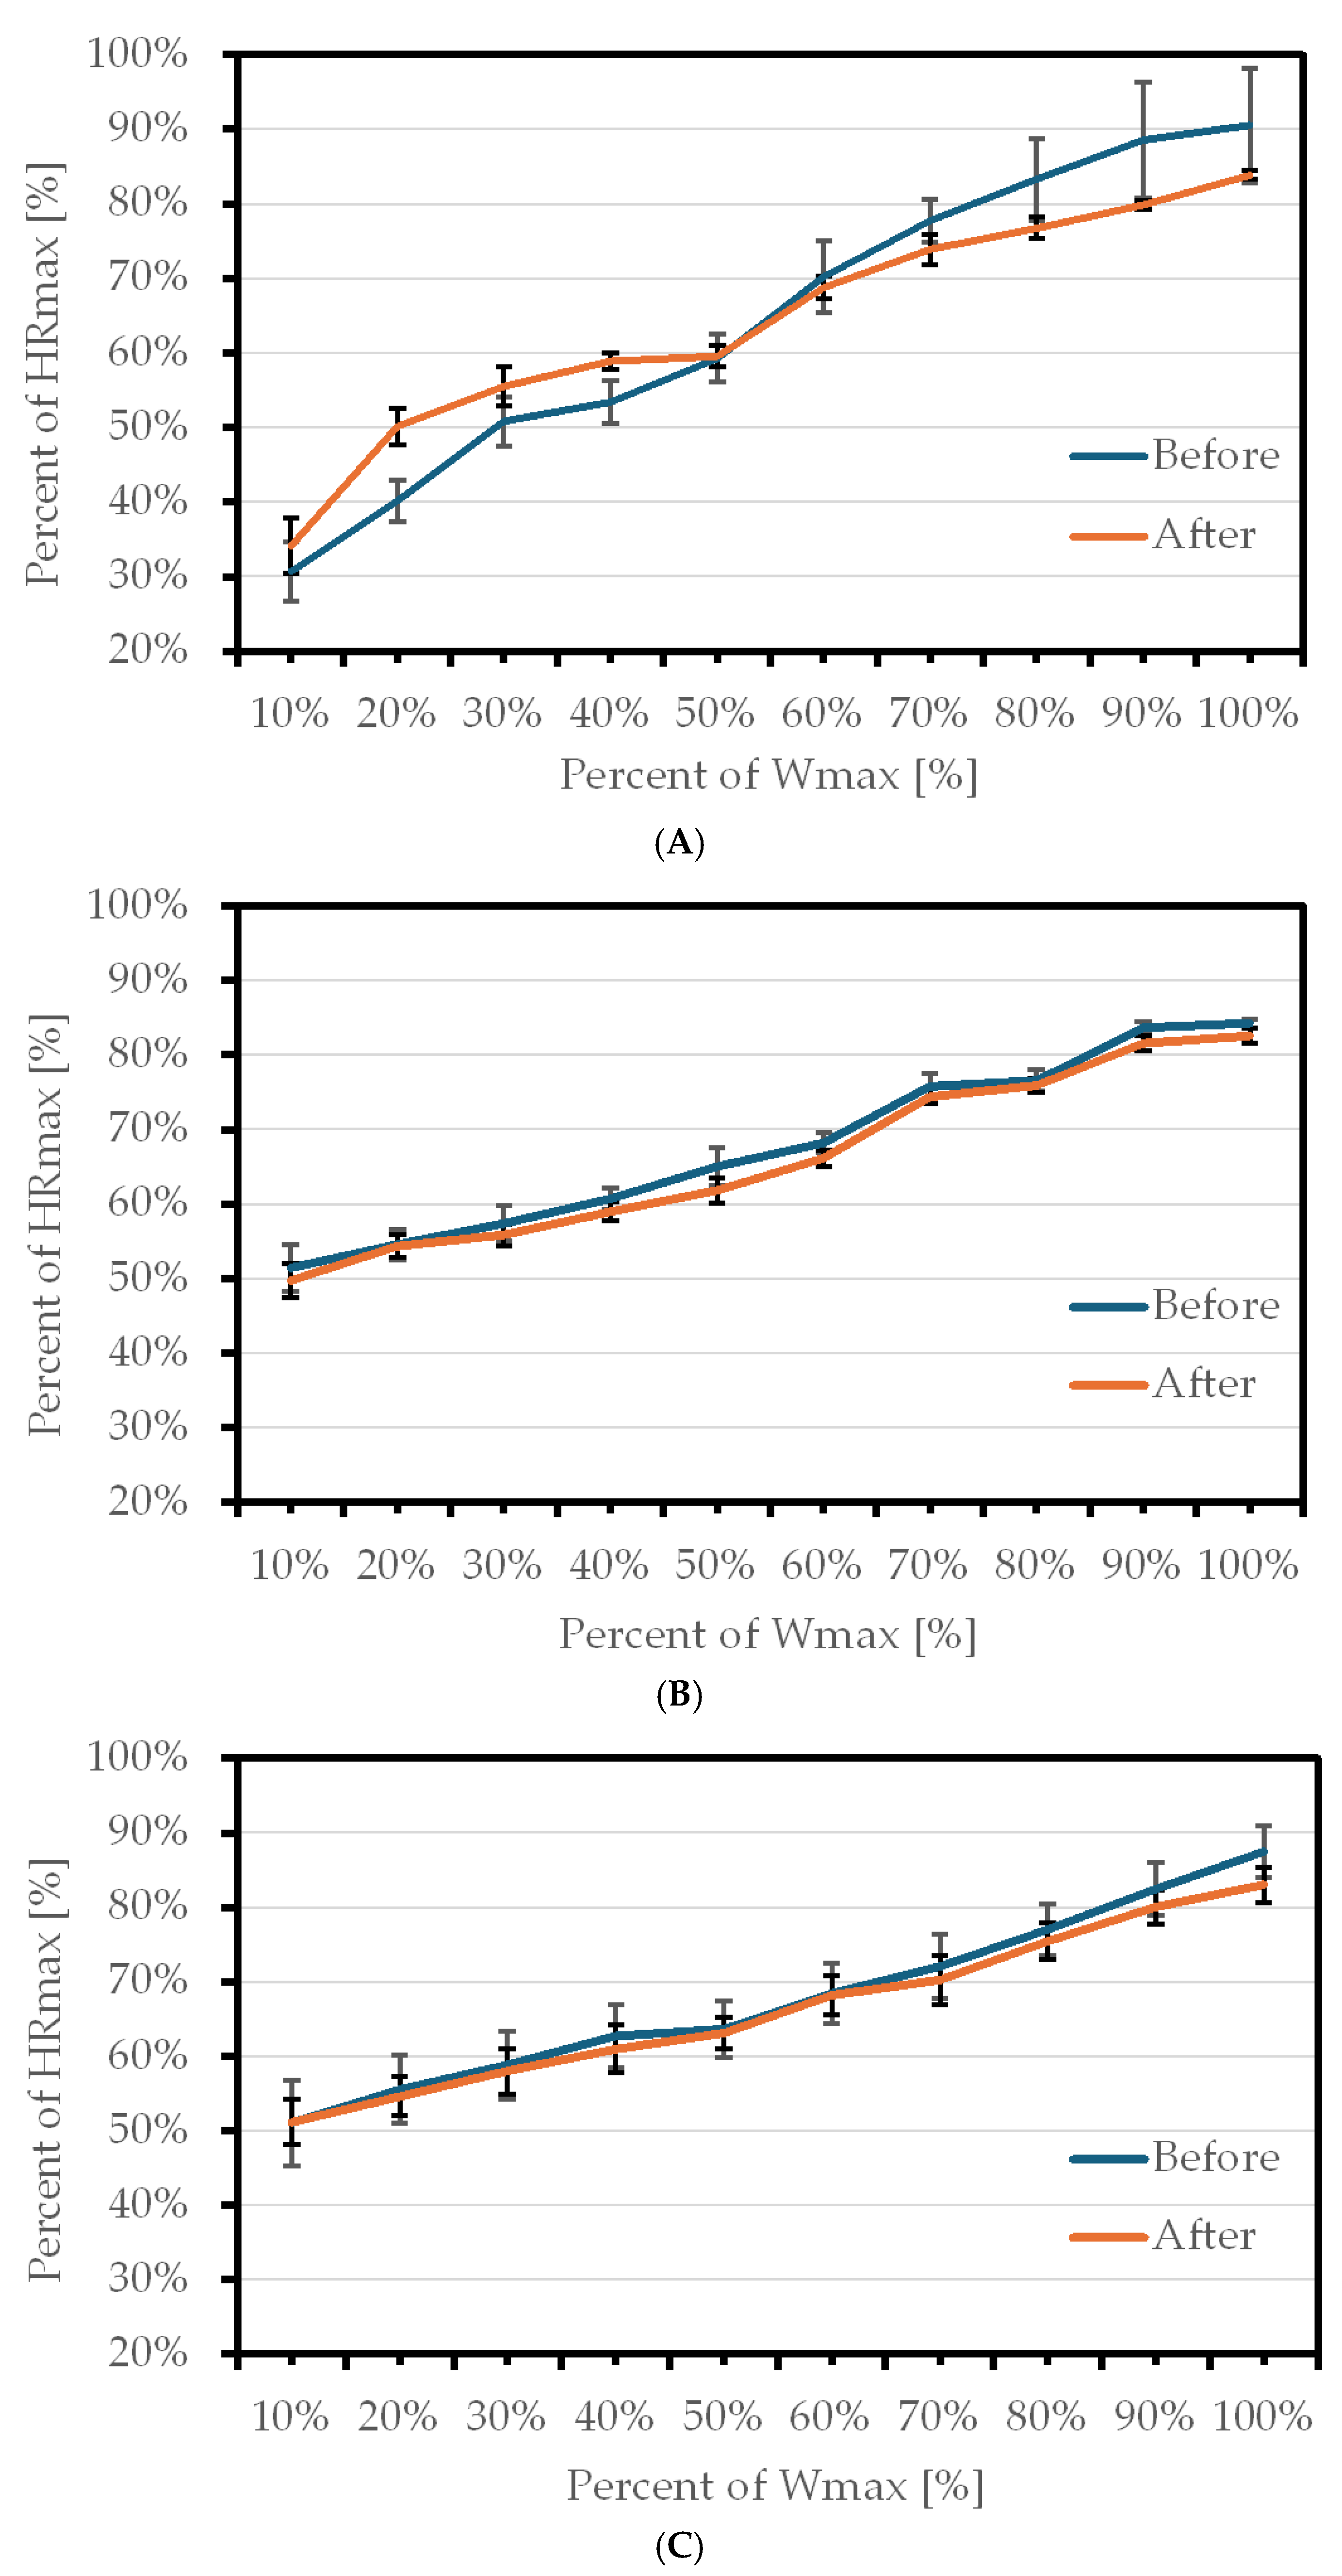
Heart rate responses during the submaximal incremental test before and after the expedition are shown in Figure 2. The figure illustrates the heart rate, expressed as a percentage of predicted maximal heart rate (HRmax) during the submaximal stress test, plotted against workload intensity, expressed as a percentage of the maximum power achieved in the final stage (Wmax), enabling a clear comparison of cardiovascular responses across different levels of exertion. Group 1, which demonstrates the greatest endurance and the highest power output per kilogram of body weight (see Table 1), performs the test using the widest range of heart rates—from 30% up to approximately 85% of HRmax. In contrast, the other two groups (Group 2 and Group 3) utilize only about 50% of their maximum heart rate even at the lowest workload intensity.

3. Discussion

Antarctica has been designated a scientific reserve, where two main activities are accepted to be carried out: international scientific research and the protection of the Antarctic environment [16]. The number of scientists who visit and work in Antarctica has steadily increased over the years, and the scientific objectives they pursue have become increasingly ambitious, involving a broader scope of research tasks and logistics support. Travel, harsh polar conditions, and intensive physical work expose expedition participants to substantial psychological and physiological stress [17]. Identifying characteristic biochemical and functional changes in individuals participating in polar expeditions may contribute to maintaining health, enhancing work capacity, and improving the adaptive potential of the human body in polar environments. Most previous studies have focused on general physiological responses to polar conditions, while comparatively little attention has been paid to how body composition and BMI may influence adaptive responses during expeditions. In this study, the BMI categories, according to the World Health Organization classification [18], were selected as the primary grouping criterion, as they reflect relatively homogeneous patterns of physical activity, dietary habits, and health status. Given the different, but always limited, number of participants in the polar expeditions, further stratification by additional variables (such as age, sex, physical activity, etc.) would have resulted in a reduction in the statistical power of the analyses and may have affected the level of generalizability of the findings. Nevertheless, the study provides significant preliminary insights into the studied effects as a result of a short-term (30-day) polar expedition.
Concerning the influence of individual body weight status on physiological adaptations, it was found that overweight individuals frequently participate in polar expeditions. For example, among the participants in the 30th Indian Antarctic Scientific Expedition, 40% were overweight, and 25% were obese, with a progressive rise in mean BMI recorded during the expedition [19]. Overweight with a mean BMI above 25 kg/m2, and total energy intake exceeding the daily recommended values have also been documented in members of the Czech Antarctic expedition [10]. In the present study, 41.17% of participants were classified as overweight (25 ≤ BMI < 30 kg/m2), and 29.41% as obese (BMI ≥ 30 kg/m2). Considering that overweight and obesity predispose individuals to numerous pathological conditions, including cardiovascular diseases [20,21], monitoring changes in the functional status of these participants is essential for preventing adverse health events. To ensure a more precise assessment of participants’ functional capacity in the 32nd Bulgarian Antarctic expedition, individuals were divided into three groups based on their BMI.
Overall, after the Antarctic expedition, participants with normal weight (Group 1) exhibited a modest but significant increase in mean body weight and BMI. Despite this, FM% rose only slightly, suggesting that the weight gain did not primarily reflect an increase in adipose tissue. The rise in MM%, although not statistically significant, may reflect physiological adaptation to increased physical activity [22]. The sum of insignificant FM% and MM% increases leads to a significant increase in body weight and BMI. In this group, cardiovascular recovery following the stress test improved, as indicated by lower post-test heart rates. Physical working capacity increased significantly, but PWC85%R increased non-significantly, mainly due to increased body mass. The mean VO2max percentile corresponded to the 50th percentile, or the “Fair” category, for this age group according to American College of Sports Medicine (ACSM) norms [23]. These findings suggest that adaptation to the demanding conditions of the Antarctic expedition resulted in a modest increase in body weight, functional capacity, and recovery capabilities.
In Group 2 (participants classified as overweight, with a BMI between 25 and 30 kg/m2), no statistically significant changes in body weight or BMI were observed following the expedition. However, both measures exhibited a subtle decreasing trend, as did FM%, indicating a potential, though modest, improvement in body composition over the course of the study (see Table 2). Evidence shows that regular physical activity typically produces only modest reductions in total body mass. However, these changes are physiologically meaningful and largely reflect decreases in adipose tissue [24], including visceral fat [25,26]. Such reductions result from exercise-induced energy deficits and are comparable to those achieved through dietary restriction [27]. Although exercise alone may have a limited impact on overall weight, it confers important metabolic benefits. These include preserving fat-free mass [28], lowering circulating lipid levels [26,29], and reducing ectopic fat accumulation in organs such as the liver [25,26], heart [30,31], and pancreas [32], even without marked fat loss. Collectively, these adaptations can positively influence physiological function. Consistent with this evidence, the present study demonstrated statistically significant improvements in MM%, SBP, PWC85%, PWC85%R, and HR3’ in this group (Table 2). These findings indicate that the expedition contributed to enhanced cardiovascular fitness and muscular development in overweight participants, despite the relative stability of most anthropometric parameters.
In Group 3 (participants with obesity, BMI ≥ 30 kg/m2), body weight, BMI, and MM% showed slight, non-significant increases after the expedition, while FM% showed a minor, non-significant decrease (Table 3). The energy dynamics reflected by food intake, energy expenditure, body fat, and body weight are more likely attributable to the physical activity associated with work and leisure during the expedition [5]. Cold-induced effects are less likely to contribute substantially because modern expeditions minimize cold exposure through insulated clothing and heated living spaces. Furthermore, Bulgarian Antarctic expeditions occur during the summer season, characterized by relatively mild temperatures and short stays (1 month for the group examined in this study). Notably, mean SBP and DBP both showed modest declines after the expedition, which, together with a significantly reduced HR3’, suggests a possible improvement in cardiovascular recovery. Heart rate during recovery from submaximal functional exercise reflects the reactivation of the parasympathetic nervous system and serves as a reliable, sensitive, and easily applicable indicator of the functional state of the cardiovascular system and autonomic regulation. Faster heart-rate recovery is associated with higher physical fitness and better overall health status [33,34]. It should be mentioned that heart rate recovery is known to be affected by multiple factors, including physical fitness level, environmental stress, hydration status, and fatigue [35,36,37], especially given the specificity of the conditions encountered during the Antarctic expedition. Additionally, PWC85% and PWC85%R showed slight, though statistically non-significant, increases. However, in Group 3, the VO2max percentile, particularly after the expedition, fell within the “Poor” or even “Very Poor” range for the respective age category according to the American College of Sports Medicine standards [23]. These results indicate that for individuals with obesity, such Antarctic expeditions may impose considerable physiological demands but do not produce dramatic health changes over the short observation period. Nevertheless, trends toward improvement in physiological condition were evident.
The results of this study (Figure 1) show differences in physiological responses among the three BMI-based groups following the Antarctic expedition. The significant differences in weight and BMI between groups persisted after the expedition, suggesting that the Antarctic expedition stay did not substantially alter body composition or the classification boundaries between groups. In practice, participants generally maintained their usual diet and physical activity during the expedition. They followed preferred dietary patterns (as fish-based, vegetarian, or vegan diets), with continuous access to diverse food. Those who exercised regularly continued activities such as jogging, yoga, and aerobics. Fieldwork typically lasted 6–8 h per day, including travel to and from sampling or study sites, but was suspended during severe weather conditions.
The lack of significant differences in most physiological indicators between Group 1 (normal weight) and Group 2 (overweight) before and after the expedition indicates that a moderately elevated BMI does not substantially affect cardiovascular status, body composition, or functional capacity. This implies that participants with normal weight and those with overweight share a similar physiological profile and exhibit comparable adaptations to the expedition’s physical demands. Previous studies have shown that overweight individuals often have a functional profile like that of normal-weight individuals, whereas significant differences emerge when comparing normal-weight individuals with those who are obese [38,39]. In contrast, the marked differences observed between Group 1 and Group 3 reflect the well-documented threshold effect of obesity, wherein increased fat mass, less favorable hemodynamic status, and lower work capacity become physiologically meaningful [40,41,42,43]. The findings of this study align with scientific literature and indicate that overweight generally does not cause significant functional limitations. Obesity is linked to notable changes in cardiorespiratory fitness, heart rate recovery, and metabolic processes [40,41,42,44].

4. Materials and Methods

4.1. Participants

The study involved 34 participants from the 32nd Bulgarian Antarctic Expedition (2023–2024), comprising 28 men and 6 women, with a mean age of 43.60 ± 8.14 years (range: 25–59 years). Expedition participants arrive at the Bulgarian Antarctic base St. Kliment Ohridski in groups because of limited accommodation on the base. They remain there for varying periods depending on the specific tasks they have to perform. All participants included in this study stayed at the base for 30 days. This Bulgarian base is a seasonal summer station operating from November to March, situated on Livingston Island in the South Shetland Islands (coordinates: 62°38′27″ S, 60°21′53″ W) at an elevation of 12–15 m above sea level [45]. During the austral summer on Livingston Island, temperatures fluctuated near freezing with a mean around 0 °C, relative humidity remained consistently high between 90% and 100%, and wind speeds ranged from 15 to 45 km/h, occasionally reaching up to 80 km/h [https://www.meteoblue.com/en/weather/historyclimate/weatherarchive/livingston-island_antarctica; (accessed on 15 March 2026)]. Each summer season, the station hosts researchers from various scientific fields [45], as well as logistic workers. Before departure, all participants underwent a medical evaluation, including medical history, physical examination, basic laboratory tests, and dental status. The expedition organizers and the medical team determined the eligibility for participation jointly.
For this study, physiological and biochemical assessments were conducted twice: in November–December 2023, before the expedition’s departure, and in January 2024, within 7 days of the participants’ return to Bulgaria. The time frame of 7 days after returning was selected to assess physiological adaptations in the participants rather than travel-related post-expedition effects. The recovery trajectory following long-distance travel across multiple time zones is variable and largely depends on the re-establishment of the sleep–wake cycle. In individual cases, the recovery period may range from 3 to 11 days, typically lasting around one week [46,47]. Participants were not assessed simultaneously, as the stress test required a variable amount of time to complete. Consequently, they were scheduled in groups of 10–12 per day to attend the laboratory. Over 90% of participants (31 individuals) were tested between the 5th and 7th day after return, while two participants were assessed on the 4th day, and only one on the 3rd day due to various circumstances.
Monitoring the participants’ physical activity and dietary patterns during their stay at the Antarctic base was outside the scope of the present study. The observed changes in body composition, cardiovascular function, and physical working capacity reflected the combined influence of environmental exposure, occupational workload, and lifestyle factors encountered during the expedition.
All participants were fully informed about the study’s objectives and procedures and provided written informed consent. The study was approved by the Ethical Committee of the National Sports Academy, Sofia, Bulgaria (Ethical Approval No.EC-NSA-2023-003).

4.2. Anthropometry and Body Composition

Height was measured using a SECA stadiometer (SECA GmbH & Co. KG, Hamburg, Germany) with an accuracy of 0.1 cm. Body composition was determined using a body composition monitor, TANITA RD-545 INNER SCAN (TANITA Corporation, Tokyo, Japan). To minimize variability related to hydration, recent activity, and sensor contact, participants were measured in the morning (8–9 a.m.) after voiding, in light clothing, and barefoot. Participants were also instructed to avoid vigorous exercise, alcohol, and caffeine for at least 12 h prior to assessments. The TANITA RD 545 uses a potentiometric method that minimizes the influence of resistance between the electrodes and the skin.
Body mass was measured with a precision of 0.05 kg, and BMI (kg/m2) was calculated. The FM% and MM% percentages were then determined.
Based on BMI before the expedition, participants were grouped according to World Health Organization (WHO) classification into three categories: Group 1—normal weight (BMI < 25 kg/m2), Group 2—overweight (25 ≤ BMI < 30 kg/m2), and Group 3—obese (BMI ≥ 30 kg/m2) [18].

4.3. Stress Test

To determine the functional capabilities of the expedition participants, an exercise stress test was performed on a bicycle ergometer (Ergoline ErgoSelect VIAsprint 150P, Ergoline GmbH, Bitz, Germany) in a laboratory with the temperature maintained at 25 °C to ensure standardized environmental conditions and comparability of results. The initial workload was set at 30 W, increasing by 30 W every 1.5 min until the heart rate reached 85% (HR85%) of the maximum predicted heart rate (MPHR = 220—age) [48]. Participants were instructed to maintain a pedaling cadence of 60 revolutions per minute. Testing was conducted under continuous: gas analysis (Quark CPET, COSMED, Rome, Italy), electrocardiographic monitoring (ECG), and automatic blood pressure measurement based on Korotkoff sounds. All procedures followed the requirements for conducting the Exercise Stress Test [49]. The power output achieved at HR85% was used as an indicator of physical working capacity (PWC85%), as was the physical working capacity at 170 bpm (PWC170) for individuals around 20 years old [50]. To enable comparison among individuals with different body weights, we calculated the relative PWC85% per kilogram of body weight (PWC85%R). Recognizing that 85% of MPHR corresponds to 80% of maximal oxygen uptake (VO2max) [51], we estimated participants’ predicted maximal oxygen uptake and calculated a percentile-based estimate (VO2maxP) according to the ACSM [23].

4.4. Physical Examination

In addition, physiological parameters such as heart rate (HR [bpm]), systolic blood pressure (SBP [mmHg]), and diastolic blood pressure (DBP [mmHg]) were measured both at rest and again three minutes after the completion of the exercise stress test (denoted as HR3’, SBP3’, and DBP3’) using standard clinical procedures.

4.5. Statistics

Descriptive statistics were performed, and the normality of distribution for the studied parameters was assessed using the Shapiro–Wilk test. To verify the significance of differences within the groups, with normally distributed data before and after the expedition, a paired Student’s t-test was used; for other variables, the Wilcoxon test was applied. To assess differences in means between groups before and after the expedition, one-way analysis of variance (ANOVA) with the Bonferroni post hoc test was used for normally distributed variables. For the remaining variables, the Kruskal–Wallis test with Dunn’s post hoc test was applied.

5. Conclusions

In conclusion, the Antarctic expedition at the Bulgarian base was associated with group-specific physiological responses among participants, with individuals of moderate BMI (Group 2) demonstrating the most pronounced improvements in cardiovascular recovery and physical working capacity. Participants with a normal BMI (Group 1) generally maintained their baseline fitness levels, suggesting that lower adiposity may protect health metrics under extreme conditions. Participants with higher BMI (Group 3) showed limited adaptive responses, highlighting potential challenges in achieving significant cardiometabolic benefits from short-term (30-day summer) expedition load in this cohort.
These findings should be interpreted with caution, as the study did not directly assess factors that may have contributed to the observed responses, such as physical workload, daily physical activity, dietary intake, or environmental exposure. Therefore, the mechanisms underlying the group differences remain unclear.
Nevertheless, the results suggest that individuals with obesity participating in Antarctic expeditions may be considered a distinct group requiring enhanced and more holistic medical supervision. Such supervision should include rigorous weight monitoring, structured physical activity, and a personalized nutrition plan tailored to the specific needs of individuals with obesity. These targeted measures can facilitate better individual adaptation to the expedition environment and reduce potential health risks.

Supplementary Materials

The following supporting information can be downloaded at: https://www.mdpi.com/article/10.3390/physiologia6020027/s1, Table S1: Individual anthropometric, physiological, and functional data for participants before the Antarctic expedition; Table S2: Individual anthropometric, physiological, and functional data for participants after the Antarctic expedition; Table S3: Differences between the individual data before and after the Antarctic expedition.

Author Contributions

Conceptualization, L.P. and A.A.; methodology, B.P., M.Z., I.B. and T.S.; validation, L.P.; formal analysis, B.P., M.Z., I.B. and T.S.; investigation, B.P., M.Z., I.B. and T.S.; resources, A.A.; data curation, L.P.; writing—original draft preparation, L.P. and A.A.; writing—review and editing, L.P. and A.A.; visualization, L.P.; supervision, A.A.; project administration, A.A.; funding acquisition, A.A. All authors have read and agreed to the published version of the manuscript.

Funding

This work was supported by the Bulgarian Ministry of Education and Science through the National Centre for Polar Studies of Bulgaria, and Sofia University “St. Kliment Ohridski” in the framework of the National Program for Polar Studies 2022–2025 (grant number 70-25-101/23.06.2025) and grant CRAS-13/18.02.2025 of the National Sports Academy, Bulgaria.

Institutional Review Board Statement

The study was conducted in accordance with the Declaration of Helsinki and approved by the Ethics Committee of the National Sports Academy (protocol No.EC-NSA-2023-003/15 January 2025).

Informed Consent Statement

Informed consent was obtained from all subjects involved in the study.

Data Availability Statement

The data presented in this study are available on request from the corresponding author.

Acknowledgments

The authors sincerely thank all participants, the National Centre for Polar Studies of Bulgaria, and the National Sports Academy, Bulgaria for their support.

Conflicts of Interest

The authors declare no conflicts of interest. The funders had no role in the design of the study; in the collection, analyses, or interpretation of data; in the writing of the manuscript; or in the decision to publish the results.

Abbreviations

The following abbreviations are used in this manuscript:
ACSMAmerican College of Sports Medicine
BMIBody mass index
BPBlood pressure
DBPDiastolic blood pressure
DBP3’Diastolic blood pressure recovery at 3rd minute
FMFat mass
HRHeart rate
HR3’Heart rate recovery at 3rd minute
MMMuscle mass
MPHRMaximum predicted heart rate
PWCPhysical working capacity
PWC85%Physical working capacity at 85% of predicted maximal heart rate
PWC85%RRelative physical working capacity at 85% of predicted maximal heart rate
SBPSystolic blood pressure
SBP3’Systolic blood pressure recovery at 3rd minute
VO2maxMaximal oxygen uptake
VO2maxPPercentile estimation of maximal oxygen uptake

References

  1. Sandal, G.M.; Leon, G.R.; Palinkas, L.A. Human challenges in polar and space environments. Rev. Environ. Sci. Biotechnol. 2006, 5, 281–296. [Google Scholar] [CrossRef]
  2. Hattersley, J.; Wilson, A.J.; Gifford, R.; Facer-Childs, J.; Stoten, O.; Cobb, R.; Thake, C.D.; Reynolds, R.M.; Woods, D.; Imray, C. A comparison of the metabolic effects of sustained strenuous activity in polar environments on men and women. Sci. Rep. 2020, 10, 13912. [Google Scholar] [CrossRef] [PubMed]
  3. Alfano, C.A.; Bower, J.L.; Connaboy, C.; Agha, N.H.; Baker, F.L.; Smith, K.A.; So, C.J.; Simpson, R.J. Mental health, physical symptoms, and biomarkers of stress during prolonged exposure to Antarctica’s extreme environment. Acta Astronaut. 2021, 181, 405–413. [Google Scholar] [CrossRef]
  4. Wilson, A.J.; Gifford, R.M.; Crosby, H.; Davey, S.; Taylor, N.; Eager, M.; Thake, C.D.; Imray, C.H.E. Changes in body composition and average daily energy expenditure of men and women during arduous extended polar travel. PLoS ONE 2024, 19, e0308804. [Google Scholar] [CrossRef] [PubMed]
  5. Simpson, A. The effect of Antarctic residence on energy dynamics and aerobic fitness. Int. J. Circumpolar Health 2010, 69, 220–235. [Google Scholar] [CrossRef][Green Version]
  6. Anton-Solanas, A.; O’Neill, B.V.; Morris, T.E.; Dunbar, J. Physiological and cognitive responses to an Antarctic expedition: A case report. Int. J. Sports Physiol. Perform. 2016, 11, 1053–1059. [Google Scholar] [CrossRef]
  7. Thuany, M.; Viljoen, C.; Gomes, T.N.; Valero Burgos, E.; Knechtle, B.; Costa, R.; Steinach, M.; Scheer, V. Antarctic expeditions: A systematic review of the physiological, nutritional, body composition and psychological responses to treks across the continental ice. Sports Med. 2025, 55, 1145–1163. [Google Scholar] [CrossRef]
  8. Makhinson, M.; Pollack, L.; Hallowell, R.; Murray, C.H.; Maddock, J.E.; Stewart, S.M.; Basu, A.; King, D.; Hansen, H. A Consensus Statement for Ecological Medicine: Moving Toward Connection-Based Medicine. Ecohealth 2026, 23, 153–166. [Google Scholar] [CrossRef]
  9. Nath, R.; Sindwani, P. Public Health in Antarctica. Cureus 2023, 15, e50263. [Google Scholar] [CrossRef]
  10. Žákovská, A.; Zezulová, O. Some of the metabolic changes in expedition members caused by diet and activities performed during a stay at the Czech Antarctic base. Czech Polar Rep. 2016, 6, 13–20. [Google Scholar] [CrossRef]
  11. Žákovská, A.; Zezulová, O. Changes in haematological parameters during a summer expedition in Antarctica. Czech Polar Rep. 2019, 9, 107–113. [Google Scholar] [CrossRef]
  12. Žákovská, A. Changes in immunological characteristics of summer crew during a short-term expedition to Antarctica. Czech Polar Rep. 2023, 13, 121–128. [Google Scholar] [CrossRef]
  13. Alexandrova, A.; Petrov, L.; Pramatarov, G.; Sheytanova, T. Blood oxidative stress markers in the 32nd Bulgarian Antarctic expedition participants. Czech Polar Rep. 2025, 15, 1–14. [Google Scholar] [CrossRef]
  14. Alexandrova, A.; Petrov, L.; Sheytanova, T.; Bonova, I.; Petrova, B.; Zdravcheva, M. Cardiovascular risk in Antarctic expedition participants. Wilderness Environ. Med. 2025, 10806032251409144. [Google Scholar] [CrossRef]
  15. Petrov, L.; Alexandrova, A. Biological age estimation of the participants in the 32nd Bulgarian Antarctic expedition. Kinesiol. Int. J. 2024, 66, 511–516. [Google Scholar]
  16. Antarctic Treaty. Antarctic Treaty. 1959. Available online: https://www.ats.aq/e/antarctictreaty.html (accessed on 16 January 2023).
  17. Moiseyenko, Y.V.; Sukhorukov, V.I.; Pyshnov, G.Y.; Mankovska, I.M.; Rozova, K.V.; Miroshnychenko, O.A.; Kovalevska, O.E.; Madjar, S.A.; Bubnov, R.V.; Gorbach, A.O.; et al. Antarctica challenges the new horizons in predictive, preventive, personalized medicine: Preliminary results and attractive hypotheses for multidisciplinary prospective studies in the Ukrainian “Akademik Vernadsky” station. EPMA J. 2016, 7, 11. [Google Scholar] [CrossRef]
  18. World Health Organization. Obesity: Preventing and Managing the Global Epidemic; WHO Technical Report Series No. 894; World Health Organization: Geneva, Switzerland, 2000.
  19. Premkumar, M.; Sable, T. Obesity, dyslipidemia and cholesterol gallstone disease during one year of Antarctic residence. Rural Remote Health 2012, 12, 2186. [Google Scholar] [CrossRef]
  20. Rippe, J.M. Lifestyle medicine: The health promoting power of daily habits and practices. Am. J. Lifestyle Med. 2018, 12, 499–512. [Google Scholar] [CrossRef]
  21. Rippe, J.M. Lifestyle medicine and cardiovascular health. Am. J. Lifestyle Med. 2025, 20, 14–22. [Google Scholar] [CrossRef]
  22. Ashcroft, S.P.; Stocks, B.; Egan, B.; Zierath, J.R. Exercise induces tissue-specific adaptations to enhance cardiometabolic health. Cell Metab. 2024, 36, 278–300. [Google Scholar] [CrossRef]
  23. Pescatello, L.S.; Arena, R.; Riebe, D.; Thompson, P.D. ACSM’s Guidelines for Exercise Testing and Prescription, 9th ed.; Wolters Kluwer/Lippincott Williams & Wilkins: Philadelphia, PA, USA, 2014; pp. 88–93. [Google Scholar]
  24. Swain, D.P.; Leutholtz, B.C. Heart rate reserve is equivalent to %VO2 reserve, not to %VO2max. Med. Sci. Sports Exerc. 1997, 29, 410–414. [Google Scholar] [CrossRef]
  25. Keating, S.E.; Hackett, D.A.; Parker, H.M.; O’Connor, H.T.; Gerofi, J.A.; Sainsbury, A.; Baker, M.K.; Chuter, V.H.; Caterson, I.D.; George, J.; et al. Effect of aerobic exercise training dose on liver fat and visceral adiposity. J. Hepatol. 2015, 63, 174–182. [Google Scholar] [CrossRef]
  26. Johnson, N.A.; Sachinwalla, T.; Walton, D.W.; Smith, K.; Armstrong, A.; Thompson, M.W.; George, J. Aerobic exercise training reduces hepatic and visceral lipids in obese individuals without weight loss. Hepatology 2009, 50, 1105–1112. [Google Scholar] [CrossRef] [PubMed]
  27. Larson-Meyer, D.E.; Redman, L.; Heilbronn, L.K.; Martin, C.K.; Ravussin, E. Caloric restriction with or without exercise: The fitness versus fatness debate. Med. Sci. Sports Exerc. 2010, 42, 152–159. [Google Scholar] [CrossRef]
  28. Binmahfoz, A.; Dighriri, A.; Gray, C.; Gray, S.R. Effect of resistance exercise on body composition, muscle strength and cardiometabolic health during dietary weight loss in people living with overweight or obesity: A systematic review and meta-analysis. BMJ Open Sport Exerc. Med. 2025, 11, e002363. [Google Scholar] [CrossRef] [PubMed]
  29. Durstine, J.L.; Grandjean, P.W.; Cox, C.A.; Thompson, P.D. Lipids, lipoproteins, and exercise. J. Cardiopulm. Rehabil. 2002, 22, 385–398. [Google Scholar] [CrossRef] [PubMed]
  30. Kim, M.K.; Tomita, T.; Kim, M.J.; Sasai, H.; Maeda, S.; Tanaka, K. Aerobic exercise training reduces epicardial fat in obese men. J. Appl. Physiol. 2009, 106, 5–11. [Google Scholar] [CrossRef]
  31. Jonker, J.T.; de Mol, P.; de Vries, S.T.; Widya, R.L.; Hammer, S.; van Schinkel, L.D.; van der Meer, R.W.; Gans, R.O.; Webb, A.G.; Kan, H.E.; et al. Exercise and type 2 diabetes mellitus: Changes in tissue-specific fat distribution and cardiac function. Radiology 2013, 269, 434–442. [Google Scholar] [CrossRef]
  32. Heiskanen, M.A.; Motiani, K.K.; Mari, A.; Saunavaara, V.; Eskelinen, J.J.; Virtanen, K.A.; Koivumäki, M.; Löyttyniemi, E.; Nuutila, P.; Kalliokoski, K.K.; et al. Exercise training decreases pancreatic fat content and improves beta cell function regardless of baseline glucose tolerance: A randomized controlled trial. Diabetologia 2018, 61, 1817–1828. [Google Scholar] [CrossRef]
  33. Dimkpa, U. Post-exercise heart rate recovery: An index of cardiovascular fitness. J. Exerc. Physiol. Online 2009, 12, 10–22. [Google Scholar]
  34. Barak, O.F.; Ovcin, Z.B.; Jakovljevic, D.G.; Lozanov-Crvenkovic, Z.; Brodie, D.A.; Grujic, N.G. Heart rate recovery after submaximal exercise: Relationship with oxidative stress and antioxidant capacity in young healthy males. J. Sports Sci. Med. 2011, 10, 261–266. [Google Scholar]
  35. Akerman, A.P.; Lucas, S.J.E.; Katare, R.; Cotter, J.D. Heat and dehydration additively enhance cardiovascular outcomes following orthostatically stressful calisthenics exercise. Front. Physiol. 2017, 8, 756. [Google Scholar] [CrossRef] [PubMed]
  36. Carter, R.; Cheuvront, S.N.; Wray, D.W.; Kolka, M.A.; Stephenson, L.A.; Sawka, M.N. The influence of hydration status on heart rate variability after exercise heat stress. J. Therm. Biol. 2005, 30, 495–502. [Google Scholar] [CrossRef]
  37. Perini, R.; Veicsteinas, A. Heart rate variability and autonomic activity at rest and during exercise in various physiological conditions. Eur. J. Appl. Physiol. 2003, 90, 317–325. [Google Scholar] [CrossRef]
  38. Klein, S.; Burke, L.E.; Bray, G.A.; Blair, S.; Allison, D.B.; Pi-Sunyer, X.; Hong, Y.; Eckel, R.H. Clinical implications of obesity with specific focus on cardiovascular disease: A statement for professionals from the American Heart Association Council on Nutrition, Physical Activity, and Metabolism. Circulation 2004, 110, 2952–2967. [Google Scholar] [CrossRef]
  39. Grzyb, A.; Domagalska-Szopa, M.; Siwiec, A.; Kwiecień-Czerwieniec, I.; Szopa, A. Cardiopulmonary capacity in overweight and obese children and adolescents: A cross-sectional study. Front. Physiol. 2021, 12, 671827. [Google Scholar] [CrossRef]
  40. Blüher, M. Obesity: Global epidemiology and pathogenesis. Nat. Rev. Endocrinol. 2019, 15, 288–298. [Google Scholar] [CrossRef]
  41. Setty, P.; Padmanabha, P.B.; Doddamani, B. Correlation between obesity and cardiorespiratory fitness. Int. J. Med. Sci. Public Health 2013, 2, 298–302. [Google Scholar] [CrossRef]
  42. Azam, F.; Shaheen, A.; Irshad, K.; Liaquat, A.; Naveed, H.; Shah, S.U. Association of postexercise heart rate recovery with body composition in healthy male adults: Findings from Pakistan. Ann. Noninvasive Electrocardiol. 2020, 25, e12711. [Google Scholar] [CrossRef]
  43. Risdiana, N.; Purniati, A.; Puspita, D. The status of body mass index on heart rate recovery in young adults: Literature review. J. Health Technol. Assess. Midwifery 2022, 5, 1–7. [Google Scholar] [CrossRef]
  44. Thomsen, M.; Nordestgaard, B.G. Myocardial infarction and ischemic heart disease in overweight and obesity with and without metabolic syndrome. JAMA Intern. Med. 2014, 174, 15–22. [Google Scholar] [CrossRef]
  45. Council of Managers of National Antarctic Programs. Antarctic Station Catalogue; COMNAP: Christchurch, New Zealand, 2017; p. 39. [Google Scholar]
  46. Herxheimer, A. Jet lag. BMJ Clin. Evid. 2008, 2008, 2303. [Google Scholar]
  47. Benito, A.; Boppre, G.; Lopes, A.; Cruz, D.; Moreira-Gonçalves, D.; Pyne, D.B.; Baptista, L.C.; Zacca, R. Do Long-Haul Travel and Jet Lag Affect Athletes’ Physiological, Humoral and Performance Outcomes? A Systematic Narrative Review. Sports 2026, 14, 93. [Google Scholar] [CrossRef]
  48. Fox, S.M., III; Naughton, J.P.; Haskell, W.L. Physical activity and the prevention of coronary heart disease. Ann. Clin. Res. 1971, 3, 404–432. [Google Scholar] [CrossRef]
  49. Kharabsheh, S.M.; Al-Sugair, A.; Al-Buraiki, J.; Al-Farhan, J. Overview of exercise stress testing. Ann. Saudi Med. 2006, 26, 1–6. [Google Scholar] [CrossRef]
  50. Åstrand, P.O.; Ryhming, I. A nomogram for calculation of aerobic capacity (physical fitness) from pulse rate during submaximal work. J. Appl. Physiol. 1954, 7, 218–221. [Google Scholar] [CrossRef]
  51. Shaw, K.; Gennat, H.; O’Rourke, P.; Del Mar, C. Exercise for overweight or obesity. Cochrane Database Syst. Rev. 2006, 4, CD003817. [Google Scholar] [CrossRef]
Figure 1. Significant differences within and between groups (Group 1 = normal weight, BMI < 25 kg/m2, Group 2 = overweight, 25 ≤ BMI < 30 kg/m2, and Group 3 = obesity, BMI ≥ 30 kg/m2), before and after the Antarctic expedition. * Significant differences within the groups between before and after expedition * p < 0.05; ** p < 0.01; # Significant differences between groups # p < 0.05; ## p < 0.01.
Physiologia 06 00027 g001
Figure 2. Heart rate of participants in the expedition with (A) normal weight, Group 1 (BMI < 25 kg/m2), (B) overweight, Group 2 (25 ≤ BMI < 30 kg/m2) and (C) obesity, Group 3 (BMI ≥ 30 kg/m2), expressed as a percentage of the predicted maximal heart rate (HRmax) at various stages of a submaximal stress test. Workload intensity is expressed as a percentage of the power achieved in the final stage (Wmax).
Physiologia 06 00027 g002
Table 1. Anthropometric, physiological, and functional characteristics of participants with normal weight, Group 1 (BMI < 25 kg/m2), before and after the Antarctic expedition.
n = 10Before ExpeditionAfter ExpeditionData
Distribution *
p
MinMaxMean ± SDMinMaxMean ± SD
Age (years)325541.90 ± 7.64325542.40 ± 7.62Normal0.015
Height (cm)153192175.70 ± 12.01153192175.80 ± 11.02Normal0.988
Weight (kg)48.186.968.40 ± 11.2848.790.070.00 ± 11.65Normal0.031
BMI (kg/m2)19.324.722.00 ± 1.7319.525.622.60 ± 2.07Normal0.039
FM%9.632.318.10 ± 6.8310.336.618.40 ± 8.15Normal0.568
MM%19.951.741.50 ± 10.3733.751.245.80 ± 5.44Normal0.127
SBP (mmHg)100140120.00 ± 12.69100140119.00 ± 12.20Normal0.716
DBP (mmHg)709078.50 ± 8.18609076.50 ± 8.84 0.317
PWC85%118.59210.00159.40 ± 39.16120.00244.29175.90 ± 39.75 0.048
PWC85%R (W/kg)1.632.702.33 ± 0.392.113.252.51 ± 0.34Normal0.092
SBP3’ (mmHg)111186144.50 ± 22.47124155137.70 ± 11.70Normal0.342
DBP3’ (mmHg)6110676.50 ± 14.84559074.10 ± 11.04Normal0.618
HR3’ (bpm)8410996.90 ± 8.537610289.90 ± 7.14Normal0.043
VO2max (mL/kg/min)27.7150.937.30 ± 7.2024.6849.2636.20 ± 7.41Normal0.508
VO2maxP268651.20 ± 23.65208550.20 ± 22.17 0.683
* Data distribution—indicates the type of probability distribution: “normal” or, if left blank, the data were considered to follow a non-normal distribution.
Table 2. Anthropometric, physiological, and functional characteristics of participants with overweight, Group 2 (25 ≤ BMI < 30 kg/m2), before and after the Antarctic expedition.
n = 14Before ExpeditionAfter ExpeditionData
Distribution *
p
MinMaxMean ± SDMinMaxMean ± SD
Age (years)255942.60 ± 9.66265942.90 ± 9.48Normal0.040
Height (cm)161196175.80 ± 7.51161196176.10 ± 7.80 0.979
Weight (kg)65.5103.384.60 ± 9.1858.8103.284.40 ± 10.82Normal0.853
BMI (kg/m2)25.129.827.30 ± 1.7022.730.927.20 ± 2.13Normal0.779
FM%12.543.226.20 ± 8.4911.741.025.80 ± 8.21Normal0.407
MM%30.750.1940.30 ± 5.6531.950.942.00 ± 5.36Normal0.027
SBP (mmHg)110160131.40 ± 14.6110150124.10 ± 13.18 0.026
DBP (mmHg)7011086.10 ± 9.647010082.10 ± 8.93 0.121
PWC85%111.1297.3180.40 ± 51.06106.0324.0195.00 ± 54.42Normal0.026
PWC85%R (W/kg)1.503.642.13 ± 0.561.483.902.31 ± 0.59Normal0.022
SBP3’ (mmHg)120246157.80 ± 32.18110166141.70 ± 15.49 0.090
DBP3’ (mmHg)628975.30 ± 7.95648071.40 ± 4.33Normal0.086
HR3’ (bpm)82139107.20 ± 15.508611497.10 ± 8.73Normal0.001
VO2max (mL/kg/min)23.8158.4735.30 ± 8.7524.3650.4236.00 ± 7.39Normal0.556
VO2maxP109546.20 ± 21.27308750.20 ± 16.74 0.314
* Data distribution—indicates the type of probability distribution: “normal” or, if left blank, the data were considered to follow a non-normal distribution.
Table 3. Anthropometric, physiological, and functional characteristics of participants with obesity, Group 3 (BMI ≥ 30 kg/m2), before and after the Antarctic expedition.
n = 10Before ExpeditionAfter ExpeditionData
Distribution *
p
MinMaxMean ± SDMinMaxMean ± SD
Age (years)385646.50 ± 6.01385647.00 ± 5.81Normal0.015
Height (cm)158190175.70 ± 9.95158190175.10 ± 10.04Normal0.993
Weight (kg)82.0121.4102.00 ± 13.3282.4119.6103.00 ± 12.48Normal0.334
BMI (kg/m2)30.238.033.00 ± 2.5830.336.833.30 ± 2.05Normal0.346
FM%24.249.533.90 ± 8.0323.950.033.50 ± 8.61Normal0.522
MM%24.743.036.90 ± 6.5527.2944.337.90 ± 5.54 0.093
SBP (mmHg)120180138.00 ± 18.14115160132.50 ± 16.20 0.102
DBP (mmHg)8011089.50 ± 9.568011090.50 ± 9.56Normal0.619
PWC85%90.00304.20182.80 ± 78.9560.00278.18173.90 ± 55.82Normal0.588
PWC85%R (W/kg)0.852.941.78 ± 0.670.632.571.68 ± 0.49Normal0.541
SBP3’ (mmHg)128211172.20 ± 27.001030215157.20 ± 26.52 0.074
DBP3’ (mmHg)648777.60 ± 6.72579073.50 ± 10.53Normal0.293
HR3’ (bpm)90123108.40 ± 11.2787113100.60 ± 8.57Normal0.046
VO2max (mL/kg/min)21.0140.6730.70 ± 7.2019.7339.6329.60 ± 6.15Normal0.479
VO2maxP67638.20 ± 24.6957534.60 ± 23.52Normal0.538
* Data distribution—indicates the type of probability distribution: “normal” or, if left blank, the data were considered to follow a non-normal distribution.
Disclaimer/Publisher’s Note: The statements, opinions and data contained in all publications are solely those of the individual author(s) and contributor(s) and not of MDPI and/or the editor(s). MDPI and/or the editor(s) disclaim responsibility for any injury to people or property resulting from any ideas, methods, instructions or products referred to in the content.