Article

Production of the Macroalgae Ulva lactuca Integrated with the Shrimp Penaeus vannamei in a Biofloc System: Effect of Total Suspended Solids and Nutrient Concentrations

by
Andrezza Carvalho
1,*,
Ítalo Braga
2,
Florencia Chaar
1,
Alessandro Pereira Cardozo
1,
José María Monserrat
1,3,
Juan Rafael Buitrago Ramírez
1,3,
Wilson Wasielesky, Jr.
1 and
Luís H. Poersch
1
1
Marine Aquaculture Station, Institute of Oceanography, Federal University of Rio Grande—FURG, Rua do Hotel n° 2, Cassino, Rio Grande 96210030, RS, Brazil
2
Escola Agrícola de Jundiaí, Federal University of Rio Grande do Norte—UFRN, Jundiaí, Macaiba, Rio Grande do Norte 59280-000, RN, Brazil
3
Laboratory of Functional Biochemistry of Aquatic Organisms (BIFOA), Institute of Oceanography (IO), Federal University of Rio Grande—FURG, Rua do Hotel, n° 2, Cassino, Rio Grande 96210-030, RS, Brazil
*
Author to whom correspondence should be addressed.
Phycology 2024, 4(1), 37-52; https://doi.org/10.3390/phycology4010002
Submission received: 5 December 2023 / Revised: 21 December 2023 / Accepted: 29 December 2023 / Published: 31 December 2023

Abstract

:
This study focused on evaluating the effect of different concentrations of nutrients and total suspended solids on the removal rate of nutrients and biocompounds from the macroalgae U. lactuca in an integrated system with the shrimp Penaeus vannamei in biofloc. The experiment lasted 45 days and included five treatments with three replicates each, with percentages of 0 (control), 25, 50, 75, and 100% biofloc inoculum (73.3 ± 5.7 and 325.0 ± 21.2 mg L−1 initial nitrate and solids, respectively, in the 100% inoculum), from a shrimp farm, resulting in different concentrations of solids and nutrients. The macroalgae were introduced into 280 L tanks at a density of 0.88 kg m−2, along with 200 shrimp m−3. The algae were separated by a floating structure. Water quality parameters were measured, and the nutrient removal rate was evaluated. The treatment with 75% inoculum showed a removal rate of 55.0 ± 4.0 and 31.0 ± 10.0% of nitrate and phosphate, respectively. There was no difference in macroalgae growth between the treatments; however, macroalgae grown in 75% inoculum had higher protein, chlorophyll-a, and lower ash values compared with the control. The use of macroalgae in integrated production with shrimp under the conditions of the treatment with 75% biofloc inoculum proved to be viable and sustainable.

1. Introduction

Large-scale production of macroalgae comes from open and coastal areas, totaling 35.1 million tons, according to the FAO in 2022 [1]. However, these cultures are affected by the availability of nutrients, wave action, and the presence of herbivores, factors that can influence the growth of macroalgae. To address these challenges, the integration of macroalgae cultivation with animal production systems that generate nutrient-rich effluents, such as shrimp farming, has gained prominence. This approach enables indoor cultivation of macroalgae while concurrently serving as a means of bioremediation for aquaculture wastewater. Studies by Alencar et al. [2] and Copertino et al. [3] have demonstrated the effectiveness of cultivating Ulva algae using effluents from shrimp farms. They achieved growth rates exceeding 8.0% per day and ammonia absorption rates of up to 90%, indicating enhanced macroalgae development while effectively removing nutrients from the effluents.
More sustainable farming has also gained importance over time, with the aim of producing animals with less environmental impact and effluent treatment systems. The integration of different species in cultivation represents an alternative for improving water quality and the use of waste. This approach is known as Integrated Multitrophic Aquaculture (IMTA), which stands out for its sustainability. IMTA involves the cultivation of both feeding species and consuming species that play a crucial role in recycling organic matter and residual nutrients [4]. Macroalgae participate in the absorption of nutrients, sequestration of carbon dioxide (CO2), and maintenance of dissolved oxygen [5]. Integrating macroalgae into shrimp farming increases the system’s productivity, and two or more species can be cultivated in the same area without negatively affecting their performance, thus increasing economic viability [6]. The advantages of integrated systems have been shown to be effective in studies such as Nobre et al. [7] with macroalgae and abalone, Holanda et al. [8] with shrimp and fish, Verdian et al. [9], which showed improvements in zootechnical performance when integrating shrimp, fish, and macroalgae, and Poli et al. [10] with shrimp, fish, and halophytes.
Biofloc technology is a production approach characterized by minimal water exchange, high productivity, and a reduced environmental impact. Central to this technology is the role of heterotrophic bacteria. These bacteria play a vital role in assimilating the ammonia produced by converting it into bacterial biomass, resulting in an increase in total suspended solids-TSS and oxygen consumption [11]. In parallel, chemoautotrophic bacteria within the system convert ammonia into nitrate while consuming inorganic carbon [11]. For shrimp farming, the solids level should be kept between 100 and 300 mg L−1, with the excess being removed from the system using clarifiers [12] or partial water changes. The constant use of clarifiers to maintain a low concentration of solids can lead to greater energy expenditure. In addition, the low concentration of solids can affect water quality, causing nitrite spikes due to the low availability of bacteria in the system [13].
The minimal water exchange in cultures operated in biofloc systems favors the accumulation of nutrients and solids in the system, which, when released at the end of cultivation into the receiving body of water, can cause eutrophication [14]. Although the accumulation of nutrients is favorable to macroalgae growth, the successful production of macroalgae biomass in a biofloc system requires adaptation to the environment due to the distinct characteristics compared with the natural environment. Legarda et al. [15] showed that introducing macroalgae collected from the natural environment into the biofloc system can lead to stress and loss of biomass.
The production of solids in the water can harm the macroalgae since these solids block the entry of light into the photosynthetic tissues [16]. In addition, the presence of these solids limits the penetration of light into the water column, especially at greater depths [17]. Therefore, for the best development of macroalgae, the concentration of solids in the system must be optimized. The use of water exchanges can help to decrease the concentration of solids in the system, but it will increase energy costs and cause environmental problems with the disposal of effluents. According to Queiroz et al. [14], the disposal of effluent from shrimp farming in mangroves increases the nitrogen content in the soil and its mineralization, factors that trigger the eutrophication of mangrove areas. Water exchange in cultivation also leads to nutrient dilution, which can become a limiting factor or change the N:P ratio for macroalgae growth [18].
Thus, adjusting water quality parameters for integrated macroalgae cultivation can be used as a way of boosting macroalgae performance in biofloc systems. In addition to the growth of macroalgae, their cultivation in an environment with different physical and chemical factors can lead to changes in their biochemical and nutritional composition, which may be of interest to the pharmaceutical and food industries [18]. Previous studies have shown an increase in the protein content of the macroalgae Ulva lactuca when cultivated in an integrated biofloc system. The values reached 22.4%, in contrast to the 12.40% observed when cultivated in laboratory solution, highlighting its nutritional value [19]. He et al. [20] described some factors that influence the increase in antioxidant capacity and phenol content, such as salinities below 25, as well as the depletion or high concentrations of nutrients that can influence the concentration of amino acids and fatty acids in macroalgae. Therefore, the medium and conditions under which macroalgae are cultivated can enhance the biomass produced.
Therefore, the aim of this study is to evaluate nutrient absorption, nutritional composition, and bioactive compounds in the macroalgae Ulva lactuca when cultivated under varying concentrations of nutrients and total suspended solids (biofloc) within an integrated system with the white shrimp Penaeus vannamei.

2. Materials and Methods

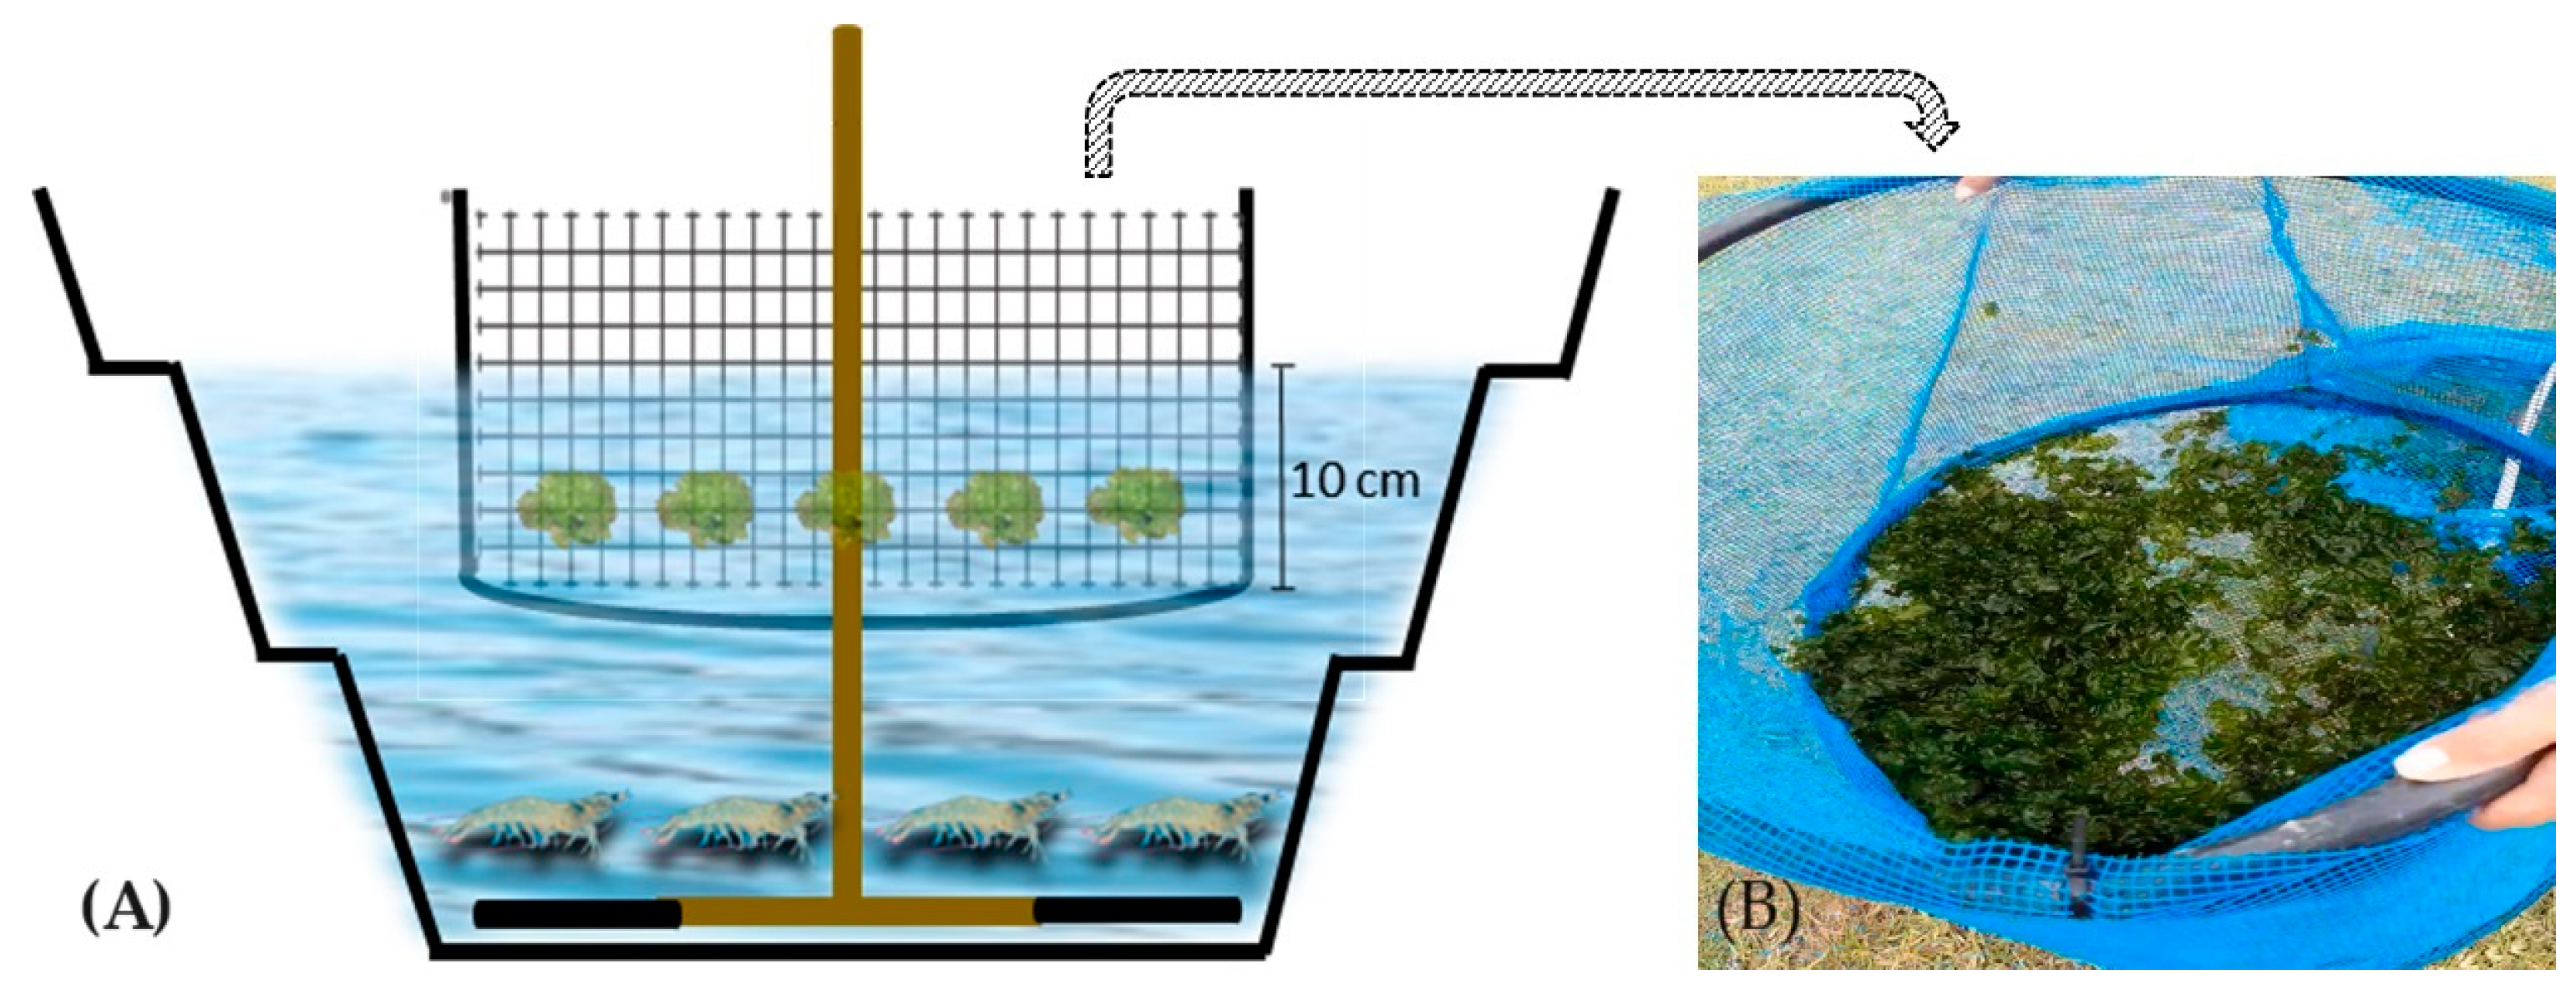
2.1. Experimental Design and Facilities

The experiment was carried out at the Marine Aquaculture Station, Institute of Oceanography of the Federal University of Rio Grande (IO-FURG), located on Cassino Beach, Rio Grande, Rio Grande do Sul. The macroalgae species used was U. lactuca, collected in a natural environment (32°17′52.30″ S–52°15′59.80″ W). After collection, the macroalgae were taken to the laboratory to remove the epiphyte species and identified using a molecular analysis and observing quadratic cells and a bilayer of cells characteristic of this species, as also identified by Alencar et al. [2]. After confirming the species, it was cultivated for 27 days before being stocked in the experimental units in a 1 m3 circular tank with 10% biofloc inoculum, resulting in a concentration of 35.1 ± 2.74 mg L−1 of nitrate and 2.24 ± 1.2 mg L−1 of phosphate. The shrimp came from a biofloc system grow-out tank at the EMA/IO-FURG Carcinoculture Laboratory. The shrimp, with an initial weight of 3.85 ± 0.73 g, were stocked at a density of 200 shrimp m−3 to maintain the biofloc.
The experiment lasted 45 days and was carried out in an agricultural greenhouse. The experimental units were kept under constant aeration using a blower (4 HP), which injected air into the experimental units through two pieces of micro-perforated hose (each piece 20 cm long) per tank. During the experiment, the average light intensity was 28.68 ± 8.53 µmol m−2 s−1, with a natural photoperiod of 14 h light and 10 h dark. Fifteen tanks were used, arranged randomly in the greenhouse, with a base diameter of 0.81 m, a height of 0.53 m, and a useful volume of 180 L (Figure 1). The shrimp and macroalgae were kept in the same tank, but to separate the animals, the macroalgae were cultivated inside a circular floating structure near the surface with a diameter of 0.60 m, with 5 mm mesh openings, with a depth of 10 cm to allow the macroalgae to move within the structure, at a density of 0.88 kg m−2 (Figure 1). The shrimp were fed with a commercial feed of 36% protein (Guabi Aqua QS 2–3 mm, Guabi Nutrition and Animal Health S.A., Campinas, São Paulo, Brazil), according to the methodology proposed by Jory et al. [21], twice a day, with the feed being adjusted weekly.
The experiment used a mature biofloc inoculum from a grow-out shrimp farm [11]. The nutrient concentrations of the inoculum were 0.09, 0.03, 73.33, and 1.60 mg L−1 of total ammoniacal nitrogen, nitrite, nitrate, and phosphate, respectively, 20 mL L−1 of settleable solids, 304 NTU for turbidity and 325 mg L−1 of total suspended solids. This inoculum was placed in different percentages in each treatment and diluted with seawater to complete the useful volume of the tank, arriving at different concentrations of nutrients and solids (Table 1).
The experiment consisted of five treatments with three replicates each. Presenting a control treatment CONT—cultivation in clear water, with the addition of organic carbon when ammonia reached concentrations of 1 mg L−1 [22]; and treatments with different percentages of biofloc inoculum, with 25, 50, 75 and 100% biofloc, resulting in: T100—concentration of approximately 100 mg L−1 of total suspended solids; T200—concentration of approximately 200 mg L−1 of total suspended solids; T250—concentration of approximately 250 mg L−1 of total suspended solids; T300—concentration of approximately 300 mg L−1 of total suspended solids (Table 1).

2.2. Physical and Chemical Parameters

Temperature (°C), dissolved oxygen (DO, mg L−1), and pH were measured daily in all tanks using a multi-parameter probe (model Pro-20, YSI Inc., Yellow Springs, OH, USA) and a bench pH meter (Seven2Go S7 Basic, Mettler Toledo, São Paulo, Brazil). Salinity was measured weekly using a multi-parameter probe (model Pro-20, YSI Inc., Yellow Springs, OH, USA). For the water quality analyses, the samples were collected in plastic containers and taken immediately for analysis. Total ammonia (N–NH3, mg L−1) and nitrite (NO2-N, mg L−1) were analyzed twice a week according to the methodology of UNESCO [23] and Bendschneider & Robinson [24], respectively. Nitrate (NO3-N) and phosphate (P–PO4− 3) (mg L−1) were analyzed using the methodology described by Aminot & Chaussepied [25] and monitored twice a week. Turbidity and TSS were determined weekly. Turbidity (NTU) was measured using a portable turbidimeter (2100P, Hach™, Loveland, CO, USA), and total suspended solids (TSS) were quantified using filtration and gravimetry according to the methodology described by Strickland and Parsons [26]. Total alkalinity (mg CaCO3 L−1) was measured twice a week and monitored according to the methodology presented by APHA [27]. Calcium hydroxide was used to maintain alkalinity above 150 mg L−1 [28]. The settleable solids (SS) were measured weekly using the Imhoff cone [27].

2.3. Growth and Nutrient Absorption by Macroalgae

The biomass yield of the macroalgae was measured weekly by weighing the fresh biomass, where the macroalgae were removed from the water and left in the open air for 20 min to remove excess water. The following formula was used to calculate the Relative Growth Rate (RGR) [29]:
RGR (% d−1): 100 × [ln (final weight (g)/initial weight (g))/(final time − initial time)]
The nutrient absorption efficiency (NRR) of macroalgae was calculated using the following formula [29]:
NRR (%): 100 × [(nutrient concentration at initial time (mg L−1) − nutrient concentration at final time (mg L−1))/nutrient concentration at initial time (mg L−1)]

2.4. Proximal Composition and Biocompounds of Macroalgae

Proximal composition analysis was carried out on the treatment with the biofloc inoculum that showed the best growth performance and nutrient absorption at the end of cultivation (T250) and on the CONT treatment for comparison. Random samples of algae were collected manually from each experimental unit, washed in running water, and then with distilled water. Excess water was removed using a manual centrifuge, followed by drying with paper towels. The samples were weighed to determine their wet weight and placed in an oven at 60 °C for 24 h, after which they were weighed again to obtain their dry weight. The samples were then ground for analysis.
The nitrogen content of the algae was determined using the Kjeldahl titration method according to AOAC [30] at the Laboratory of Aquatic Organism Nutrition-LANOA (EMA, FURG, Rio Grande, Brazil). The formula used to convert nitrogen into protein was:
Protein (% of dry weight) = [(0.085 × Vol × 0.014/sample) × 5.45] × 100
where Vol is the volume spent on titration, and sample is the dry weight of the sample [31].
The crude fat content was determined using the Soxhlet method based on solvent extraction (petroleum ether), and the ash content was obtained using the gravimetric method in a muffle furnace at 600 °C. The crude fiber was obtained using washes in acidic and basic media.
The macroalgae extract was obtained using the methodology of Barbarino & Lourenço [32], with the addition of 1 mL of sodium hydroxide and centrifugation to prepare the crude extract for protein analysis. The macroalgae protein was analyzed using the Biuret method, following the methodology of Barbarino & Lourenço [32]. The extract and trichloroacetic acid (TCA) (25%) were added in a ratio of 2.5:1 (v/v) to precipitate the protein and kept in an ice-cold bath for 30 min. The solution was then centrifuged and washed with dilutions of TCA (10 and 5%), removing the supernatant until the protein pellet was formed. 0.5 mL of sodium hydroxide (0.1 N) was added to the pellet suspension, and 20 µL of the solution and 1 mL of the total protein kit were removed.
To determine the concentration of chlorophyll-a, chlorophyll-b, carotenoids, phenolic compounds, and DPPH (2.2-diphenyl-1-picrylhydrazyl), 500 mg of sample and 5 mL of methanol were used. The samples were macerated, then incubated in the dark for 60 min at 4 °C, and centrifuged (12,000× g × 10 min). Finally, the supernatant was collected for analysis. The absorbances at 664 and 647 ηm were measured to calculate chlorophyll-a (Chla = 11.75 × A664 − 2.35 × A647), chlorophyll-b (Chlb = 18.61 × A647 − 3.91 × A664) and carotenoids (Car = (1000 × A470 − 2.27 × Chla − 81.4 Chlb)/227) according to the methodology of Lichtenthaler & Wellburn [33].
Total phenolic compounds were determined by the Folin–Ciocalteau colorimetric method using the methodology described by Schiavon et al. [34] with modifications. A total volume of 2 mL of 2% Na2CO3 and 150 µL of Folin–Ciocalteau reagent (Sigma-Aldrich) were added to 200 µL of macroalgae extract. After 15 min of incubation in the dark, the samples were measured at 750 nm. The gallic acid standard curve was used (Sigma-Aldrich, St. Louis, MO, USA—100—1250 µg mL−1, y = 0.0008x − 0.0156, R2 = 0.999). The results were presented as mg of gallic acid equivalent per g of mass (mg GAE g−1).
The DPPH radical scavenging effects of the samples were carried out using the methodology of Farasat et al. [35] with some modifications. A total volume of 400 µL of extract and 400 µL of 0.16 mM DPPH methanolic solution were used. The mixture was vortexed for 1 min and then incubated for 30 min in the dark. The absorbance was read at 517 nm in a spectrophotometer, where the antioxidant capacity was calculated using the following equation:
% Inhibition = (Acotrol − (Asample − Ablank)/Acotrol) × 100
where Acotrol is the absorbance of the control (DPPH without extract), Asample is the absorbance of the extract (extract plus DPPH solution), and Ablank is the absorbance of the extract (extract without DPPH solution).

2.5. Shrimp Performance

Shrimp growth data were obtained from weekly biometrics that included the following formulas:
  • Mean final weight (g): final biomass of live animals (g)/total number of animals;
  • Weekly weight gain (g week-1): weight gain (g)/number of weeks.
  • Final biomass (g): ∑ final weight of all live animals (g);
  • Survival (%) = (final number of animals/initial number of animals) × 100;
  • Feed conversion factor (FCR) = ∑ration offered (g)/(biomass gains (g);
  • Productivity (kg m−3): (final biomass (kg)/tank volume (m3);

2.6. Statistical Analysis

The normality and homoscedasticity of these data were checked using the Shapiro–Wilk and Levene tests, respectively. Once these assumptions had been met, ANOVA was carried out, followed by Tukey’s post-hoc test for water quality, macroalgae, and shrimp performance. Spearman’s correlation was carried out for each week of the experiment between the variables treatment, nitrate concentration, phosphate concentration, total suspended solids concentration, macroalgae weight gain, nitrate removal rate, and phosphate removal rate. A student’s t-test was applied to the proximal and biochemical composition of only the two treatments, CONT and T250. When the assumptions of ANOVA and the student’s t-test were not met, the non-parametric Kruskal–Wallis test was used. A minimum significance level of 5% (p ≤ 0.05) was applied in all analyses.

3. Results

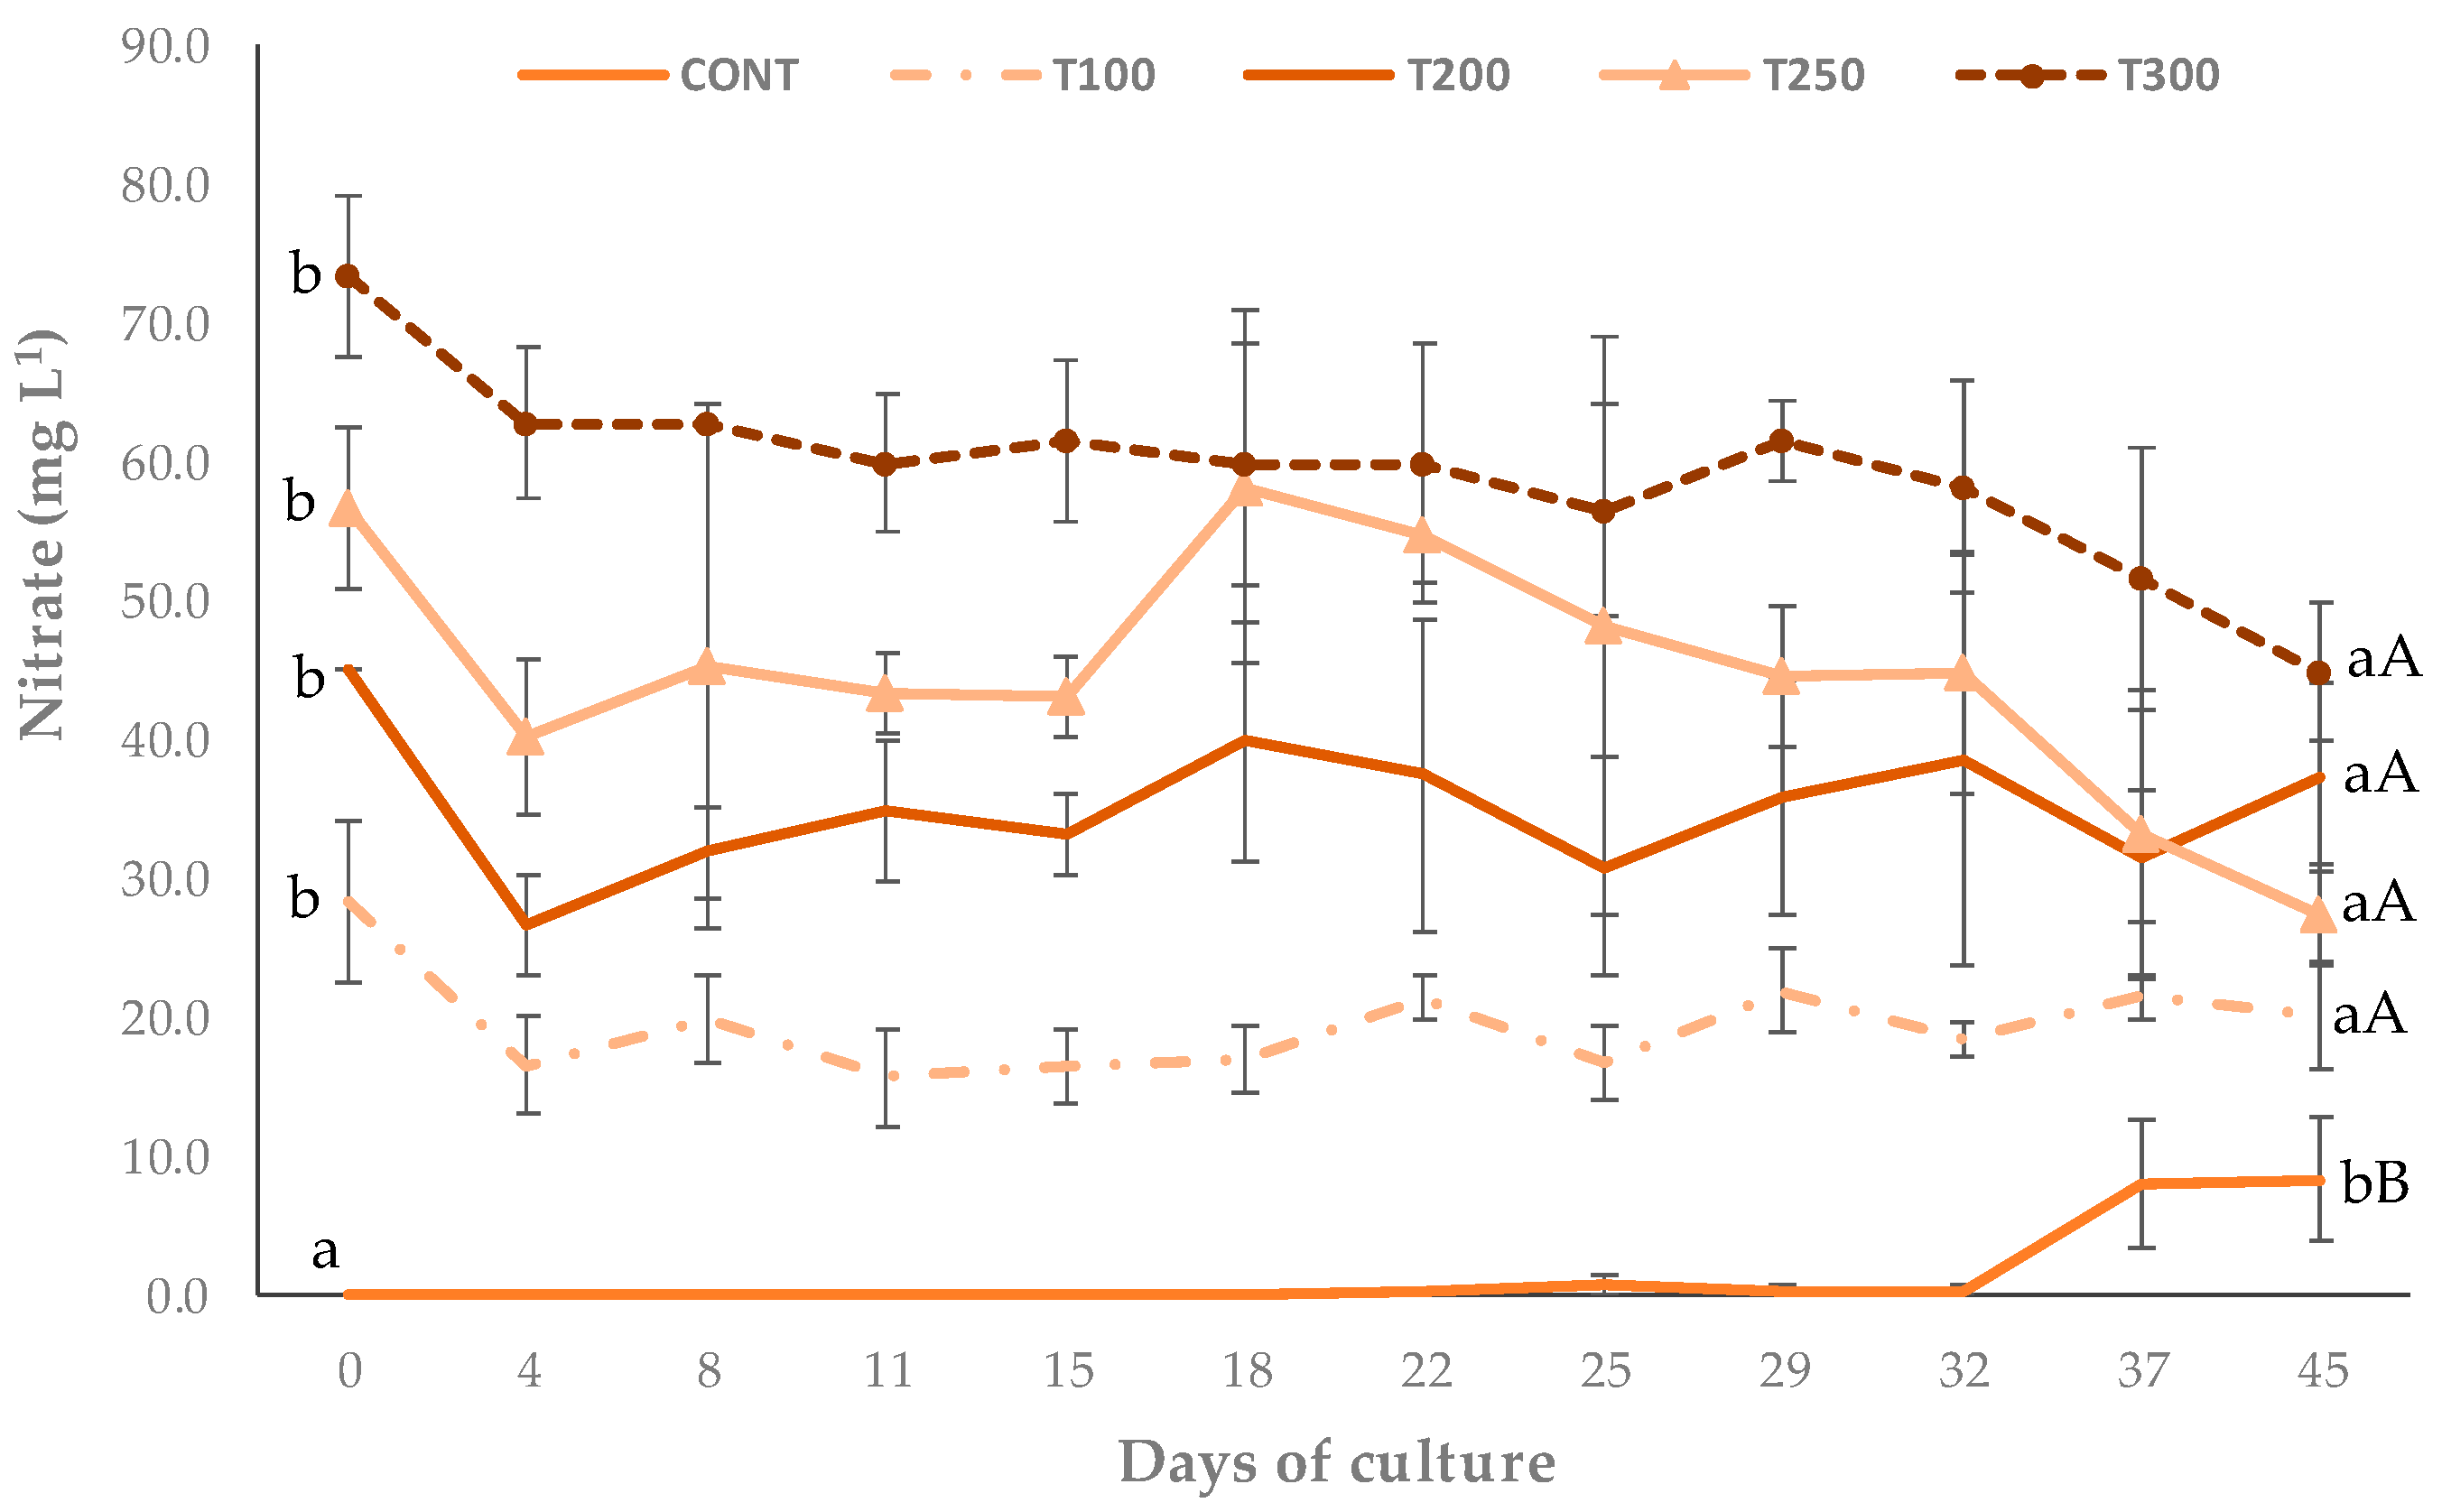
3.1. Physical and Chemical Parameters

There were no significant differences (p > 0.05) between the treatments in the parameters temperature, dissolved oxygen (D.O), and ammonia. The pH remained higher in the T250 and T300 treatments, along with the alkalinity, which was also higher (p > 0.05) in the same treatments. Salinity differed between treatments (p < 0.05), ranging from 28 to 30. The lowest nitrite concentrations were observed in the CONT treatment. Nitrate and settleable solids (SS) had higher concentrations as the inoculum concentration increased. Phosphate and turbidity were lower in the CONT and T100 treatments and remained the same in the other treatments. Total suspended solids (TSS) in the CONT treatment increased compared with the initial concentration but remained lower than in the other treatments. The concentration of solids increased in the treatments in relation to the initial inoculum concentrations (Table 2).
As shown in Table 2, the best nitrate and phosphate removal rates were found in the T250 treatment with 55.0 ± 4.0 and 31.0 ± 10.0%, respectively. In contrast, the CONT treatment had an increase in nitrate and phosphate throughout the experiment.
When looking at the nitrate values, the initial concentrations of the T300, T250, T200, and T100 treatments were higher than the final concentrations, showing a removal of the nitrogenous compound (Figure 2). In the control treatment, there was an increase in nitrate concentration on the 32nd day of the trial period. At the end of cultivation, the nitrate concentrations between treatments T300, T250, T200, and T100 were statistically similar.
In general, there was a positive correlation between treatment and the concentration of total suspended solids, nitrate, and phosphate in all weeks of cultivation. In the first week, there was a positive correlation between the weight gain of the macroalgae and nitrate removal rate (correlation coefficient = 0.575; p valor = 0.025) and phosphate removal rate (correlation coefficient = 0.627; p valor = 0.012). The second week showed a positive correlation between the weight gain of the macroalgae and nitrate removal rate (correlation coefficient = 0.596; p valor = 0.019). The third week showed a positive correlation between treatment and nitrate removal rate (correlation coefficient = 0.542; p valor = 0.037). The fourth week showed a positive correlation between nitrate removal rate, treatment (correlation coefficient = 0.676; p valor = 0.006), nitrate concentration (correlation coefficient = 0.657; p valor = 0.008), and phosphate concentration (correlation coefficient = 0.738; p valor = 0.002). The fifth week showed a positive correlation between the nitrate removal rate with treatment (correlation coefficient = 0.873; p valor = 0.000), nitrate concentration (correlation coefficient = 0.864; p valor = 0.000), phosphate concentration (correlation coefficient = 0.555; p valor = 0.032) and total suspended solids (correlation coefficient = 0.717; p valor = 0.003). In the last week, there was a positive correlation between the treatment and the phosphate removal rate (correlation coefficient = 0.683; p valor = 0.005) and a negative correlation between the weight gain of the macroalgae and the nitrate removal rate (correlation coefficient = −0.729; p valor = 0.002).

3.2. Macroalgae Performance

The average initial weight of the macroalgae in the treatments was 250.18 ± 0.28 g, with a gain in biomass throughout the experiment indicated by the growth rate (Table 3). There was no significant difference in final weight and relative growth rate (RGR) between treatments.

3.3. Proximal Composition and Biocompounds of Macroalgae

The proximate and biochemical composition was carried out on the control treatment (CONT), and the treatment with the best performance in nutrient absorption, the T250 treatment, was used. Table 4 shows that the highest protein and chlorophyll-a values were found in the treatment with biofloc inoculum (T250), and the highest ash values were found in the CONT treatment.

3.4. Shrimp Performance

No significant differences were observed in shrimp performance parameters between the treatments during the experimental period (Table 5). The shrimp grew during the experimental period and survived successfully at the end of cultivation.

4. Discussion

Chopin [4] mentions that integrated systems increase the productivity of a system, with the production of two organisms in the same area with added economic value. The conditions of salinity [36], dissolved oxygen [37], pH [38], alkalinity [28], and TSS [12] were kept ideal for the cultivation of P. vannamei shrimp. However, the temperature was below the optimum level, decreasing the animal’s metabolism and affecting its growth [39], which explains the low weekly weight gain found in this study. Another factor that may have influenced shrimp growth was the movement of the feed into the macroalgae structure through aeration, making it impossible for the shrimp to consume all food. The FCR obtained in this study (overall FCR of 2.26 ± 0.55) was similar to that found by Samocha et al. [40] in a biofloc system and Morais et al. [41] with integrated cultivation of shrimp and macroalgae in biofloc.
The use of integrated culture with the biofloc system has been widely studied, but there are few studies using macroalgae due to the high organic load and different variables in the system. The difference in salinity between the treatments in this study is probably due to the lower salinity found in the biofloc inoculum used compared with the salinity found in seawater. However, the genus Ulva can tolerate wide ranges of salinity and can grow well in salinities above 20 [42]. As a result, the difference in salinity between the treatments did not represent a stressful situation for the macroalgae, as it was within the macroalgae optimum performance range.
In cultivation systems that work with biofloc, alkalinity decreases throughout cultivation, and the medium becomes more acidic. This is due to the nitrification process carried out by the systems chemoautotrophic bacteria, which consume 7.0 g of alkalinity for metabolism and produce 5.85 g of carbon dioxide [43]. According to Furtado et al. [28], it is recommended that alkalinity be kept above 150 mg CaCO3 L−1. To maintain it at this ideal level, calcium carbonate or calcium hydroxide can be used. Using a biofloc inoculum characterized as mature, Ferreira et al. [11] used 112.91 ± 2.99 g of calcium hydroxide in a useful volume of 300 L, resulting in 0.38 g L−1 of calcium hydroxide consumption over 35 days of cultivation. Data from this study showed reduced use of calcium hydroxide to correct alkalinity, with the lowest value in the BIO75 treatment being 0.07 ± 0.06 g L−1 of calcium hydroxide over 45 days of cultivation. The greater steadiness of alkalinity in our treatments is probably related to the absorption of CO2 by the macroalgae. For macroalgae, carbon absorption is essential to maintain a balanced C:N:P (carbon:nitrogen:phosphorus) ratio, participating in the sequestration of carbon dioxide and reducing the acidity of the environment [4]. Another explanation could be the consumption of ammonia by the macroalgae, reducing the nitrification process in the system, and the use of inorganic carbon, which is economically advantageous to the system.
According to Silva et al. [44], only 22% of the nitrogen input is converted into shrimp biomass, 14% remains deposited in the sediment, and 57% is discarded into the environment, suggesting little efficiency in the use of available nitrogen. Ammonia is the most toxic nitrogenous compound in cultivation, and its control methods include water renewal in conventional cultivation or organic fertilization in biofloc systems [38,45]. The CONT treatment, without the use of biofloc inoculum, aimed to use organic fertilization with molasses when concentrations exceeded 1 mg L−1 in order to encourage the growth of heterotrophic bacteria to convert the ammonia in the system into bacterial biomass [22]. However, our study showed that despite the high shrimp stocking (200 shrimp m−3) and no water renewal in the control treatment, there was no increase in ammonia concentrations. The highest daily concentration in the control treatment was 0.54 mg L−1, so it was not necessary to use molasses throughout the experimental period. Macroalgae have a greater affinity for absorbing ammonia because they require less energy during assimilation processes [46]. In this study, the macroalgae in the CONT treatment were probably responsible for the primary absorption of the ammonia produced in the culture, thus delaying the nitrification process and an increase in nitrate concentrations in the culture, which was only seen in the last week of cultivation. Only at the end of cultivation (day 32) was there an increase in nitrate concentration, showing a possible growth of chemoautotrophic bacteria. According to Ferreira et al. [11], the establishment of these bacteria is slow, requiring at least 30 days with the use of chemical fertilizer for them to occur. The use of macroalgae to absorb the compost is advantageous because of the use of residual nutrients to produce biomass with commercial value, minimizing the impacts of the toxicity of this compost on the animals.
In a biofloc system, nitrate is the most concentrated nitrogenous compound at the end of cultivation and is constantly accumulated throughout the experiment due to nitrification by bacteria, which convert ammonia into nitrite and then nitrate [38]. Improper disposal of high levels of nitrate in water bodies can cause diseases such as methemoglobinemia in the population [47]. Therefore, the use of macroalgae as a biological treatment can provide improvements in water quality and effluent treatment. In the absence of high concentrations of ammonia, the macroalgae tend to absorb the nitrate present in the water, which occurred in this experiment, showing an absorption rate of 55% of nitrate by the macroalgae in the T250 treatment. Testing variations from 5 to 400 mg L−1 of nitrate in the water, Farahdiba et al. [48] found an absorption rate of around 90% of nitrate in five days in a static system. Our system is considered to be continuous, where ammonia is produced daily from animal excretion and feed waste and converted into bacterial biomass and nitrate by the bacteria present in the biofloc system. Even though nitrate is produced in the system, there was a rate of removal by the macroalgae, where the final concentration was lower than the initial concentration of the culture.
Phosphate is produced through the leaching of feed and is accumulated throughout cultivation in a biofloc system, being important for macroalgae in the formation of tissues and the process of photosynthesis. As observed by Ramos et al. [49], the use of a form of biological phosphorus removal, such as macroalgae, can be more efficient than filtration and sedimentation. The better rate of nitrate and phosphate absorption may be related to the nitrogen:phosphorus (N:P) balance during the experimental period. According to Zirino et al. [50], the most appropriate N:P ratio for macroalgae would be 30:1, and when it is below 29, nitrogen can be limiting, and when it is above 29, phosphorus can be limiting. During the 12 nutrient samplings, six times the N:P ratio in the T250 treatment was close to ideal, unlike the other treatments which showed a phosphorus limitation in most of the samplings.
The production of solids can come from heterotrophic bacteria, feces production, and leaching from the feed [12]. As there was no addition of organic carbon in the control treatment, the increase in total suspended solids was due to zero water renewal and the accumulation of particulate organic matter, reaching an average of 134.05 ± 81.36 mg L−1 of total suspended solids. Therefore, at the end of the experiment, all treatments had a load of solids present in the system. Even without a significant difference in final weight between the treatments, the growth of the macroalgae may still have been affected due to the low availability of light caused by the biofloc. Macroalgae are sessile organisms in the system and can interfere with the movement of water and cause the accumulation of solids on its surface, as seen in studies such as Carvalho et al. [19,51]. The deposition of solids causes a “shading” effect on the macroalgae and limits their absorption of light. The use of a larger surface area of the cultivation structure adopted in this study compared with Carvalho et al. [19] may have minimized the effect of overlap due to greater movement of the macroalgae in the water column.
The different concentrations of nutrients and solids are directly linked to greater biomass production and nutrient uptake. In this study, the relative growth rate (RGR) of algae had an overall average of 0.45 ± 0.27% day−1, showing an increase in biomass during cultivation. These data differed from those found by Morais et al. [41], who obtained a growth rate of 8.00 ± 0.01% day−1 with U. ohnoi at a density of 1 g L−1 in a biofloc system, where the shrimp water was filtered and pumped into the macroalgae tank once a week, presenting a lower solids load. This difference in growth can be explained by the fact that the macroalgae in this experiment were grown in the same experimental unit as the shrimp and were subject to the accumulation of solids, nutrients, and fluctuations in water quality parameters. This system was used as a way of evaluating the insertion of macroalgae into adapted shrimp farms. The low light incidence for the macroalgae was also a key factor in the low growth rate caused by the greenhouse and the accumulation of solids.
It was also shown that the weight gain of the macroalgae was positively linked to the rate of nutrient removal, indicating that the macroalgae were absorbing nutrients for growth in the first and second weeks. However, in the last week, it was seen that a greater absorption of nitrate was related to weight loss of the macroalgae. Lower growth rates can also be caused by stress, which triggers reproductive events, with the loss of biomass for spore formation [3], so it is likely that the macroalgae were absorbing nutrients and converting this energy into reproductive events rather than growth. Drastic changes in temperature in agricultural greenhouses have been reported, where the lowest temperatures were recorded in the morning and the highest temperatures in the afternoon, which can cause intense spore release, as seen by Carl et al. [52]. In this experiment, the maximum temperature was 30.3, and the minimum was 21.7 °C. A reproduction event can be noticed due to the presence of “ghost tissues,” which are transparent parts due to the release of spores [3], which was noticed in this study throughout the experiment. However, the performance of the macroalgae obtained in this study differed from that presented by Martins et al. [53], who obtained a decrease in biomass during the experiment, which may be associated with the natural environment where the macroalgae were collected and the acclimatization of the macroalgae to the system.
The composition of macroalgae can change according to the environment in which it is found, which can affect its nutritional composition [18]. Msuya & Neori [54] showed that the protein content increases significantly with increasing nutrient addition, reaching 44.3 ± 2.7% protein at the highest level of nutrient addition (38 g N m−2 day−1). The macroalgae cultivated with a concentration of 56.67 ± 5.77 mg L−1 of nitrate (T250) showed higher protein concentrations, probably due to the greater availability of nitrogen in the water compared with the CONT treatment. Even so, the CONT treatment had a higher protein content than studies carried out in clear water, such as Tabarsa et al. [55], who found values of 10.69 ± 0.67 g 100 g−1 of protein in the macroalgae. This high concentration is probably due to the continuous absorption of ammonia excreted by the shrimp. As for the result found for ash, little is known about ash variations in the proximal composition of macroalgae; however, some factors can alter this concentration, such as high macroalgae densities and an inverse proportion of nitrogen concentration in the tissue [56]. Therefore, the higher the nitrogen concentration in the macroalgae tissue, the lower the ash concentration, both factors being verified in this study.
Chlorophylls are green pigments present in thylakoids and are essential in the reaction to capture light and carry out photosynthesis, and their increase is associated with the need to increase the number of pigments to maximize photosynthesis [57]. Therefore, the higher concentrations of chlorophyll-a present in the treatment with inoculum (T250) are associated with the higher organic load present in this treatment, compared with the control, which started in clear water. The biofloc system contains microbial flocs that make up the total suspended solids. This organic load reduces the entry of light into the water and can negatively influence the growth of macroalgae.
The chlorophyll-b values found in this study were also higher than those found by Silva et al. [58], who showed maximum values of 1.21 ± 0.10 µg mg in the macroalgae U. rigida cultivated in a multitrophic system. According to Levavasseur [59], macroalgae increase their absorption spectrum to maximize the capture of light energy. Therefore, the macroalgae in this experiment increased the concentration of chlorophyll-b as a way of capturing light. Fillit. [60], evaluating the effect of seasonal changes on the pigment concentration of the macroalgae U. rigida showed that at times of the year with greater light intensity and photoperiod, the pigment content decreased and that shading effects caused by a greater density of algae also increased the pigment concentration.
Carotenoids are photosynthetic pigments responsible both for collecting light energy and for preventing the formation of reactive oxygen species caused by light and air stress [61]. Our values were similar to those found by Yildiz et al. [62] in the macroalgae U. rigida collected in the environment. However, Eismann et al. [63] show that the variation in total carotenoids is influenced by the growth rates of macroalgae. Therefore, high growth rates increase the carotenoid content, which can reach 0.92 ± 0.57 mg g−1. The low RGR values found in this study may be due to the deposition of solids in the macroalgae because of their accumulation during cultivation and temperature variations, which may have influenced lower concentrations of total carotenoids compared with those found in the literature.
Sampath-Wiley et al. [64] showed that different stressors can affect antioxidant levels in macroalgae. Macroalgae cultivated in the lower intertidal zone that were protected from exposure to light and moisture loss showed a decrease in antioxidant levels. In contrast, the macroalgae cultivated in this study, which were subjected to temperature variations and high concentrations of solids and nutrients and consequently showed a high DPPH inhibition percentage, promoted an increase in antioxidant levels. For phenolic compounds, according to Mabeau & Fleurence [65], the concentrations vary according to the group of macroalgae studied. Green and red macroalgae have a higher protein content and lower levels of phenolic compounds compared with brown macroalgae. Our study showed values similar to those found by Silva et al. [58] of 0.74 ± 0.13 mg GAE g−1 with the macroalgae U. rigida cultivated in an integrated system.

5. Conclusions

The utilization of macroalgae within an integrated system alongside shrimp proved to be feasible in the nitrate and total suspended solids concentrations at 56.67 ± 5.77 mgL−1 and 246.67 ± 2.89 mgL−1, respectively. It also makes the system more sustainable by reusing water from existing biofloc cultivation. The macroalgae exhibited favorable nitrate and phosphate removal rates, indicating the assimilation of these compounds into biomass formation and an increase in economically valuable pigments within the macroalgae. Furthermore, in addition to nutrient absorption, the system effectively maintained alkalinity and pH levels, facilitating the efficient upkeep of biofloc cultivation.

Author Contributions

Conceptualization, A.C., A.P.C. and L.H.P.; Data curation, A.C., Í.B., F.C. and J.R.B.R.; Formal analysis, A.C., Í.B., F.C., J.M.M. and J.R.B.R.; Funding acquisition, L.H.P.; Investigation, A.C., Í.B., F.C., A.P.C., J.R.B.R. and L.H.P.; Methodology, A.C. and L.H.P.; Project administration, W.W.J. and L.H.P.; Resources, A.P.C., W.W.J. and L.H.P.; Supervision, A.P.C., J.M.M., W.W.J. and L.H.P.; Validation, A.C., Í.B. and F.C.; Visualization, J.M.M., J.R.B.R., W.W.J. and L.H.P.; Writing—original draft, A.C.; Writing—review & editing, Í.B., F.C., A.P.C., J.M.M., J.R.B.R., W.W.J. and L.H.P. All authors have read and agreed to the published version of the manuscript.

Funding

This research was funded by ASTRAL Project—H2020 grant Agreement 863034.

Data Availability Statement

Data are contained within the article.

Acknowledgments

The Authors are grateful to the ASTRAL project that has received funding from the European Union’s Horizon 2020 research and innovation program under grant agreement No 863034. Special thanks to the Brazilian Council of Research (CNPq) and Coordination for the Improvement of Higher Level or Education Personnel (CAPES). Luís H. Poersch and Wilson Wasielesky received a productivity research fellowship from CNPq.

Conflicts of Interest

The authors declare that they have no conflict of interest.

References

  1. FAO. State of the World Fisheries and Aquaculture—2022 (SOFIA); FAO: Rome, Italy, 2022; ISBN 9789251072257. [Google Scholar]
  2. de Alencar, J.R.; Junior, P.A.H.; Celino, J.J. Cultivo de Camarão Branco Litopenaeus vannamei (Boone, 1931) Com a Macroalga Ulva lactuca Linneaus (Chlorophyta) No Tratamento de Efluentes Em Sistema Fechado de Recirculação. Rev. Biol. Ciências Terra 2010, 10, 117–137. [Google Scholar]
  3. Copertino, M.D.S.; Tormena, T.; Seeliger, U. Biofiltering Efficiency, Uptake and Assimilation Rates of Ulva clathrata (Roth) J. Agardh (Clorophyceae) Cultivated in Shrimp Aquaculture Waste Water. J. Appl. Phycol. 2009, 21, 31–45. [Google Scholar] [CrossRef]
  4. Chopin, T. Marine Aquaculture in Canada: Well-Established Monocultures of Finfish and Shellfish and an Emerging Integrated Multi-Trophic Aquaculture (IMTA) Approach Including Seaweeds, Other Invertebrates, and Microbial Communities. Fisheries 2015, 40, 28–31. [Google Scholar] [CrossRef]
  5. Chopin, T.; Buschmann, A.H.; Halling, C.; Troell, M.; Kautsky, N.; Neori, A.; Kraemer, G.P.; Zertuche-González, J.A.; Yarish, C.; Neefus, C. Integrating Seaweeds into Marine Aquaculture Systems: A Key toward Sustainability. J. Phycol. 2001, 37, 975–986. [Google Scholar] [CrossRef]
  6. Troell, M.; Joyce, A.; Chopin, T.; Neori, A.; Buschmann, A.H.; Fang, J.G. Ecological Engineering in Aquaculture—Potential for Integrated Multi-Trophic Aquaculture (IMTA) in Marine Offshore Systems. Aquaculture 2009, 297, 1–9. [Google Scholar] [CrossRef]
  7. Nobre, A.M.; Robertson-Andersson, D.; Neori, A.; Sankar, K. Ecological-Economic Assessment of Aquaculture Options: Comparison between Abalone Monoculture and Integrated Multi-Trophic Aquaculture of Abalone and Seaweeds. Aquaculture 2010, 306, 116–126. [Google Scholar] [CrossRef]
  8. Holanda, M.; Wasielesky, W.; de Lara, G.R.; Poersch, L.H. Production of Marine Shrimp Integrated with Tilapia at High Densities and in a Biofloc System: Choosing the Best Spatial Configuration. Fishes 2022, 7, 283. [Google Scholar] [CrossRef]
  9. Verdian, A.H.; Effendi, I.; Budidardi, T.; Diatin, I. Production Performance Improvement of White Shrimp (Litopenaeus vannamei) Culture with Integrated Multi Trophic Aquaculture System in Seribu Islands, Jakarta, Indonesia. Iran. J. Fish. Sci. 2020, 19, 1415–1427. [Google Scholar] [CrossRef]
  10. Poli, M.A.; Legarda, E.C.; de Lorenzo, M.A.; Pinheiro, I.; Martins, M.A.; Seiffert, W.Q.; do Nascimento Vieira, F. Integrated Multitrophic Aquaculture Applied to Shrimp Rearing in a Biofloc System. Aquaculture 2019, 511, 734274. [Google Scholar] [CrossRef]
  11. Ferreira, G.S.; Santos, D.; Schmachtl, F.; Machado, C.; Fernandes, V.; Bögner, M.; Schleder, D.D.; Seiffert, W.Q.; Vieira, F.N. Heterotrophic, Chemoautotrophic and Mature Approaches in Biofloc System for Pacific White Shrimp. Aquaculture 2021, 533, 736099. [Google Scholar] [CrossRef]
  12. Gaona, C.A.P.; de Almeida, M.S.; Viau, V.; Poersch, L.H.; Wasielesky, W. Effect of Different Total Suspended Solids Levels on a Litopenaeus vannamei (Boone, 1931) BFT Culture System during Biofloc Formation. Aquac. Res. 2017, 48, 1070–1079. [Google Scholar] [CrossRef]
  13. Fleckenstein, L.J.; Tierney, T.W.; Fisk, J.C.; Ray, A.J. The Effects of Different Solids and Biological Filters in Intensive Pacific White Shrimp (Litopenaeus vannamei) Production Systems. Aquac. Eng. 2020, 91, 102120. [Google Scholar] [CrossRef]
  14. Queiroz, H.M.; Ferreira, T.O.; Taniguchi, C.A.K.; Barcellos, D.; do Nascimento, J.C.; Nóbrega, G.N.; Otero, X.L.; Artur, A.G. Nitrogen Mineralization and Eutrophication Risks in Mangroves Receiving Shrimp Farming Effluents. Environ. Sci. Pollut. Res. 2020, 27, 34941–34950. [Google Scholar] [CrossRef] [PubMed]
  15. Legarda, E.C.; da Silva, D.; Miranda, C.S.; Pereira, P.K.M.; Martins, M.A.; Machado, C.; de Lorenzo, M.A.; Hayashi, L.; do Nascimento Vieira, F. Sea Lettuce Integrated with Pacific White Shrimp and Mullet Cultivation in Biofloc Impact System Performance and the Sea Lettuce Nutritional Composition. Aquaculture 2021, 534, 736265. [Google Scholar] [CrossRef]
  16. Brito, L.O.; Arantes, R.; Magnotti, C.; Derner, R.; Pchara, F.; Olivera, A.; Vinatea, L. Water Quality and Growth of Pacific White Shrimp Litopenaeus vannamei (Boone) in Co-Culture with Green Seaweed Ulva lactuca (Linaeus) in Intensive System. Aquac. Int. 2014, 22, 497–508. [Google Scholar] [CrossRef]
  17. Reis, W.G.; Wasielesky, W.; Abreu, P.C.; Brandão, H.; Krummenauer, D. Rearing of the Pacific White Shrimp Litopenaeus vannamei (Boone, 1931) in BFT System with Different Photoperiods: Effects on the Microbial Community, Water Quality and Zootechnical Performance. Aquaculture 2019, 508, 19–29. [Google Scholar] [CrossRef]
  18. Duke, C.S.; Litaker, W.; Ramus, J. Effects of the Temperature, Nitrogen Supply and Tissue Nitrogen on Ammonium Uptake Rates of the Chlorophyte Seaweeds Ulva curvata and Codium decorticatum. J. Phycol. 1989, 25, 113–120. [Google Scholar] [CrossRef]
  19. Carvalho, A.; Costa, L.C.d.O.; Holanda, M.; Poersch, L.H.; Turan, G. Influence of Total Suspended Solids on the Growth of the Sea Lettuce Ulva lactuca Integrated with the Pacific White Shrimp Litopenaeus vannamei in a Biofloc System. Fishes 2023, 8, 163. [Google Scholar] [CrossRef]
  20. He, J.; Xu, Y.; Chen, H.; Sun, P. Extraction, Structural Characterization, and Potential Antioxidant Activity of the Polysaccharides from Four Seaweeds. Int. J. Mol. Sci. 2016, 17, 1988. [Google Scholar] [CrossRef]
  21. Jory, D.E.; Cabrera, T.R.; Dugger, D.M.; Fegan, D.; Lee, P.G.; Lawrence, L.; Jackson, C.J.; Mcintosh, R.P.; Castañeda, J.I.; McIntosh, R.; et al. A Global Review of Shrimp Feed Management: Status and Perspectives. Aquaculture 2011, 318, 104–152. [Google Scholar]
  22. Wasielesky, W.; Krummenauer, D.; Lara, G.; Fóes, G. Cultivo de Camarões Em Sistema de Bioflocos: Realidades e Perspectivas. Rev. ABCC 2013, 15, 16–26. [Google Scholar]
  23. Unesco. Chemical Methods for Use in Marine Environmental Monitoring; Intergovernmental Oceanographic Commission: Paris, France, 1983. [Google Scholar]
  24. Bendschneider, K.; Robinson, R.J. New Spectrophotometric Method for the Determination of Nitrite in Water. Fresenius Environ. Bull. 1952, 10, 781–784. [Google Scholar]
  25. Aminot, A.; Chaussepied, M. Manuel Des Analyses Chimiques En Milieu Marin; Centre National pour l’exploitation des océans: Paris, France, 1983. [Google Scholar]
  26. Bogue, J.P.; Smith, L.F.; Lipsett, L. A Practical Handbook. J. High. Educ. 1957, 28, 405. [Google Scholar] [CrossRef]
  27. American Public Health Association APHA; American Water Works Association; Water Pollution Control Association. Standard Methods for the Examination of Water and Wastewater, 21st ed.; American Public Health Association: Washington, DC, USA, 2005. [Google Scholar]
  28. Furtado, P.S.; Poersch, L.H.; Wasielesky, W. Effect of Calcium Hydroxide, Carbonate and Sodium Bicarbonate on Water Quality and Zootechnical Performance of Shrimp Litopenaeus vannamei Reared in Biofloc Technology (BFT) Systems. Aquaculture 2011, 321, 130–135. [Google Scholar] [CrossRef]
  29. Loureiro, R.R.; Reis, R.P.; Critchley, A.T. In Vitro Cultivation of Three Kappaphycus alvarezii (Rhodophyta, Areschougiaceae) Variants (Green, Red and Brown) Exposed to a Commercial Extract of the Brown Alga Ascophyllum nodosum (Fucaceae, Ochrophyta). J. Appl. Phycol. 2010, 22, 101–104. [Google Scholar] [CrossRef]
  30. AOAC. Official Methods of Analysis; Association of Official Analytical Chemists: Arlington, VA, USA, 2005; p. 245. [Google Scholar]
  31. Baethgen, W.E.; Alley, M. A Manual Colorimetric Procedure for Measuring Ammonium Nitrogen in Soil and Plant Kjeldahl Digests. Commun. Soil Sci. Plant Anal. 1989, 20, 961–969. [Google Scholar] [CrossRef]
  32. Barbarino, E.; Lourenço, S.O. An Evaluation of Methods for Extraction and Quantification of Protein from Marine Macro and Microalgae. J. Appl. Phycol. 2005, 17, 447–460. [Google Scholar] [CrossRef]
  33. Lichtenthaler, H.K.; Wellburn, A.R. Determinations of Total Carotenoids and Chlorophylls a and b of Leaf Extracts in Different Solvents. Biochem. Soc. Trans. 1983, 11, 591–592. [Google Scholar] [CrossRef]
  34. Schiavon, M.; Moro, I.; Pilon-Smits, E.A.H.; Matozzo, V.; Malagoli, M.; Dalla Vecchia, F. Accumulation of Selenium in Ulva Sp. and Effects on Morphology, Ultrastructure and Antioxidant Enzymes and Metabolites. Aquat. Toxicol. 2012, 122–123, 222–231. [Google Scholar] [CrossRef]
  35. Farasat, M.; Khavari-Nejad, R.-A.; Nabavi, S.M.B.; Namjooyan, F. Antioxidant Properties of Two Edible Green Seaweeds from Northern Coasts of the Persian Gulf. Jundishapur J. Nat. Pharm. Prod. 2013, 8, 47–52. [Google Scholar] [CrossRef]
  36. Decamp, O.; Cody, J.; Conquest, L.; Delanoy, G.; Tacon, A.G.J. Effect of Salinity on Natural Community and Production of Litopenaeus vannamei (Boone), within Experimental Zero-Water Exchange Culture Systems. Aquac. Res. 2003, 34, 345–355. [Google Scholar] [CrossRef]
  37. Van Wyk, P.; Davis-Hodgkins, M.; Laramore, R.; Main, K.L.; Mountain, J.; Scarpa, J. Farming Marine Shrimp in Recirculating Freshwater Systems Harbor Branch Oceanographic Institution. Farming Mar. Shrimp. Recirc. Freshw. Syst. 1999, 220, 125–140. [Google Scholar]
  38. Krummenauer, D.; Peixoto, S.; Cavalli, R.O.; Poersch, L.H.; Wasielesky, W. Superintensive Culture of White Shrimp, Litopenaeus vannamei, in a Biofloc Technology System in Southern Brazil at Different Stocking Densities. J. World Aquac. Soc. 2011, 42, 726–733. [Google Scholar] [CrossRef]
  39. Wyban, J.; Walsh, W.A.; Godin, D.M. Temperature Effects on Growth, Feeding Rate and Feed Conversion of the Pacific White Shrimp (Penaeus vannamei). Aquaculture 1995, 138, 267–279. [Google Scholar] [CrossRef]
  40. Samocha, T.M.; Patnaik, S.; Speed, M.; Ali, A.M.; Burger, J.M.; Almeida, R.V.; Ayub, Z.; Harisanto, M.; Horowitz, A.; Brock, D.L. Use of Molasses as Carbon Source in Limited Discharge Nursery and Grow-out Systems for Litopenaeus vannamei. Aquac. Eng. 2007, 36, 184–191. [Google Scholar] [CrossRef]
  41. de Morais, A.P.M.; Santos, I.L.; Carneiro, R.F.S.; Routledge, E.A.B.; Hayashi, L.; de Lorenzo, M.A.; do Nascimento Vieira, F. Integrated Multitrophic Aquaculture System Applied to Shrimp, Tilapia, and Seaweed (Ulva ohnoi) Using Biofloc Technology. Aquaculture 2023, 572, 739492. [Google Scholar] [CrossRef]
  42. Bews, E.; Booher, L.; Polizzi, T.; Long, C.; Kim, J.H.; Edwards, M.S. Effects of Salinity and Nutrients on Metabolism and Growth of Ulva lactuca: Implications for Bioremediation of Coastal Watersheds. Mar. Pollut. Bull. 2021, 166, 112199. [Google Scholar] [CrossRef]
  43. Ebeling, J.M.; Timmons, M.B.; Bisogni, J.J. Engineering Analysis of the Stoichiometry of Photoautotrophic, Autotrophic, and Heterotrophic Removal of Ammonia-Nitrogen in Aquaculture Systems. Aquaculture 2006, 257, 346–358. [Google Scholar] [CrossRef]
  44. Da Silva, K.R.; Wasielesky, W.; Abreu, P.C. Nitrogen and Phosphorus Dynamics in the Biofloc Production of the Pacific White Shrimp, Litopenaeus vannamei. J. World Aquac. Soc. 2013, 44, 30–41. [Google Scholar] [CrossRef]
  45. Lin, Y.C.; Chen, J.C. Acute Toxicity of Ammonia on Litopenaeus vannamei Boone Juveniles at Different Salinity Levels. J. Exp. Mar. Biol. Ecol. 2001, 259, 109–119. [Google Scholar] [CrossRef]
  46. Castelar, B.; Reis, R.P.; dos Santos Calheiros, A.C. Ulva lactuca and U. flexuosa (Chlorophyta, Ulvophyceae) Cultivation in Brazilian Tropical Waters: Recruitment, Growth, and Ulvan Yield. J. Appl. Phycol. 2014, 26, 1989–1999. [Google Scholar] [CrossRef]
  47. Macedo, C.F.; Sipaúba-Tavares, L. Eutrofização E Qualidade Da Água Na Piscicultura: Consequências E Recomendações Eutrophication and Water Quality in Pisciculture: Consequences and Recommendations. Bol. Inst. Pesca 2010, 36, 149–163. [Google Scholar]
  48. Farahdiba, A.U.; Hidayah, E.N.; Asmar, G.A.; Myint, Y.W. Growth and Removal of Nitrogen and Phosphorus by a Macroalgae Cladophora glomerata under Different Nitrate Concentrations. Nat. Environ. Pollut. Technol. 2020, 19, 809–813. [Google Scholar] [CrossRef]
  49. Ramos, R.; Vinatea, L.; Santos, J.; Da Costa, R. Tratamiento de Efluentes Del Cultivo de Litopenaeus vannamei Mediante Procesos de Sedimentación, Filtración y Absorción. Lat. Am. J. Aquat. Res. 2010, 38, 188–200. [Google Scholar] [CrossRef]
  50. Zirino, A.; Elwany, H.; Facca, C.; Maicu’, F.; Neira, C.; Mendoza, G. Nitrogen to Phosphorus Ratio in the Venice (Italy) Lagoon (2001–2010) and Its Relation to Macroalgae. Mar. Chem. 2016, 180, 33–41. [Google Scholar] [CrossRef]
  51. Carvalho, A.; Costa, L.C.d.O.; Holanda, M.; Gonçalves, M.; Santos, J.; Costa, C.S.B.; Turan, G.; Poersch, L.H. Growth of the Macroalgae Ulva lactuca Cultivated at Different Depths in a Biofloc Integrated System with Shrimp and Fish. Phycology 2023, 3, 280–293. [Google Scholar] [CrossRef]
  52. Carl, C.; De Nys, R.; Lawton, R.J.; Paul, N.A. Methods for the Induction of Reproduction in a Tropical Species of Filamentous Ulva. PLoS ONE 2014, 9, 2–11. [Google Scholar] [CrossRef]
  53. Martins, M.A.; da SILVA, V.F.; Tarapuez, P.R.; Hayashi, L.; Vieira, F.D.N. Cultivation of the Seaweed Ulva Spp. with Effluent from a Shrimp Biofloc Rearing System: Different Species and Stocking Density. Bol. Inst. Pesca 2020, 46. [Google Scholar] [CrossRef]
  54. Msuya, F.E.; Neori, A. Effect of Water Aeration and Nutrient Load Level on Biomass Yield, N Uptake and Protein Content of the Seaweed Ulva lactuca Cultured in Seawater Tanks. J. Appl. Phycol. 2008, 20, 1021–1031. [Google Scholar] [CrossRef]
  55. Tabarsa, M.; Rezaei, M.; Ramezanpour, Z.; Waaland, J.R. Chemical Compositions of the Marine Algae Gracilaria salicornia (Rhodophyta) and Ulva lactuca (Chlorophyta) as a Potential Food Source. J. Sci. Food Agric. 2012, 92, 2500–2506. [Google Scholar] [CrossRef]
  56. Queirós, A.S.; Circuncisão, A.R.; Pereira, E.; Válega, M.; Abreu, M.H.; Silva, A.M.S.; Cardoso, S.M. Valuable Nutrients from Ulva rigida: Modulation by Seasonal and Cultivation Factors. Appl. Sci. 2021, 11, 6137. [Google Scholar] [CrossRef]
  57. Holdt, S.L.; Kraan, S. Bioactive Compounds in Seaweed: Functional Food Applications and Legislation. J. Appl. Phycol. 2011, 23, 543–597. [Google Scholar] [CrossRef]
  58. Silva, A.F.R.; Abreu, H.; Silva, A.M.S.; Cardoso, S.M. Effect of Oven-Drying on the Recovery of Valuable Compounds from Ulva rigida, Gracilaria Sp. and Fucus vesiculosus. Mar. Drugs 2019, 17, 90. [Google Scholar] [CrossRef] [PubMed]
  59. Levavasseur, G. Analyse Comparée Des Complexes Pigment-Protéines de Chlorophycophytes Marines Benthiques. Phycologia 1989, 28, 1–14. [Google Scholar] [CrossRef]
  60. Fillit, M. Seasonal Changes in the Photosynthetic Capacities and Pigment Content of Ulva rigida in a Mediterranean Coastal Lagoon. Bot. Mar. 1995, 38, 271–280. [Google Scholar] [CrossRef]
  61. Astorg, P. Food Carotenoids and Cancer Prevention: An Overview of Current Research. Trends Food Sci. Technol. 1997, 8, 406–413. [Google Scholar] [CrossRef]
  62. Yildiz, G.; Celikler, S.; Vatan, O.; Dere, S. Determination of the Anti-Oxidative Capacity and Bioactive Compounds in Green Seaweed Ulva rigida C. Agardh. Int. J. Food Prop. 2012, 15, 1182–1189. [Google Scholar] [CrossRef]
  63. Eismann, A.I.; Perpetuo Reis, R.; Ferreira da Silva, A.; Negrão Cavalcanti, D. Ulva Spp. Carotenoids: Responses to Environmental Conditions. Algal Res. 2020, 48, 101916. [Google Scholar] [CrossRef]
  64. Sampath-Wiley, P.; Neefus, C.D.; Jahnke, L.S. Seasonal Effects of Sun Exposure and Emersion on Intertidal Seaweed Physiology: Fluctuations in Antioxidant Contents, Photosynthetic Pigments and Photosynthetic Efficiency in the Red Alga Porphyra umbilicalis Kützing (Rhodophyta, Bangiales). J. Exp. Mar. Biol. Ecol. 2008, 361, 83–91. [Google Scholar] [CrossRef]
  65. Mabeau, S.; Fleurence, J. Seaweed in Food Products: Biochemical and Nutritional Aspects. Trends Food Sci. Technol. 1993, 4, 103–107. [Google Scholar] [CrossRef]
Figure 1. Diagram of the experimental units used for shrimp and macroalgae. (A) Tanks with a useful volume of 180 L, with constant aeration, and a circular structure for the macroalgae. (B) Circular structure with a diameter of 0.60 cm for the cultivation of macroalgae.
Phycology 04 00002 g001
Figure 2. Nitrate concentrations in treatments CONT (cultivation in clear water), T100 (use of 25% biofloc inoculum, a concentration of approximately 100 mg L1 of total suspended solids), T200 (use of 50% biofloc inoculum, a concentration of approximately 200 mg L1 of total suspended solids), T250 (use of 75% biofloc inoculum, a concentration of approximately 250 mg L1 of total suspended solids), T300 (use of 100% biofloc inoculum, a concentration of approximately 300 mg L1 of total suspended solids). Different lowercase letters on the same line represent a significant difference (p ≤ 0.05) in the same treatment at the beginning and end. Different capital letters represent a significant difference (p ≤ 0.05) between treatments on the same day after performing a one-way ANOVA followed by Tukey’s test.
Phycology 04 00002 g002
Table 1. Initial characteristics of the treatments CONT (cultivation in clear water), T100 (use of 25% biofloc inoculum, a concentration of approximately 100 mg L−1 of total suspended solids), T200 (use of 50% biofloc inoculum, a concentration of approximately 200 mg L−1 of total suspended solids), T250 (use of 75% biofloc inoculum, a concentration of approximately 250 mg L−1 of total suspended solids), T300 (use of 100% biofloc inoculum, a concentration of approximately 300 mg L−1 of total suspended solids).
Treatments
ParametersCONTT100T200T250T300
Total ammonia N–NH3 (mg L−1)0.02 ± 0.000.04 ± 0.010.04 ± 0.010.05 ± 0.030.09 ± 0.01
Nitrite NO2—N (mg L−1)0.01 ± 0.010.02 ± 0.000.02 ± 0.000.01 ± 0.030.01 ± 0.03
Nitrate NO3—N (mg L−1)0.05 ± 0.04 a28.33 ± 5.77 b45.00 ± 0.00 c56.67 ± 5.77 d73.33 ± 5.77 e
Phosphate P–PO4−3 (mg L−1)0.14 ± 0.03 a0.81 ± 0.12 b1.25 ± 0.05 c1.55 ± 0.14 d1.60 ± 0.00 e
SS (mL L−1)0.00 ± 0.00 a1.97 ± 1.38 b8.00 ± 1.00 c11.67 ± 0.58 d19.67 ± 0.58 e
TSS (mg L−1)11.67 ± 2.89 a111.67 ± 63.31 b213.33 ± 50.08 c246.67 ± 2.89 d325.00 ± 21.21 e
Turbidity (NTU)2.57 ± 0.37 a26.23 ± 18.01 b74.63 ± 62.35 c176.10 ± 18.36 d304.10 ± 12.77 e
SS (Settleable Solids); TSS (Total Suspended Solids). Different letters in the same line represent significant differences (p ≤ 0.05) between treatments after one-way ANOVA with Tukey’s post-hoc test.
Table 2. Water quality during the 45 days of cultivation, in treatments CONT (cultivation in clear water), T100 (use of 25% biofloc inoculum, a concentration of approximately 100 mg L−1 of total suspended solids), T200 (use of 50% biofloc inoculum, a concentration of approximately 200 mg L−1 of total suspended solids), T250 (use of 75% biofloc inoculum, a concentration of approximately 250 mg L−1 of total suspended solids), T300 (use of 100% biofloc inoculum, a concentration of approximately 300 mg L−1 of total suspended solids).
Treatments
ParametersCONTT100T200T250T300
Temperature (°C)26.92 ± 2.3026.55 ± 2.1826.56 ± 2.1826.79 ± 2.4626.56 ± 2.19
DO (mg L−1)5.89 ± 0.706.03 ± 0.716.00 ± 0.705.90 ± 0.745.98 ± 0.71
pH8.15 ± 0.09 c8.18 ± 0.07 c8.16 ± 0.08 b8.23 ± 0.07 a8.22 ± 0.07 a
Salinity (‰)30.43 ± 1.81 a30.00 ± 0.51 a29.43 ± 1.57 a29.19 ± 1.40 ab27.90 ± 0.66 b
Alkalinity (mg CaCO3 L−1)173.33 ± 23.93 cb174.36 ± 21.40 cb175.66 ± 24.69 cb205.92 ± 34.15 a183.08 ± 27.05 b
Total ammonia N–NH3 (mg L−1)0.12 ± 0.070.11 ± 0.030.09 ± 0.030.10 ± 0.020.10 ± 0.03
Nitrite NO2—N (mg L−1)0.26 ± 0.55 a1.06 ± 1.36 b1.30 ± 1.96 b1.40 ± 2.43 b0.35 ± 0.40 b
Nitrate NO3—N (mg L−1)1.56 ± 3.13 a19.53 ± 3.53 b32.25 ± 4.85 c44.97 ± 9.01 d59.38 ± 6.80 e
Phosphate P-PO4− 3 (mg L−1)0.56 ± 0.36 a0.79 ± 0.38 ab1.21 ± 0.39 b1.16 ± 0.30 b1.67 ± 0.26 c
SS (mL L−1)2.65 ± 2.34 a5.93 ± 3.33 b11.15 ± 3.17 c15.08 ± 4.39 d21.71 ± 4.98 e
TSS (mg L−1)134.05 ± 81.36 a232.62 ± 92.76 b290.48 ± 65.36 b354.05 ± 88.69 c403.69 ± 79.03 c
Turbidity (NTU)80.37 ± 62.71 a106.26 ± 79.79 a167.31 ± 95.65 ab232.91 ± 101.9 b287.48 ± 104.59 b
Calcium hydroxide (g L−1) #0.13 ± 0.030.10 ± 0.000.13 ± 0.060.07 ± 0.060.08 ± 0.03
Removal rate
Nitrate (%)00.00 ± 00.00 c28.0 ± 13.0 b17.0 ± 15.0 bc55.0 ± 4.0 a38.0 ± 11.0 ab
Phosphate (%)00.00 ± 00.00 b00.00 ± 00.00 b00.00 ± 00.00 b31.0 ± 10.0 a00.00 ± 00.00 b
DO (dissolved oxygen); SS (Settleable Solids); TSS (Total Suspended Solids); # Use of calcium hydroxide per treatment. Different letters in the same line represent significant differences (p ≤ 0.05) between treatments after one-way ANOVA with Tukey’s post-hoc test.
Table 3. Performance of macroalgae during 45 days of cultivation, in treatments CONT (cultivation in clear water), T100 (use of 25% biofloc inoculum, a concentration of approximately 100 mg L−1 of total suspended solids), T200 (use of 50% biofloc inoculum, a concentration of approximately 200 mg L−1 of total suspended solids), T250 (use of 75% biofloc inoculum, a concentration of approximately 250 mg L−1 of total suspended solids), T300 (use of 100% biofloc inoculum, a concentration of approximately 300 mg L−1 of total suspended solids).
Treatments
CONTT100T200T250T300
Initial mean weight (g—FW)250.31 ± 0.31250.05 ± 0.02250.0 ± 0.00250.51 ± 0.41250.06 ± 0.04
Final mean weight (g—FW)387.33 ± 115.09317.67 ± 60.86289.0 ± 73.75304.33 ± 76.20275.0 ± 36.69
RGR (% dia−1)0.89 ± 0.610.49 ± 0.410.27 ± 0.520.38 ± 0.520.19 ± 0.30
RGR (relative growth rate); FW (fresh weight).
Table 4. Proximal composition and biocompounds of the macroalgae (dry matter) at the end of cultivation in the CONT (cultivation in clear water) and T250 (use of 75% biofloc inoculum, a concentration of approximately 250 mg L−1 of total suspended solids) treatments.
Treatments
Proximal CompositionCONTT250
Moisture (%) #77.42 ± 0.09 b75.50 ± 0.23 a
Protein content (%)22.85 ± 0.37 b24.26 ± 0.89 a
Lipids (%)0.53 ± 0.190.48 ± 0.19
Ash (%)30.17 ± 1.80 b28.30 ± 0.64 a
Fiber (%)10.65 ± 0.7811.59 ± 3.41
Non-nitrogenous extract (%)35.77 ± 1.3035.58 ± 1.44
Biochemical Analysis
Protein (%)23.30 ± 1.5925.85 ± 2.81
DPPH (%)90.31± 5.3892.97 ± 5.80
Chlorophyll-a (mg g−1)2.18 ± 0.03 b2.27 ± 0.03 a
Chlorophyll-b (mg g−1)2.99 ± 0.283.31 ± 0.10
Carotenoids (mg g−1)0.19 ± 0.100.10 ± 0.03
Total Polyphenols (mg GAE g−1)0.38 ± 0.120.33 ± 0.09
NNE (non-nitrogenous extract); # humid matter. Different letters represent significant differences (p ≤ 0.05) between treatments after Student’s t-test.
Table 5. Performance of the shrimp during the 45 days of cultivation, in the treatments CONT (cultivation in clear water), T100 (use of 25% biofloc inoculum, a concentration of approximately 100 mg L−1 of total suspended solids), T200 (use of 50% biofloc inoculum, a concentration of approximately 200 mg L−1 of total suspended solids), T250 (use of 75% biofloc inoculum, a concentration of approximately 250 mg L−1 of total suspended solids), T300 (use of 100% biofloc inoculum, a concentration of approximately 300 mg L−1 of total suspended solids).
Treatments
ShrimpCONTT100T200T250T300
Final mean weight (g)6.47 ± 0.276.60 ± 0.805.89 ± 0.256.72 ± 0.266.31 ± 0.16
WGW (g week−1)0.38 ± 0.040.40 ± 0.120.30 ± 0.040.42 ± 0.040.36 ± 0.03
Final biomass (g)232.78 ± 9.84227.72 ± 12.62211.97 ± 8.96235.07 ± 4.38216.45 ± 17.65
Survival (%)96.30 ± 6.4196.30 ± 6.41100.0 ± 0.097.22 ± 4.8195.37 ± 8.02
FCR1.90 ± 0.192.13 ± 0.302.18 ± 0.272.03 ± 0.092.41 ± 0.59
Productivity (kg m−3)1.28 ± 0.041.26 ± 0.071.18 ± 0.051.31 ± 0.021.20 ± 0.10
FCR (Food Conversion Rate); WGW (Weekly Weight gain).
Disclaimer/Publisher’s Note: The statements, opinions and data contained in all publications are solely those of the individual author(s) and contributor(s) and not of MDPI and/or the editor(s). MDPI and/or the editor(s) disclaim responsibility for any injury to people or property resulting from any ideas, methods, instructions or products referred to in the content.

