
Article

Low-Temperature Long-Time Pasteurization Reduces β-Carotene in Colostrum: Effects of Dietary β-Carotene Supplementation on Oxidative Stress, Fecal Microbiota, and Diarrhea in Preweaning Calves

1
College of Veterinary Medicine, China Agricultural University, Beijing 100193, China
2
Hebei Shounong Modern Agricultural Technology Co., Ltd., Baoding 073000, China
3
College of Veterinary Medicine, Hebei Agricultural University, Baoding 071000, China
*
Authors to whom correspondence should be addressed.
Ruminants 2026, 6(3), 63; https://doi.org/10.3390/ruminants6030063
Submission received: 20 June 2026 / Revised: 17 July 2026 / Accepted: 21 July 2026 / Published: 22 July 2026

Simple Summary

Low-temperature long-time pasteurization (LTLT) is widely used on dairy farms to reduce microbial contamination of milk fed to calves. This study comprised two related experiments. Experiment 1 evaluated the effects of LTLT on selected vitamins in bovine colostrum and mature milk. Experiment 2 independently evaluated the effects of dietary β-carotene supplementation in preweaning calves. LTLT reduced β-carotene concentration in colostrum under the conditions evaluated. In the feeding experiment, β-carotene supplementation affected several antioxidant indicators, reduced cortisol concentrations and the frequency of severe diarrhea scores, and altered fecal microbial composition.

Abstract

This study comprised two related experiments. Experiment 1 evaluated the effects of low-temperature long-time pasteurization (LTLT, 63 °C for 30 min) on selected vitamins in bovine colostrum and mature milk. Experiment 2 independently evaluated the effects of dietary β-carotene supplementation on growth performance, fecal scores, oxidative status, cortisol concentrations, and fecal microbiota in preweaning calves. In Experiment 1, colostrum and mature milk were collected from four primiparous and four multiparous Holstein cows before and after LTLT. Concentrations of vitamin A, β-carotene, vitamin B1, vitamin B2, vitamin B9, and vitamin B12 were determined. In Experiment 2, 128 neonatal Holstein heifer calves were randomly assigned to a control group or a β-carotene-supplemented group (100 mg/day/calf) for 56 days. Growth performance, fecal scores, serum antioxidant indicators, cortisol concentrations, and fecal microbiota were evaluated. Colostrum contained substantially higher β-carotene concentrations than mature milk, particularly in primiparous cows (p < 0.001). LTLT reduced β-carotene concentrations by 30% in colostrum(p = 0.034) and significantly decreased vitamin B1 (p < 0.001), whereas the remaining vitamins were only minimally affected. Dietary β-carotene supplementation stabilized antioxidant enzyme activities, reduced serum malondialdehyde and cortisol concentrations (p < 0.001), decreased the occurrence of severe diarrhea (p = 0.046), increased the relative abundance of Blautia, and reduced Fusobacterium and Parabacteroides. Average daily gain did not differ between treatments (p = 0.154). Under the conditions evaluated in Experiment 1, β-carotene was the vitamin most affected by LTLT in colostrum. In the separate feeding experiment, dietary β-carotene supplementation affected several antioxidant indicators, reduced cortisol concentrations and the frequency of severe diarrhea scores, and altered fecal microbial composition, but did not affect average daily gain.

1. Introduction

Healthy calves are the foundation for the stable productivity and sustainable development of dairy farms, and nutritional management is essential for maintaining calf health. Therefore, neonatal calf colostrum management and nutritional regulation during the preweaning phase have become focal points in modern dairy farming [1]. Diarrhea is the primary health problem faced by calves before weaning, and it is closely related to oxidative stress (OS), a condition that occurs when the generation of reactive oxygen species exceeds the clearance capacity of the body’s endogenous antioxidant defense system [2,3,4]. During this growth phase, calves are exposed to multiple stress factors, leading to excessive free radical production [5]. When free radical accumulation exceeds the clearance capacity of the endogenous antioxidant system, oxidative imbalance arises [5]. At this stage, the calf’s immune system is not fully mature. OS exacerbates cell damage, suppresses immune responses, and disrupts intestinal barrier integrity, significantly increasing susceptibility to pathogens [6,7]. It particularly induces intestinal mucosal damage and subsequent diarrhea [8]. Therefore, ensuring sufficient intake of antioxidant nutrients during the preweaning phase is crucial for improving intestinal health and reducing calf diarrhea incidence.
The primary nutritional sources for preweaning calves are whole milk (or milk replacers) and starter feed. However, starter feed intake is relatively low, and rumen function remains underdeveloped, making it difficult for calves to acquire adequate antioxidant nutrients from conventional diets [9]. Additionally, most commercial dairy farms apply low-temperature long-time pasteurization (LTLT, 63 °C for 30 min) to raw milk, which inevitably degrades certain antioxidant nutrients such as vitamins and β-carotene [10,11,12]. In this context, dietary supplementation with exogenous antioxidants to alleviate OS and improve calf health holds important research value and application prospects [13].
β-carotene is a naturally present in colostrum and has two main physiological functions [14]. It serves as a precursor for vitamin A (VA) synthesis and can quench singlet oxygen and scavenge peroxyl radicals [15]. Previous cattle studies have reported effects of β-carotene supplementation on antioxidant and immune indicators, although the results have varied among experimental designs and animal populations [16,17]. Condron et al. found that increased dietary β-carotene elevated plasma retinol and β-carotene isomer concentrations in beef cattle, but did not improve growth performance [18]. Kadek et al. reported changes in several serum antioxidant indicators after intramuscular administration of β-carotene and α-tocopherol to growing heifers [19]. However, the animals and administration routes used in these studies differed from those of dietary supplementation in preweaning dairy calves. β-Carotene may also be associated with changes in fecal microbial composition, but evidence in neonatal ruminants remains limited [20]. To date, direct evidence regarding the effects of dietary β-carotene supplementation on growth performance and health status of preweaning dairy calves is still limited, representing a notable research gap.
This study comprised two related experiments addressing distinct research questions. Experiment 1 evaluated the effects of parity and LTLT on the concentrations of selected vitamins in colostrum and mature milk. The results of Experiment 1 informed the selection of β-carotene for further evaluation, but did not establish β-carotene deficiency in calves. Otomaru et al. supplemented preweaning calves with 20 mg β-carotene per day and observed a significant between-group difference in an oxidative stress indicator only at week 4 [21]. An existing feeding guideline recommends adding 100 mg β-carotene per kilogram of dry milk replacer for young calves [22]. Based on the estimated daily intake of approximately 1 kg of milk replacer powder, 100 mg/day/calf β-carotene was selected as an exploratory dose. Experiment 2 independently evaluated the effects of this dose on growth performance, fecal score (FS), serum OS biomarkers, cortisol concentrations and fecal microbial composition in preweaning calves.

2. Materials and Methods

2.1. Animal Ethics

The animal procedures conducted in this study was approved on 15 August 2022, by the Laboratory Animal Welfare and Animal Experiment Ethics Committee of China Agricultural University (Approval No. AW21214202-2-01).

2.2. Animals, Diet, and Experimental Design

This randomized controlled experiment tested a basal diet with or without β-carotene supplementation. The R Trialsize Package (Version: 1.4.1) was used to determine the sample size [23]. The primary outcome was preweaning calves’ average daily gain (ADG). From pilot data, we set the standard deviation at 98.3 g/d and the minimum detectable difference at 70 g/d. A two-sided t-test was planned, with a significance level of 0.05 and power of 95%. Under these assumptions, 51 calves per group were required. We anticipated a 15% attrition rate, which raised the target to 121 calves. A total of 128 calves were ultimately enrolled and randomly assigned to two groups, with 64 calves in each.
This feeding experiment was conducted between January 2022 and December 2023 at a commercial dairy farm in Hebei, China. The study comprised two experiments. Experiment 1 assessed parity and LTLT effects on milk vitamin content. Four primiparous and four multiparous cows (2–3 parities) were monitored. Colostrum was collected immediately after calving, and mature milk was sampled on day 5 postpartum. High-performance liquid chromatography was used to evaluate changes in VA, β-carotene, vitamin B1 (VB1), vitamin B2 (VB2), vitamin B9 (VB9), and vitamin B12 (VB12) pre- and post-LTLT. Based on Experiment 1’s findings, β-carotene was selected for Experiment 2’s investigation into its effects on preweaning calf growth, OS, and intestinal microbiota. A total of 128 healthy Holstein heifers (30–45 kg; 1 day of age; total serum protein > 5.0 g/dL) were selected from a single farm and randomly assigned to two groups (n = 64 per group): control group (CON; no β-carotene supplementation) and β-carotene-supplemented group (BC; 100 mg/day/calf). Standard health assessments, including evaluation of mental status, nasal and ocular discharge, and coughing frequency, were performed prior to enrollment. Following parturition, all calves received colostrum and were individually housed. The addition of beta-carotene was carried out from a product with a concentration of 10% (ROVIMIX β-carotene, DSM (China) Co., Ltd., Shanghai, China). The carrier matrix consisted mainly of gelatin. Calves were housed in individual sand-bedded pens within a naturally ventilated barn starting one day after birth. Fresh water was provided ad libitum, with troughs cleaned daily. Bedding was replaced, and pens were disinfected every two days according to farm protocols. Baseline calf characteristics and feeding schedules are presented in Table 1, while the composition and nutrient profile of the basal diet are shown in Table 2.

2.3. Sample Collection and Analysis

2.3.1. Vitamins and β-Carotene Analysis in Milk

Eight healthy Holstein cows with similar body condition scores were selected and divided into two groups: primiparous (first parity) and multiparous (≥second parity). Colostrum (harvested within 24 h postpartum) and mature milk (sampled on day 5 postpartum) were collected. Each sample was immediately split into two aliquots upon collection: one was retained as raw milk, and the other was heat-treated at 63 °C for 30 min to simulate LTLT. All samples were stored in the dark at 0–4 °C, transported under cold chain conditions, and analyzed at the Dairy Quality Inspection Station of Beijing Dairy Cattle Center. All analyses were completed within 3 days of sampling. VA [25] and β-carotene [26] were determined according to standard methods. Briefly, after saponification, extraction, purification, and concentration, samples were separated on a C30 reversed-phase liquid chromatography column and detected with an ultraviolet detector. VA and β-carotene were quantified using the external standard method. VB1 [27], VB2 [28], VB9 [29], and VB12 [30] were determined according to standard methods. VB1 and VB2 were analyzed after acid hydrolysis and enzymatic digestion. VB9 and VB12 were quantified by microplate microbiological assay. Lactobacillus rhamnosus was used as the indicator strain for VB9, while Lactobacillus reuteri was applied for VB12. Key instruments used included: a MAXX4 colostrum pasteurizer (Calvex A/S, Skive, Denmark); a 1260 high-performance liquid chromatograph (Agilent Technologies, Santa Clara, CA, USA); a ELx800 microplate reader (BioTek Instruments, Winooski, VT, USA); a 2500 UV–visible spectrophotometer (Shimadzu, Kyoto, Japan); and VitaFast assay kits (VB9: KF-44852; VB12: K1244880; R-Biopharm AG, Darmstadt, Germany).

2.3.2. Performance Measurement

All calves were weighed on an electronic scale on an empty stomach at birth and at 56 d of age to calculate ADG during the experiment. FS was performed daily using the University of Wisconsin 4-point scale [31]. Scoring criteria: 0 = normal feces; 1 = semi-formed, pasty feces; 2 = loose feces retained on bedding; 3 = watery feces penetrating bedding. Calves with scores of 0 or 1 were monitored continuously. A score of 2 indicated diarrhea, and 3 indicated severe diarrhea. Calves with an FS of 2 were treated with oral electrolyte supplementation as supportive therapy. Calves with an FS of 3 initially received oral electrolyte supplementation, and ceftiofur sodium was administered by intramuscular injection when antibiotic treatment was considered necessary. All treatments were performed according to the manufacturer’s instructions and continued until clinical recovery. FS was independently performed by two veterinarians who were blinded to treatment allocation throughout the experimental period.

2.3.3. Oxidative Stress Marker Analysis

From each group, 24 calves were selected via simple random sampling for longitudinal analysis. Blood samples were collected at 1, 28, and 56 days of age. To mitigate stress-related artifacts, all sampling was performed prior to morning feeding, and calves were handled with care during restraint. Six milliliters of blood was drawn from each calf into standard vacuum collection tubes. Samples were centrifuged at 4000 r/min for 3 min, and the resulting serum supernatant was aliquoted into cryovials. These samples were immediately stored in liquid nitrogen and subsequently transported under cold chain conditions. All analyses were completed within seven days of sample collection. Quantification of all biomarkers was performed using commercial assay kits obtained from Beijing Solarbio Science & Technology Co., Ltd. (Beijing, China). The parameters measured included total antioxidant capacity (T-AOC; kit no. BC1315), superoxide dismutase (SOD; kit no. BC0175), catalase (CAT; kit no. BC0200), malondialdehyde (MDA; kit no. BC0025), glutathione peroxidase (GSH-Px, kit no. BC6275), and cortisol (kit no. SEKSM-0071). All procedures were conducted in strict accordance with the manufacturer’s instructions. Each sample was assayed in duplicate, and the mean value was recorded as the final result. Absorbance was measured using a Sunrise microplate reader (Tecan, Männedorf, Switzerland).

2.3.4. Fecal Microbiota Analysis

Rectal fecal samples were collected from the same 24 calves in each group at 1, 28, and 56 days of age. These calves were the same individuals whose serum had been sampled at the same timepoints. Before sampling, the calves’ perianal regions were disinfected. Personnel wore disposable gloves. Each calf used a new sterile swab. Swabs were inserted 2–3 cm into the rectum, rotated 3–5 times, and collected 1–2 g of feces. Samples were placed in RNase/DNase-free tubes, chilled at 0–4 °C, then flash-frozen in liquid nitrogen within 30 min. Samples were sequenced using 16S rRNA high-throughput methods.
Total genomic DNA was extracted from the samples using the CTAB and SDS method. DNA concentration was determined with a NanoDrop 2000 spectrophotometer (Thermo Fisher Scientific, Wilmington, DE, USA), and DNA purity and integrity were evaluated by 1% agarose gel electrophoresis. Using diluted DNA (1 ng/μL) as the template, the V3–V4 hypervariable region of the bacterial 16S rRNA gene was amplified with barcoded specific primers 341F (5′-CCTAYGGGRBGCASCAG-3′) and 806R (5′-GGACTACNNGGGTATCTAAT-3′). PCR was performed in a 30 μL reaction system containing 15 μL High-Fidelity PCR Master Mix (New England Biolabs, Ipswich, MA, USA), 0.2 μM forward and reverse primers, and 10 ng template DNA. Thermal cycling conditions included an initial denaturation at 98 °C for 1 min, 30 cycles of denaturation at 98 °C for 10 s, annealing at 50 °C for 30 s, and extension at 72 °C for 30 s, followed by a final extension at 72 °C for 5 min. PCR products were verified by 2% agarose gel electrophoresis, mixed at equimolar concentrations, and purified using the TIANgel Purification Kit (TIANGEN Biotech, Beijing, China). Sequencing libraries were constructed using the TIANSeq Fast DNA Library Prep Kit (TIANGEN Biotech, Beijing, China). Library quality was assessed using a Qubit 2.0 Fluorometer (Thermo Fisher Scientific, Wilmington, DE, USA) and an Agilent Bioanalyzer 2100 system. Finally, 2 × 250 bp paired-end sequencing was performed on the HiSeq 2500 platform (Illumina, Bejing, China) to characterize microbial community diversity.

2.4. Statistical Analysis

All data were analyzed using SPSS 27.0 software. Significance was declared at p < 0.05 and trends at 0.05 ≤ p < 0.10.
Vitamins and β-carotene data were subjected to three-factor general linear model ANOVA under a 2 × 2 × 2 factorial design. Homogeneity of variance was confirmed by Levene’s test (p > 0.05). Bonferroni post-hoc tests were applied to significant interaction effects:
Y ijkl = μ + P i +   M j   + Pas k + ( P × M ) ij + ( P   × Pas ) ik + ( M × Pas ) jk + ( P × M × Pas ) ijk + ε ijkl
where: Yijkl, observed vitamin content; μ, overall mean; Pi, parity effect; Mj, milk type effect; Pask, LTLT effect; (P × M)ij, (P × Pas)ik, (M × Pas)jk, second-order interaction effects; (P × M × Pas)ijk, third-order interaction effect; εijkl: random error.
Body weight (BW) data were compared using an independent-samples t-test. Diarrhea incidence was analyzed by the Pearson χ2 test. The average number of diarrhea episodes per calf and the average frequency of each FS per calf were analyzed by the Mann–Whitney U test with Bonferroni correction for multiple comparisons:
Diarrhea incidence (%) = Nd/64 × 100; Average diarrhea episodes per calf = Td/64; Average FS i frequency per calf = Tfs(i)/64 (i = 0, 1, 2, 3).
Here, Nd, number of diarrheal calves per group (n = 64); Td, total diarrhea events per calf; Tfs(i), total times of FS i per calf.
Serum OS and cortisol levels were analyzed using repeated-measures general linear model. Normality and homogeneity of variance were verified. Bonferroni post-hoc tests were applied to significant interaction effects:
Y i j k = μ + T R T i + T i m e j + ( T R T × T i m e ) i j + e i j k
where: Yijk, dependent variable; μ, overall mean; TRTi, supplement group fixed effect; Timej, time fixed effect; (TRT × Time)ij, supplement × time interaction effect; eijk: random error.
Fecal microbiome bioinformatics analyses were conducted in QIIME 2, following standard official pipelines. Raw sequences were demultiplexed via the demux plugin, and primer sequences were trimmed using cutadapt. The DADA2 pipeline was used for subsequent quality filtering, denoising, sequence merging, and chimera removal. Taxonomic annotation was performed with the SILVA database for 16S sequences. Multiple sequence alignment was conducted in QIIME 2 to characterize dominant taxa across sample groups. Six indices, including ACE, Chao1, Simpson, Shannon, Pielou and Good’s coverage, were calculated to evaluate alpha diversity. All alpha diversity metrics were generated in QIIME 2 and visualized using R software. Beta diversity was assessed based on weighted UniFrac distances. Principal component analysis (PCA) was performed in R to reduce dimensionality. PCoA was further applied to visualize microbial community dissimilarity, with two-dimensional graphs plotted via R. LEfSe was adopted to screen differential microbial taxa, and the LDA ≥ 2.0 to identify signature differential genera. The relative abundances of differential genera across three time points, together with six alpha diversity indicators, including the ACE index, were analyzed by a repeated-measures mixed-effects model. Group, age, and their interaction were defined as fixed effects, and the individual calf was included as a random effect. The Bonferroni method was applied for multiple comparison correction.

3. Results

3.1. Effects of Parity, Milk Type, and Low-Temperature Long-Time Pasteurization on Milk Vitamin Concentrations

Vitamin concentrations in bovine milk were strongly influenced by parity, lactation stage, and LTLT in Table 3. Detailed model-based contrasts for the effect of LTLT within each parity and milk-type combination, expressed as estimated differences between post-LTLT and pre-LTLT concentrations together with their 95% confidence intervals, are provided in Supplementary Table S1. LTLT decreased VB1 concentrations (p < 0.001), whereas VB2 and VB9 were unaffected (p = 0.950 and p = 0.305, respectively). No significant main effects of parity, milk type, or LTLT were observed for VB12 (all p ≥ 0.153), although the parity × milk type interaction showed a statistical tendency (p = 0.065). Significant parity × milk type interactions were observed for VA, β-carotene, VB1, and VB9 (p ≤ 0.003), indicating that the effect of parity differed between colostrum and mature milk. A significant milk type × LTLT interaction was observed for β-carotene (p = 0.034). β-carotene decreased after LTLT in colostrum, whereas its concentration in mature milk remained below the detection limit. No three-way interactions were significant, although the three-way interaction for β-carotene showed a statistical tendency (p = 0.086).

3.2. Body Weight Gain and Diarrhea Status

The effects of dietary β-carotene supplementation on growth performance and diarrhea-related parameters in calves during the 56-day experimental period are presented in Table 4. Initial BW was similar in the CON group (36.9 kg) and the BC group (37.1 kg; p = 0.724). β-carotene supplementation did not affect day 56 BW or ADG (p > 0.10). Diarrhea incidence tended to be lower in the BC group than in the CON group (70.3% vs. 82.8%; RR = 0.85, 95% CI: 0.70 to 1.03; p = 0.095). However, the average number of diarrhea episodes per calf did not differ between groups (1.7 vs. 2.2; p = 0.181). The frequency of normal feces was higher in the BC group (p < 0.001), whereas the frequency of severe diarrhea was lower (p = 0.046). No differences were observed for fecal scores 1 and 2 (p > 0.05).

3.3. Oxidative Stress Markers and Cortisol Concentrations

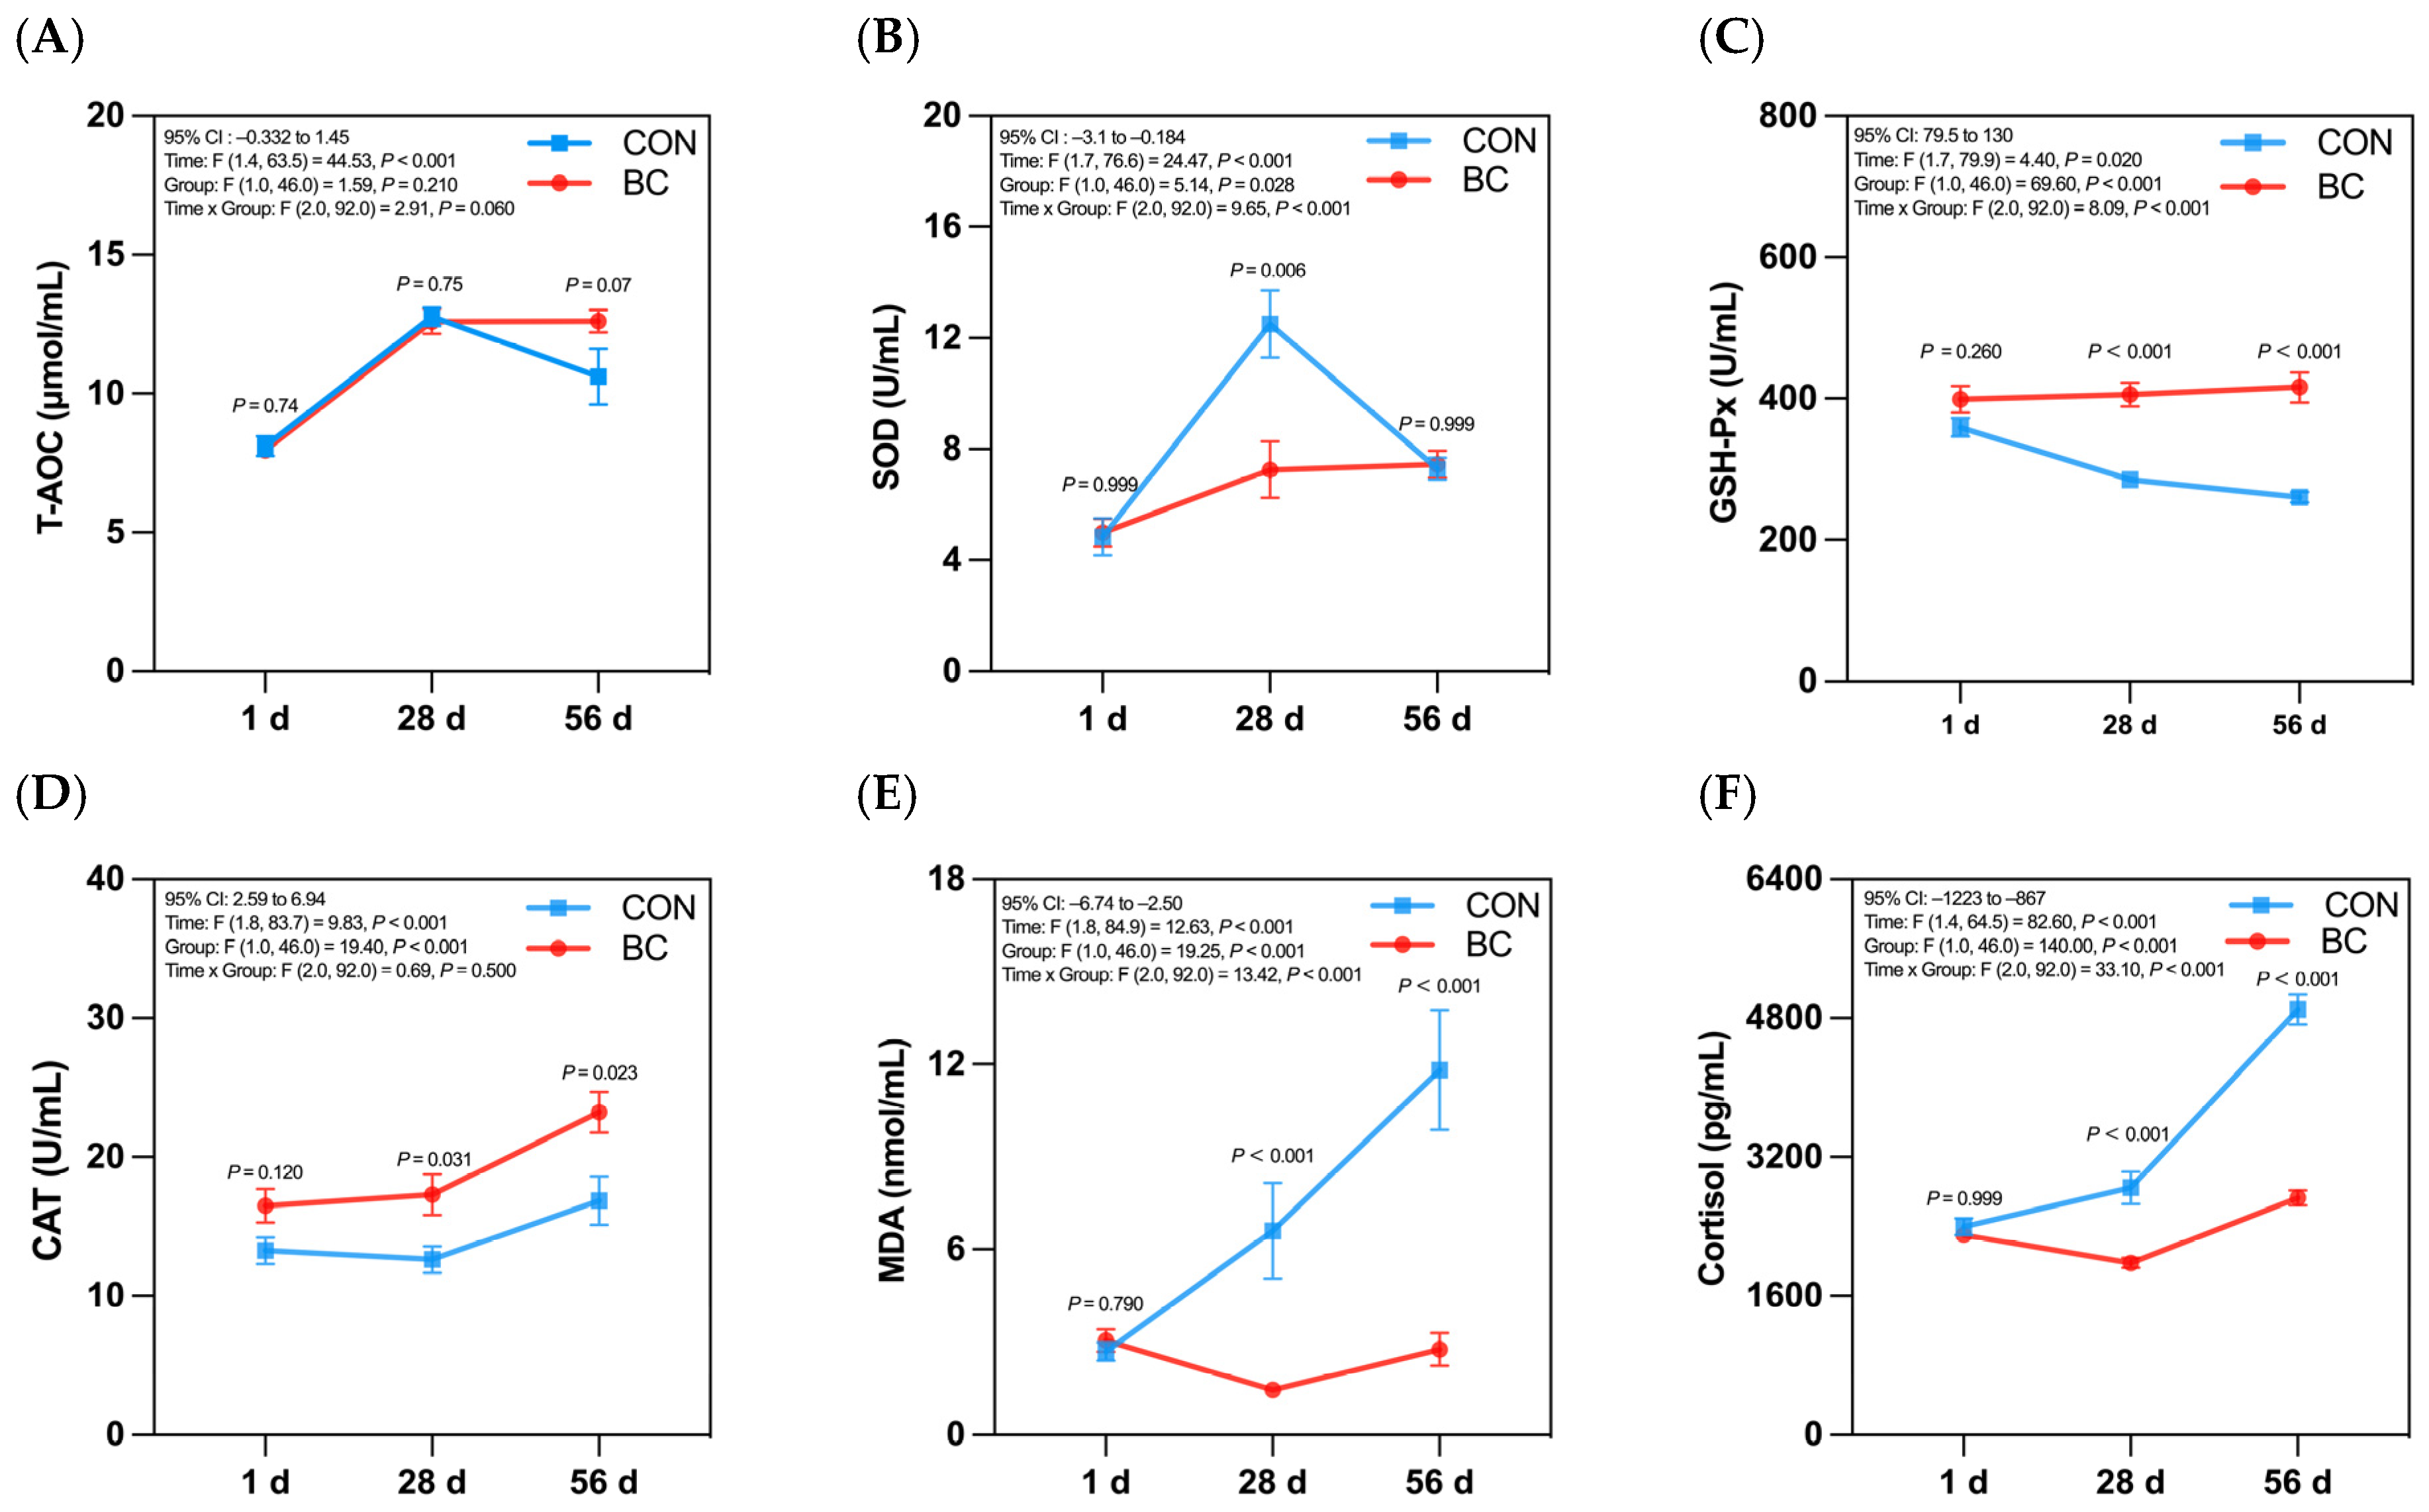
Dietary β-carotene supplementation altered the temporal profiles of serum OS indicators and cortisol in preweaning calves (Figure 1A–F). 24 calves per group were randomly selected from 64 calves at day 1. The same individuals were continuously tracked and sampled at day 1, 28, and 56. Repeated-measures ANOVA revealed significant time effects for all six parameters (p < 0.05), significant group effects for SOD, GSH-Px, CAT, MDA, and cortisol (p < 0.05), and significant group × time interactions for SOD, GSH-Px, MDA, and cortisol (p < 0.05). A statistical tendency for a group × time interaction was observed for T-AOC (p = 0.08), whereas the main effect of group was not significant (p = 0.213). For T-AOC, both groups increased from day 1 to 28, but only the CON group declined by day 56. No intergroup differences were significant at any time point. SOD rose in the CON group by day 28 (p < 0.05 vs. day 1) and then fell by day 56, whereas the BC group remained stable across time points. Consequently, SOD was higher in CON than BC at day 28 (p < 0.05). GSH-Px decreased over time in CON (p < 0.05), but increased in BC (p < 0.05), resulting in higher levels in BC at days 28 and 56 (p < 0.05). CAT increased in both groups (p < 0.05), but the rise was greater in BC, leading to significantly higher activity at days 28 and 56 (p < 0.05). MDA increased steadily in CON from day 1 to 56 (p < 0.05), while remaining stable and lower in BC. MDA was significantly lower in BC at days 28 and 56 (p < 0.05). Similarly, cortisol rose progressively in CON (p < 0.05), but changed little in BC. Cortisol concentrations were lower in BC than CON at days 28 and 56 (p < 0.05), with no difference at day 1.

3.4. Microbial Composition and Differences

The same 24 calves per group randomly selected for serum OS detection were used for fecal microbial analysis. Fecal samples were collected at d 1, d 28, and d 56. Partial d 1 samples were excluded after bacterial culture identification due to sterile meconium. Finally, valid d 1 samples were 13 in CON and 17 in BC, and all enrolled d 1 fecal samples were confirmed non-sterile [32]. All samples were subjected to 16S rRNA gene sequencing for fecal microbial analysis.
A total of 10,740,190 raw reads were generated, with a mean of 85,240 reads per sample and a range of 58,058 to 95,523 reads. Of the 10,739,997 reads entering the DADA2 pipeline, 9,779,391 after quality filtering, denoising, paired-end merging and chimera removal. The final dataset contained a mean of 77,614 non-chimeric reads per sample, ranging from 54,058 to 93,243 reads, corresponding to an overall retention rate of 91.06%. The feature table was rarefied to 51,355 sequences per sample, and all 126 samples exceeded this threshold and were retained for diversity analyses. Detailed sample-level sequencing and DADA2 processing statistics are provided in Supplementary Table S2.
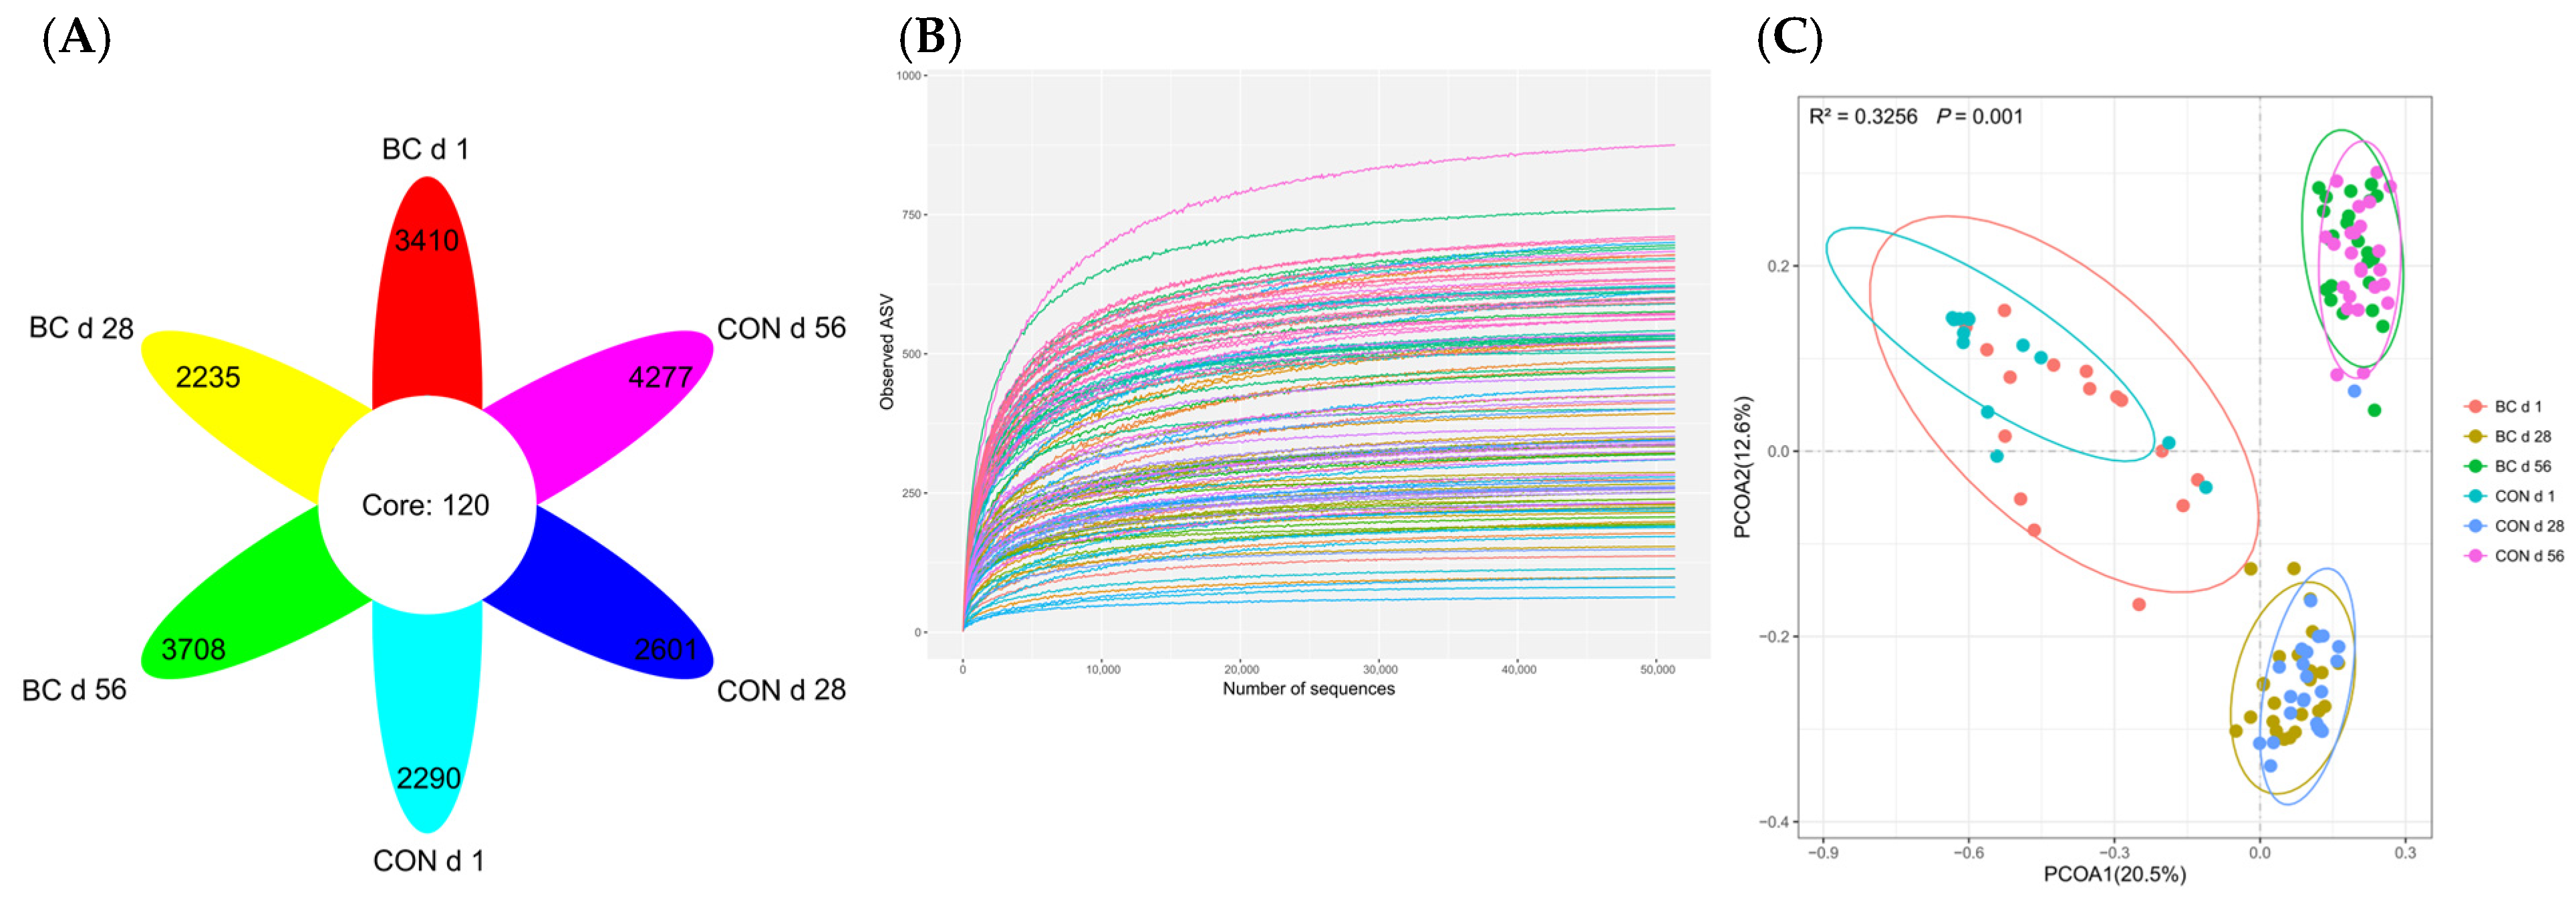
A flower plot was used to summarize the distribution of shared and group-specific fecal bacterial OTUs among the six by-day groups (Figure 2A). A total of 120 OTUs were shared by all six groups, whereas the number of group-specific OTUs ranged from 2235 to 4277. Rarefaction curves of observed ASVs approached an asymptote for most samples as sequencing depth increased (Figure 2B), indicating that the sequencing depth captured most of the observed bacterial richness.
The results of alpha diversity are presented in Table 5. Time exerted significant effects on all alpha diversity indices. No significant overall group effects were observed for ACE, Chao1, Shannon, Pielou, or Good’s coverage, whereas the group effect for the Simpson index showed a statistical tendency. Significant group × time interactions were observed for the Simpson, Shannon, and Pielou indices. At d 1, the Simpson, Shannon, and Pielou indices were higher in the BC than in the CON. No significant differences in these indices were observed at d 28. At d 56, the Shannon index was lower in the BC, while the Simpson and Pielou indices showed statistical tendencies toward lower values. ACE and Chao1 showed statistical tendencies toward lower values in the BC at d 28 and were significantly lower at d 56. Good’s coverage exceeded 0.999 at all sampling points, indicating adequate sequencing depth. A statistically significant but numerically small difference in Good’s coverage was observed at d 56.
PCoA based on weighted UniFrac distance was performed to visualize differences in fecal bacterial community structure among the six groups (Figure 2C). PCoA1 and PCoA2 explained 20.5% and 12.6% of the total variation, respectively. Visual inspection of the ordination plot showed pronounced age-related clustering, with samples collected on day 1 separated from those collected on days 28 and 56. Overall bacterial community structure differed among the six by-day groups (PERMANOVA, R2 = 0.3256, p = 0.001).
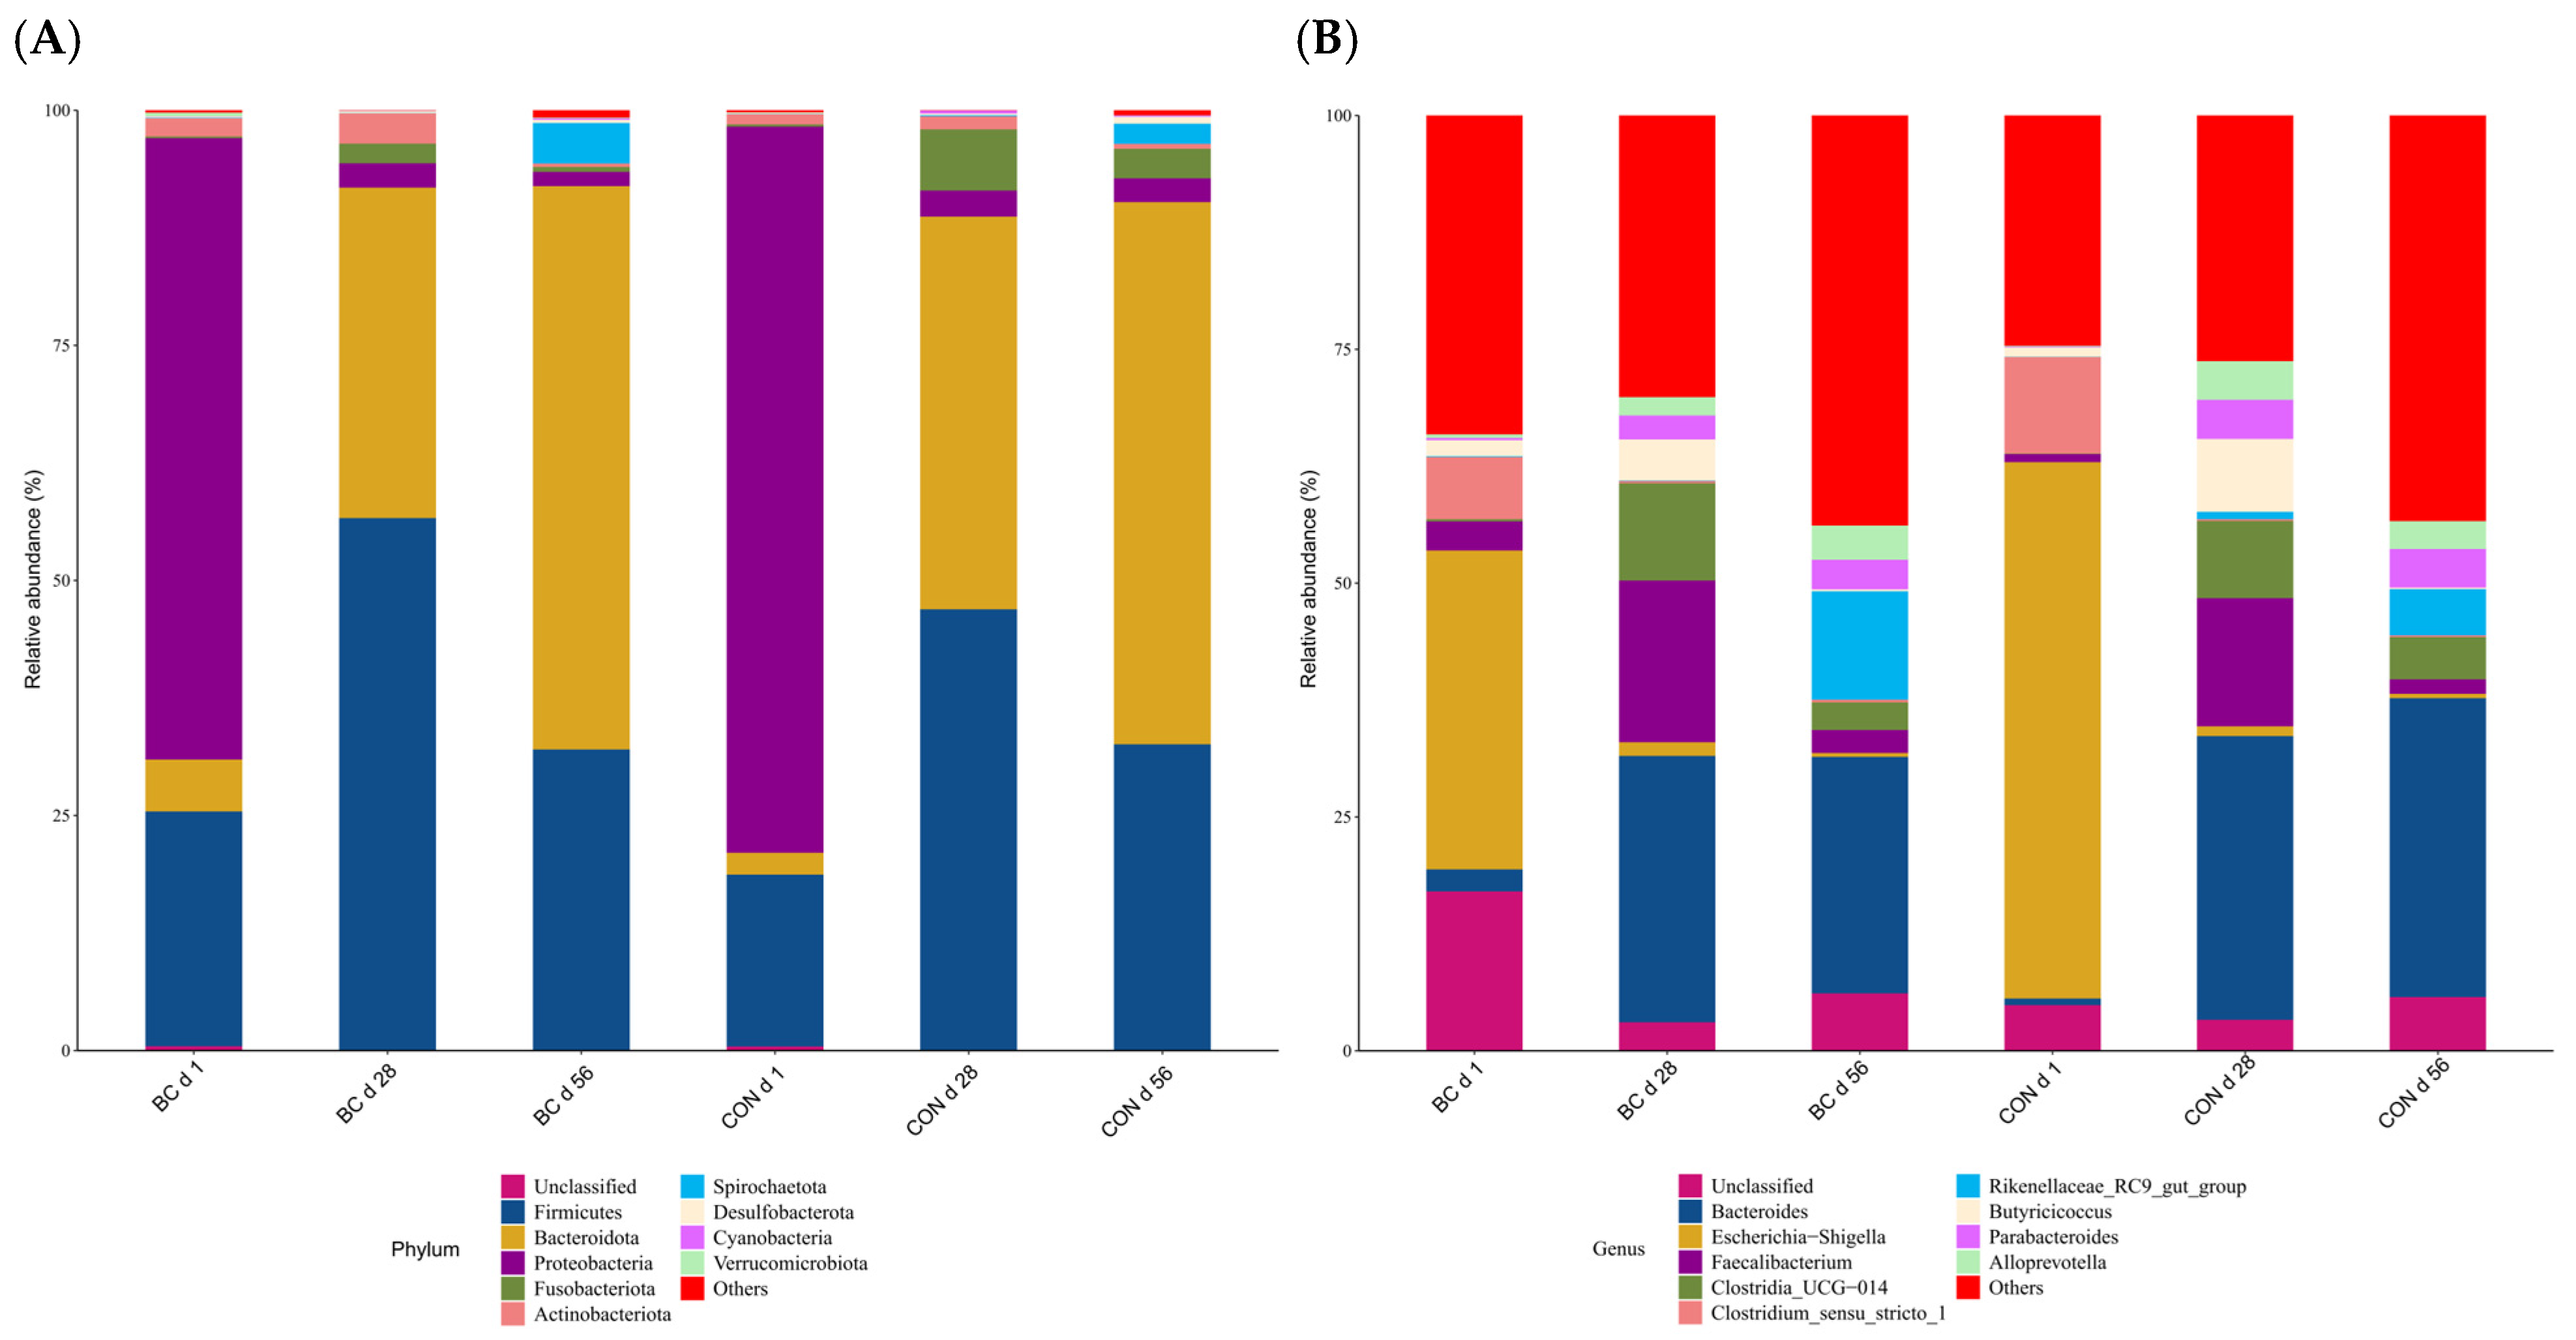
To further determine the effects of β-carotene on the fecal microbial structure of preweaning calves, the composition of fecal bacterial communities at the phylum and genus levels was compared between CON and BC groups across different time points. At the phylum level, as shown in Figure 3A, the dominant phyla in all groups were Firmicutes, Bacteroidota, and Proteobacteria, with minor phyla including Fusobacteriota, Actinobacteriota, and Spirochaetota also detected at low abundances. At the genus level, as shown in Figure 3B, the fecal microbiota was dominated by genera including Bacteroides, Escherichia-Shigella, and Faecalibacterium, with clear age-related shifts in community composition observed in both groups.
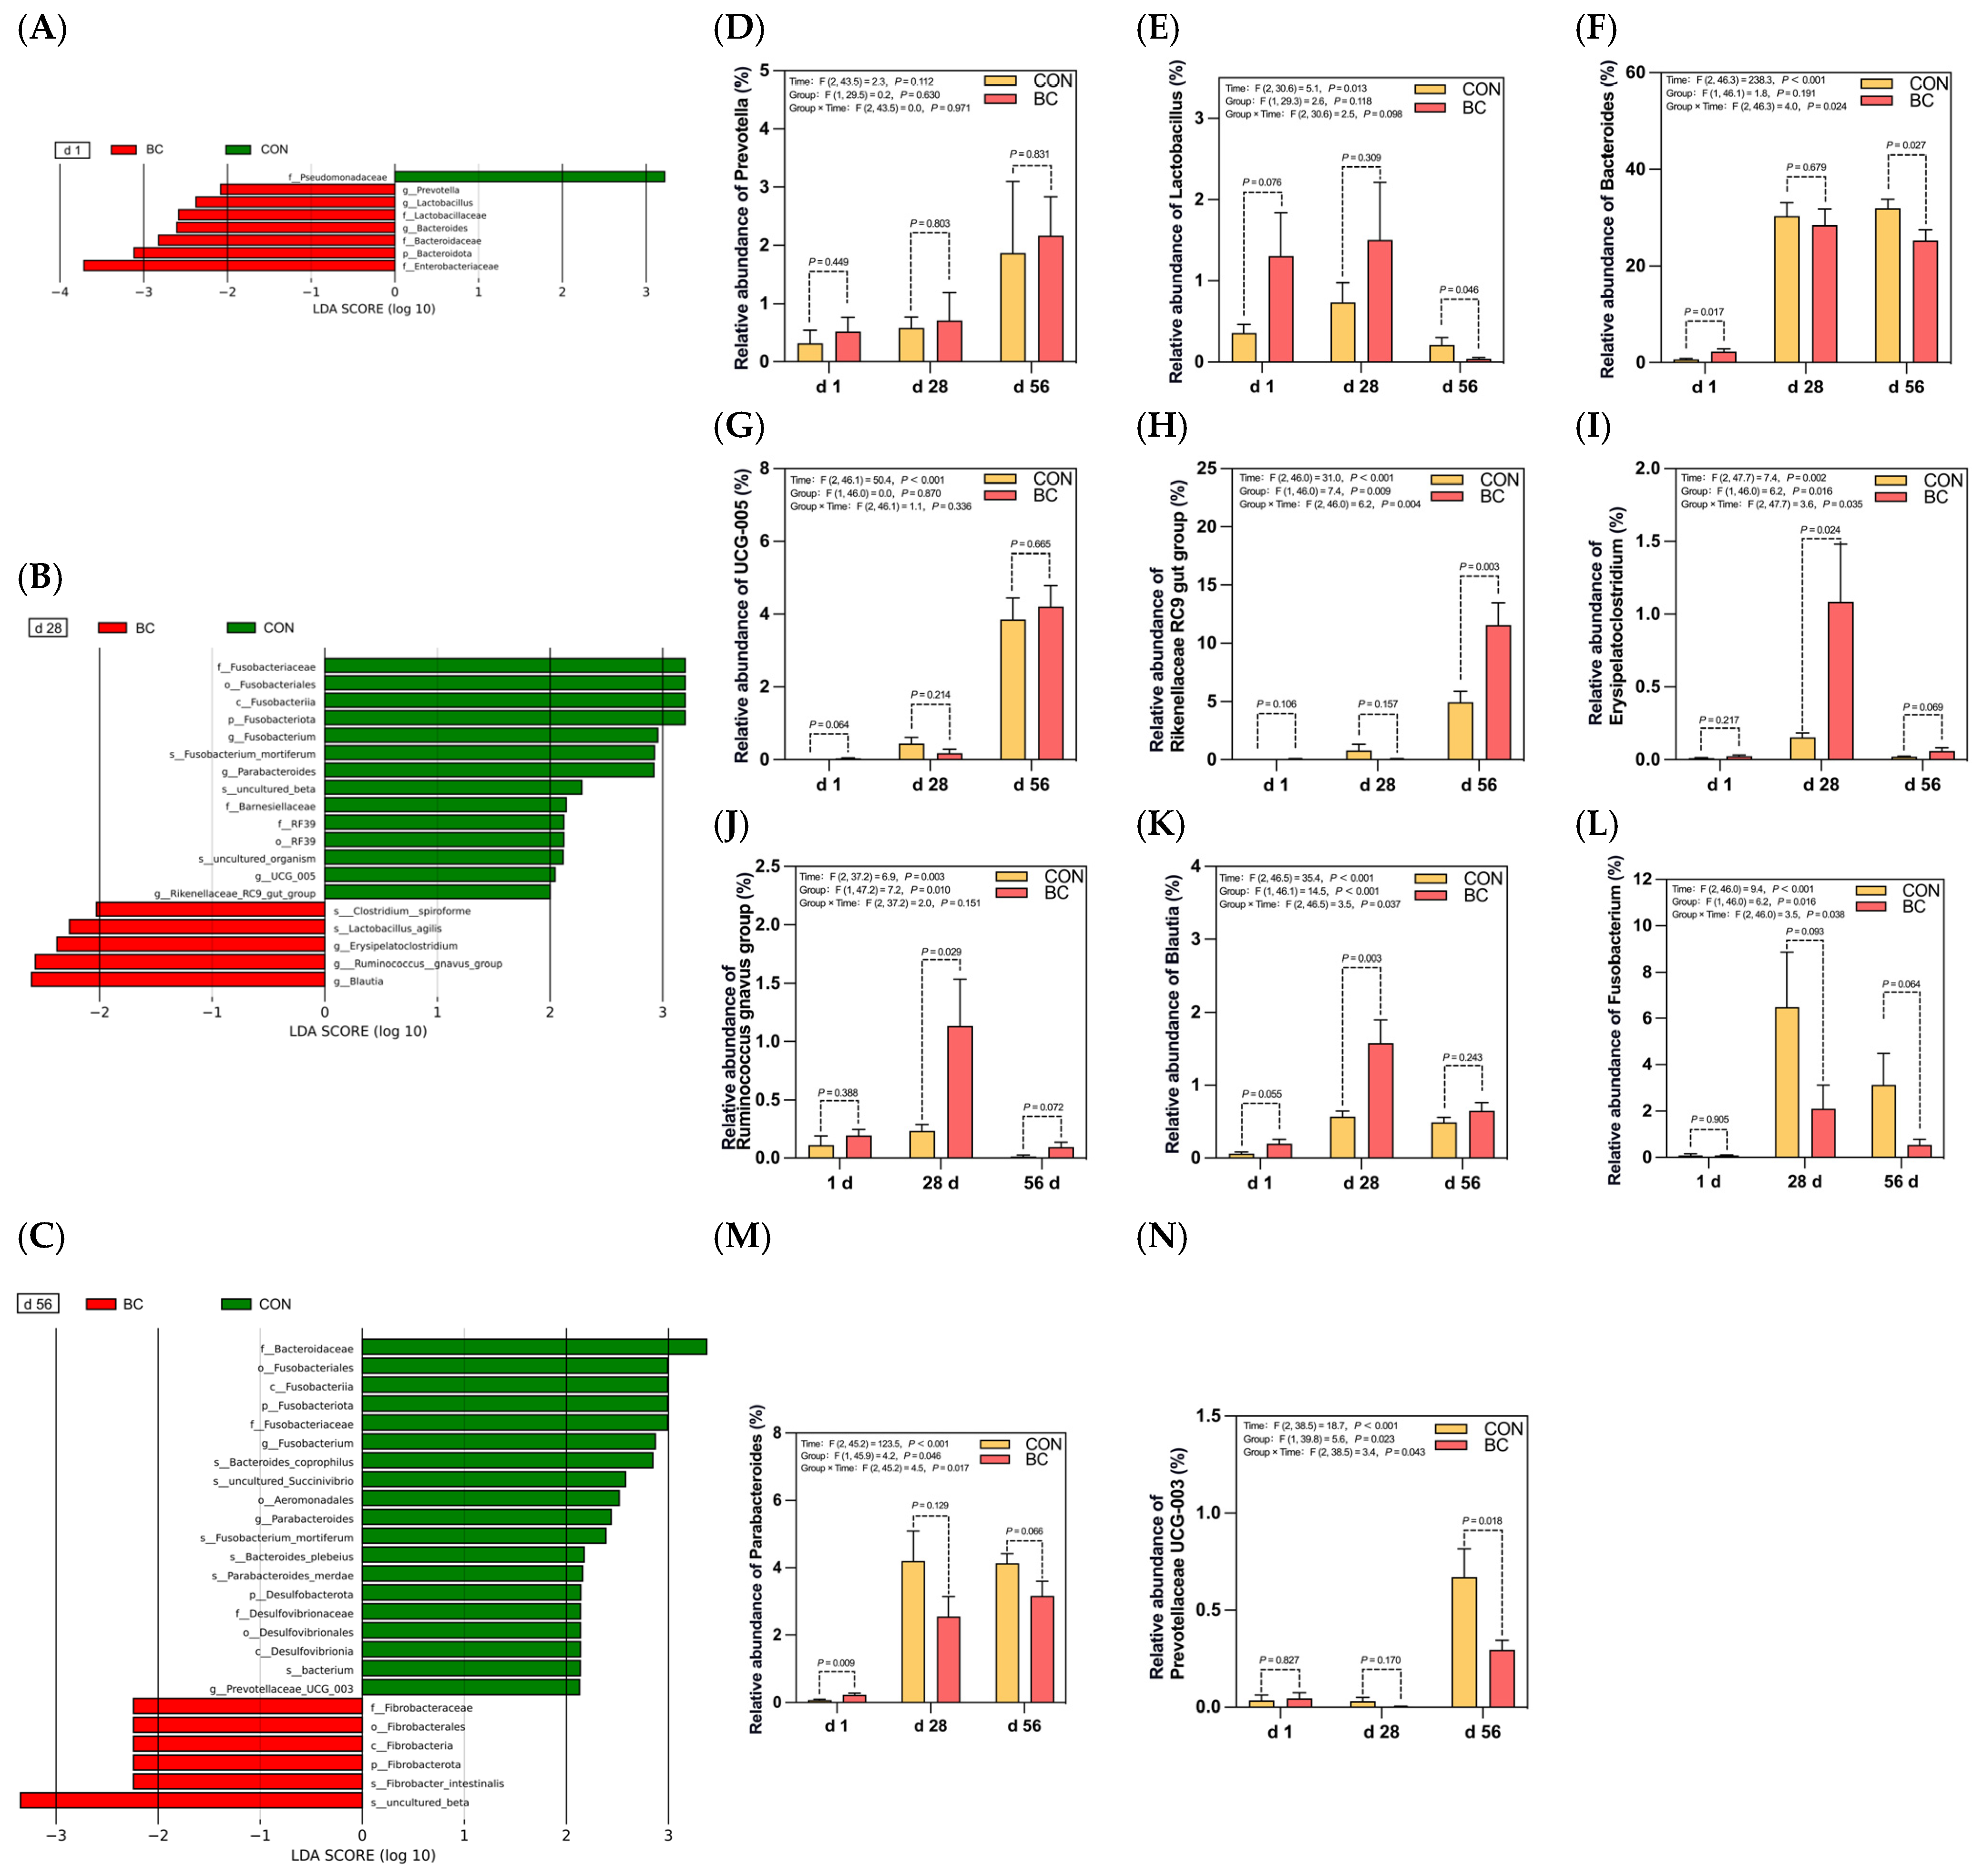
LEfSe analysis was performed to identify bacterial taxa with differing relative abundance between CON and BC groups at each sampling time point (Figure 4A–C). A total of 8, 19, and 25 taxa were identified across the three time points, each showing higher relative abundance in one of the two groups. Specifically, at d 1, 7 taxa had higher relative abundance in BC calves, while 1 taxon had higher relative abundance in CON calves. At d 28, 14 taxa had higher relative abundance in CON calves, and 5 taxa had higher relative abundance in BC calves. At d 56, 19 taxa had higher relative abundance in CON calves, and 6 taxa had higher relative abundance in BC calves.
The dynamic changes in the relative abundance of key genera identified by LEfSe were further analyzed (Figure 4D–N). Linear mixed-effects models were applied to assess the effects of time, group, and their interaction on the relative abundance of these genera. All genera showed significant main effects of time (p < 0.05). Significant group × time interactions were observed for Bacteroides, Rikenellaceae_RC9_gut_group, Erysipelatoclostridium, Blautia, Fusobacterium, Parabacteroides, and Prevotellaceae_UCG-003 (p < 0.05). A significant main effect of group was detected for Rikenellaceae_RC9_gut_group, Erysipelatoclostridium, Ruminococcus gnavus group, Blautia, Fusobacterium, Parabacteroides, and Prevotellaceae_UCG-003 (p < 0.05). Notably, the mean relative abundance of Blautia was higher in the BC group at all three sampling time points. However, the between-group difference was significant only at d 28 (p = 0.003). At d 28 and 56, Fusobacterium, Parabacteroides, and Prevotellaceae_UCG-003 showed higher mean relative abundances in the CON group than in the BC group. Some of these pairwise comparisons met the predefined criterion for a statistical tendency (0.05 ≤ p < 0.10).

4. Discussion

Preweaning calves undergo rapid development and are highly responsive to dietary factors, which influence health and disease resistance during early life [33,34]. Our study combined two sequential experiments. Experiment 1 evaluated the effects of parity and LTLT on milk vitamins. β-carotene was detected only in colostrum and declined by about 30% after LTLT. Experiment 2 showed that supplementing calves with 100 mg/d β-carotene improved antioxidant status, reduced severe diarrhea, and altered fecal microbiota. Together, these findings indicate that β-carotene supplementation may help support early-life health in dairy calves.
To explain the rationale for β-carotene supplementation, we first assessed the effects of parity and LTLT on the vitamin profile of milk. Experiment 1 showed that β-carotene was only detectable in colostrum. Its concentration was more than three times higher in primiparous cows than in multiparous cows. Calderón et al. reported similar findings, noting that the β-carotene concentration in colostrum was 9.9 times higher than in mature milk [35]. They also showed that plasma β-carotene increased during early lactation, whereas milk β-carotene remained low [35]. This suggests that β-carotene transfer from blood to milk is tightly regulated by the mammary gland. The secretion efficiency of β-carotene is much lower than that of VA [35]. As a result, mature milk naturally contains only small amounts of β-carotene. This has practical importance for calf nutrition. Preweaning calves depend mainly on milk as their liquid diet, while concentrate intake remains limited during early life. Because mature milk contains little β-carotene, the dietary supply of this antioxidant is already low under normal feeding conditions. LTLT further reduced colostrum β-carotene by approximately 30% in the present study. In contrast, VA and B vitamins showed much smaller losses. These results indicate that β-carotene is the vitamin most susceptible to LTLT among those evaluated. Previous studies mainly focused on the effects of LTLT on VB and fat-soluble vitamins [11,12,36,37]. Our study extends previous findings by quantifying the reduction in β-carotene concentration in bovine milk. This finding is relevant because LTLT is widely used on commercial dairy farms to improve milk hygiene and reduce pathogen transmission. Its benefits for milk safety remain clear. Under the conditions evaluated, however, LTLT reduced the β-carotene concentration in colostrum. Experiment 1 did not measure β-carotene intake or circulating β-carotene concentrations in calves. Therefore, it cannot determine whether this reduction resulted in β-carotene deficiency.
In a separate feeding experiment, we evaluated whether dietary β-carotene supplementation affected antioxidant status, cortisol concentrations, FS, growth performance, and fecal microbial composition in preweaning calves. During the 56-day feeding period, calves in the control group showed a progressive decline in antioxidant status. GSH-Px activity decreased over time, whereas MDA and cortisol concentrations increased. In contrast, calves receiving β-carotene maintained relatively stable activities of SOD, GSH-Px, and CAT. They also had lower MDA and cortisol concentrations. Significant group × time interactions for SOD, GSH-Px, MDA, and cortisol indicate that continuous β-carotene supplementation helped maintain antioxidant capacity during early life. These findings agree with previous studies showing that β-carotene supplementation improves antioxidant status under different physiological and environmental stress conditions, including weaning, transport, heat stress, and the periparturient period [17,19,38,39,40]. The antioxidant effect of β-carotene is likely related to its ability to scavenge reactive oxygen species and protect cellular lipids from oxidative damage. MDA is a widely used indicator of lipid peroxidation. Previous studies reported higher MDA concentrations in diarrheic calves than in healthy calves, and MDA declined after clinical recovery [6,7,8]. In the present study, MDA increased from 6.60 to 11.82 nmol/mL in the control group between days 28 and 56. In contrast, MDA remained much lower in the β-carotene group (1.45 and 2.77 nmol/mL at days 28 and 56, respectively). At the same time, calves receiving β-carotene experienced fewer episodes of severe diarrhea. These findings suggest an association between improved antioxidant status and better intestinal health. A similar pattern was observed in the CON group, whereas β-carotene supplementation was associated with a more stable oxidative status and reduced diarrhea severity. Cortisol is another important indicator of physiological stress. Elevated cortisol concentrations have been associated with impaired immune function and increased disease risk in calves [41,42,43]. In our study, cortisol increased steadily in the control group throughout the experimental period. In contrast, cortisol remained relatively stable in calves supplemented with β-carotene. On day 56, the cortisol concentration in the β-carotene group was only 55.7% of that in the control group (2726.96 vs. 4898.71 pg/mL). This reduction may have contributed to the lower incidence of severe diarrhea observed in supplemented calves.
The improvement in oxidative status was accompanied by changes in the fecal microbiota. Among the differentially abundant genera identified by LEfSe, Blautia was the most consistently enriched genus in calves receiving β-carotene. Its relative abundance was higher at all three sampling points and reached the greatest difference on day 28. Blautia is widely recognized as a beneficial intestinal bacterium and has been associated with gut health in both humans and animals [44]. Recent studies also suggest that Blautia contributes to intestinal homeostasis through the production of short-chain fatty acids (SCFA) and maintenance of the mucus barrier [45]. Although these mechanisms were not evaluated in the present study, the consistent enrichment of Blautia suggests that β-carotene supplementation favored the establishment of a healthier gut microbial community. In addition to Blautia, Rikenellaceae_RC9_gut_group, Erysipelatoclostridium, and Ruminococcus gnavus group were also enriched in the β-carotene group. These genera have previously been associated with SCFA production and intestinal homeostasis in ruminants [46,47,48]. However, SCFA concentrations were not measured in this study. Therefore, the functional significance of these microbial changes requires further investigation. In contrast, calves in the control group showed greater enrichment of Fusobacterium on days 28 and 56. Previous studies have consistently reported higher abundances of Fusobacterium in diarrheic calves and have linked this genus to intestinal inflammation and opportunistic infection [49,50,51]. The lower relative abundance of Fusobacterium in supplemented calves, together with the enrichment of Blautia and other potentially beneficial genera, suggests that dietary β-carotene supplementation was associated with a more favorable microbial profile. Significant group × time interactions were observed for several bacterial genera. The differences between CON and BC became more evident as calves aged, especially by day 56. This pattern is consistent with the gradual development of the calf gut microbiota during the preweaning period. It also suggests that continuous β-carotene supplementation may influence microbial succession during early life. Because neither microbial metabolites nor intestinal barrier function were measured, the mechanisms responsible for these changes remain unclear and should be explored in future studies.
This study has several limitations. First, Experiment 2 did not include a raw-milk-fed comparison group, and the β-carotene status of calves was not evaluated. Second, SCFA concentrations and intestinal barrier function were not measured, preventing direct evaluation of the functional consequences of the microbial changes. Third, the feeding experiment was conducted on a single commercial dairy farm and evaluated only one supplementation dose. Future studies should confirm circulating carotenoid status, evaluate different supplementation doses, and use experimental designs that more directly examine the relationship between LTLT-associated nutrient changes and calf responses.

5. Conclusions

In conclusion, this study identified β-carotene as the vitamin most affected by LTLT among those evaluated in bovine milk. Daily dietary supplementation with 100 mg/d β-carotene improved antioxidant status, attenuated cortisol accumulation, reduced the occurrence of severe diarrhea, and altered the fecal microbiota by increasing the relative abundance of beneficial genera, particularly Blautia, while reducing Fusobacterium in preweaning calves. Although growth performance was not significantly improved during the study period, these findings support dietary β-carotene supplementation as a practical nutritional strategy to improve health and oxidative resilience in preweaning dairy calves.

Supplementary Materials

The following supporting information can be downloaded at: https://www.mdpi.com/article/10.3390/ruminants6030063/s1. Table S1: Effect sizes and 95% confidence intervals for the effects of parity, milk type, and low-temperature long-time pasteurization on vitamin concentrations in milk. Table S2: Equencing quality control and ASV generation statistics of fecal microbiota samples.

Author Contributions

H.Z.: Writing—original draft, Data curation. D.L.: Supervision, Methodology. X.Z.: Data curation. W.L.: Investigation. S.Z.: Supervision. G.Y.: Validation. J.C.: Conceptualization, Supervision. C.M.: Supervision, Funding acquisition. All authors have read and agreed to the published version of the manuscript.

Funding

This research received no external funding.

Institutional Review Board Statement

The animal precedures conducted in this study were approved on 15 August 2022, by the Experimental Animal Management Committee of China Agricultural University (Approval Number: AW21214202-2-01). All animal experiments were conducted in accordance with the national standard “Guidelines for Ethical Review of Animal Welfare” (GB/T 35892-2018).

Informed Consent Statement

Not applicable.

Data Availability Statement

The data presented in this study are openly available in the Genome Sequence Archive (Genomics, Proteomics & Bioinformatics 2021) in National Genomics Data Center (Nucleic Acids Res 2021) at https://ngdc.cncb.ac.cn/gsa (accessed on 20 June 2026), reference number CRA040897 (16S rRNA gene sequencing data).

Acknowledgments

We gratefully acknowledge the College of Veterinary Medicine, China Agricultural University for providing research equipment, and Hebei Shounong Modern Agricultural Technology Co., Ltd. for providing testing facilities and experimental animals.

Conflicts of Interest

Author Dengke Liu was employed by Hebei Shounong Modern Agricultural Technology Co., Ltd., Dingzhou. The authors declare that the research was conducted in the absence of any commercial or financial relationships that could be construed as a potential conflict of interest.

Abbreviations

The following abbreviations are used in this manuscript:
ADGAverage daily gain
BCβ-carotene-supplemented group
BWBody weight
CATCatalase
CONControl group
FSFecal score
GSH-PxGlutathione peroxidase
LTLTLow-temperature long-time pasteurization
MDAMalondialdehyde
OSOxidative stress
PCAPrincipal component analysis
SCFAShort-chain fatty acids
SODSuperoxide dismutase
T-AOCTotal antioxidant capacity
VAVitamin A
VB1Vitamin B1
VB2Vitamin B2
VB9Vitamin B9
VB12Vitamin B12

References

  1. Godden, S.M.; Lombard, J.E.; Woolums, A.R. Colostrum management for dairy calves. Vet. Clin. N. Am. Food Anim. Pract. 2019, 35, 535–556. [Google Scholar] [CrossRef]
  2. Qu, J.C.; Meng, C.; Li, L.Y.; Zhu, H.; Yin, G.A. Epidemiology of diarrhea for Chinese dairy calves: A systematic review and meta-analysis. Indian J. Anim. Res. 2023, 57, 139–146. [Google Scholar] [CrossRef]
  3. Aydin, O.; Ulas, N.; Genc, A.; Baysal, S.; Kandemir, O.; Aktas, M.S. Investigation of hemogram, oxidative stress, and some inflammatory marker levels in neonatal calves with Escherichia coli and coronavirus diarrhea. Microb. Pathog. 2022, 173, 105802. [Google Scholar] [CrossRef] [PubMed]
  4. Razzaghi, A.; Ghaffari, M.H.; Rico, D.E. The impact of environmental and nutritional stresses on milk fat synthesis in dairy cows. Domest. Anim. Endocrinol. 2023, 83, 106784. [Google Scholar] [CrossRef] [PubMed]
  5. Jain, A.; Shakkarpude, J. Oxidative stress: A biomarker for animal health and production: A review. Indian J. Anim. Res. 2024, 58, 1–12. [Google Scholar] [CrossRef]
  6. Yanar, K.E.; Eren, E.; Aktaş, M.S.; Eroğlu, M.S.; Kandemir, Ö.; Aydın, G. Prognostic potential of inflammatory markers, oxidative status, thrombocyte indices, and renal biochemical markers in neonatal calf diarrhoea-induced systemic inflammatory response syndrome. Vet. Immunol. Immunopathol. 2023, 265, 110680. [Google Scholar] [CrossRef] [PubMed]
  7. Fu, Z.L.; Yang, Y.; Ma, L.; Malmuthuge, N.; Guan, L.L.; Bu, D.P. Dynamics of oxidative stress and immune responses in neonatal calves during diarrhea. J. Dairy Sci. 2024, 107, 1286–1298. [Google Scholar] [CrossRef] [PubMed]
  8. Liang, X.; Li, X.; Mi, N.; Wu, Y.; Wu, J.; Chen, H.; Liu, D. Early-life diarrhea disrupts antioxidant–immune homeostasis and gut microbiota in suckling calves. Biology 2026, 15, 450. [Google Scholar] [CrossRef] [PubMed]
  9. Ghaffari, M.H.; Hammon, H.M.; Koch, C. Early rumen development in calves: Biological processes and nutritional strategies—A mini-review. JDS Commun. 2025, 6, 427–431. [Google Scholar] [CrossRef] [PubMed]
  10. Ibrahim, A.S.; Ali, S.A.M. Chemical and physical properties of bovine colostrum and the effect of some pasteurization treatments on them. IOP Conf. Ser. Earth Environ. Sci. 2023, 1262, 062024. [Google Scholar] [CrossRef]
  11. Santander, J.; Puyol, A.; Rodríguez, A.; Panizzolo, L.; Machado, I. Optimization of chromatographic methods for the evaluation of vitamin losses in human milk after Holder pasteurization. J. Food Compos. Anal. 2024, 135, 106673. [Google Scholar] [CrossRef]
  12. Davis, A.; Lee, S.; Hampel, D.; Shahab-Ferdows, S.; Allen, L.H.; Bode, L.; Mansen, K.; Israel-Ballard, K.; Perrin, M.T. The impact of Holder pasteurization on macronutrients, vitamins, minerals, and bioactive factors in human milk processed in a milk bank setting. Curr. Dev. Nutr. 2025, 9, 107490. [Google Scholar] [CrossRef] [PubMed]
  13. Carlson, H.; Abuelo, A. Graduate student literature review: Role of antioxidants in calf immunity, growth, and health. J. Dairy Sci. 2024, 107, 4844–4854. [Google Scholar] [CrossRef] [PubMed]
  14. Demeli, A.; Meyer, J.C. The role of beta-carotene in cattle infertility, mastitis and milk yield: A systematic review and meta-analysis. Reprod. Domest. Anim. 2024, 59, e14634. [Google Scholar] [CrossRef] [PubMed]
  15. Mary, A.E.P.; Artavia Mora, J.I.; Ronda Borzone, P.A.; Richards, S.E.; Kies, A.K. Vitamin E and beta-carotene status of dairy cows: A survey of plasma levels and supplementation practices. Animal 2021, 15, 100303. [Google Scholar] [CrossRef] [PubMed]
  16. Mitsuishi, H.; Yayota, M. The efficacy of β-carotene in cow reproduction: A review. Animals 2024, 14, 2133. [Google Scholar] [CrossRef] [PubMed]
  17. Shastak, Y.; Pelletier, W. A cross-species perspective: β-carotene supplementation effects in poultry, swine, and cattle—A review. J. Appl. Anim. Res. 2024, 52, 2321957. [Google Scholar] [CrossRef]
  18. Condron, K.N.; Lemenager, R.P.; Claeys, M.C.; Lipkie, T.E.; Schoonmaker, J.P. Supplemental β-carotene I: Effect on plasma vitamin A, growth performance, and carcass characteristics of feedlot cattle. Meat Sci. 2014, 98, 736–743. [Google Scholar] [CrossRef] [PubMed]
  19. Kadek, R.; Filípek, J.; Mikulková, K.; Staffa, A.; Šimková, I.; Bartoň, J.; Illek, J. Effect of parenteral application of β-carotene, α-tocopherol, and selenium on selected antioxidant/oxidant parameters in dairy calves. Acta Vet. Brno 2024, 93, S55–S67. [Google Scholar] [CrossRef]
  20. Yuan, X.; Yan, J.; Hu, R.; Li, Y.; Wang, Y.; Chen, H.; Hou, D.X.; He, J.; Wu, S. Modulation of gut microbiota and oxidative status by β-carotene in late pregnant sows. Front. Nutr. 2020, 7, 612875. [Google Scholar] [CrossRef] [PubMed]
  21. Otomaru, K.; Ogawa, R.; Oishi, S.; Iwamoto, Y.; Hong, H.; Nagai, K.; Hyakutake, K.; Kubota, C.; Kaneshige, T. Effect of Beta-Carotene Supplementation on the Serum Oxidative Stress Biomarker and Antibody Titer against Live Bovine Respiratory Syncytial Virus Vaccination in Japanese Black Calves. Vet. Sci. 2018, 5, 102. [Google Scholar] [CrossRef] [PubMed]
  22. dsm-firmenich. Optimizing Fertility and Performance of Dairy and Beef Cows. Available online: https://www.dsm-firmenich.com/anh/en_NA/news/articles/optimizing-fertility-and-performance-of-dairy-and-beef-cows.html (accessed on 12 July 2026).
  23. Ranganathan, P.; Deo, V.; Pramesh, C.S. Sample size calculation in clinical research. Perspect. Clin. Res. 2024, 15, 155–159. [Google Scholar] [CrossRef] [PubMed]
  24. National Academies of Sciences, Engineering, and Medicine. Nutrient Requirements of Dairy Cattle: Eighth Revised Edition; The National Academies Press: Washington, DC, USA, 2021. [Google Scholar]
  25. GB 5009.82-2016; Determination of Vitamin A, D, E in Food. Standards Press of China: Beijing, China, 2016.
  26. GB 5009.83-2016; Determination of Carotene in Foods. Standards Press of China: Beijing, China, 2016.
  27. GB 5009.84-2016; Determination of Vitamin B1 in Foods. Standards Press of China: Beijing, China, 2016.
  28. GB 5009.85-2016; Determination of Vitamin B2 in Foods. Standards Press of China: Beijing, China, 2016.
  29. GB 5009.211-2022; Determination of Folates in Food. Standards Press of China: Beijing, China, 2022.
  30. GB 5009.285-2022; Determination of Vitamin B12 in Foods. Standards Press of China: Beijing, China, 2022.
  31. McGuirk, S.M. Disease management of dairy calves and heifers. Vet. Clin. North Am. Food Anim. Pract. 2008, 24, 139–153. [Google Scholar] [CrossRef] [PubMed]
  32. Malmuthuge, N.; Griebel, P.J. Fetal environment and fetal intestine are sterile during the third trimester of pregnancy. Vet. Immunol. Immunopathol. 2018, 204, 59–64. [Google Scholar] [CrossRef] [PubMed]
  33. Song, Y.; Wen, S.; Guan, L.L. Unraveling the dynamic changes in the intestinal microbiome: Impacts on pre-weaning calf health and productivity. J. Anim. Sci. Biotechnol. 2026, 17, 37. [Google Scholar] [CrossRef] [PubMed]
  34. Chen, H.; Liu, Y.; Huang, K.; Yang, B.; Zhang, Y.; Yu, Z.; Wang, J. Fecal microbiota dynamics and its relationship to diarrhea and health in dairy calves. J. Anim. Sci. Biotechnol. 2022, 13, 132. [Google Scholar] [CrossRef] [PubMed]
  35. Calderón, F.; Chauveau-Duriot, B.; Martin, B.; Graulet, B.; Doreau, M.; Nozière, P. Variations in carotenoids, vitamins A and E, and color in cow’s plasma and milk during late pregnancy and the first three months of lactation. J. Dairy Sci. 2007, 90, 2335–2346. [Google Scholar] [CrossRef] [PubMed]
  36. Ali, S.A.M.; Ibrahim, A.S. Effect of pasteurization and sampling time on some immunological and microbial properties of bovine colostrum. IOP Conf. Ser. Earth Environ. Sci. 2023, 1262, 062028. [Google Scholar] [CrossRef]
  37. Ceribeli, C.; Otte, J.; Walkling-Ribeiro, M.; Cardoso, D.R.; Ahrné, L.M. Impact of non-thermal pasteurization technologies on vitamin B12 content in milk. Innov. Food Sci. Emerg. Technol. 2023, 84, 103303. [Google Scholar] [CrossRef]
  38. Khemarach, S.; Yammuen-Art, S.; Punyapornwithaya, V.; Nithithanasilp, S.; Jaipolsaen, N.; Sangsritavong, S. Improved reproductive performance achieved in tropical dairy cows by dietary beta-carotene supplementation. Sci. Rep. 2021, 11, 23171. [Google Scholar] [CrossRef] [PubMed]
  39. Oliveira, A.M.A.; Freitas, E.R.; Nogueira, D.B.; Araújo, G.G.A.; Silva, L.M.; Butolo, E.A.F.; Santos, K.M.; Prata, M.F.; Silva Martins, C.C.D.; Passos, A.A.; et al. Beta-carotene supplementation for sows: Reproductive parameters and productive performance of piglets. Animals 2023, 13, 3730. [Google Scholar] [CrossRef] [PubMed]
  40. Ahmed, O.; Hassen, A.; Lehloenya, K. Effects of β-carotene supplementation and age on the oxidative status, production and reproductive performance of grazing ewes. Anim. Prod. Sci. 2024, 64, AN23220. [Google Scholar] [CrossRef]
  41. Sullivan, T.; Sharma, A.; Lamers, K.; White, C.; Mallard, B.A.; Cánovas, A.; Karrow, N.A. Dynamic changes in Holstein heifer circulatory stress biomarkers in response to lipopolysaccharide immune challenge. Vet. Immunol. Immunopathol. 2022, 248, 110426. [Google Scholar] [CrossRef] [PubMed]
  42. Arfuso, F.; Minuti, A.; Liotta, L.; Giannetto, C.; Trevisi, E.; Piccione, G.; Lopreiato, V. Stress and inflammatory response of cows and their calves during peripartum and early neonatal period. Theriogenology 2023, 196, 157–166. [Google Scholar] [CrossRef] [PubMed]
  43. Masmeijer, C.; Deprez, P.; van Leenen, K.; De Cremer, L.; Cox, E.; Devriendt, B.; Pardon, B. Arrival cortisol measurement in veal calves and its association with body weight, protein fractions, animal health and performance. Prev. Vet. Med. 2021, 187, 105251. [Google Scholar] [CrossRef] [PubMed]
  44. Liu, X.; Mao, B.; Gu, J.; Wu, J.; Cui, S.; Wang, G.; Zhao, J.; Zhang, H.; Chen, W. Blautia—A new functional genus with potential probiotic properties? Gut Microbes 2021, 13, 1875796. [Google Scholar] [CrossRef] [PubMed]
  45. Holmberg, S.M.; Feeney, R.H.; Prasoodanan, V.P.K.; Puértolas-Balint, F.; Singh, D.K.; Wongkuna, S.; Zandbergen, L.; Hauner, H.; Brandl, B.; Nieminen, A.I.; et al. The gut commensal Blautia maintains colonic mucus function under low-fiber consumption through secretion of short-chain fatty acids. Nat. Commun. 2024, 15, 3502. [Google Scholar] [CrossRef] [PubMed]
  46. Wei, X.; Ouyang, K.; Long, T.; Liu, Z.; Li, Y.; Qiu, Q. Dynamic Variations in Rumen Fermentation Characteristics and Bacterial Community Composition during In Vitro Fermentation. Fermentation 2022, 8, 276. [Google Scholar] [CrossRef]
  47. Wu, D.; Zhang, L.; Zhang, Z.; Xu, M. Early-life high-dose sodium butyrate supplementation in milk inhibits growth via sterol metabolism in 15-month-old dairy cattle: Insights from gastrointestinal microbiota and host metabolism. J. Dairy Sci. 2026, 109, 2527–2548. [Google Scholar] [CrossRef] [PubMed]
  48. Hu, K.; Wu, Q.; Chen, T.; Wang, J.; Zhu, Z.; Shen, Y.; Wang, C.; Wei, X. Grazing practice affects the growth performance, meat quality and nutritional composition, and fecal microbiota of fattening yaks. Anim. Biosci. 2026, 39, 250052. [Google Scholar] [CrossRef] [PubMed]
  49. Jiang, S.S.; Chen, Y.X.; Fang, J.Y. Fusobacterium nucleatum: Ecology, pathogenesis and clinical implications. Nat. Rev. Microbiol. 2026, 24, 197–214. [Google Scholar] [CrossRef] [PubMed]
  50. Lee, Y.; Rossow, H.A.; Williams, D.R.; Cheong, S.; Okella, H.; Widmer, L.; Okello, E. Effect of multi-species probiotic supplementation on fecal microbiota in pre-weaned Holstein dairy calves in California. Microorganisms 2025, 13, 1810. [Google Scholar] [CrossRef] [PubMed]
  51. Wang, Q.; Lu, Q.; Tang, Y.; Li, Q.; Gao, P.; Pang, S.; Zhang, W.; Nie, C.; Niu, J.; Ma, X. Integrated 16S rDNA-seq and metabolomics reveal seasonal dynamics of gut microbial-SCFA-immune crosstalk in diarrheic calves. Front. Vet. Sci. 2025, 12, 1615310. [Google Scholar] [CrossRef] [PubMed]
Figure 1. Dynamic changes of serum oxidative stress markers and cortisol in preweaning calves fed with β-carotene. (A) T-AOC = total antioxidant capacity; (B) SOD = superoxide dismutase; (C) GSH-Px = glutathione peroxidase; (D) CAT = catalase; (E) MDA = malondialdehyde; (F) Cortisol = bovine cortisol. CON, control group without β-carotene, addition; BC, β-carotene-supplemented group (100 mg/day/calf). Calves were sampled at days 1, 28, and 56 of the experiment. n = 24 calves per group at days 1, 28 and 56. 95% CI, 95% confidence interval for the estimated mean difference between the BC and CON. Values are presented as means ± SEM. Main effects of time, group, and their interaction are presented in the upper left corner of each panel. The p values shown at each time point indicate between-group differences at the same sampling time, with p < 0.05 considered statistically significant and 0.05 ≤ p < 0.10 considered statistical tendency.
Ruminants 06 00063 g001
Figure 2. Fecal bacterial community characteristics in dairy calves fed with or without β-carotene supplementation. (A) Flower plot showing the numbers of shared and group-specific OTUs among the six by-day groups. The central value represents the number of OTUs shared by all six groups, whereas the values in the petals indicate OTUs unique to the corresponding groups. (B) Rarefaction curves of observed ASVs as a function of sequencing depth. Each curve represents one fecal sample. (C) PCoA based on weighted UniFrac distance. Each point represents one fecal sample and is colored according to treatment and sampling day. Ellipses represent the 95% confidence regions of the corresponding groups. PCoA1 and PCoA2 explained 20.5% and 12.6% of the total variation, respectively. Overall differences in bacterial community structure among the six by-day groups were assessed using PERMANOVA (R2 = 0.3256, p = 0.001). CON, control group with no β-carotene addition; BC, β-carotene-supplemented group (100 mg/day/calf). Calves were sampled at days 1, 28, and 56 of the experiment. At day 1, samples that did not yield sufficient bacterial DNA for sequencing were excluded, resulting in 13 samples from the CON group and 17 samples from the BC group; 24 samples per group were analyzed on days 28 and 56.
Ruminants 06 00063 g002
Figure 3. Effect of β-carotene on the dominant fecal bacterial phyla and genus bacteria flora in dairy calves. (A) The phylum level; (B) The genus level. CON, control group with no β-carotene addition; BC, β-carotene-supplemented group (100 mg/calf/d). Calves were sampled at days 1, 28, and 56 of the experiment. At day 1, samples with sterile feces were excluded, yielding n = 13 (CON) and n = 17 (BC); n = 24 calves per group at days 28 and 56.
Ruminants 06 00063 g003
Figure 4. LEfSe analysis of fecal bacterial flora in dairy calves. (AC) LDA scores of CON and BC groups at days 1, 28, and 56. Biomarkers were identified across all taxonomic ranks (kingdom to species) with a LDA score ≥ 2.0. From the biomarkers identified by LEfSe at each time point, only genus-level taxa were selected for subsequent relative abundance comparisons across the three sampling days. (DN) Relative abundance of the selected differential genera at three sampling time points. CON, control group with no β-carotene addition; BC, β-carotene-supplemented group (100 mg/calf/d). Calves were sampled at days 1, 28, and 56 of the experiment. At day 1, samples with sterile feces were excluded, yielding n = 13 (CON) and n = 17 (BC); n = 24 calves per group at days 28 and 56.
Ruminants 06 00063 g004
Table 1. Basic information and feeding scheme of preweaning calves 1.
CategoryItemsCONBCRemarks
Basic informationSample size (n)6464Number of calves in each group, female
Parity (times)2.48 ± 1.912.19 ± 1.9795% CI: −0.98 to 0.38, p = 0.388
Feeding scheme
(Pasteurized milk volume/meal)
d 16.0 L6.0 L4 L colostrum at birth,
then 2 L after 6–8 h.
d 2–73.0 L3.0 L3 meals/day,
Colostrum:mature milk = 1:1,
d 8–153.0 L3.0 L3 meals/day, mature milk
d 16–493.5 L3.5 L3 meals/day, mature milk
d 50–523.0 L3.0 L2 meals/day, mature milk
d 53–562.0 L2.0 L2 meals/day, mature milk
Starter feedd 3–56Free intakeFree intake24-h availability
Waterd 3–56Free intakeFree intake24-h availability
β-carotene (mg/meal)d 2–56None502 meals/day, add to milk
Parity defines cows’ mean pregnancies, expressed as mean ± SD. 1 CON, control group without β-carotene, addition; BC, β-carotene-supplemented group (100 mg/day/calf); 95% CI, 95% confidence interval.
Table 2. Ingredients, chemical composition and nutrient levels of the basal diet (Dry matter basis).
Items 1Content/%Nutrient LevelsContent/%
Mature milk ingredients Nutrient levels
Milk fat3.67Metabolic Energy/(MJ/kg)13.42
Milk protein3.35Crude Protein22.98
Total solid12.93Total Digestible Nutrient82.11
Lactose4.52Neutral Detergent Fiber22.33
Starter feed ingredients Acid Detergent Fiber13.52
Corn50Crude Ash5.99
Soybean meal16Crude Fat3.48
Wheat bran6.5Calcium1.29
Rice bean8Total Phosphorus0.62
Cottonseed meal3
Sliced corn10
Molasses2
Premix 21
CaHPO41.5
NaCL0.5
Whey powder1.5
Total100
1 Metabolic energy and total digestible nutrient are calculated according to the NRC (2021), while the other nutrient levels are measured values [24]. 2 Each kilogram of premix (dry matter basis) contains: VA, 26,000 IU; VD, 8000 IU; VE, 500 IU; Cu, 10 mg; Zn, 30 mg; Fe, 11 mg; Mn, 30 mg; I, 1 mg; Co, 1.5 mg.
Table 3. Effects of parity, milk type, and low-temperature long-time pasteurization on concentrations of vitamin A, β-carotene, and B vitamins in bovine milk (μg/100 g) 1.
ItemsPrimiparous (n = 4)Multiparous (n = 4)SEMp-Value 2
ColostrumMature MilkColostrumMature Milk ParityMilk LTLTParity × MilkParity × LTLTMilk × LTLTParity × Milk × LTLT
BeforeAfterBeforeAfterBeforeAfterBeforeAfter
Vitamin A1236.7 a1220.0 a17.5 c16.1 c342.7 b304.0 b20.8 c18.2 c82.00<0.001<0.0010.800<0.0010.9210.8270.929
β-carotene35.38 a24.75 b<0.5<0.59.66 c8.46 c<0.5<0.51.86<0.001<0.0010.034<0.0010.0860.0340.086
Vitamin B157.9 a53.2 b13.4 d11.2 e52.7 a44.0 c21.1 f18.6 g1.490.878<0.001<0.001<0.0010.3060.0510.388
Vitamin B2570.2 a564.7 a103.5 c102.1 c370.3 b365.3 b96.2 c95.6 c70.430.049<0.0010.9500.0650.9950.9660.999
Vitamin B94.10 a3.95 a1.75 c1.61 c4.06 a4.02 a2.32 b2.27 b0.130.002<0.0010.3050.0030.5890.9840.940
Vitamin B120.310.240.490.360.500.360.360.380.080.3330.4140.1530.0650.6640.6200.335
For β-carotene, concentrations in mature milk were below the limit of detection (0.5 μg/100 g), and thus were not labeled with superscript letters. Within the same vitamin, values with different lowercase superscript letters differ significantly (p < 0.05). 1 The units of all indicators are μg/100 g. Heifers = primiparous cows (1st parity); Multiparous = cows at 2nd to 3rd parity; Colostrum = milk collected immediately after parturition; Mature milk = milk collected on d 5 postpartum; LTLT = low-temperature long-time pasteurization. Before and After refer to before and after LTLT, respectively. 2 p-value definitions: Parity = Primiparous and multiparous; Milk = Colostrum and mature milk; Treat = Before and after LTLT; Parity × Milk = two-way interaction between parity and milk type; Parity × Treat = two-way interaction between parity and LTLT; Milk × Treat = two-way interaction between milk type and LTLT; Parity × Milk × Treat = three-way interaction among parity, milk type, and LTLT.
Table 4. Growth performance and diarrhea-related outcomes of preweaning calves fed with β-carotene 1.
ItemsCONBCEffect Estimate (95% CI)p-Value
BW
Initial BW, kg36.9 ± 0.437.1 ± 0.4MD = 0.20 (−0.93 to 1.34)0.724
Day 56 BW, kg86.5 ± 0.787.8 ± 0.7MD = 1.27 (−0.60 to 3.13)0.180
ADG, g/d886.4 ± 9.8905.4 ± 8.9MD = 19.03 (−7.21 to 45.28)0.154
Diarrhea 1
Diarrhea incidence, n/N (%)53/64 (82.8)45/64 (70.3)RR = 0.85 (0.70 to 1.03)0.095
Diarrhea episodes per calf, n2.2 ± 0.21.7 ± 0.2HL = 0.00 (−1.00 to 0.00)0.181
Days with FS 0 per calf, n52.8 ± 0.053.7 ± 0.1HL = 1.00 (1.00 to 1.00)<0.001
Days with FS 1 per calf, n1.0 ± 0.10.8 ± 0.1HL = 0.00 (0.00 to 0.00)0.308
Days with FS 2 per calf, n0.9 ± 0.10.8 ± 0.1HL = 0.00 (0.00 to 0.00)0.615
Days with FS 3 per calf, n1.4 ± 0.20.9 ± 0.1HL = 0.00 (−1.00 to 0.00)0.046
CON, control group without β-carotene, addition; BC, β-carotene-supplemented group (100 mg/day/calf, n = 64 per group); BW = body weight; ADG = average daily gain; FS = fecal score. Values are presented as mean ± SEM; MD, mean difference; CI, confidence interval. Mean differences were calculated as BC minus CON; RR, risk ratio; The RR represents the risk of diarrhea in the BC group relative to that in the CON group. HL, Hodges–Lehmann location shift; HL estimates were calculated as BC minus CON, positive values indicate higher values in the BC group, whereas negative values indicate lower values in the BC group. p < 0.05, significant difference; 0.05 ≤ p < 0.10, statistical tendency. 1 Diarrhea determination criteria: FS ≥ 2.
Table 5. Alpha diversity indices of the fecal microbiota in preweaning calves fed with β-carotene 1.
ItemsTimesCONBCp-Value95% CIFixed Effects
GroupTimeGroup × Time
ACE
index
1 d283 ± 58.3356.4 ± 52.70.29−67.0 to 213.6F (1, 33.0) = 0.13, p = 0.719F (2, 37.3) = 158.12, p < 0.01F (2, 37.3) = 1.55, p = 0.225
28 d325.2 ± 32.0277.4 ± 32.00.05−96.1 to 0.4
56 d632.5 ± 32.5579.6 ± 32.50.04−103.3 to −2.5
Chao1
index
1 d277.9 ± 118.5352.6 ± 115.90.28−63.3 to 212.8F (1, 33.2) = 0.12, p = 0.73F (2, 37.5) = 159.52, p < 0.01F (2, 37.5) = 1.64, p = 0.207
28 d322.7 ± 108.4275.2 ± 108.40.05−95.6 to 0.4
56 d631.2 ± 108.6578.0 ± 108.60.04−103.8 to −2.5
Simpson
index
1 d0.655 ± 0.0360.787 ± 0.0320.010.0 to 0.2F (1, 31.4) = 3.43, p = 0.071F (2, 38.5) = 62.36, p < 0.01F (2, 38.5) = 5.52, p = 0.008
28 d0.929 ± 0.0110.913 ± 0.0110.280.0 to 0.0
56 d0.973 ± 0.0040.962 ± 0.0040.070.0 to 0.0
Shannon
index
1 d2.81 ± 0.453.92 ± 0.430.010.3 to 1.9F (1, 40.9) = 0.96, p = 0.332F (2, 38.1) = 178.81, p < 0.01F (2, 38.1) = 6.63, p = 0.003
28 d5.39 ± 0.375.10 ± 0.370.19−0.7 to 0.1
56 d6.90 ± 0.356.62 ± 0.350.04−0.6 to 0.0
Pielou1 d0.359 ± 0.0340.469 ± 0.0310.010.0 to 0.2F (1, 42.2) = 1.92, p = 0.173F (2, 38.6) = 155.21, p < 0.01F (2, 38.6) = 6.74, p = 0.003
28 d0.651 ± 0.0240.633 ± 0.0240.38−0.1 to 0.0
56 d0.745 ± 0.0210.724 ± 0.0210.080.0 to 0.0
Good’s coverage1 d0.9996 ± 0.0000.9995 ± 0.0000.440.0 to 0.0F (1, 32.5) = 0.40, p = 0.532F (2, 39.1) = 15.04, p < 0.01F (2, 39.1) = 1.42, p = 0.254
28 d0.9996 ± 0.0000.9997 ± 0.0000.110.0 to 0.0
56 d0.9994 ± 0.0000.9995 ± 0.0000.020.0 to 0.0
The p-value in the table refer to pairwise comparisons between CON and BC groups at each time point. Fixed effects of Group, Time, and their interaction (Group × Time) were assessed using a linear mixed-effects model, with individual calf included as a random effect. F-statistics and corresponding p-value for each fixed effect are presented. p < 0.05, significant difference; 0.05 ≤ p < 0.10, statistical tendency. 1 CON, control group without β-carotene, addition; BC, β-carotene-supplemented group (100 mg/day/calf). At 1 d, some samples were excluded due to sterile feces, resulting in n = 13 (CON) and n = 17 (BC); n = 24 per group at 28 and 56 d.
Disclaimer/Publisher’s Note: The statements, opinions and data contained in all publications are solely those of the individual author(s) and contributor(s) and not of MDPI and/or the editor(s). MDPI and/or the editor(s) disclaim responsibility for any injury to people or property resulting from any ideas, methods, instructions or products referred to in the content.